Article

Joint and Lineament Patterns across the Midcontinent Indicate Repeated Reactivation of Basement-Involved Faults

by
Caroline M. Burberry
1,*,
Jerlyn L. Swiatlowski
1,2,
Mindi L. Searls
1 and
Irina Filina
1
1
Department of Earth and Atmospheric Sciences, University of Nebraska-Lincoln, 1400 R St, Lincoln, NE 68588, USA
2
Department of Earth Sciences, University of California, Riverside, 900 University Ave, Riverside, CA 92521, USA
*
Author to whom correspondence should be addressed.
Geosciences 2018, 8(6), 215; https://doi.org/10.3390/geosciences8060215
Submission received: 7 April 2018 / Revised: 30 May 2018 / Accepted: 4 June 2018 / Published: 13 June 2018
(This article belongs to the Special Issue Tectonics and Morphodynamics)

Abstract

:
Joint networks hosted in successively younger rocks, developing as a result of forced (trishear) folding of a rock mass above a deep-seated fault, can be used to infer the reactivation history of that deep-seated fault. This study aims to use joint networks in Pennsylvanian, Permian and Cretaceous rocks to document evidence of reactivation on basement faults during the Paleozoic and Mesozoic of Nebraska and Kansas. The most prominent basement features in southeast Nebraska and northeast Kansas are oriented NE-SW, likely related to the Midcontinent Rift System and Nemaha Uplift, and oriented NW-SE, likely related to fabrics from the Central Plains Orogeny. These features are well defined in the potential fields data. Joint patterns in the study area show an E-W oriented trend, as well as clearly discernable NE-SW and subsidiary N-S and NW-SE trends. The E-W trend is interpreted to be related to far-field stresses from Laramide and Ancestral Rocky Mountain orogenic events, whilst the NE-SW trend is interpreted to be related to subtle reactivation on the Mid-continent rift and related faults, observed in basement data. These movements produced stresses of sufficient magnitude to produce joints in the post-rift rock units, but not sufficient to generate shear fractures. Similarly, the ~N-S and NW-SE joint trends are taken as evidence of subtle reactivation on the Nemaha Uplift and Central Plains Orogeny systems, generating joints by the formation of forced folds. This contribution therefore provides a convincing case study of the value of coupled potential fields and surface feature studies in discerning buried tectonic trends and subtle reactivation thereon.

1. Introduction

In many landscapes, surface evidence of deformation can provide a tantalizing glimpse of the structures beneath the surface. For example, [1] used the surface geometries and shapes of folds to infer the presence of master blind thrust faults at depth. [2] used geomorphological domains in addition to subsurface datasets to infer the geodynamic evolution of the Southern Apennines. Similarly, [3] described the influence of the reactivation of basement faults on the structures of SE England.
These three diverse studies highlight the importance of surface observations and the tectonic inheritance concept in subsurface geology. In this paper, we use the shape of the land surface, as gleaned from satellite data and field-derived joint patterns, to understand the reactivation history of basement-involved faults in SE Nebraska and NE Kansas.
The concept of tectonic inheritance—which states that the pre-existing structures and zones of weakness in a system govern the development of subsequent structures—is frequently used to explain large-scale variations in the geometry of orogenic belts, or the locations of rift margins in supercontinent cycles [4,5,6,7]. The effect of basement geometry on the development of an orogenic arc has been demonstrated by [8] using analog models. Large-scale finite-element modeling also demonstrates that a pre-existing structural system can exert significant control on subsequent deformation styles [7]. Studies of specific structures (e.g., [9,10,11,12,13]) indicate that subsequent structures, facies changes, and economic deposits may be affected by the motion of the pre-existing fault or faults.
Failed rifts and ancient suture zones can provide weak zones suitable for reactivation in successive deformation events. The amount and type of reactivated movement occurring on any given fault is primarily a function of the stress ratio on the fault, the coefficient of friction of the rock (that is, the slip tendency), and the dip of the weak plane within the rock mass [14,15,16]. Additional influencing factors are the strength of the fault itself, the obliquity between the fault orientations and imposed maximum stress direction and the pressure and temperature of the deforming system [17,18,19,20]. Under imposed compression, as is the case for the present study area, initially normal faults may be reactivated as strike–slip or as reverse/thrust faults in subsequent deformation if the conditions are correct, that is, the incident stress is within a suitable oblique angle relative to the original fault [14,21]. Major faults reactivated in compression have a mix of effects, such as compartmentalizing the overlying thrust belt structure, nucleating overlying folds, as well as affecting the basement geometry [22]. Faults may be reactivated numerous times if the region is affected by multiple phases of deformation, assuming that the above conditions are met in each phase. The effect of an imposed stress on a pre-existing weakness in a specific area can be tested using analog models, where the initial conditions can be chosen and scaled to represent a real-world scenario [23]. This methodology has been applied successfully to regions including the Italian Alps and the Zagros Belt [24,25]. Numerical analyses such as the slip tendency analysis of [16] and [26] are also invaluable in demonstrating that under the right combination of stress ratio and fault strength, normal faults may reactivate as high-angle reverse faults.
This study aims to demonstrate that basement structures have been reactivated and have generated secondary joints in a thick sequence of cover rocks. The study area chosen is the southeastern section of Nebraska and the adjacent northwestern region of Kansas (Figure 1). This area was chosen because there are undisputed faults within the basement, namely the southern extent of the Mid-continent Rift System and the northern extent of the Nemaha uplift, as well as the availability of potential fields, and remote sensing data. These faults are known to have been reactivated in the Pennsylvanian and Permian (e.g., [27] and references therein). Through a comparison of lineaments derived from potential fields processing and analysis, remotely sensed lineaments and surface joint patterns, we demonstrate that reactivation of basement faults is able to explain the distribution of surface lineaments (that is, probable faults and joints) in the study area. Previous studies have documented joint patterns across parts of the present study area (e.g., [28,29]) and noted the relationship of the surface lineaments to presumed basement features (e.g., [30,31,32]). Although providing valuable data, these previous studies cover only a small portion of the present focus area, and lack the understanding of modern rock mechanics in explaining their findings (e.g., [28,33]). This study serves to emphasize the influence of basement feature reactivation on surface geomorphology in the framework of modern rock mechanics, and conversely, the importance of surface features in deciphering the history of a region.

2. Geologic Setting

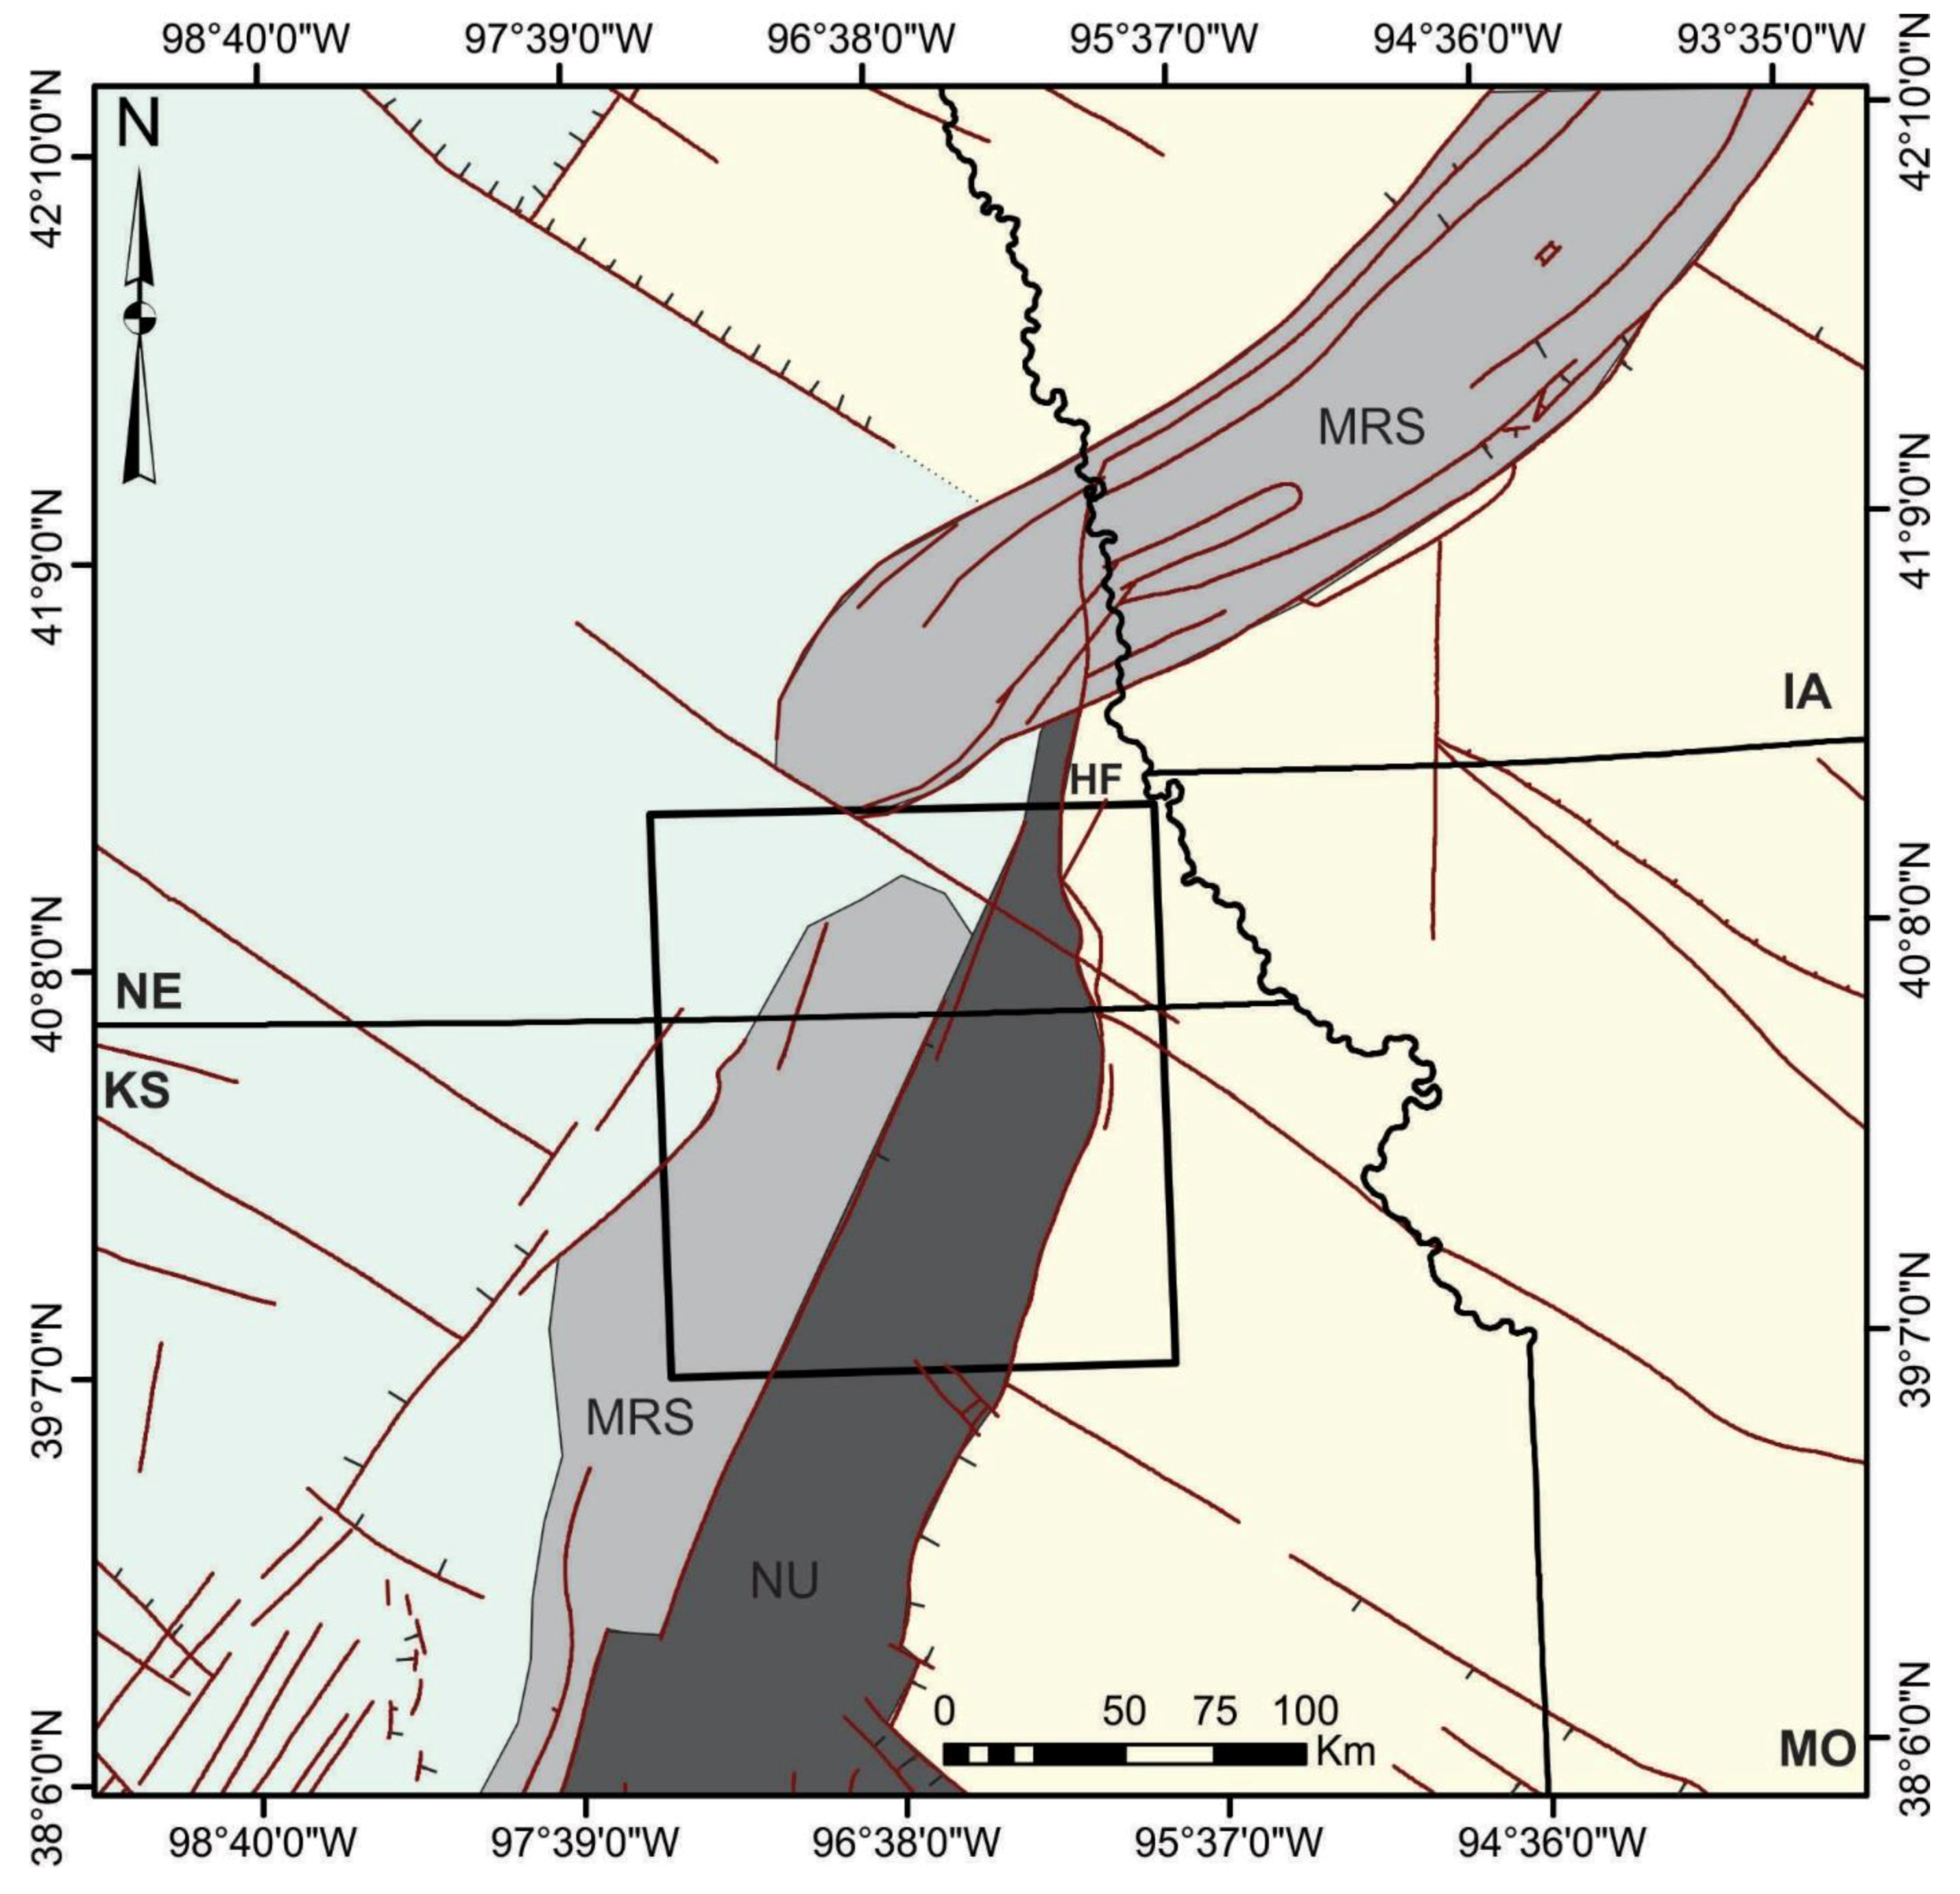
The earliest crust in southeast Nebraska and northern Kansas is considered to date from the Central Plains Orogeny (Figure 2) around 1.9–1.7 Ga [35]. In the area of interest, the upper crust is composed of quartzite with granite intrusions (e.g., [36,37]. The study area is dissected by two major structures, the NE-SW trending, 1.1 Ga Mid-Continent Rift System and the NNE-SSW trending 300 Ma Nemaha Uplift, as can be seen on contour maps of the top-Precambrian unconformity (e.g., [36,38]) and Figure 2. The Mid-Continent Rift System is considered an aulacogen, and has a counterpart failed rift arm to the east. The Nebraska segment of the Mid-Continent Rift System parallels fabrics within the earlier Central Plains Orogen [35]. In the southern part of the study area, within eastern Kansas, the Mid-Continent Rift System is cut by a series of NW-SE trending dextral strike-slip faults, on which there have been historical earthquakes [39,40]. These faults appear to form an accommodation zone between the Nebraskan and Kansan segments of the Mid-Continent Rift System (Figure 2) and may be related to the boundary of the Central Plains Province or the suture between this province and the Penokean province which is located to the southeast of the Mid-Continent Rift System [35,41,42]. The structures are also aligned along the same trend as the Missouri Gravity Low which underlies the accommodation zone as well as additional NW-SE trending lineaments interpreted from gravity and magnetic data [43]. More detailed maps correlate specific trends to accretion of numerous terranes during the Central Plains Orogeny [44,45].
The effects of local tectonics during the Infracambrian and the Paleozoic are observed from stratigraphic relationships, thickness changes, and multiple unconformities within the Cambrian-Permian succession, particularly in the present study area (Figure 3; [27,37,41,47]). The Cambrian-Devonian succession is chiefly composed of dolomite, with some clastic units; these clastic materials may indicate periods of land exposure and influx of eroded material to an area otherwise covered by a shallow sea [36,48]. After exposure, extensive Mississippian carbonate rocks were deposited in a shallow sea, across large swathes of the midcontinent [49]. The boundary between the Mississippian and the Pennsylvanian rocks is marked by a regional unconformity, showing widespread uplift of the region in the late Mississippian and early Pennsylvanian (Figure 4; e.g., [48]).
Inversion via compression of Mid-Continent Rift System structures is documented from calcite strain analysis in the Lake Superior Region, ranging in age from Grenvillian-age transpressive strain to Permian age contraction [50]. Reference [51] also documents Grenville-age inversion on the Mid-Continent Rift System, and cross-sections after [52] and [36] show significant deformation in the Cambrian-Mississippian section, overlain by a base Pennsylvanian unconformity. A major tectonic event, making the proto-Nemaha Uplift emergent, is documented in the Ordovician [37,53,54]. The Kansas segment of the Mid-Continent Rift System may have been reactivated in the latter part of the Paleozoic, forming the Abilene, Voshell, Barneston, and Nemaha anticlines along the eastern edge of the Mid-Continent Rift System [35,55]. Rift segments are also considered to be reactivated in the formation of the Union fault and related faults of the study area [27,41]. Many workers (e.g., [39,56]) consider the Nemaha Uplift to be a reactivated fault that originated as part of the Mid-Continent Rift System, affected by the segmented nature of the rift and the difference in rift orientation between Nebraska and Kansas [41]. The Nemaha Uplift is imaged by a COCORP line as a 40 km wide uplift, bounded to the east by the near-vertical Humboldt Fault (Figure 4; [57,58,59]). The Humboldt fault is thought to be a multiply reactivated structure originally related to the Mid-Continent Rift System, and sparse modern earthquake focal mechanisms show a transpressive sense of motion [59,60].
The predominant bedrock in the study area is of Pennsylvanian and Permian age. The Pennsylvanian strata are represented by the mixed clastic and shallow-water carbonate facies of the Desmoinesian, Missourian, and Virgilian series (Figure 3; [61]). The Missourian Series unconformably overlies the Desmoinesian Series, with the upper parts of the Desmoinesian Series truncated in the study area [38]. The Missourian Series is conformably overlain by the Virgilian Series. The Virgilian Series of the Upper Pennsylvanian (Figure 3) is the oldest material that crops out in the study area (Figure 1; [62]). The Virgilian series is characterized by 11 of the short, intense highstand interglacials [61] that make up the Middle and Upper Pennsylvanian. Each of these cyclothems consists of a black-gray shale unit, overlain by a marine limestone consisting of regressive then shoaling upwards facies, overlain by paleosol [61]. Despite the regular presence of shale members in the cyclothems, the net shale is sufficiently low that the shale layers did not act as detachment units during Ancestral Rocky Mountain shortening [36,38]. Both the Wolfcampian and Leonardian Series of the Lower Permian crop out in the study area (Figure 1). The base of the Wolfcampian series is represented by a large amount of argillaceous shale [38]. The Wolfcampian series continues the cyclothem succession from the Upper Pennsylvanian [63] and indicates that the Midcontinent Sea [61] still covered the area. The Leonardian Series unconformably overlies the Wolfcampian Series and truncates members of the Wolfcampian series to the northwest [38]. The Leonardian Series is made up from dominantly clastic units, including thin anhydrite layers [36,38,64]. This study measures sites from the carbonate units of the Wolfcampian cyclothems, and does not measure the clastic series.
Thickness changes in the Pennsylvanian and Permian sediments around the Nemaha Uplift (Figure 4; e.g., [27]) indicate tectonic activity (reactivation as reverse faults) during this period, probably as a result of the Ancestral Rocky Mountain orogeny [59,65,66]. This orogeny is a result of the combined stresses on the intraplate region from the contemporaneous Antler orogeny to the west, transpression to the southwest, and the Ouachita-Marathon orogeny (i.e., the docking of Gondwana) to the southeast [67]. In support of the reactivation on the Nemaha Uplift during the Pennsylvanian-Permian, [68] and [69] documented a series of earthquake proxy locations, including intraformational faulting and contorted bedding in the Pennsylvanian and Permian section.
No Triassic or Jurassic age rocks were recorded in the study area (Figure 1 and Figure 4). Following exposure during the Triassic and Jurassic, and the generation of an angular unconformity [38], the region formed part of the shoreline of the Cretaceous Western Interior Seaway during the Late Cretaceous. This period is marked by the deposition of the Dakota Group [36,38]. The Dakota Group includes alternating reddish, clay-rich paleosols and clean, cross-bedded sandstone units, some of which were measured at sites NF 1, NF 2, and KF 1. Overlying the Dakota group is the Graneros Shale and the Greenhorn Formation, representing periods of incursion of the Seaway and deposition of shales, followed by the thinly-bedded carbonate and shale layers of the Greenhorn Formation [38]. The Greenhorn Formation is measured at location KF 2 and is the youngest Formation measured in this study.
After the Ancestral Rocky Mountain orogeny-related reactivation pulses, the Nemaha Uplift may have been uplifted for a final time during the Laramide orogeny, based on the deformed nature of the base-Cretaceous unconformity over the Nemaha Uplift [27]. The Laramide stress field (WSW-ENE, [70]) is favorably oriented for transpressional or compressional movement with respect to many basement structures in the midcontinent [71,72].
Despite the fact that the region has been considered tectonically quiescent since the end of the Eocene [73] historic earthquakes have occurred in the study area, notably related to the southern boundary of the MRS and the eastern boundary of the Nemaha Uplift [72], indicating that stress directions are still favorable for fault reactivation. A catalog of earthquake epicenters in the region shows clusters of events along the Humboldt Fault and other basement faults within the study area [74].
Figure 3 indicates that there is no thick ductile unit in the study area, as although there is approximately 50% shale in the Pennsylvanian and Permian units, none of these layers are more than a few tens of meters thick (for a more detailed stratigraphy, refer to [36,38]. Despite the units labeled as “interbedded x and shale”, the shale horizons have not acted as major decollement surfaces. The only documented fault activity is intraformational faulting [28,68] and the present authors do not describe large-scale detachment-style behavior. Thus, it is reasonable to assume (a) that the Paleozoic sedimentary succession is behaving as a coherent unit (a rigid beam) and (b) that reactivation on deep-seated faults could have influenced the deformation of the entire rigid beam.

3. Methods

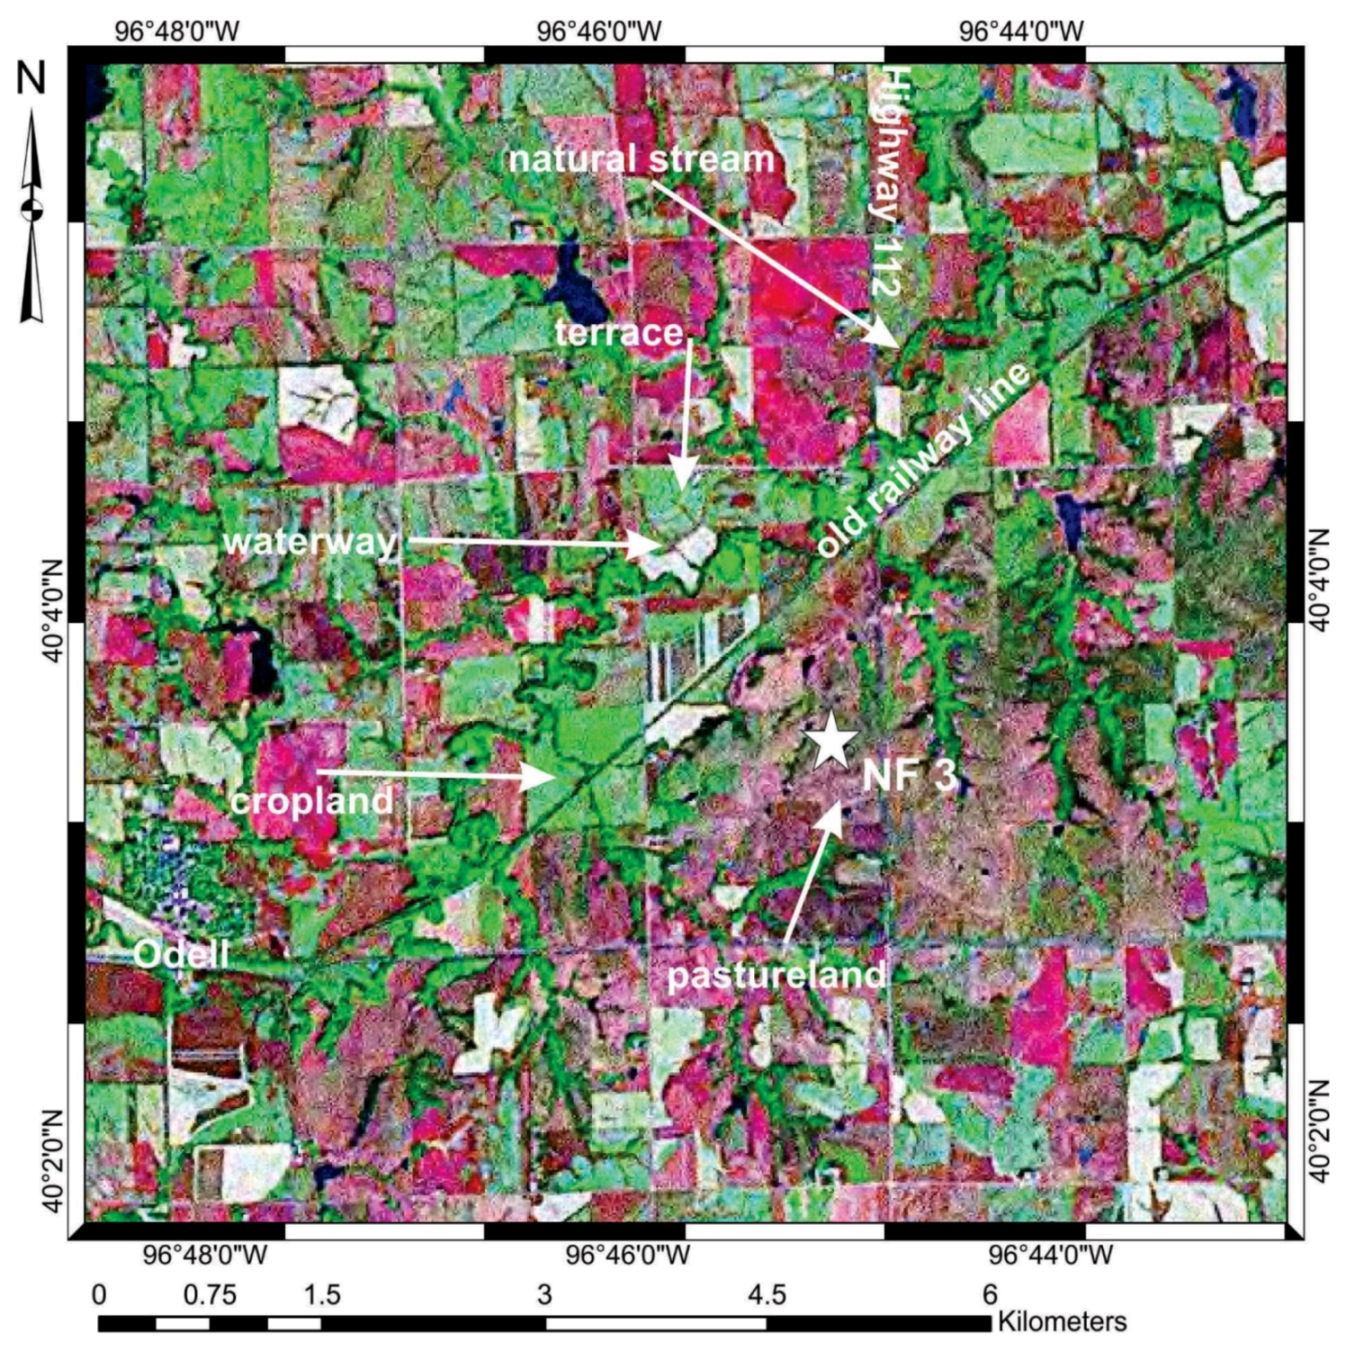
The first phase of this study was carried out using a combination of remote sensing and field data collection. The remote dataset used was a series of Landsat Thematic Mapper images, obtained from NASA and processed under the MrSID algorithm developed and patented by LizardTech [75]. This algorithm combines Band 7 (mid-infrared light) as red, Band 4 (near-infrared light) as green, and Band 2 (visible green light) as blue and applies proprietary compression and encoding technology. This produces a false color image in which bare rock surfaces are colored in shades of pink and brown (clastic units are darker than carbonate units) and vegetation appears in shades of green. Water typically appears dark blue-black (Figure 5). These images have a ground resolution of 28.5 m. Given that the study area is heavily vegetated, anomalies in the drainage network and variations in the vegetation patterns were used to interpret surface lineaments. Care was taken to avoid man-made irrigation systems (locally referred to as “waterways” by soil conservation personnel) and vegetation changes related to crop patterns; typically distinguishable from natural variation by scale and geometry. Man-made irrigation systems are generally smoothly curving, continuous with, or at right angles to, the pattern of terraces in the field, and confined to individual fields or sections. Vegetation changes related to crop patterns are typically oriented N-S or E-W in the study area and are typically perfectly straight lines. In contrast, natural drainage systems display patterns of tributaries, run for long distances and are related in some fashion to the underlying geology. Unexpected drainage geometries, such as straight segments with no evidence of man-made alteration, or sharp bends in a system were marked and used to guide the interpretation of lineaments.
Joint data was collected at thirteen field sites, seven in SE Nebraska and six in NE Kansas, forming two transects across the study area. Transect 1 is made up from sites NF 1-NF 7 and is oriented E-W. Transect 2 is made up from sites KF 1-KF 6 and is oriented NE-SW. These data were collected in part because of limited outcrop availability and in part to have transects running broadly perpendicular to the anticipated trends of the main basement features. Bedding orientation data as well as joint strike and dip was measured at each location. Outcrops were frequently road cuts, thus some bias is introduced into the data by the orientation of the road cut—for example, on an E-W oriented road cut, any joints oriented E-W will be under-represented. This cannot be avoided, but was carefully noted for use in analysis. At each site, 25 joint orientations were measured, moving in a scanline fashion across the outcrop. We concentrated on measurement of systematic joints, and mode of fracturing was noted for each measurement. We also looked for evidence of joint fill, abutting relationships, or cross-cutting relationships. Care was taken to avoid radial joints caused by dynamiting the outcrop in the road-construction process.
To gain a sense on the orientation of basement structures, we mapped lineaments using spatial analysis of gravity and magnetic grids [76,77]. The magnetic anomaly grid was extracted from the North American Magnetic Anomaly Map database, comprising a compilation from numerous vintage airborne surveys that were leveled to a consistent elevation of 305 m above the terrain. In our study area, the flight line spacing varied from 0.5–8 km [76]. The total magnetic intensity data were reduced to magnetic pole in order to remove the skewness of magnetic signals due to nonverticality of the ambient field (inclination of 69.65°, a declination of 9.46°).
The gravity anomaly grid from [77] was used for the study. This dataset compiles the numerous land gravity measurements by the US Geological Survey, corrected for the rocks above sea level with an assumed density of 2.67 g/cc (Bouguer gravity anomaly). In order to remove the long-wavelength crustal signal from the gravity data, we generated the regional trend via upward continuation of the observed gravity grid to a 100 km elevation. By removing this regional trend from the observed Bouguer gravity, we obtained the map of the residual Bouguer gravity anomalies, which represent the gravitational signal due to lateral density distribution in the subsurface rocks.
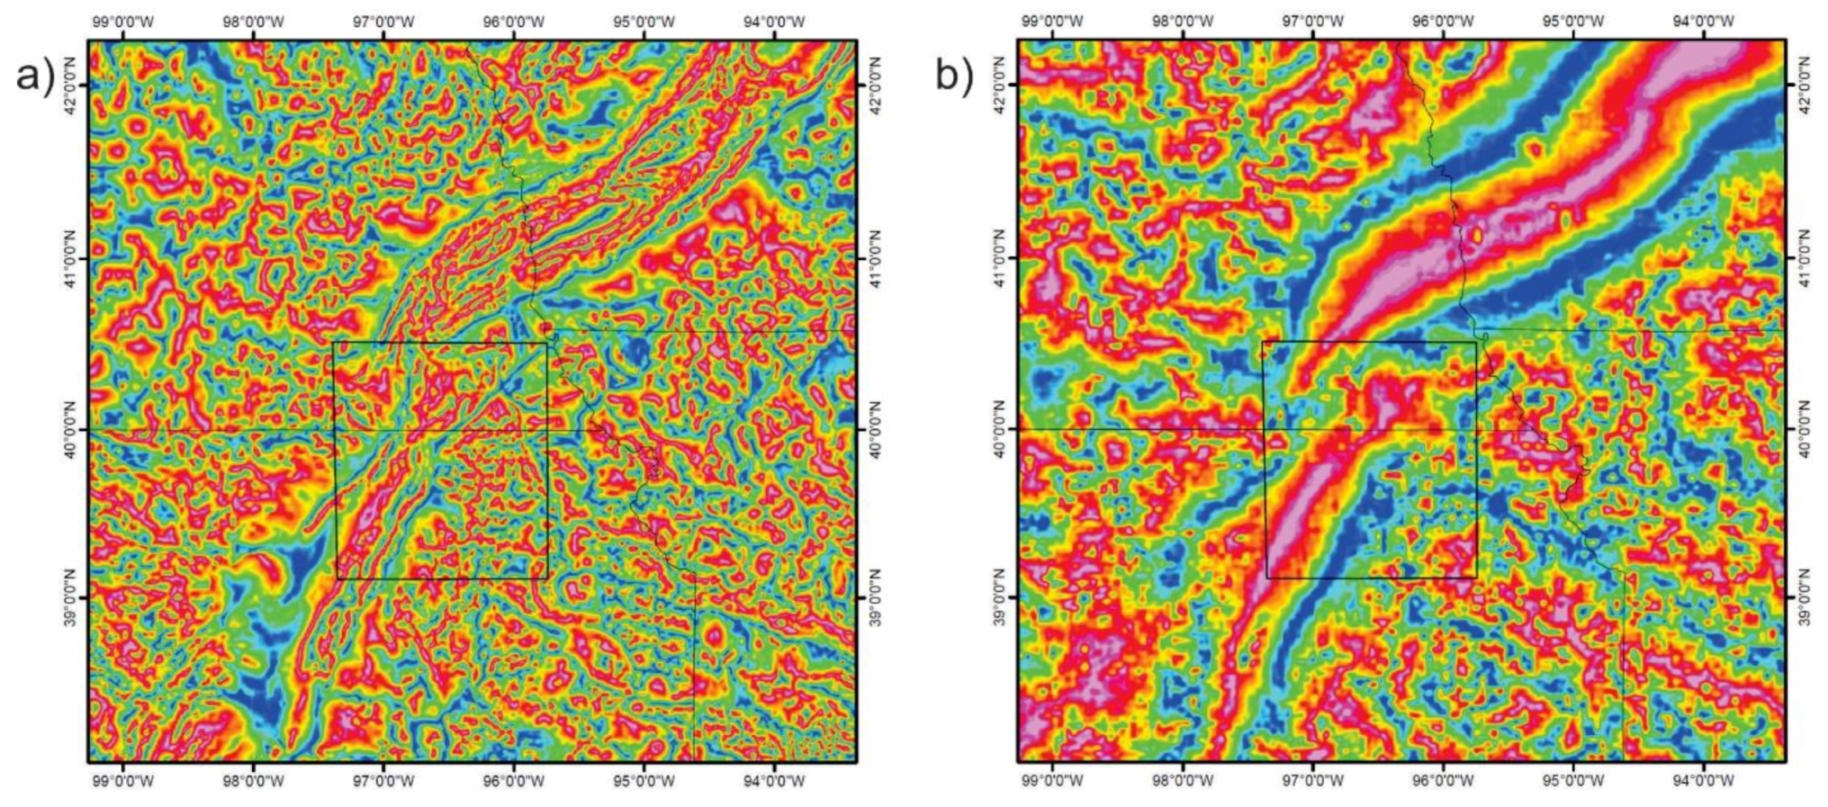
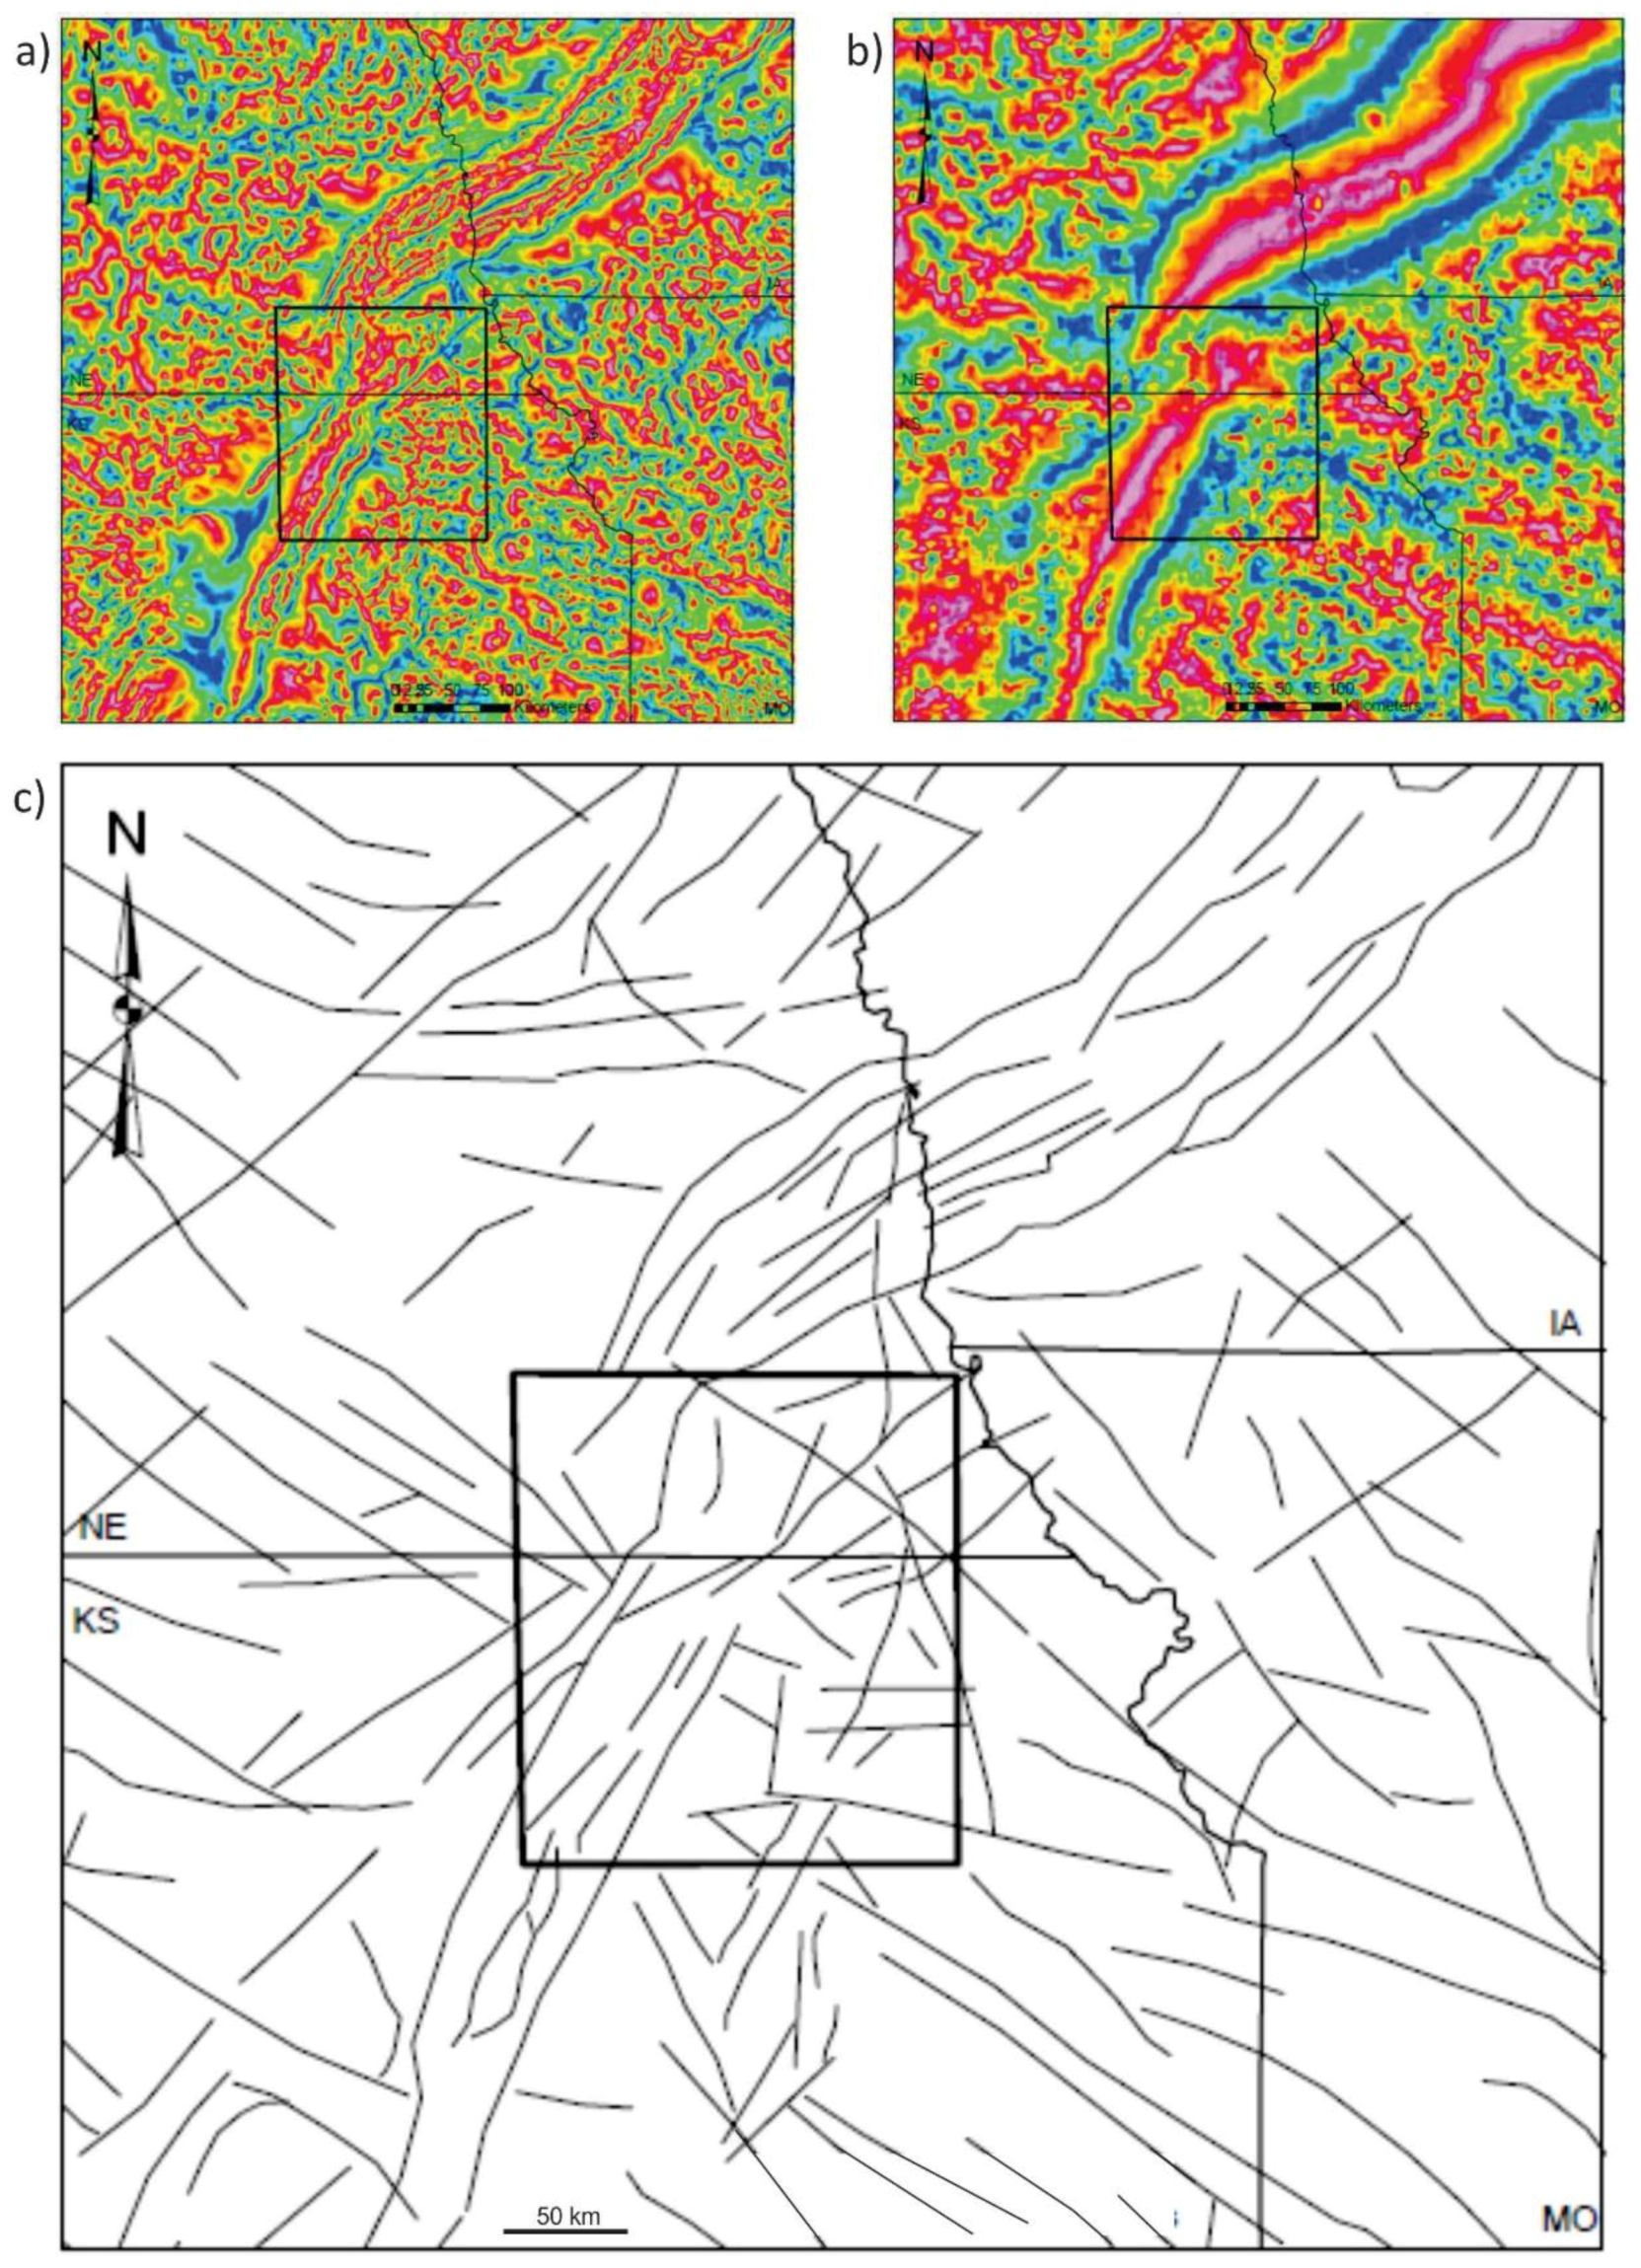
To further highlight the subsurface structures, we applied tilt derivative filters [78] to both the reduced to pole magnetic map and the residual Bouguer gravity grid. This procedure highlights the zones of the subtle changes in the potential fields in both vertical and horizontal directions. In gravity, an additional 5-km wide low-pass filter was necessary in order to remove some original gridding artifacts. The resultant filtered gravity and magnetic fields (Figure 6a,b) show multiple lineaments associated with subsurface structures. The joint interpretation of the lineaments in both potential fields resulted in a map of potential faults in the basement rock.

4. Results: Surface Lineament/Joint Data

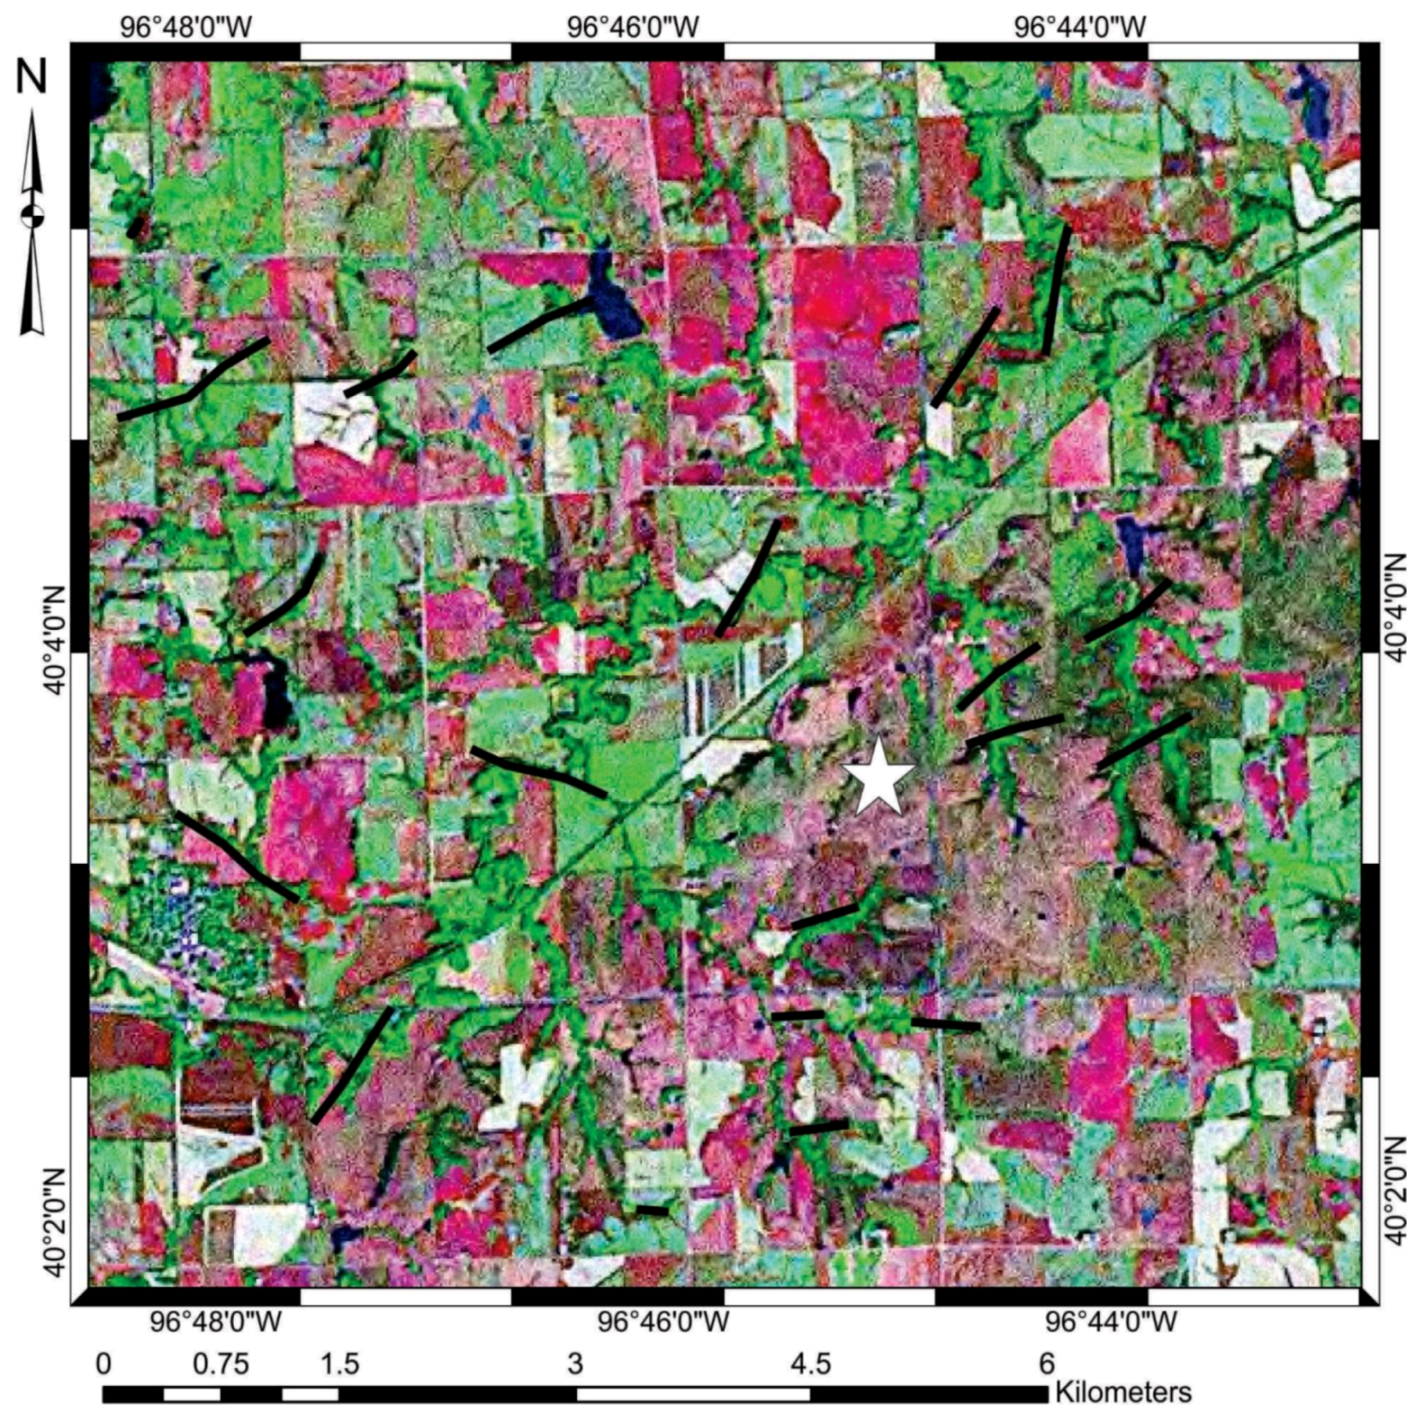
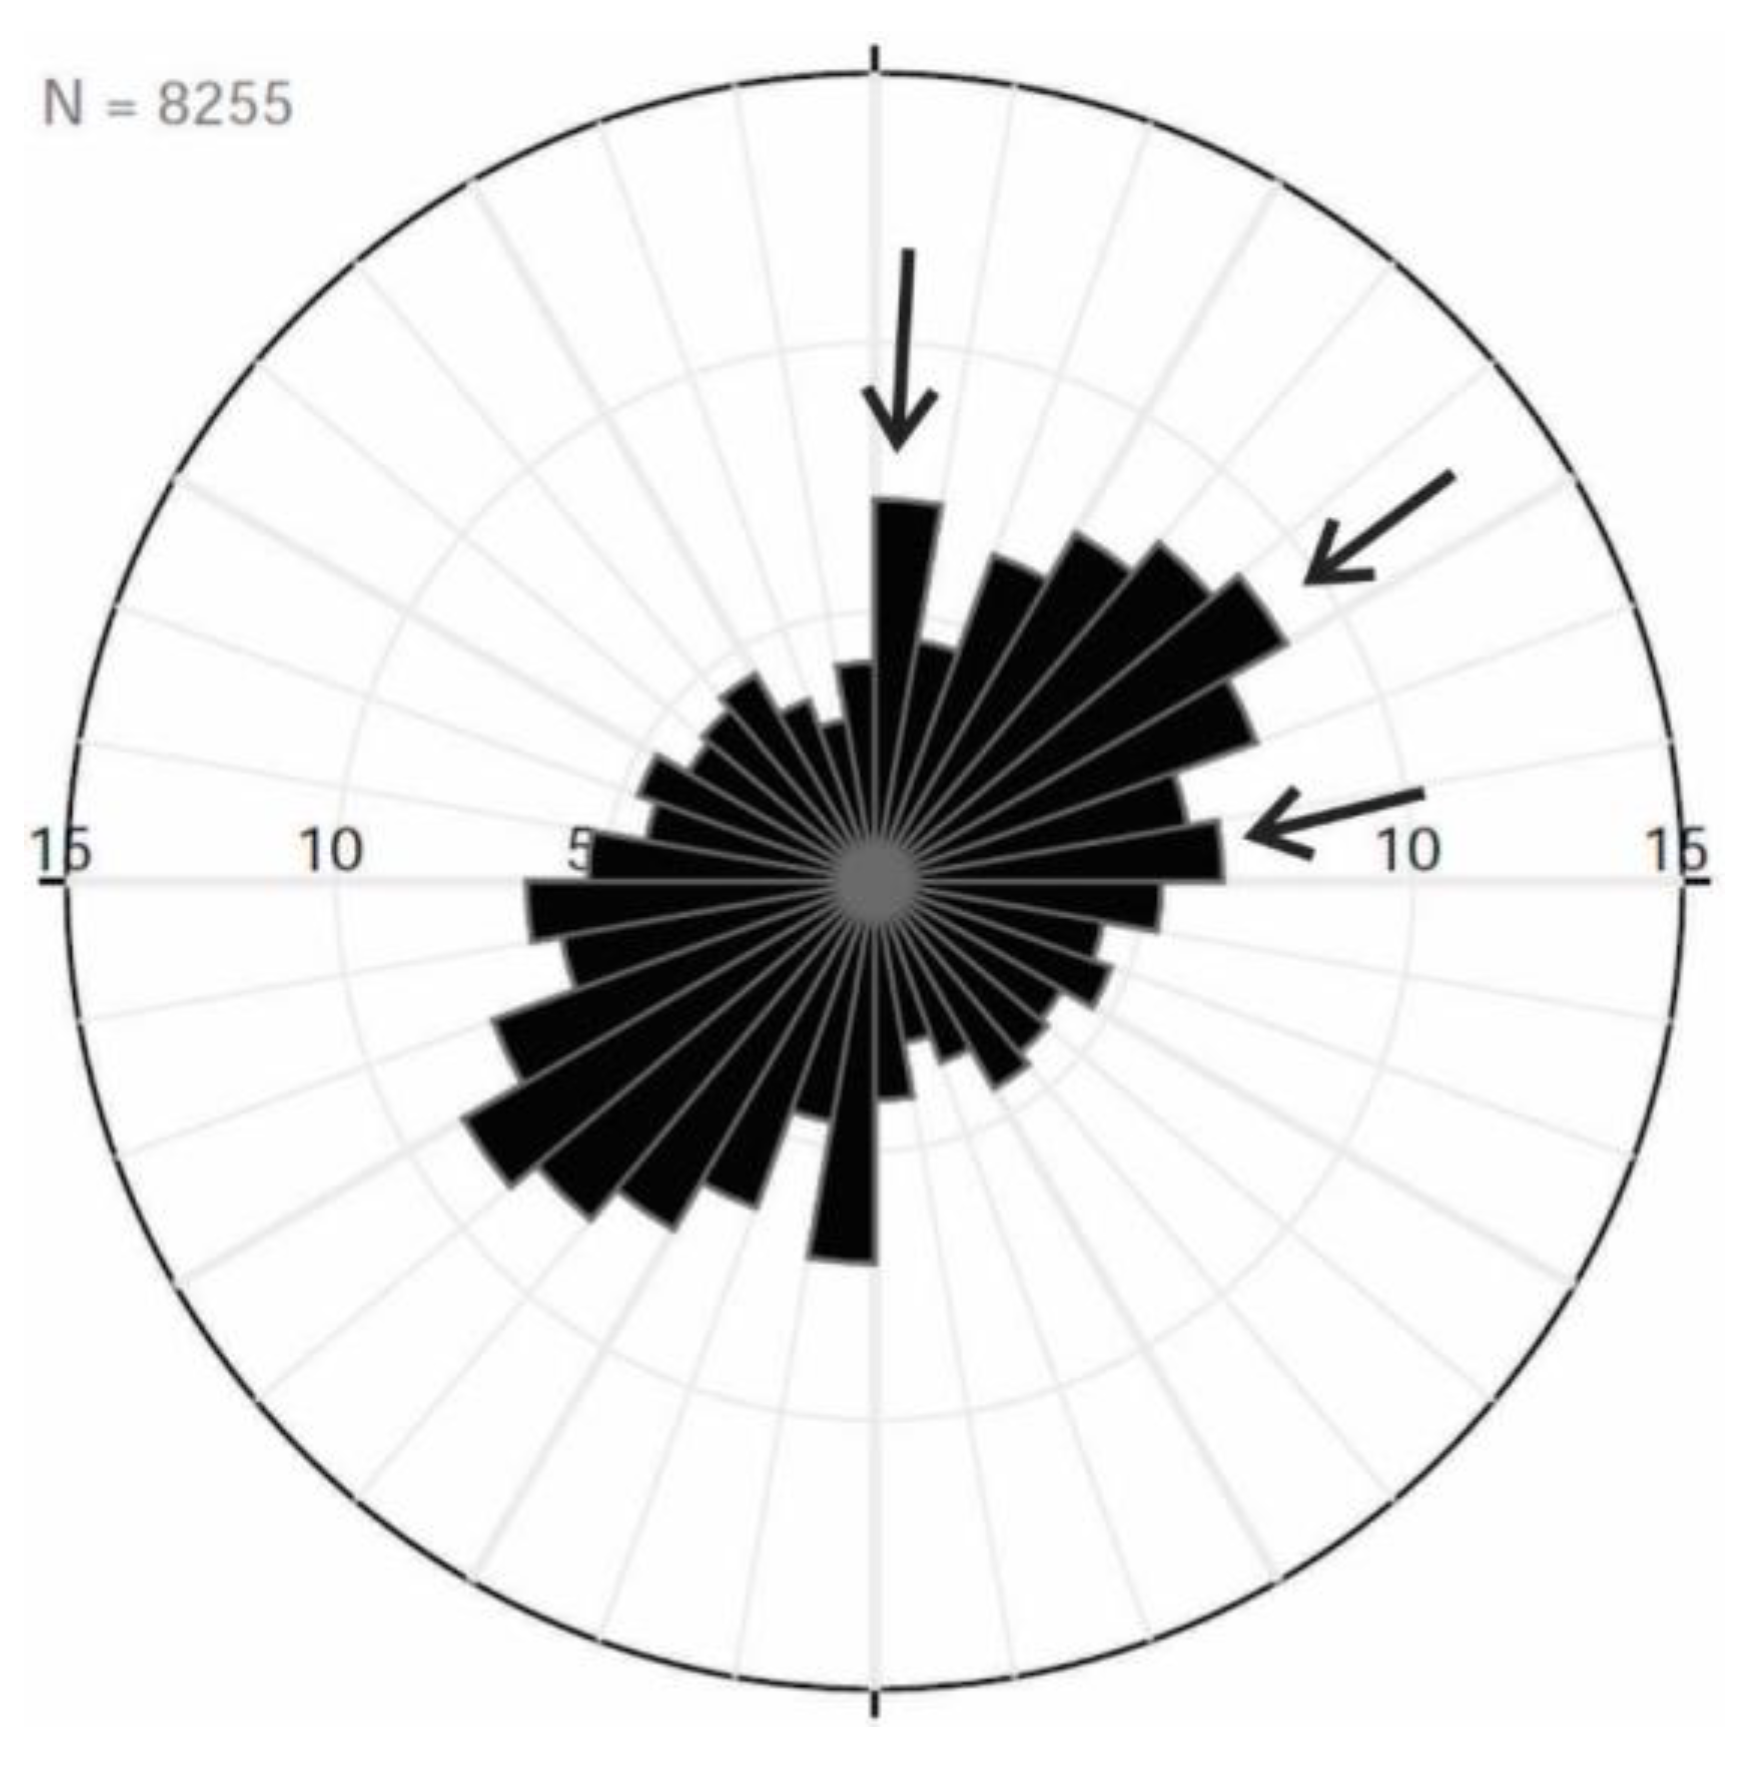
8255 surface lineaments were mapped in the study area using Landsat images as described above, and the orientation of each lineament was calculated as a bearing. Only a subset of the main area is shown for ease of viewing (Figure 7). Lineaments visible in Figure 6 are predominantly oriented NE-SW. In all subsequent discussion, the prominent strike directions of the joints are reported as a 3-figure bearing, implicitly measured clockwise from N. When all lineaments from the study area are displayed on a rose diagram (Figure 8), three prominent orientations can be noted (arrowed in Figure 8)—striking 005, 055, and 085. About 8% of the data follows the 055 orientation, forming the most significant orientation in the study area. Secondary peaks at 115 and 145 can also be noted in Figure 8 (not arrowed) although these orientations are only just above the apparent background or uniform distribution.
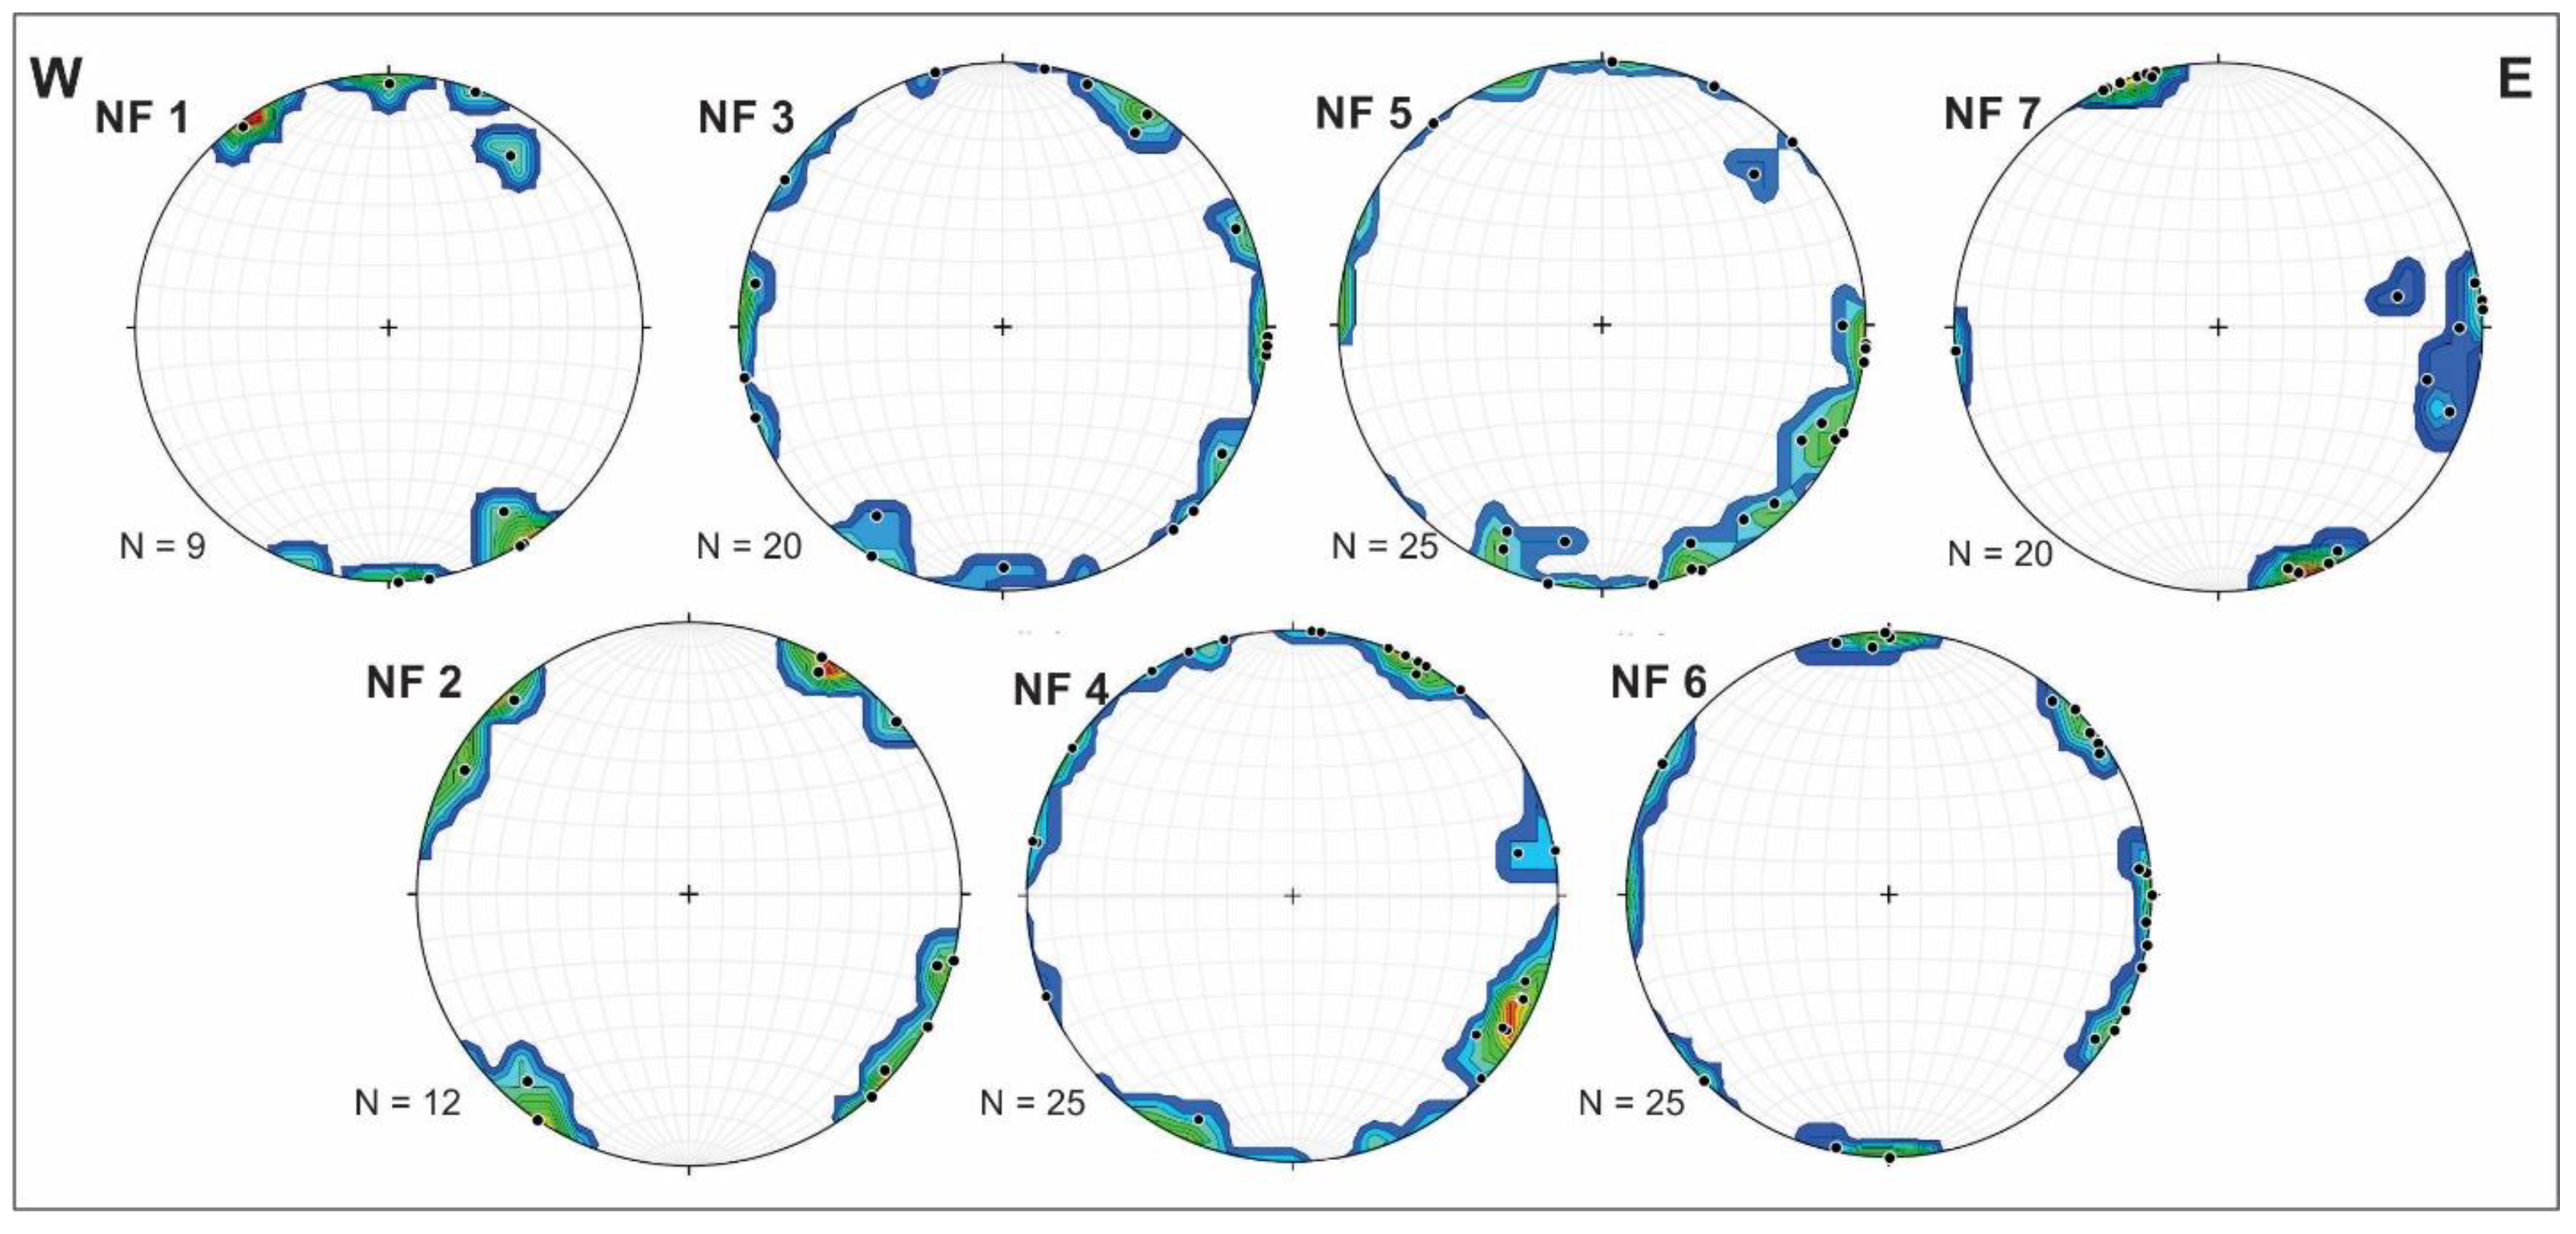
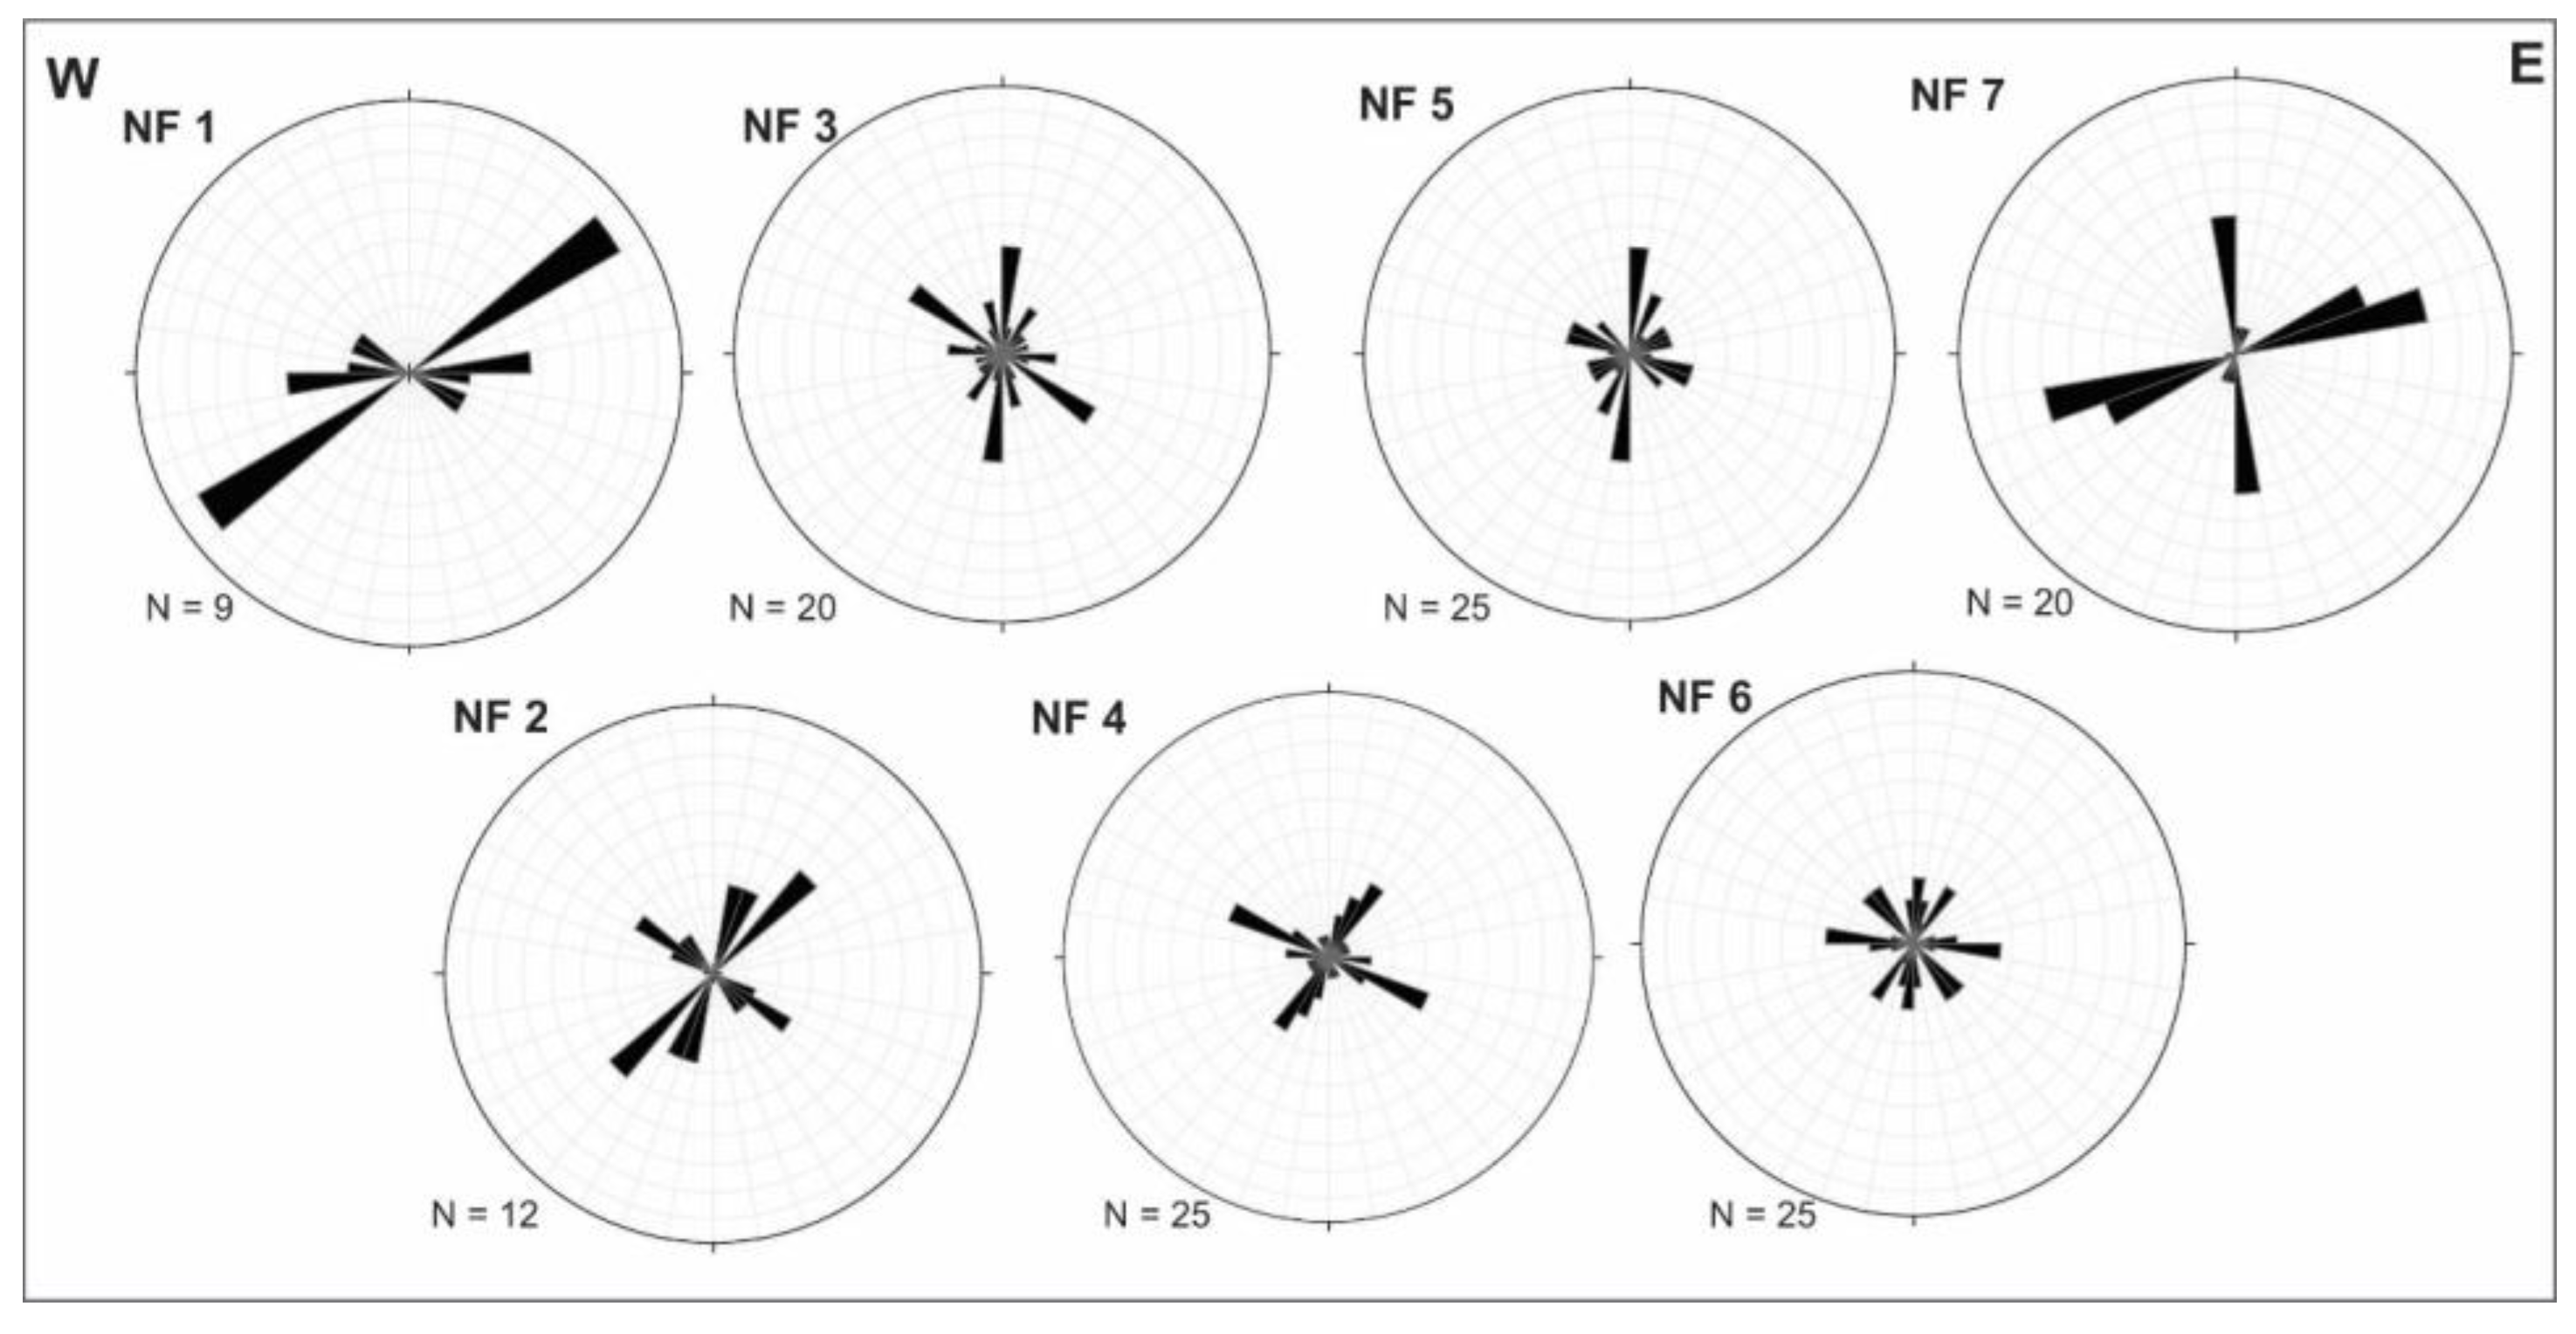
Figure 9, Figure 10, Figure 11 and Figure 12 illustrate the data collected at each field site, after minor rotations were made to the dataset due to bedding dip. Figure 9 shows pole figures from the E-W oriented transect, NF 1-NF 7 and Figure 10 show rose diagrams for the same data. Site NF 1 is in the Dakota Formation, at a highly weathered outcrop including numerous iron concretions south of Fairbury, NE. The sandstone at this outcrop is friable, but has jointed cleanly with a joint spacing of about 1 m. There are three main joint orientations, 057, 088, and 110, shown clearly by the clusters on the pole figure. No abutting relationships were discernable at this outcrop and bedding is subhorizontal. Site NF2 is a blocky, systematically jointed outcrop of the Dakota Sandstone, south of NF 1. Bedding is again subhorizontal. There are two prominent clusters on the pole figure, one of which can be separated into three orientations. These four orientations are 016, 040, 053, and 125. No abutting relationships were discernable at this outcrop. NF 3 is a subhorizontal outcrop of the Permian Wolfcampian series at a waterfall on private land. A thin, jointed limestone layer overlies a reddish shale unit. The pole figure appears to be a combination of both of the previous two, with joint orientations prominently at 002, 031, 047, 090, and 122. No abutting relationships were discernable at this outcrop. NF 4 is a thinly bedded, highly jointed, subhorizontally bedded outcrop with chert nodules, along Plum Road between Liberty, NE and Wymore, NE. The units come from the Permian Wolfcampian Series (Figure 1). Prominent joint orientations in this outcrop are at 029, 072, and 117. No abutting relationships were discernable at this outcrop. Site NF 5 is in the Virgilian Series of the Upper Pennsylvanian (Figure 1 and Figure 3). The outcrop is a road cut along Highway 4, west of Table Rock, NE. A 1.5 ft thick, horizontal layer of fossiliferous limestone is present, overlying thinly bedded limestone and shale. Bedding planes contain fossil hash, including spiriferids, other brachiopods, fenestrate bryozoan fragments, and crinoid ossicles. Prominent joint orientations are 004, 026, 049, 068, 096, and 115. No abutting relationships were discernable at this outcrop. Site NF 6 is in the Virgilian Series of the Upper Pennsylvanian (Figure 1 and Figure 3). The outcrop consists of a ridge of black shale overlain by a blocky recrystallized, subhorizontal limestone containing crinoid fragments, thereby placing the outcrop close to the highstand of one of the Upper Pennsylvanian cyclothems. The outcrop is a quarry face within a succession of limestone and shale that is 18 ft thick and forms part of a fault scarp (Andy Keller, Martin Marietta Plant Manager, pers. comm.). No abutting relationships were discernable at this outcrop. The prominent joint orientations are 034, 090, 105, 135, and 173. Lastly, site NF 7 is located close to a substation west of Humboldt, NE. The outcrop is a 1-ft thick, subhorizontal layer of carbonate mudstone which is systematically jointed into blocks. The outcrop is considered to overly the Humboldt Fault (R.M. Joeckel, pers. comm.). Prominent joint orientations are 019, 062, 073, and 173. No abutting relationships were discernable at this outcrop.
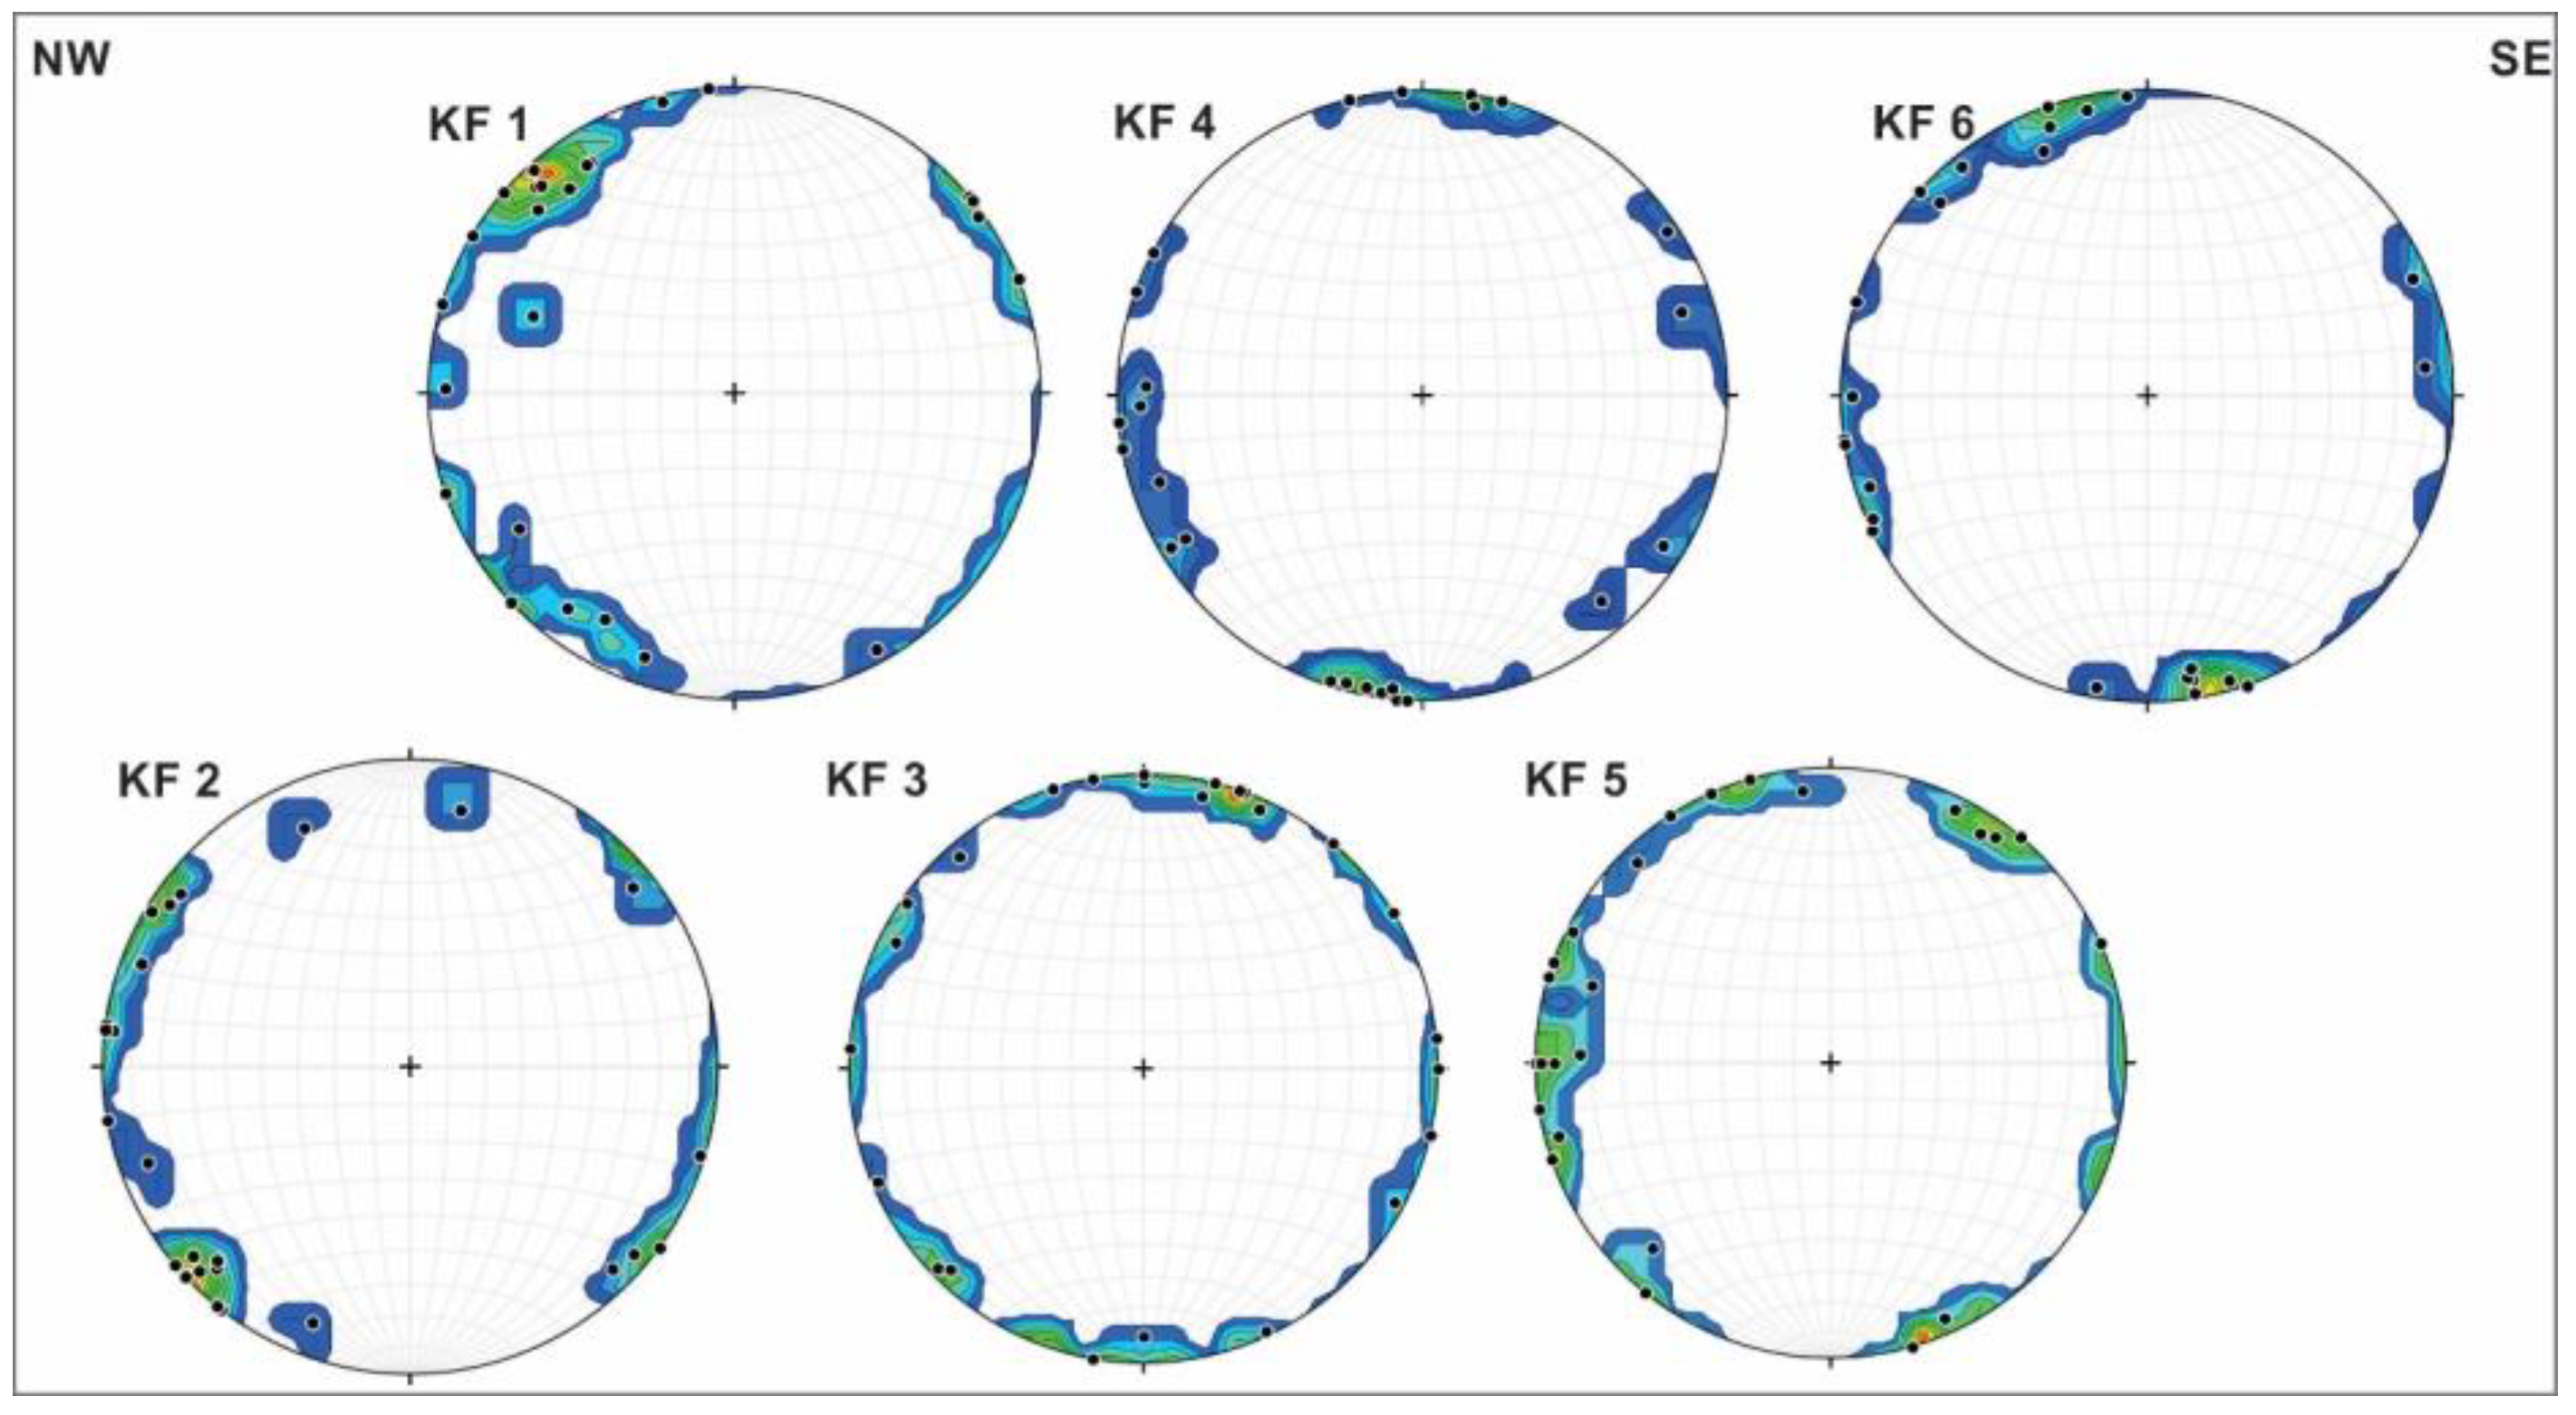
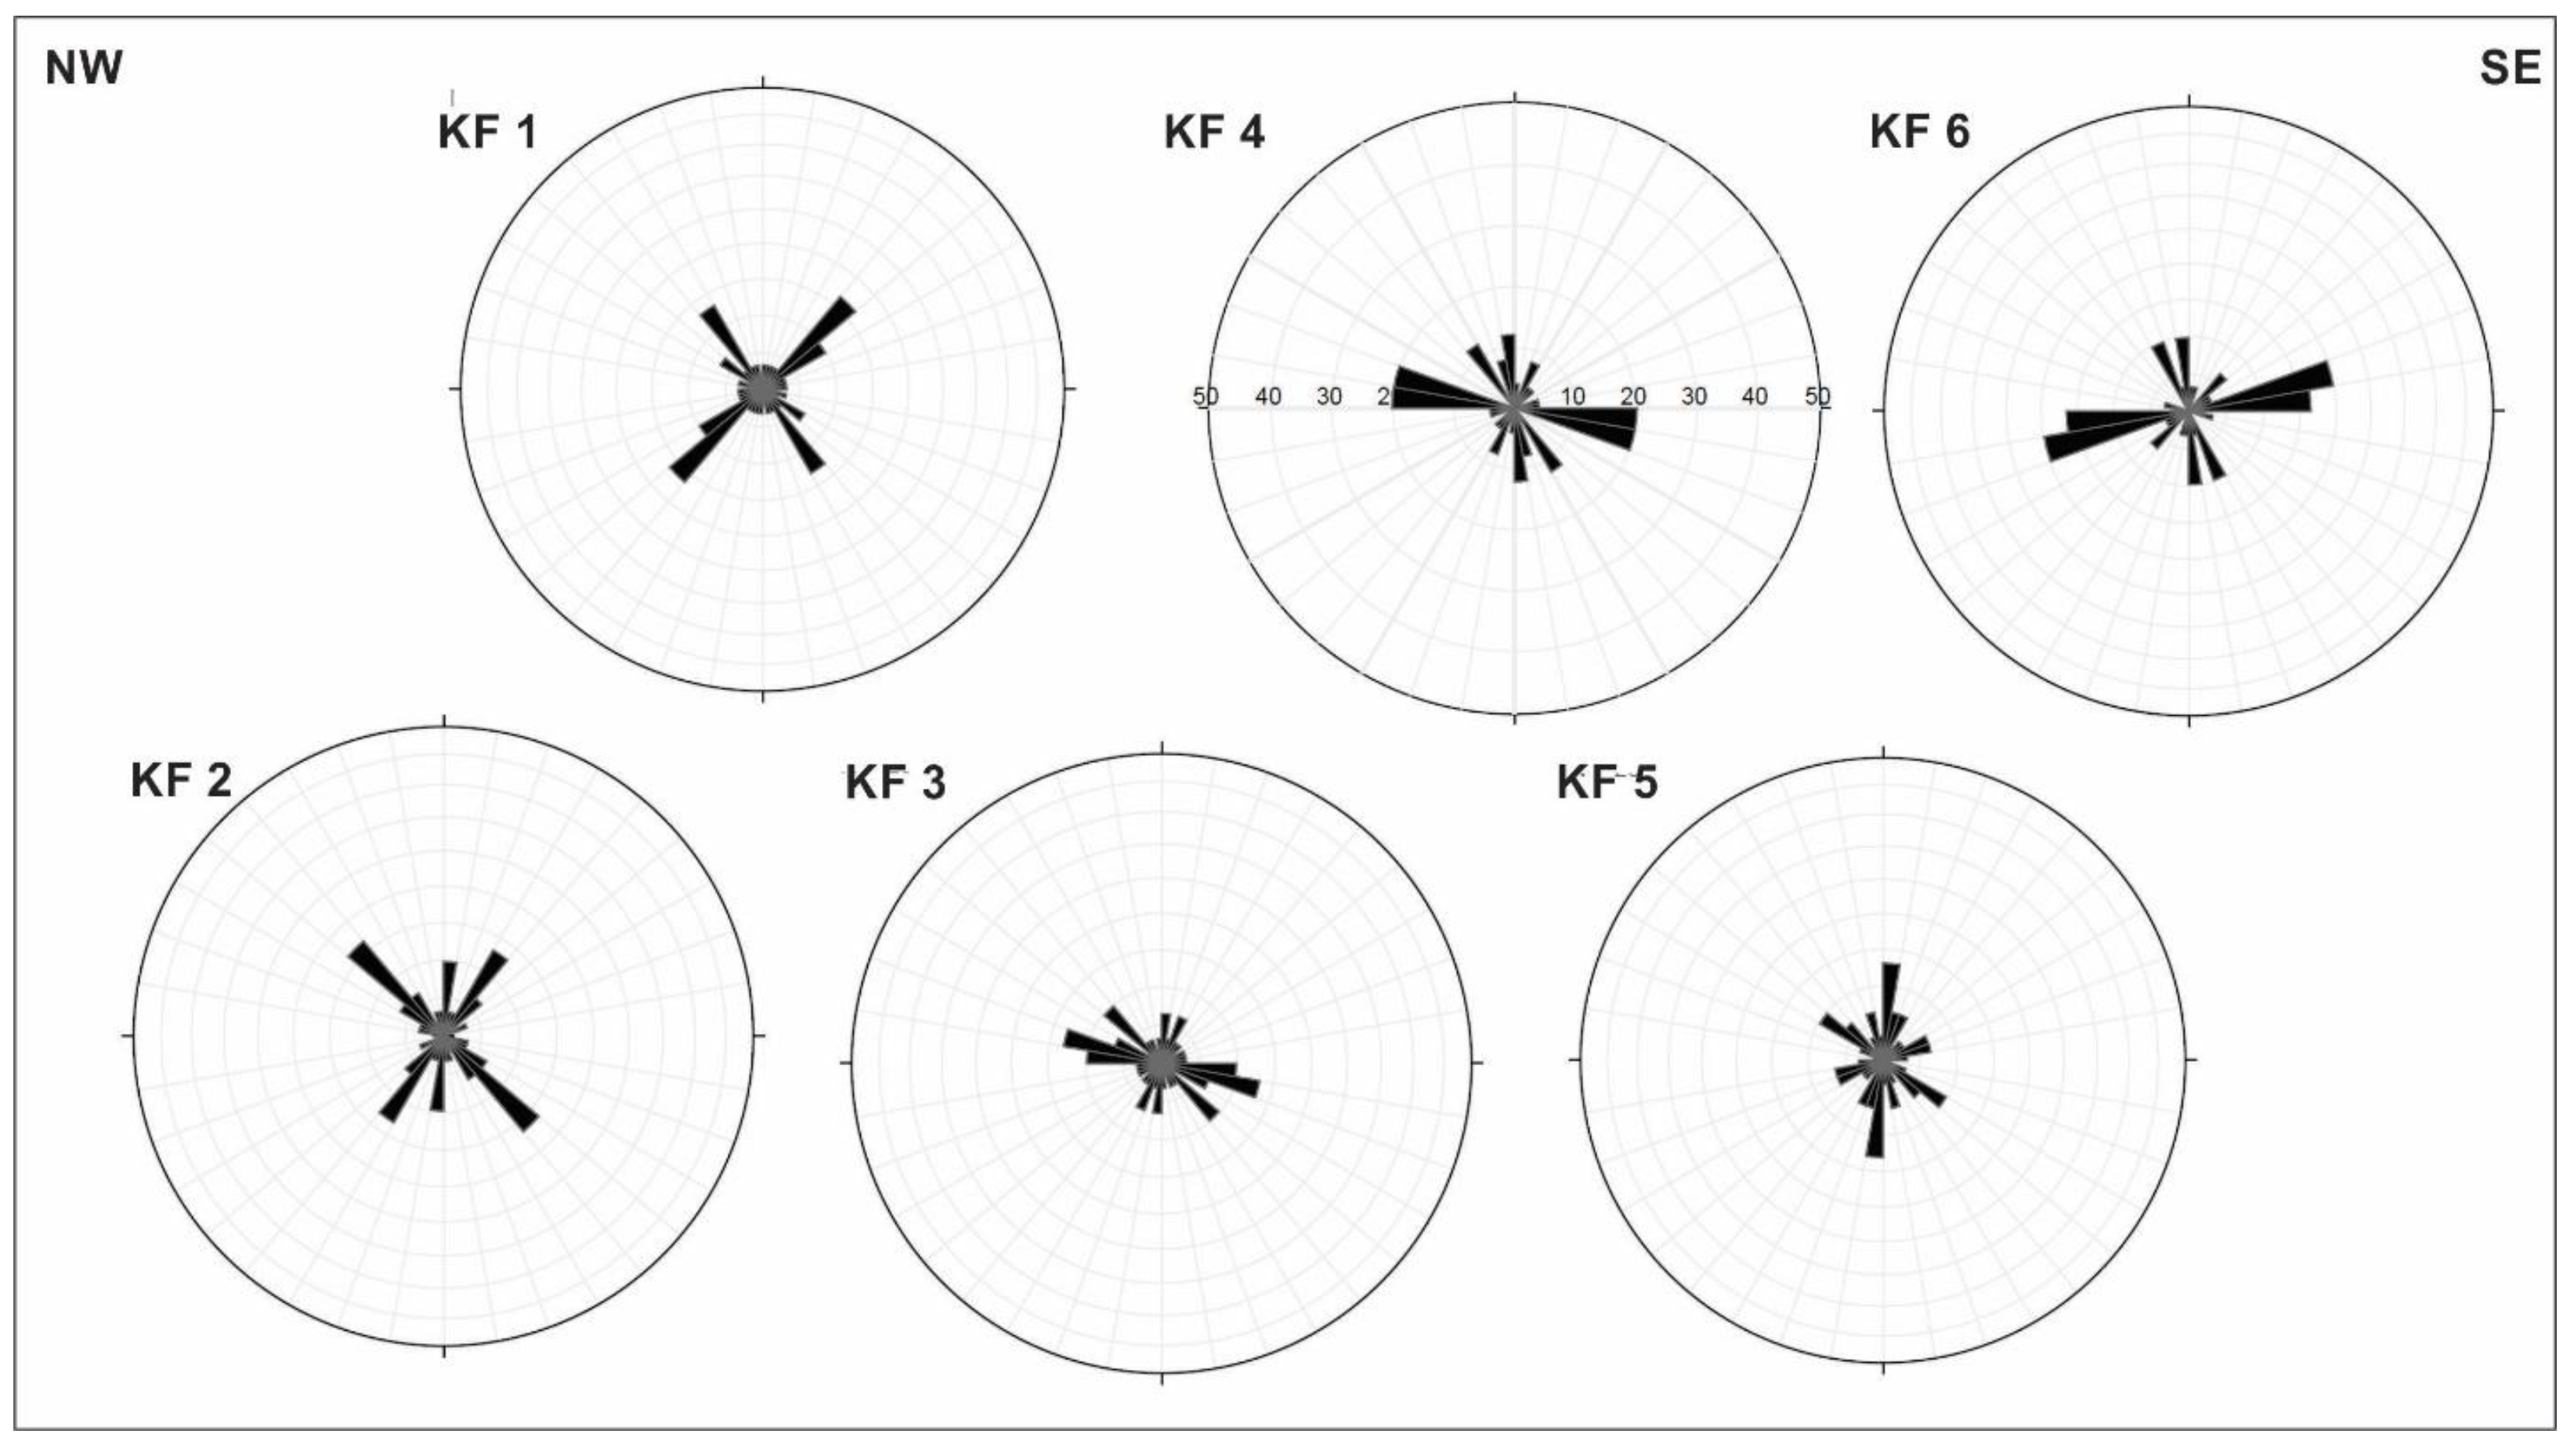
Figure 11 and Figure 12 show pole figures and rose diagrams for field sites located along the NW-SE oriented transect in Kansas (KF 1-KF 6 respectively). Site KF 1 is an E-W oriented road cut exposing about 3 m of the Dakota Group and bedding is subhorizontal. In this location, the Dakota Formation is manifest as a deep orange, cross-bedded sandstone, with evidence of reprecipitated or concentrated iron in bedding planes and cross-bedding. Prominent joint sets are oriented 003, 022, 060, 084, 117, and 139. No abutting relationships were discernable at this outcrop. Site KF 2 is an outcrop of the Greenhorn Formation near Cuba, KS; a thinly bedded limestone and shale road cut containing inoceramids and oriented E-W and dipping 2° to the N. At this location, prominent joint orientations are 008, 037, 111, 136, and 165. No abutting relationships were discernable at this outcrop. Site KF 3 is an outcrop of cherty, thickly-bedded, subhorizontal limestone within the Wolfcampian Series of the Permian. The road cut is oriented N-S and is systematically jointed. Prominent joint orientations at this outcrop are 359, 029, 068, 090, 110, and 137. No abutting relationships were discernable at this outcrop. Site KF 4 is also within the Permian Wolfcampian Series, and is a thinly-bedded, subhorizontal, cherty limestone. The site is located close to the Fancy Creek State Park area of Tuttle Creek Lake. Prominent joint orientations are 357, 029, 049, 072, 106, and 148. This is the only outcrop that shows the 148 orientation. No abutting relationships were discernable at this outcrop. Site KF 5 is within the Permian Wolfcampian Series and is a weathered, subhorizontally-bedded outcrop close to the Tuttle Creek Spillway and the Spillway Fault System. Prominent joint orientations here are 003, 021, 060, 072, 137, and 162. No abutting relationships were discernable at this outcrop. Lastly, site KF 6 is located south of Manhattan, KS, near the Konza Prairie Kansas Valley lookout point. The road cut is oriented N-S and is made up of interbedded, subhorizontal, limestone, and shale from the Permian Wolfcampian Series. Prominent joint orientations are 359, 020, 045, 078, 100, and 161. No abutting relationships were discernable at this outcrop.
Table 1 summarizes the pronounced joint orientations at each outcrop, with the ETM (enhanced thematic mapper; i.e., remote sensing) dataset included for comparison. The “representative” row in the table records the average orientation based on the numbers in the column above, and should not be confused with true Fisher statistics as the dataset is not sufficiently large to permit the calculation of a Fisher mean. The bolded numbers represent joint sets appearing in both the field and remote datasets. The 001, 059, 090, and 110 orientations are found in both the ETM dataset and in five or more of the field sites. The 148 orientation is only found in one field site, but is prominent in the ETM dataset. Closer inspection of the table reveals that there is a subtle spatial trend appearing in the dataset, namely that orientations 137 and 163 only appear in the southern part of the study area (southern part of transect NF and the KF transect). However, neither of these trends are apparent in the ETM dataset.
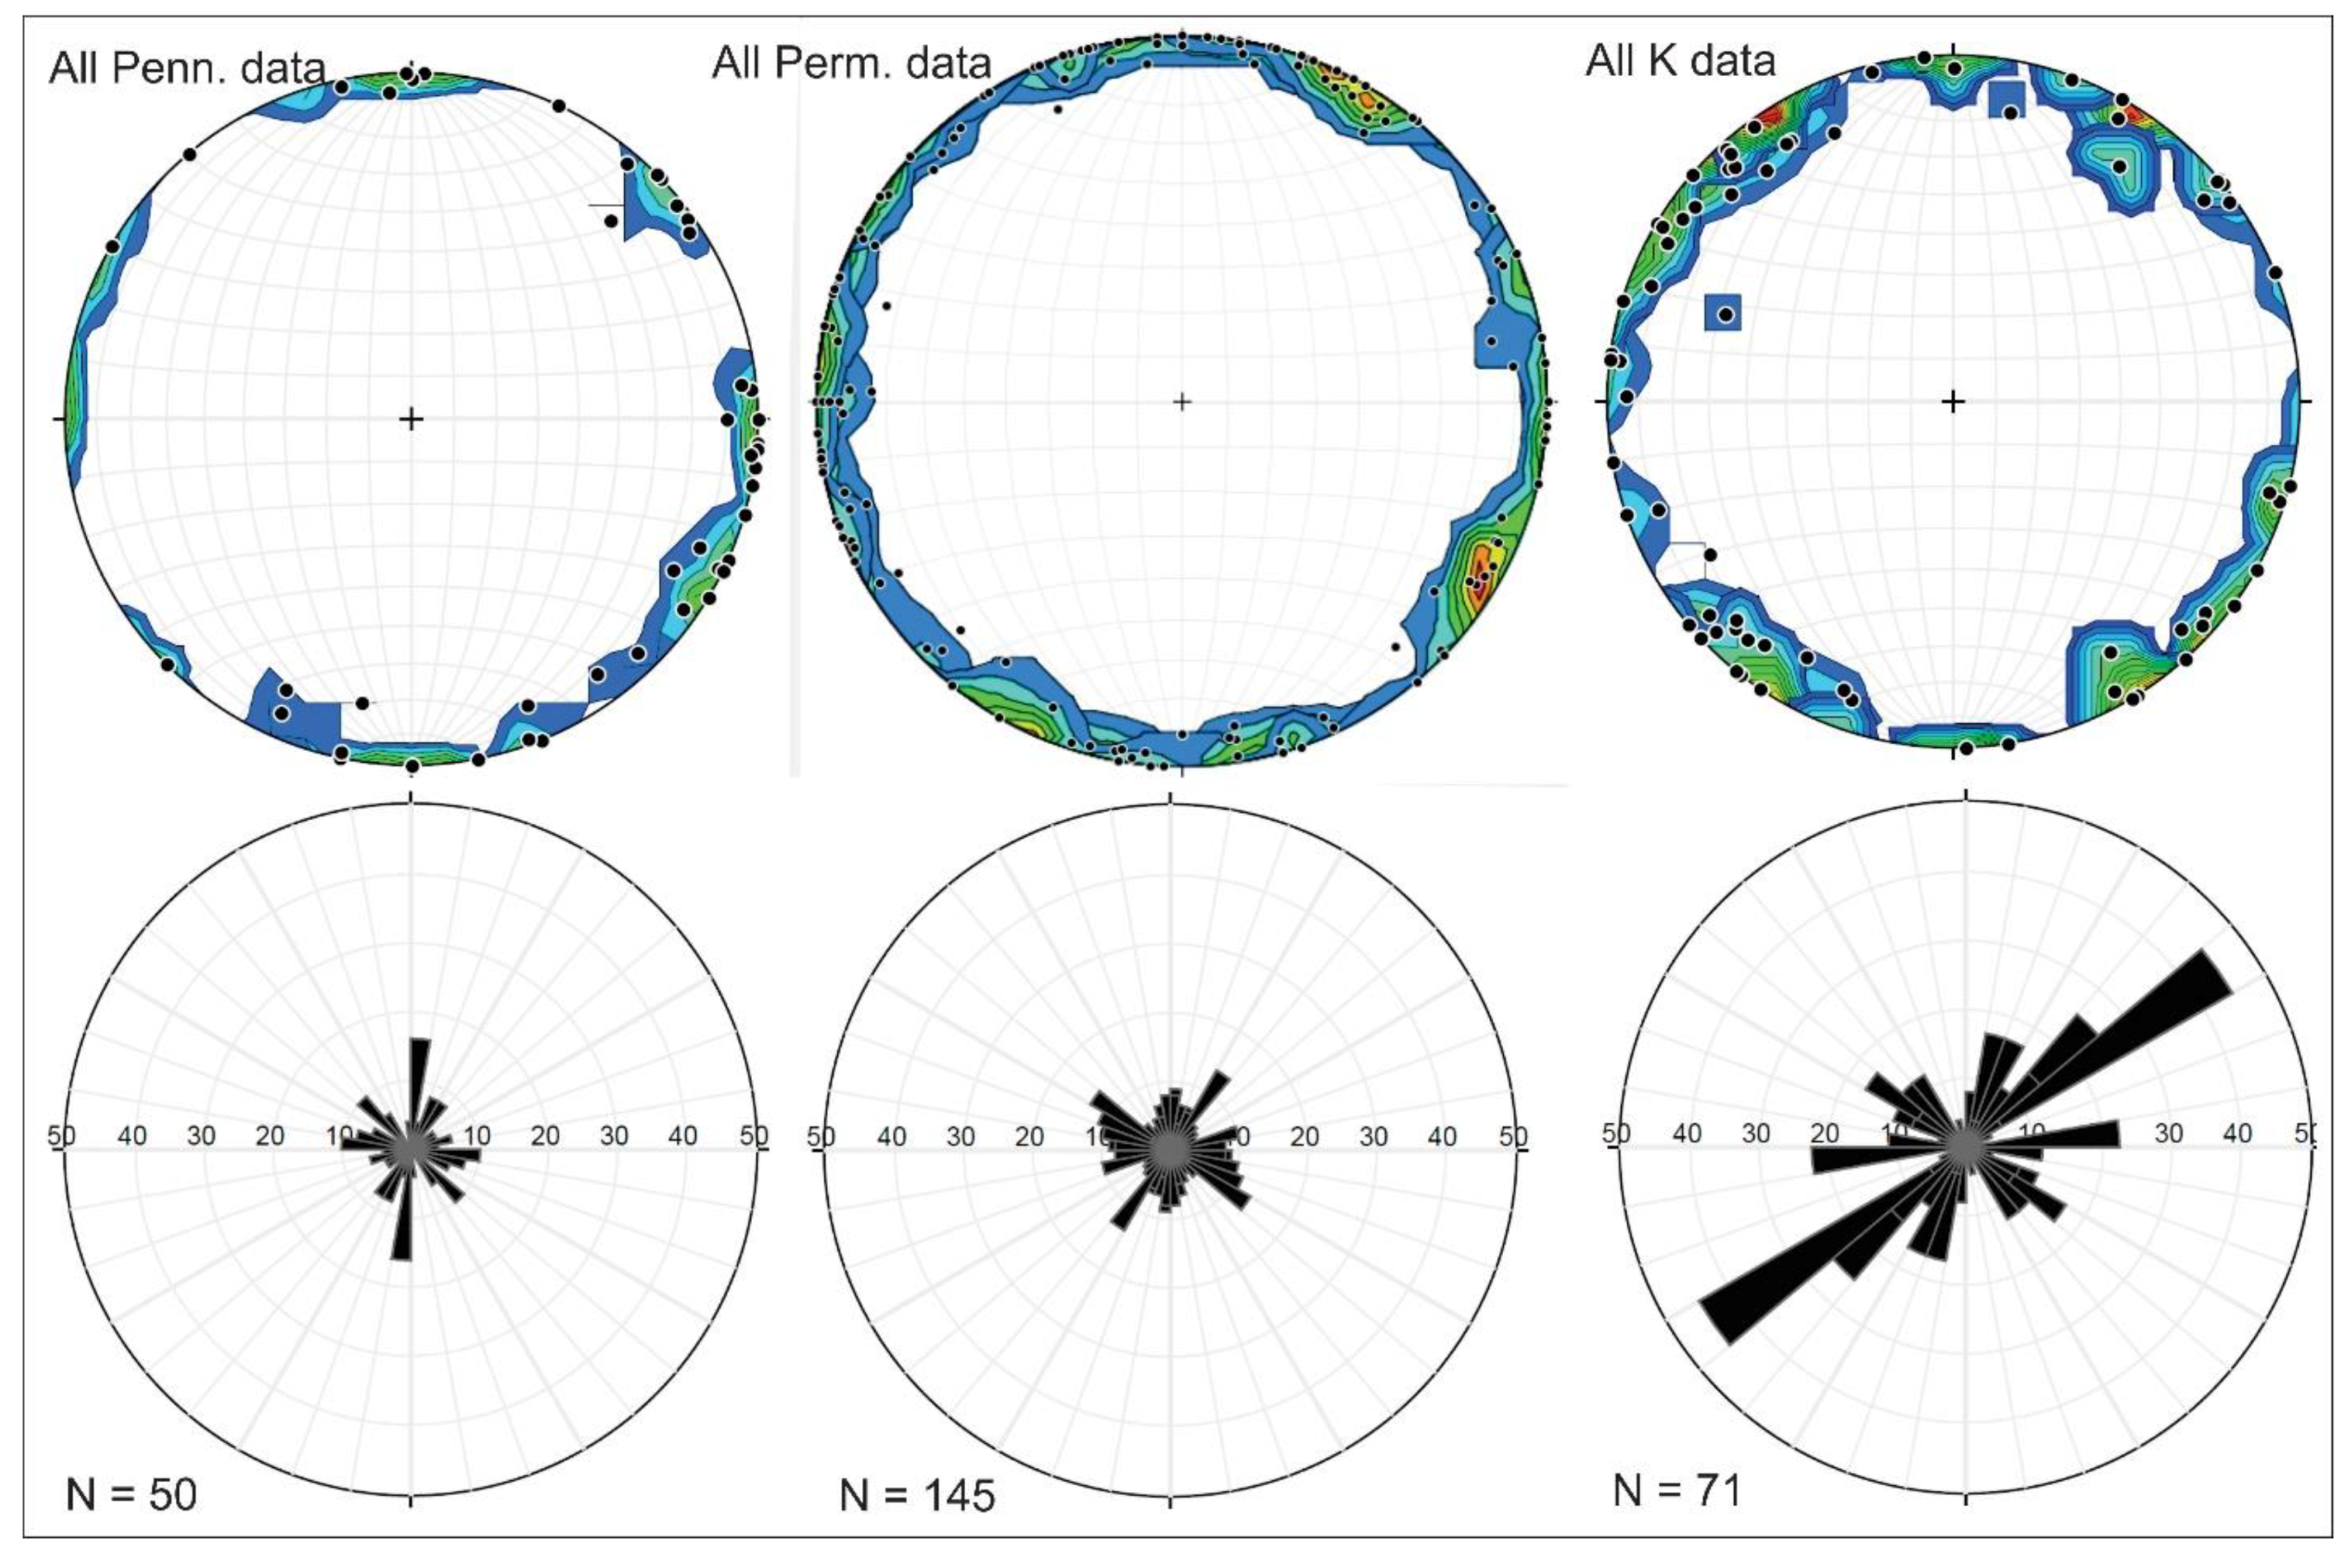
Considering the data by age of host formation is also instructive. Figure 13 shows rose diagrams and pole figures for the Cretaceous, Permian, and Pennsylvanian units, respectively, and Table 2 shows a summary of major joint orientations. Note that the number of joints in each plot is significantly different as there are more outcrops in the Permian units than in either Cretaceous or Pennsylvanian. Considering the dataset by age shows that the 001 orientation appears in all datasets, as does the 090. Some important orientations, e.g., the 031 and 072 orientations only appear in the older units. Similarly, some orientations, such as the 124 and 163 orientations, are only prominent in the Permian and younger units. Finally, in this presentation of the data, orientations such as the 020, 046, and 059 only appear in the youngest (that is, the Cretaceous age) units.
Interestingly, separating the data by age of host Formation has the effect of separating the data by mechanical stratigraphy, since the Cretaceous age units are quartz rich sandstones and thinly bedded marly limestones, whereas the Pennsylvanian and Permian units that were measured are the blocky limestone units from the cyclothems described in the Geologic Setting section above. The limestone layers within the cyclothems are thinner than the blocky Dakota units in the Cretaceous, and the relationship between systematic fracturing and bed thickness is well documented (e.g., [79]) potentially leading to the strong NE-SW trend in the Cretaceous units that is not observed in the Permian or Pennsylvanian rocks.

5. Results: Basement Lineaments from Potential Fields Data

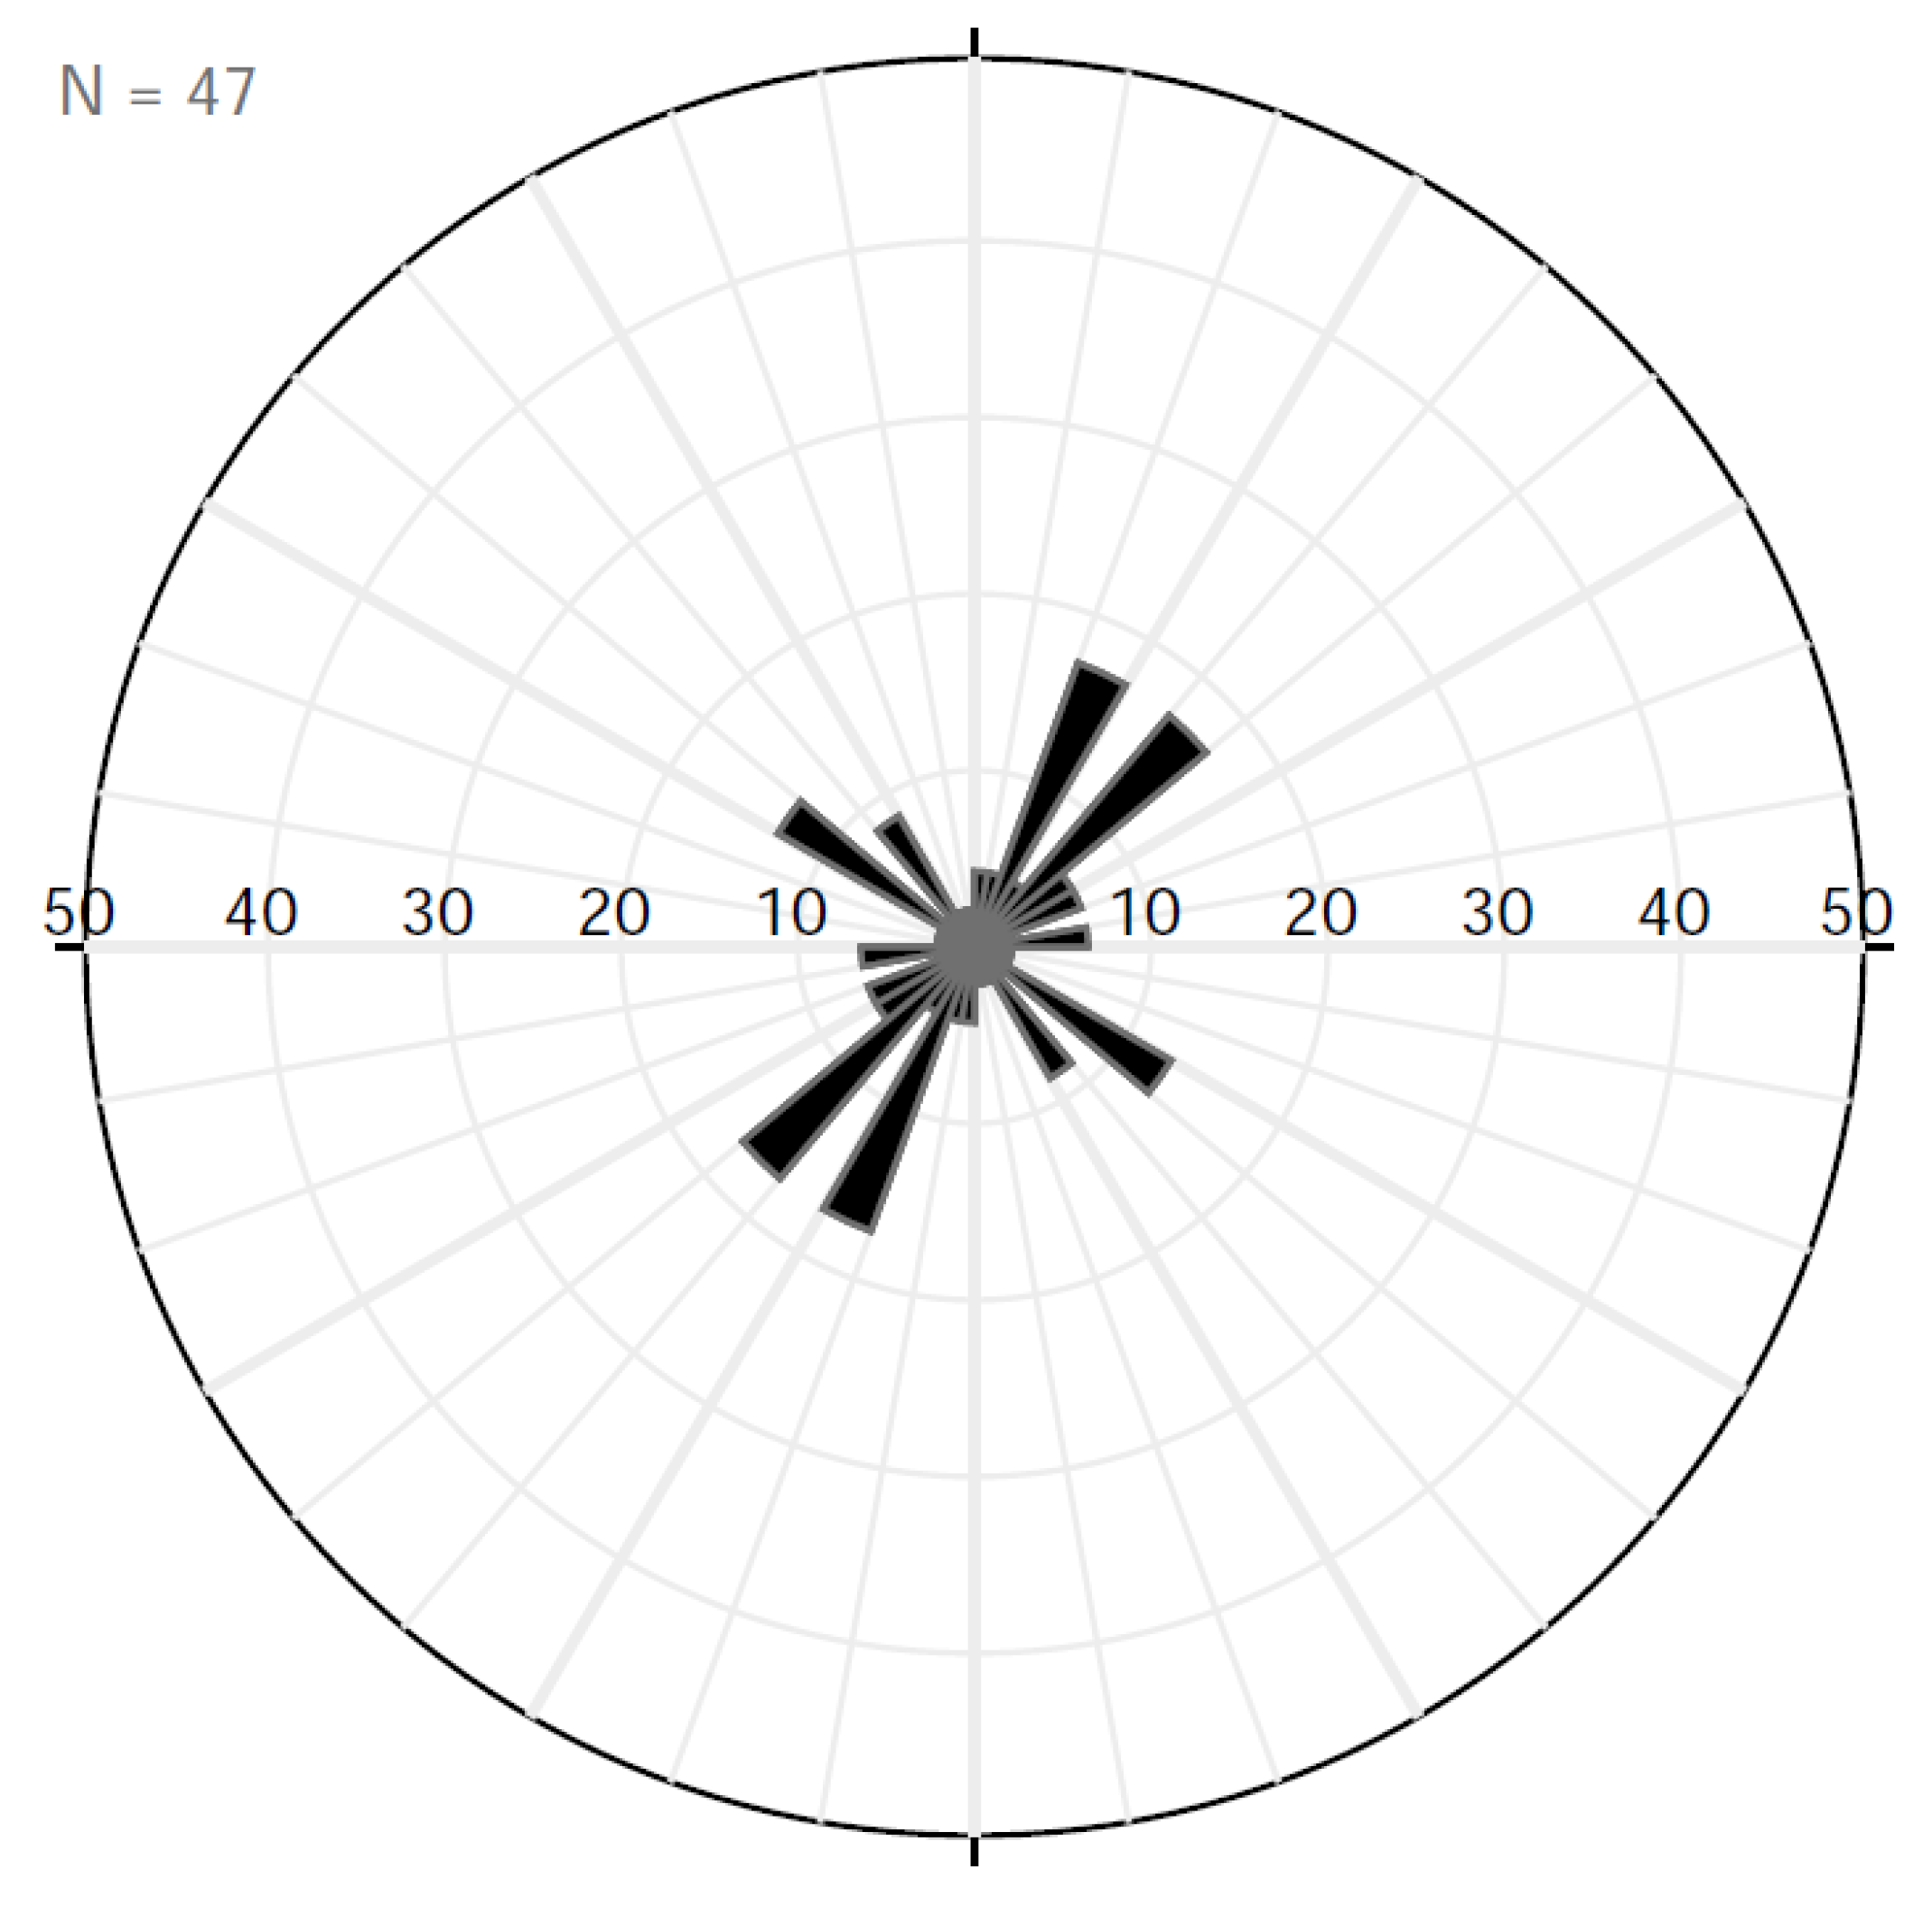
In the study area, 47 lineaments were mapped through a joint analysis of the filtered magnetic and gravity maps (Figure 14). Many of the lineaments correlate well with previously mapped basement faults (Figure 2). The interpreted lineaments show a strong NE-SW trend that mirrors the orientation of the MRS. This trend can clearly be seen when the plotted on a rose diagram (Figure 15). The majority of the lineaments (36%) are oriented at 025 and 045. In addition to the MCR parallel orientations, a strong NW-SE trend at 125 is also apparent with a smaller spike in the 145 direction.
Potential fields—gravity and magnetics—change in response to the variations of the physical properties—densities and magnetic susceptibilities—of the rocks in the subsurface. The tilt derivative filter applied to both gravity and magnetics tends to highlight the regions where these fields experience the most changes. If these regions show linear patterns, they are referred as lineaments. A basement-related subsurface fault correlates to the abrupt changes in the rocks’ physical properties across the fault plane—sediments with lower densities and magnetic susceptibilities on one side of the fault are juxtaposed against denser and more magnetic (igneous) basement rocks on the other side. Such a structure causes the effects in both potential fields that would result in a lineament mapped at the same location in both filtered maps. In our analysis, the fact that the lineaments are observed simultaneously in both gravity and magnetic fields increases our confidence that they are related to basement-involved subsurface faults. For example, the well mapped Humboldt fault corresponds to a lineament in our interpretation. In addition, some of the interpreted lineaments are aligned with the recorded earthquake locations both within and outside of our study area, confirming their relevance to subsurface faults. Overall, we believe that the lineaments observed simultaneously in both potential fields represent the basement-involved faults that are masked by the overlying sediments and cannot be easily observed at the surface.

6. Comparison and Interpretation of Surface and Basement Datasets

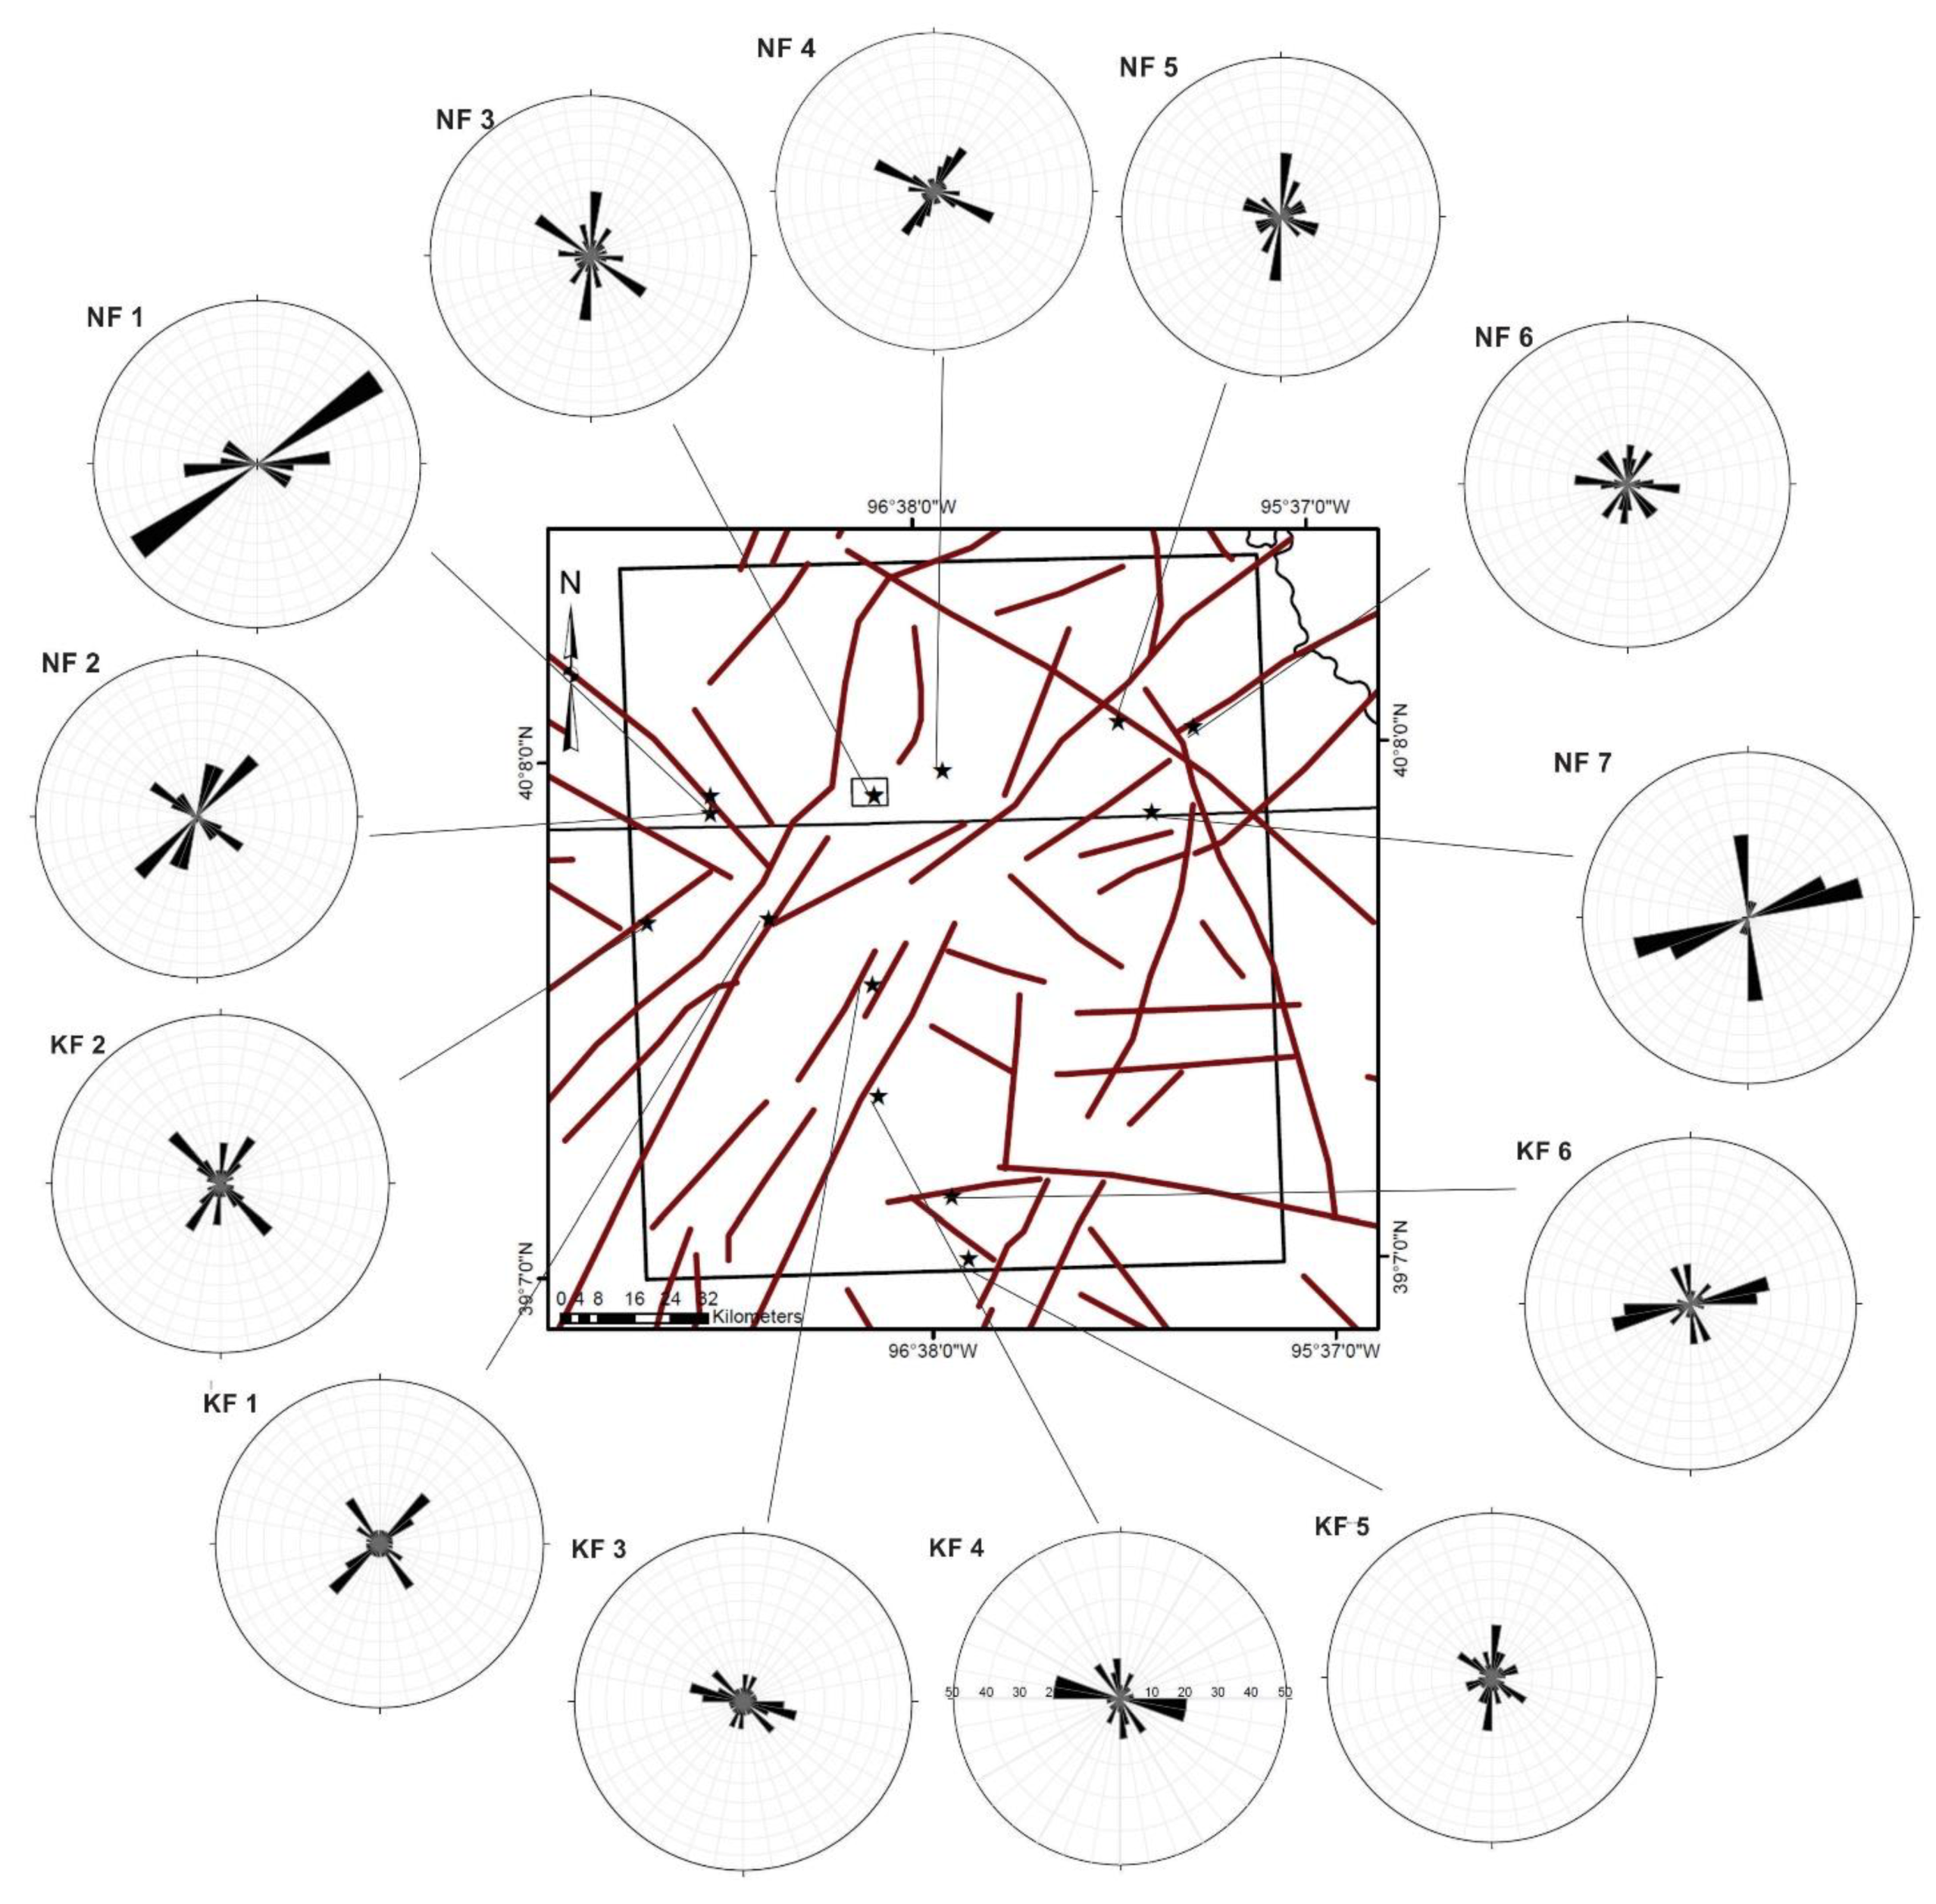
The basement lineaments in Figure 15 show the most tightly clustered orientations, when compared to Figure 8, Figure 10, Figure 12, and Figure 13 (all other rose diagrams). The two prominent basement trends at 045 and 125–135 neatly mirror the Mid Continent Rift System and Central Plains Orogeny system faults respectively (Figure 2). The Central Plains Orogeny trend is not as strongly observed in the study area as is the MRS trend. Table 3 shows that all basement orientations appear in the surface dataset, and the overall NE-SW orientation appears in all three datasets, at either ~045 or ~055. Figure 16 shows the “grouped” centers of the lineaments mapped from the ETM dataset (processed using the internal ArcGIS spatial statistics toolbox), plotted with respect to the basement faults. The correspondence between basement faults and clusters is not perfect, but several of the clusters can be found in regions where basement lineaments cross one another (e.g., clusters 8, 12, 13, 18, 24, and 29) and an additional set can be found sub-parallel to some of the mapped basement faults (clusters 7, 10, 28, and 50). Figure 17 shows the orientations of the measured joint sets in their geographic reference frame, with respect to the orientations of the interpreted basement faults. Joints hosted in Cretaceous rocks (locations NF 1, NF 2, KF 1, and KF 2) show a pronounced NE-SW orientation, as well as a less well-defined NW-SE orientation—both of which orientations are either parallel to or perpendicular to the underlying basement fault. Joints hosted in Permian rocks (NF 3, NF 4, NF 7, and KF 3–KF 6) typically show more complex joint orientation patterns, and the nearby basement fault orientations are generally not pronounced. The only exception to this statement is NF 7, above the Humboldt Fault, which trends approximately N-S. Joints hosted in Pennsylvanian rocks (NF 5 and NF 6) also show a good deal of scatter, and the presence of a N-S orientation that is not marked in Permian rocks.
Our model for the development of the joint patterns relies on forced folding, defined by [80] as folding in which the final orientation and morphology of the fold are determined by a forcing member below. Opening mode joints in forced folds form dominantly parallel to the strike of the forcing fault [81,82,83]. Shear joints may also form in this orientation, and as a conjugate set where the bisector is perpendicular to the fault strike [81,82,83] but since our observations are concerned with tensile joints, we do not treat the shear fracture situation in this discussion. One example of a forced folding scenario is the trishear fault-propagation folding process as initially defined by [84]. This model describes the activation (or reactivation) of a blind fault in a basement layer that is mechanically different from the cover, by the generation of a zone of deformation above the blind thrust that eventually develops into the forelimb. Reference [85] showed that in some Laramide uplifts, tensile fracturing in the zone directly above the fault is inhibited, but the trishear zone can become very highly jointed (e.g., [86]). Reference [87] showed numerically that both fault-strike-normal and fault-strike-perpendicular tensile joints can develop during trishear as well as the conjugate shear orientations noted above. Fold-related joint orientations that cannot be explained by buckling in regions where basement faulting is common are typically thought to be related to flexure above basement lineaments (e.g., [88,89]).
Thus, the principal joint and surface lineament sets shown in Table 3 are considered to result from flexure above the basement faults shown in Figure 14c. The clusters shown in Figure 16 may be considered as the damage or trishear zone resulting from flexure above the basement faults, in this case reactivated and not cutting the cover rocks. This correspondence of lineament and joint orientations is best explained by repeated reactivation on the basement faults, as detailed in the “Geological Setting” section, throughout the Pennsylvanian, Permian (both ARM-related) and post-mid Cretaceous. The decrease in complexity in joint orientations, between joints hosted in Pennyslvanian, Permian and Cretaceous units, may reflect these repeated periods of reactivation; the Pennsylvanian joint set is more dispersed because the rocks have undergone more episodes of uplift and flexure than either the Permian or Cretaceous units. A post-mid Cretaceous phase of reactivation is less well documented than the other ARM-related reactivation, and could be due to far-field stresses from the Laramide Orogeny.

7. Discussion

As noted above, the basement lineaments (Figure 14 and Figure 15) mirror the trends of Precambrian age faults related to the Mid Continent Rift System and the Central Plains Orogeny. Overall, the correspondence of surface lineaments and joints to basement data indicates reactivation of basement structures in an important influencing factor in the development of the surface features in Nebraska and Kansas. Our results enhance the work of [28,29,30,31,32,33] by extending the dataset of joints and satellite-derived lineaments, and documenting the relationships with basement features over a wider area. We have further shown that the strong presence of the MRS-related basement orientation in the Cretaceous age datasets (Figure 12 and Figure 14) provides strong evidence for reactivation of the MRS trends post-mid Cretaceous.
The surface and ETM datasets are much more dispersed than the basement dataset. We first need to consider that the depth to the basement is approx. 2000 m in the study area, leading to attenuation of the gravity and magnetic signature of buried structures. As a result, only dominant subsurface features will be represented in the basement analysis, compared to a much wider range of features represented at the surface. One possibility for the dispersion of joints is that flexure and uplift of the thick, competent succession of Phanerozoic sediments is distributing deformation across a wider area, perhaps by outer-arc extension of the competent succession above a vertically uplifting basement feature. Secondly, joints are known to develop in unroofing situations, although these are typically small-scale and more randomly oriented [90,91,92]. Lineament analysis on this scale and at this resolution is unlikely to pick up many unroofing structures, but some of the noise in the field datasets (Figure 9, Figure 10, Figure 11, Figure 12 and Figure 13) may be attributed to this. An additional factor that must be considered in the evaluation of Figure 13 is that sandstone layers typically joint in a much blockier, systematic fashion than the underlying limestones (e.g., [93]). Limestone containing numerous fossil fragments appears to contain joints with more dispersion around the key orientations than a sandstone layer of a similar thickness, subjected to the same stresses (see e.g., [94,95]). This could contribute to some of the dispersion in the fossil-rich datasets, but multiple episodes of uplift and flexure is still favored as the primary explanation.
The misfit between surface joint data and ETM datasets has also been documented by other authors (e.g., [96,97]). These authors demonstrate that joint networks generated by remote and field measurement are statistically different from one another, i.e., the mean resultant direction and standard deviation for each dataset is significantly different. [96] showed that the mean resultant joint direction in an air-photo dataset from Kuh-e-Asmari, Iran, is not easily observable on the ground. A similar problem was noted in work on the Bighorn Mountains [97] where the dominant joint directions are similar in remote and field datasets, but not identical. The dataset presented in this study suffers from a similar mismatch between joint and ETM data, likely because of the smoothing in the remote dataset over a series of structures and over two markedly different lithologies, and the challenge of working with 30 m resolution data. Nonetheless, we have documented joints relating to reactivation of the MRS in all three datasets.

8. Conclusions

We have documented lineaments and joints across a series of different spatial scales in southeast Nebraska and northeast Kansas. The prominent basement orientations are NE-SW and NW-SE, which orientations are mirrored in the ETM and joint datasets. Distributed strain throughout the Phanerozoic rigid beam that is uplifted over the basement features adds dispersion and secondary orientations to both the ETM and joint dataset. The prominence of the NE-SW orientation in Cretaceous age rocks indicates a reactivation of MRS structures after the mid-Cretaceous, likely a result of far field stresses from the Laramide Orogeny. Lastly, this combined potential fields and surface morphology study (that is, stream patterns and fracture networks) shows the intense importance of subtle surface data in demonstrating activity on deep-seated basement faults in the absence of large-scale structure development.

Author Contributions

Conceptualization, C.M.B. Methodology, C.M.B.; Software, M.L.S., I.F., C.M.B.; Formal Analysis, C.M.B., J.L.S., M.L.S., I.F.; Investigation, C.M.B., J.L.S., M.L.S., I.F.; Data Curation C.M.B., M.L.S.; Writing-Original Draft Preparation, C.M.B.; Writing-Review & Editing, C.M.B., J.L.S., M.L.S., I.F.; Funding Acquisition, M.L.S., C.M.B. and I.F.

Acknowledgments

We gratefully acknowledge funding from the University of Nebraska Lincoln Research Council Layman Fund, awarded to M.L.S. and I.F.; and funding from the University of Nebraska Lincoln Graduate College to support J.L.S.

Conflicts of Interest

The authors declare no conflicts of interest.

References

  1. Berberian, M. Master “blind” thrust faults hidden under the Zagros folds: Active basement tectonics and surface morphotectonics. Tectonophysics 1995, 241, 193–224. [Google Scholar] [CrossRef]
  2. Cinque, A.; Patacca, E.; Scandone, P.; Tozzi, M. Quaternary kinematic evolution of the Southern Appennines. Relationships between surface geological features and deep lithospheric structures. Ann. Geophys. 1993, 36, 249–260. [Google Scholar]
  3. Shephard-Thorn, E.R.; Lake, R.D.; Atitullah, M.E.; Gray, D.A. Basement control of structures in the Mesozoic rocks in the Strait of Dover region, and its reflexion in certain features of the present land and submarine topography. Phil. Trans. R. Soc. Lond. A 1972, 272, 99–110. [Google Scholar] [CrossRef]
  4. Butler, R.W.H.; Holdsworth, R.E.; Lloyd, G.E. The role of basement reactivation in continental deformation. J. Geol. Soc. 1997, 154, 69–71. [Google Scholar] [CrossRef]
  5. Thomas, W.A. Genetic relationship of rift-stage crustal structure, terrane accretion, and foreland tectonics along the southern Appalachian-Ouachita orogen. J. Geodyn. 2004, 37, 549–563. [Google Scholar] [CrossRef]
  6. Audet, P.; Burgmann, R. Dominant role of tectonic inheritance in supercontinent cycles. Nat. Geosci. 2011, 4, 184–187. [Google Scholar] [CrossRef]
  7. Huerta, A.D.; Harry, D.L. Wilson cycles, tectonic inheritance, and rifting of the North American Gulf of Mexico continental margin. Geosphere 2012, 8, 374–385. [Google Scholar] [CrossRef]
  8. Macedo, J.; Marshak, S. Controls on the geometry of fold-thrust belt salients. GSA Bull. 1999, 111, 1808–1822. [Google Scholar] [CrossRef]
  9. Gates, A.E.; Costa, R.E. Multiple Reactivation of Rigid Basement block margins, examples in the northern Reading Prong, USA. In Basement Tectonics 12; Proceedings of the International Conferences on Basement Tectonics; Hogan, J.P., Gilbert, M.C., Eds.; Springer: Dordrecht, The Netherlands, 1998; pp. 123–153. [Google Scholar]
  10. Molliex, S.; Bellier, O.; Terrier, M.; Lamarche, J.; Martelet, G.; Espurta, N. Tectonic and sedimentary inheritance on the structural framework of Provence (SE France): Importance of the Salon-Cavaillon fault. Tectonophysics 2010, 501, 1–16. [Google Scholar] [CrossRef] [Green Version]
  11. Said, A.; Baby, P.; Chardon, D.; Ouali, J. Structure, paleogeographic inheritance, and deformation history of the southern Atlas foreland fold and thrust belt of Tunisia. Tectonics 2011, 30. [Google Scholar] [CrossRef] [Green Version]
  12. McMechan, M.E. Deep transverse basement structural control of mineral systems in the southeastern Canadian Cordillera. Can. J. Earth Sci. 2012, 49, 693–708. [Google Scholar] [CrossRef]
  13. Burberry, C.M. The effect of basement fault reactivation on the Triassic-Recent geology of Kurdistan, N Iraq. J. Pet. Geol. 2015, 38, 37–58. [Google Scholar] [CrossRef]
  14. Sibson, R.H. A note on fault reactivation. J. Struct. Geol. 1985, 7, 751–754. [Google Scholar] [CrossRef]
  15. Letouzey, J. Fault reactivation, inversion and fold-thrust belt. In Proceedings of the 4th IFP Exploration and Production Research Conference, Bordeaux, France, 14–18 November 1988. [Google Scholar]
  16. Morris, A.; Ferrill, D.A.; Henderson, D.B. Slip-tendency analysis and fault reactivation. Geology 1996, 24, 275–278. [Google Scholar] [CrossRef]
  17. Dewey, J.F. Kinematics and Dynamics of Basin Inversion; Cooper, M.A., Williams, W.D., Eds.; Geological Society of London Special Publication: London, UK, 1989; Volume 44, p. 352. [Google Scholar]
  18. Williams, G.D.; Powell, C.M.; Cooper, M.A. Geometry and kinematics of inversion tectonics. In Inversion Tectonics; Cooper, M.A., Williams, G.D., Eds.; Geological Society of London Special Publication: London, UK, 1989; Volume 44, pp. 3–15. [Google Scholar]
  19. Ranalli, G. Rheology of the crust and its role in tectonic reactivation. J. Geodyn. 2000, 30, 3–15. [Google Scholar] [CrossRef]
  20. Del Ventisette, C.; Montanari, D.; Sani, F.; Bonini, M. Basin inversion and fault reactivation in laboratory experiments. J. Struct. Geol. 2006, 28, 2067–2083. [Google Scholar] [CrossRef]
  21. Handin, J. On the Coulomb-Mohr Failure Criterion. J. Geophys. Res. 1969, 74, 5343–5348. [Google Scholar] [CrossRef]
  22. Butler, R.W.H.; Tavarnelli, E.; Grasso, M. Structural inheritance in mountain belts: An Alpine Apennine perspective. J. Struct. Geol. 2006, 28, 1893–1908. [Google Scholar] [CrossRef]
  23. Dubois, A.; Odonne, F.; Massonnat, G.; Lebourg, T.; Fabre, R. Analogue modelling of fault reactivation: Tectonic inversion and oblique remobilisation of grabens. J. Struct. Geol. 2002, 24, 1741–1752. [Google Scholar] [CrossRef]
  24. Bahroudi, A.; Koyi, H.A. Effect of spatial distribution of Hormuz salt on deformation style in the Zagros fold and thrust belt: An analogue modelling approach. J. Geol. Soc. 2003, 160, 719–733. [Google Scholar] [CrossRef]
  25. Viola, G.; Odonne, F.; Mancktelow, N. Analogue modelling of reverse fault reactivation in strike–slip and transpressive regimes: Application to the Giudicarie fault system, Italian Eastern Alps. J. Struct. Geol. 2004, 26, 401–418. [Google Scholar] [CrossRef]
  26. Lisle, R.J.; Srivastava, D.C. Test of the frictional reactivation theory for faults and validity of fault-slip analysis. Geology 2004, 32, 569–572. [Google Scholar] [CrossRef]
  27. Burberry, C.M.; Joeckel, R.M.; Korus, J.T. Post-Mississippian Tectonic Evolution of the Nemaha Tectonic Zone and Midcontinent Rift System, SE Nebraska and N Kansas. Available online: https://digitalcommons.unl.edu/cgi/viewcontent.cgi?article=1471&context=geosciencefacpub (accessed on 10 April 2018).
  28. Neff, A.W. A Study of the Fracture Patterns of Riley County, Kansas. Master’s Thesis, Kansas State College of Agriculture and Applied Science, Manhattan, KS, USA, 1949. [Google Scholar]
  29. Ward, J.R. A Study of the Joint Patterns in Gently Dipping Sedimentary Rocks of South-Central Kansas; Kansas Geological Survey Bulletin: Lawrence, KS, USA, 1986. [Google Scholar]
  30. Baehr, W.M. An Investigation of the Relationship between Rock Structure and Drainage in the Southern Half of the Junction City, Kansas, Quadrangle. Master’s Thesis, Kansas State College of Agriculture and Applied Science, New York, NY, USA, 1954. [Google Scholar]
  31. Smith, J.W.; Kuntz, C.S.; Williams, A.L.; Scheper, R.J. Structural and Photographic Lineaments, Gravity, Magnetics and Seismicity of Central USA. In Proceedings of the First International Conference on the New Basement Tectonics, Salt Lake City, UT, USA, 3–7 June 1974; pp. 163–168. [Google Scholar]
  32. White, D.C. Lineament Study of Stream Patterns in a Portion of East-Central Kansas. Master’s Thesis, Emporia State University, Emporia, KS, USA, 1990. [Google Scholar]
  33. Nelson, P.D. The Reflection of the Basement Complex in the Surface Structures of the Marshall-Riley County area of Kansas. Master’s Thesis, Kansas State College of Agriculture and Applied Science, Manhattan, KS, USA, 1952. [Google Scholar]
  34. Garrity, C.P.; Soller, D.R. Database of the Geologic Map of North America; Adapted from the Map by J.C. Reed, Jr. and Others (2005): U.S. Geological Survey Data Series 424. 2009. Available online: https://pubs.usgs.gov/ds/424/ (accessed on 10 April 2018).
  35. Carlson, M. Tectonic implications and influence of the midcontinent rift system in Nebraska and adjoining areas. In Basement Tectonics 10, Proceedings of the International Conferences on Basement Tectonics; Ojakangas, R.W., Dickas, A.B., Green, J.C., Eds.; Springer: Dordrecht, The Netherlands, 1995; Volume 4, pp. 61–64. [Google Scholar]
  36. Jewett, J.M.; Merriam, D.F. Geologic framework of Kansas; a review for geophysicists. Bull.-Kansas Geol. Surv. 1959, 137, 9–52. [Google Scholar]
  37. Anderson, K.H.; Wells, J.S. Forest City Basin of Missouri, Kansas Nebraska and Iowa. AAPG Bull. 1968, 52, 264–281. [Google Scholar] [CrossRef]
  38. Condra, G.E.; Reed, E.C. The Geological Section of Nebraska. Neb. Geol. Surv. Bull. 1959, 14A, 82. Available online: http://www.nogcc.ne.gov/ResearchDocuments/Number14.pdf (accessed on 10 April 2018).
  39. Baars, D.L. Conjugate basement rift zones in Kansas, Midcontinent, USA. In Basement Tectonics 9, Proceedings of the International Conferences on Basement Tectonics, Canberra, Australia, 2–6 July 1990; Rickard, M.J., Harrington, H.J., Williams, P.R., Eds.; Springer: Dordrecht, The Netherlands, 1992; Volume 3, pp. 201–210. [Google Scholar]
  40. Carlson, M.P.; Treves, S. The Elk Creek carbonatite, southeast Nebraska—An overview. Nat. Resour. Res. 2005, 14, 39–45. [Google Scholar] [CrossRef]
  41. Carlson, M.P. Tectonic Implications and Influence of the Midcontinent Rift System in Nebraska and Adjoining Areas; GSA Special Paper: Washington, DC, USA, 1997; Volume 312, pp. 231–234. [Google Scholar]
  42. Berendsen, P. Tectonic Evolution of the Midcontinent Rift System in Kansas; GSA Special Paper; Geological Society of America: Boulder, CO, USA, 1997; Volume 312, pp. 235–241. [Google Scholar]
  43. Atekwana, E. Precambrian Basement Beneath the Central Midcontinent United States as Interpreted from Potential Field Imagery; GSA Special Paper; Geological Society of America: Boulder, CO, USA, 1996; Volume 308, pp. 33–44. [Google Scholar]
  44. Carlson, M.P. Precambrian accretionary history and Phanerozoic structures—A unified explanation for the tectonic architecture of the Nebraska region, USA. GSA Mem. 2007, 200, 321–326. [Google Scholar]
  45. Whitmeyer, S.J.; Karlstrom, K.E. Tectonic model for the Proterozoic growth of North America. Geosphere 2007, 3, 220–259. [Google Scholar] [CrossRef]
  46. Carlson, M.P.; Treves, S.B.; Goble, R.J.; Xu, A. New Data and Interpretations for the Precambrian, Midcontinent USA. In Basement Tectonics; Springer: Dordrecht, The Netherlands, 1999; pp. 49–63. [Google Scholar]
  47. Carlson, M. Evidence from the stratigraphic record for basement deformation in southeastern Nebraska, Midcontinent USA. In Basement Tectonics 12, Central North America and Other Regions, Proceedings of the International Conferences on Basement Tectonics, Norman, Oklahoma, 21–26 May 1995; Hogan, J.P., Gilbert, M.C., Eds.; Springer: Dordrecht, The Netherlands, 1998; Volume 6, p. 227. [Google Scholar]
  48. Scotese, C.R.; Golonka, J. PALEOMAP Paleogeographic Atlas: Arlington; Department of Geology, University of Texas: Austin, TX, USA, 1992. [Google Scholar]
  49. Goebel, E.D. Mississippian rocks of western Kansas. AAPG Bull. 1968, 52, 1732–1778. [Google Scholar]
  50. Craddock, J.P.; Pearson, A.; McGovern, M.; Kropf, E.; Moshoian, A.; Donnelly, K. Post-Extension Shortening Strains Preserved in Calcites of the Midcontinent Rift; GSA Special paper: Washington, DC, USA, 1997; Volume 312, pp. 115–126. [Google Scholar]
  51. Hauser, E.C. Midcontinent Rifting in a Grenville Embrace; GSA Special Publication: Washington, DC, USA, 1996; Volume 308, pp. 67–75. [Google Scholar]
  52. Eardley, A.J. Structural Geology of North America; Harper Row: New York, NY, USA, 1962; 743p. [Google Scholar]
  53. Berendsen, P.; Speczik, S. Sedimentary environment of Middle Ordovician iron oolites in northeastern Kansas, USA. Acta Geol. Pol. 1991, 41, 215–226. [Google Scholar]
  54. Berendsen, P.; Doveton, J.H.; Speczik, S. Distribution and characteristics of a Middle Ordovician oolitic ironstone in northeastern Kansas based on petrographic and petrophysical properties: A Laurasian ironstone case study. Sediment. Geol. 1992, 76, 207–219. [Google Scholar] [CrossRef]
  55. Mendenhall, R.A. Surface Geology of Bala, Riley County, Kansas. Master’s Thesis, Kansas State College of Agriculture and Applied Science, Manhattan, KS, USA, 1958. [Google Scholar]
  56. Wilson, F.W.; Berendsen, P. The role of recurrent tectonics in the formation of the Nemaha uplift and Cherokee-forest city basins and adjacent structures in eastern Kansas and contiguous states, USA. In Basement Tectonics 12, Central North America and Other Regions, Proceedings of the International Conferences on Basement Tectonics, Norman, Oklahoma, 21–26 May 1995; Hogan, J.P., Gilbert, M.C., Eds.; Springer: Dordrecht, The Netherlands, 1998; Volume 6, pp. 301–302. [Google Scholar]
  57. Brown, L.; Serpa, L.; Setzer, T.; Oliver, J.; Kaufman, S.; Lillie, R.; Steiner, D.; Steeples, D.W. Intracrustal complexity in the United States midcontinent: Preliminary results from COCORP surveys in northeastern Kansas. Geology 1983, 11, 25–30. [Google Scholar] [CrossRef]
  58. Serpa, L.; Setzer, T.; Brown, L. COCORP Seismic-Reflection Profiling in Northeastern Kansas, In Geophysics in Kansas; Steeples, D.W., Ed.; Kansas Geological Survey: Lawrence, KS, USA, 1989; Volume 226, pp. 165–176. [Google Scholar]
  59. Gay, S.P., Jr. Strike-slip compressional thrust-fold nature of the Nemaha System in Eastern Kansas and Oklahoma. In Proceedings of the Transactions of the 1999 AAPG Midcontinent Section Meeting, Wichita, KS, USA, 29–31 August 1999; pp. 39–50. [Google Scholar]
  60. Moore, R.C. Early Pennsylvanian deposits west of the Nemaha Granite Ridge, Kansas. AAPG Bull. 1926, 10, 205–216. [Google Scholar]
  61. Heckel, P.H. Pennsylvanian cyclothems in Midcontinent North America as far-field effects of waxing and waning of Gondwana ice sheets. In Resolving the Late Paleozoic Ice Age in Time and Space; Fielding, C.R., Frank, T.D., Isbell, J.L., Eds.; Geological Society of America: Boulder, CO, USA, 2008. [Google Scholar]
  62. Heckel, P.H. Pennsylvanian stratigraphy of Northern Midcontinent Shelf and biostratigraphic correlation of cyclothems. Stratigraphy 2013, 10, 3–39. [Google Scholar]
  63. Moore, R.C. Paleoecological aspects of Kansas Pennsylvanian and Permian cyclothems. In Symposium on Cyclic Sedimentation; Kansas Geological Survey Bulletin: Lawrence, KS, USA, 1964; pp. 287–380. [Google Scholar]
  64. West, R.R.; Miller, K.B.; Watney, W.L. The Permian System in Kansas; Kansas Geological Survey Bulletin: Lawrence, KS, USA, 2010. [Google Scholar]
  65. Kluth, C.F.; Koney, P.J. Plate tectonics of the Ancestral Rocky Mountains. Geology 1981, 9, 10–15. [Google Scholar] [CrossRef]
  66. Joeckel, R.M.; Nicklen, B.L.; Carlson, M.P. Low-accommodation detrital apron alongside a basement uplift, Pennsylvanian of Midcontinent North America. Sediment. Geol. 2007, 197, 165–187. [Google Scholar] [CrossRef]
  67. Leary, R.J.; Umhoefer, P.; Smith, M.E.; Riggs, N. A three-sided orogen: A new tectonic model for Ancestral Rocky Mountain uplift and basin development. Geology 2017, 45, 735–738. [Google Scholar] [CrossRef]
  68. Merriam, D.F.; Forster, A. Stratigraphic and Sedimentological Evidence for Late Paleozoic Earthquakes and Recurrent Structural Movement in the US Midcontinent; Geological Society of America: Boulder, CA, USA, 2002. [Google Scholar]
  69. Underwood, J.R.; Polson, A. Spillway Fault System, Tuttle Creek Reservoir, Pottawatomie County, Northeastern Kansas; Geological Society of America: Boulder, CA, USA, 1988. [Google Scholar]
  70. Yonkee, W.A.; Weil, A.B. Tectonic evolution of the Sevier and Laramide belts within the North American Cordillera orogenic system. Earth-Sci. Rev 2015, 150, 531–593. [Google Scholar] [CrossRef] [Green Version]
  71. Tikoff, B.; Maxson, J. Lithopsheric buckling of the Laramide Foreland during Late Cretaceous and Paleogene, Western United States. Rocky Mt. Geol. 2001, 36, 13–35. [Google Scholar] [CrossRef]
  72. Ohlmacher, G.C.; Berendsen, P. Kinematics, mechanics, and potential earthquake hazards for faults in Pottawatomie County, Kansas. USA. Tectonophysics 2005, 396, 227–244. [Google Scholar] [CrossRef]
  73. Steeples, D.W.; DuBois, S.M.; Wilson, F.W. Seismicity, faulting, and geophysical anomalies in Nemaha County, Kansas: Relationship to regional structures. Geology 1979, 7, 134–138. [Google Scholar] [CrossRef]
  74. Burchett, R.R. Earthquakes in Nebraska: Educational Circular; Conservation and Survey Division, University of Nebraska: Lincoln, NE, USA, 1990. [Google Scholar]
  75. Tucker, C.J.; Grant, D.M.; Dykstra, J.D. NASA’s global orthorectified Landsat data set. Photogramm. Eng. Remote Sens. 2004, 70, 313–322. [Google Scholar] [CrossRef]
  76. Bankey, V.; Cuevas, A.; Daniels, D.; Finn, C.A.; Hernandez, I.; Hill, P.; Kucks, R.; Miles, W.; Pilkington, M.; Roberts, C.; et al. Digital Data Grids for the Magnetic Anomaly Map of North America: U.S. Geological Survey Open-File Report 02-414; U.S. Geological Survey: Denver, CO, USA, 2002. Available online: https://mrdata.usgs.gov/magnetic/ (accessed on 10 April 2018).
  77. Kucks, R.P. Bouguer Gravity Anomaly Data Grid for the Conterminous US; U.S. Geological Survey: Denver, CO, USA, 1999. Available online: https://mrdata.usgs.gov/gravity/ (accessed on 10 April 2018).
  78. Verduzco, B.; Fairhead, J.D.; Green, C.M.; MacKenzie, C. New insights into magnetic derivatives for structural mapping. Lead. Edge 2004, 23, 116–119. [Google Scholar] [CrossRef]
  79. Ladeira, F.L.; Price, N.J. Relationship between fracture spacing and bed thickness. J. Struct. Geol. 1981, 3, 179–183. [Google Scholar] [CrossRef]
  80. Stearns, D.W. Faulting and forced folding in the Rocky Mountains foreland. In Laramide Folding Associated with Basement Block Faulting in the Western United States; Memoir; Geological Society of America: Boulder, CO, USA, 1978; Volume 151, pp. 1–37. [Google Scholar]
  81. Cosgrove, J.W.; Ameen, M.S. A comparison of the geometry, spatial organization and fracture patterns associated with forced folds and buckle folds. In Forced Folds and Fractures; Cosgrove, J.W., Ameen, M.S., Eds.; Geological Society Special Publication: London, UK, 2000; pp. 7–21. [Google Scholar]
  82. Luneburg, C.; Ratliff, B.; Page, A. Structural Analysis for Fracture Optimization; AAPG Search and Discovery Article: Tulsa, OK, USA, 2015. [Google Scholar]
  83. Gutierrez, I. Application of Trishear and Elastic Dislocation Models to the Teapot Anticline, Wyoming. Master’s Thesis, University of Stavanger, Stavanger, Norway, 2017. [Google Scholar]
  84. Erslev, E.A. Trishear fault-propagation folding. Geology 1991, 19, 617–620. [Google Scholar] [CrossRef]
  85. Bellahsen, N.; Fiore, P.; Pollard, D.D. The role of fractures in the structural interpretation of Sheep Mountain Anticline, Wyoming. J. Struct. Geol. 2006, 28, 850–867. [Google Scholar] [CrossRef]
  86. Erslev, E.A.; Koenig, N.V. Three-dimensional kinematics of Laramide, basement-involved Rocky Mountain deformation, USA: Insights from minor faults and GIS-enhanced structure maps. Geol. Soc. Am. Mem. 2009, 204, 125–150. [Google Scholar] [CrossRef]
  87. Fischer, M.P.; Wilkerson, M.S. Predicting the orientation of joints from fold shape: Results of pseudo–three-dimensional modeling and curvature analysis. Geology 2000, 28, 15–18. [Google Scholar] [CrossRef]
  88. Ahmadhadi, F.; Lacombe, O.; Daniel, J.M. Early reactivation of basement faults in Central Zagros (SW Iran): Evidence from pre-folding fracture populations in Asmari Formation and lower Tertiary paleogeography. In Thrust Belts and Foreland Basins; Springer: Berlin/Heidelberg, Germany, 2007; pp. 205–228. [Google Scholar]
  89. Wicks, J.L.; Dean, S.L.; Kulander, B.R. Regional tectonics and fracture patterns in the Fall River Formation (Lower Cretaceous) around the Black Hills foreland uplift, western South Dakota and northeastern Wyoming. In Forced Folds and Fractures; Cosgrove, J.W., Ameen, M.S., Eds.; Geological Society Special Publication: London, UK, 2000; pp. 145–165. [Google Scholar]
  90. Engelder, T. Joints and shear fractures in rock. In Fracture Mechanics of Rock; Atkinson, B.K., Ed.; Academic Press Inc.: London, UK, 1987; pp. 27–69. [Google Scholar]
  91. Pollard, D.D.; Aydin, A. Progress in Understanding Jointing Over the Past Century. Geol. Soc. Am. Bull. 1988, 100, 1181–1204. [Google Scholar] [CrossRef]
  92. Davis, G.H.; Reynolds, S.J.; Kluth, C. Structural Geology of Rocks and Regions, 3rd ed.; John Wiley and Sons, Inc.: New York, NY, USA, 2012; 884p. [Google Scholar]
  93. Odling, N.E.; Gillespie, P.; Bourgine, B.; Castaing, C.; Chiles, J.P.; Christensen, N.P.; Fillion, E.; Genter, A.; Olsen, C.; Thrane, L.; et al. Variations in fracture system geometry and their implications for fluid flow in fractures hydrocarbon reservoirs. Pet. Geosci. 1999, 5, 373–384. [Google Scholar] [CrossRef]
  94. Burberry, C.M.; Peppers, M.H. Fracture Characterization in Tight Carbonates: An example from the Ozark Plateau, AR. AAPG Bull. 2017, 101, 1675–1696. [Google Scholar] [CrossRef]
  95. Burberry, C.M.; Cannon, D.L.; Cosgrove, J.W.; Engelder, T. Fracture patterns associated with the evolution of the Teton anticline, Sawtooth Range, Montana. Rev. Geol. Soc. Lond. Spec. Publ. 2018. [Google Scholar] [CrossRef]
  96. McQuillan, H. Fracture Patterns on Kuh-e Asmari Anticline, SW Iran. AAPG Bull. 1974, 58, 236–245. [Google Scholar]
  97. Siddoway, C. Potential Sources of Crustal Anistotropy in the Wyoming Province: Insights from Basement Structures of the Bighorn Mountains, Wyoming; Geological Society of America Abstracts with Programs; Geological Society of America: Boulder, CO, USA, 2011; Volume 42, p. 435. [Google Scholar]
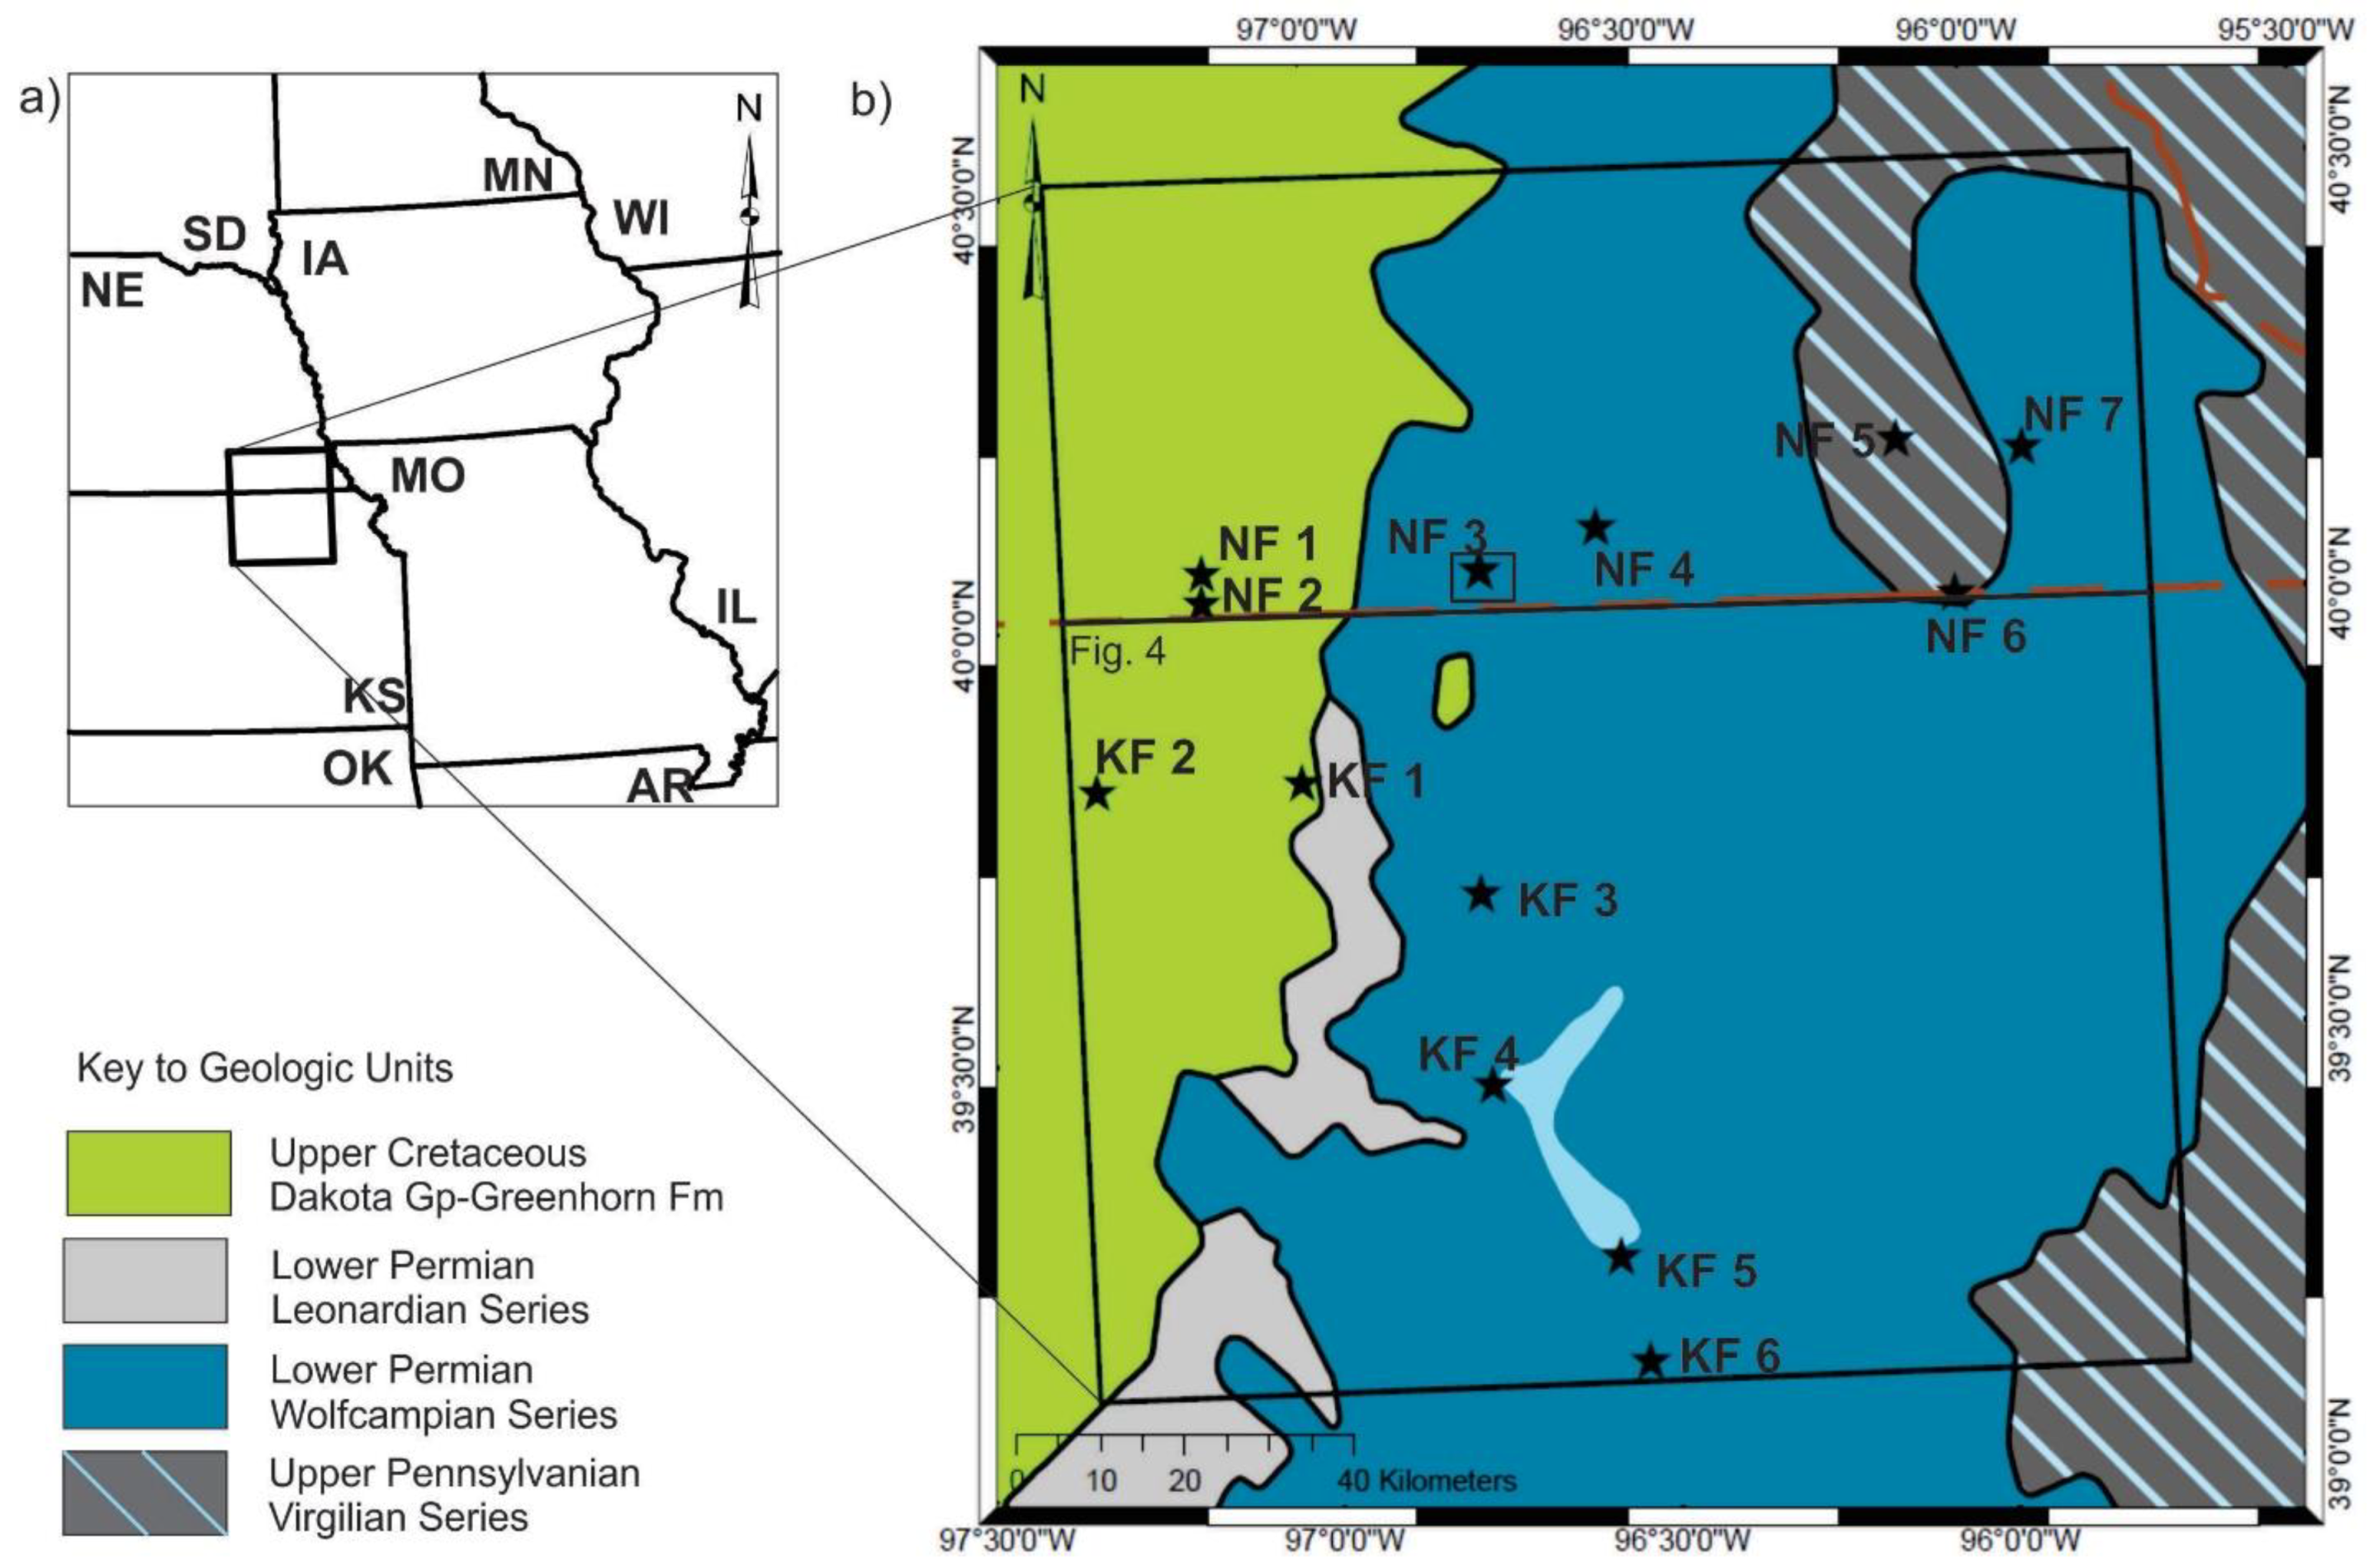
Figure 1. Simplified geologic map of southeastern Nebraska and northeastern Kansas, based on the GDNA [34]. The study area is shown as a black box, and locations of field sites are shown as black stars. The area shown in Figures 4 and 6 is shown as a small black rectangle around site NF 3. The inset shows the location of the studied region within the conterminous US.
Geosciences 08 00215 g001
Figure 2. Existing map of basement faults in the study area and beyond, after [27]. Key features mentioned in the text are marked: MRS—Midcontinent Rift System, shaded in light gray, NU—Nemaha Uplift, shaded in dark gray. Central Plains Orogen crust is shaded light green and Penokean Orogen crust is shaded light yellow, after [46]. Ticks mark the downthrown side of the faults, where known.
Geosciences 08 00215 g002
Figure 3. Composite, simplified stratigraphic column of the study area, with major unconformities marked.
Geosciences 08 00215 g003
Figure 4. W-E cross-section of the Nemaha Uplift and Midcontinent Rift System on the NE-KS state line, after [27]. Part (a) shows the present day configuration of the Nemaha uplift and part (b) the inferred configuration at the end of the Laramide orogeny.
Geosciences 08 00215 g004
Figure 5. MrSID image, illustrating the general color balance in the area, the difference between waterways and real rivers and the difference between crop-induced vegetation patterns and the “natural” vegetation changes. The star marks the location of site NF 3.
Geosciences 08 00215 g005
Figure 6. (a) Reduced-to-the-pole magnetic map with tilt derivative applied and (b) tilt derivative of the residual bouguer gravity anomaly. The black box denotes the study area.
Geosciences 08 00215 g006
Figure 7. MrSID image from Figure 4, above, this time with lineaments marked in black. White star represents the location of site NF 3.
Geosciences 08 00215 g007
Figure 8. Rose diagram showing orientations of all lineaments picked from satellite data in the study area. Each division on the rose diagram represents 10 degrees.
Geosciences 08 00215 g008
Figure 9. Contoured poles to planes for joints at each site on the E-W transect. Sites are arranged in order from W to E. The number of joints in each figure is shown at the bottom left.
Geosciences 08 00215 g009
Figure 10. Rose diagrams for joints at each site on the E-W transect. Sites are arranged in order from W to E. The number of joints in each figure is shown at the bottom left. The perimeter represents 50% of the total data.
Geosciences 08 00215 g010
Figure 11. Contoured poles to planes for joints at each site on the NW-SE transect. Sites are arranged in order from NW to SE. Each figure represents 25 joints.
Geosciences 08 00215 g011
Figure 12. Rose diagrams for joints at each site on the NW-SE transect. Sites are arranged in order from NW to SE. Each figure represents 25 joints. The perimeter represents 50% of the total data.
Geosciences 08 00215 g012
Figure 13. Contoured poles to planes and rose diagrams for the joint data grouped by age of host formation instead of separated by location. The perimeter is 50% of the total data.
Geosciences 08 00215 g013
Figure 14. Lineaments picked from potential fields data. The potential fields in parts (a,b) data are reproduced from Figure 5a,b for ease of comparison. Part (c) shows the interpreted lineaments in the wider study area. The black rectangle shows the area where satellite image analysis was carried out, and is the same area as the black rectangle in Figure 1.
Geosciences 08 00215 g014
Figure 15. Rose diagram showing the orientations of all basement lineaments in the study area.
Geosciences 08 00215 g015
Figure 16. Grouped centers of the ETM lineament dataset, plotted with locations of the basement faults (red lines), and field sites (black stars).
Geosciences 08 00215 g016
Figure 17. Rose diagrams of joint orientations in the study area, geographically positioned, with respect to basement faults.
Geosciences 08 00215 g017
Table 1. Summary of joint orientations for all field sites, organized by transect. The enhanced thematic mapper (ETM) (remote sensing) data is given for comparison.
Location Prominent Joint Orientations Based on Rose Diagram Bins
NF 1 057 088110
NF 2 016 040053 125
NF 3002 031047 090 122
NF 4 029 072 117
NF 5004 026049 068096115
NF 6353 034 090105 135
NF 7353019 062073
KF 1003022 060 084117 139
KF 2008 037 111 136 165
KF 3359 029 068090110 137
KF 4357 029049 072 106 148
KF 5003021 060072 137 162
KF 6359020 045 078 100 161
Representative001020031046059072090110124137148163
ETM005 055 085115 145
Table 2. Summary of main joint orientations in field sites organized by age of host formation. The “representative” and ETM data are given for comparison.
Age of Host FmProminent Joint Orientations Based on Rose Diagram Bins
All Penn003 028 069091113 135
All Perm003 029 074098 118 159
All K004015 040050 089110122 161
Representative (Table 1)001020031046059072090110124137148163
ETM005 055 085115 145
Table 3. Summary of key joint orientations from each dataset. The “representative” orientations from surface joints, orientations from ETM analysis and orientations from potential fields analysis are shown. The number given is the center of each peak from the respective rose diagrams.
DatasetProminent Joint Orientations (Peaks on Rose Diagrams)
Potential Fields 025 045 125135
Representative (Table 1)001020031046059072090110124137148163
ETM005 055 085115 145