1. Introduction
As a result of economic and population growth in the world, the fifth Intergovernmental Panel on Climate Change (IPCC) report [
1] evidenced an increase in anthropogenic greenhouse gas emissions (carbon dioxide, methane, and nitrous oxide) whose atmospheric concentrations reached values never touched in at least the past 800,000 years. Consequently, the IPCC report showed an increase of about 0.9 °C in the Earth’s surface temperature in the twentieth century and forecasted a further increase for the twenty-first century, with natural and anthropic consequences [
1]. In fact, anthropic systems and terrestrial ecosystems are becoming more vulnerable to environmental phenomena and an increase in floods, heat waves, forest fires, and droughts can be expected [
2,
3]. Within such a purview, scholarly investigation has primarily focused on multiple analyses of meteorological, hydrological, and climatological variables based on different methodologies.
Given the above scenario, the call for papers for publication in the Special Issue “Hydrological Hazard: Analysis and Prevention”, which was launched in October 2017, aimed to consider innovative approaches to the analysis, prediction, prevention, and mitigation of hydrological extremes. With this aim, interdisciplinary original research articles highlighting new ideas, approaches, and innovations in the analysis of various types of droughts (e.g., meteorological, agricultural, and hydrological drought) and various types of floods (e.g., fluvial, coastal, and pluvial) were welcomed.
Potential topics of this Special Issue of Geosciences included, but were not limited to, the following:
Regional flood and drought analysis
Case studies and comparative studies in different parts of the world
Analyses of regional/global patterns and trends
Effects of land-use or land-cover change on hydrological extremes
Prediction and prevention of hydrological extremes
Use of satellite and climate data for drought analysis
Innovative modelling methods for flood hazards
Strategies for reducing the vulnerability to hydrological extremes
Climate change and hydrogeological risk
2. Some Data of the Special Issue
From early January 2018 to late September 2018, a total of 18 papers have been submitted for consideration for publication in the Special Issue. After a rigorous editorial check and peer-review processes, which involved external and independent experts in the field, 4 papers were rejected, 1 paper has been withdrawn, and 13 papers have been accepted, with an acceptance rate of about 72%.
Among the 13 articles published in the Special Issue, 1 is a Technical Note (Terranova et al. [
4]), 11 are Research Articles [
5,
6,
7,
8,
9,
10,
11,
12,
13,
14,
15], and one is a Case Report (Schmid-Breton et al. [
16]).
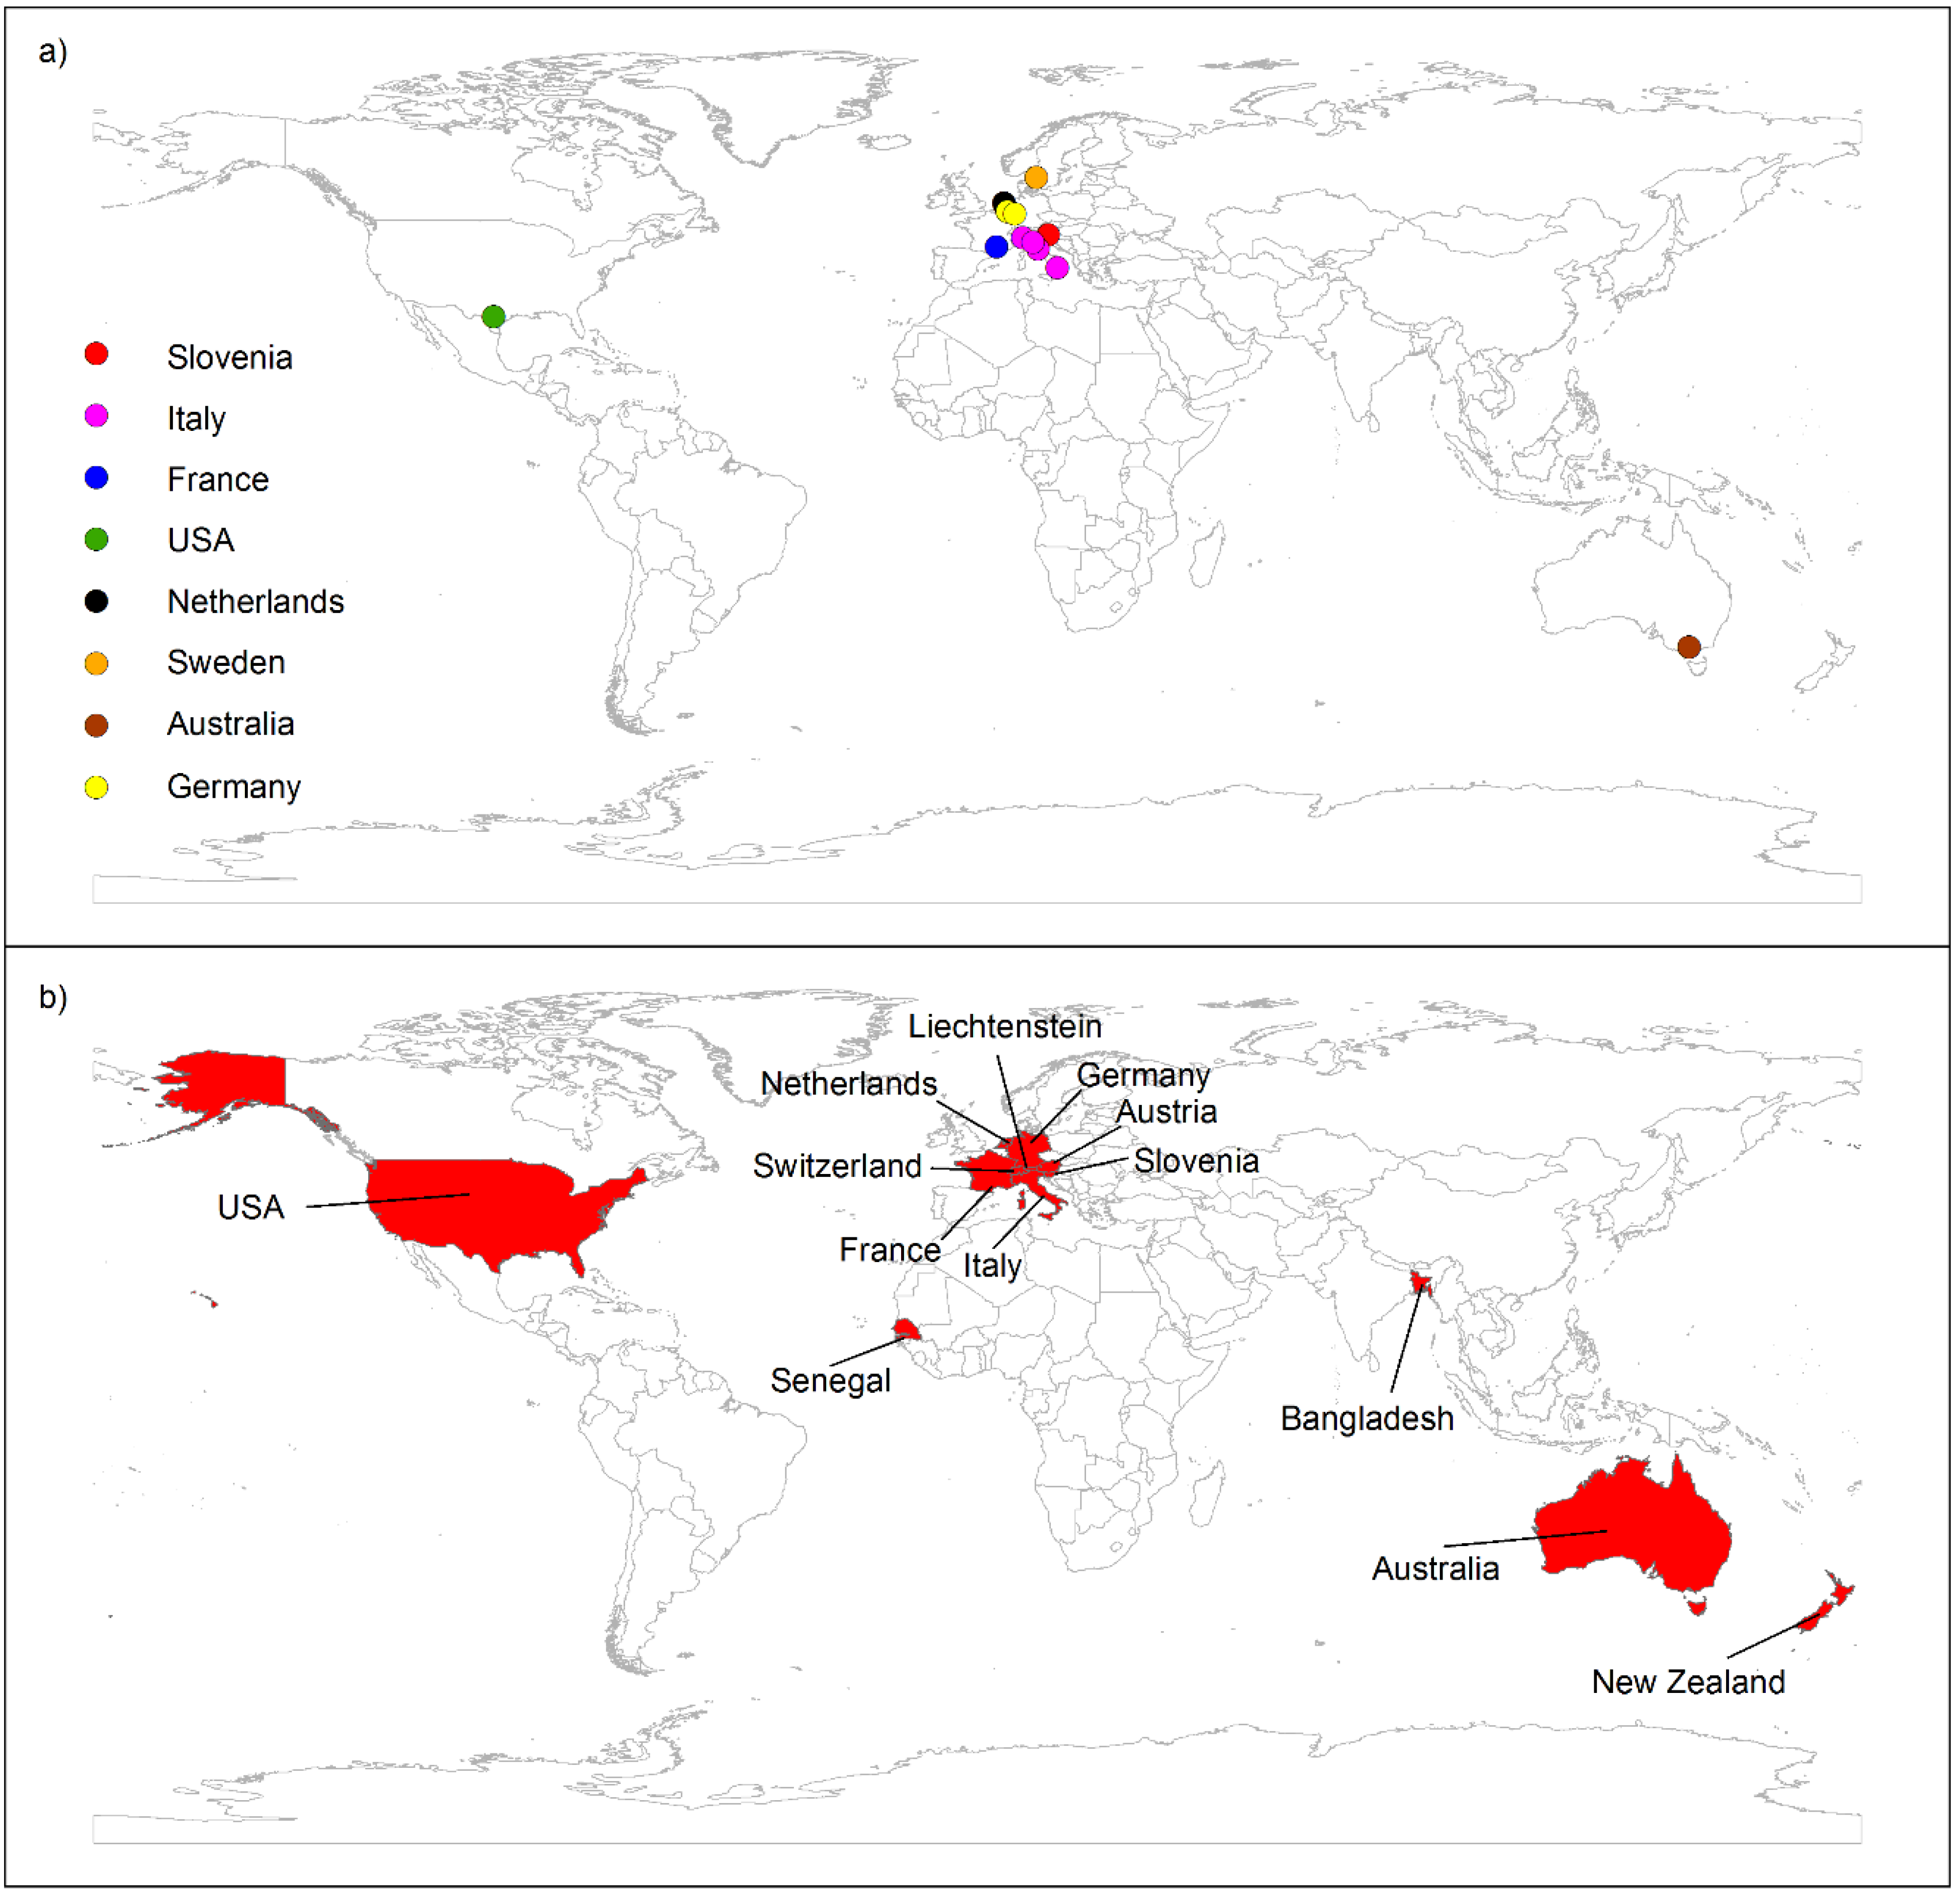
Figure 1 compares the geographic distribution of the authors and research teams publishing in the Special Issue (
Figure 1a), as well as of the case studies and demonstration sites (
Figure 1b). The analysis of this figure allows one to have an idea of the scientific community working on hydrological hazards, although it is just a sample and thus is not an exhaustive representation. Thirty-nine authors from three different continents (North America, Europe, and Oceania) contributed to the Special Issue, showing results of case studies and demonstration sites involving five continents (North America, Europe, Africa, Asia, and Oceania).
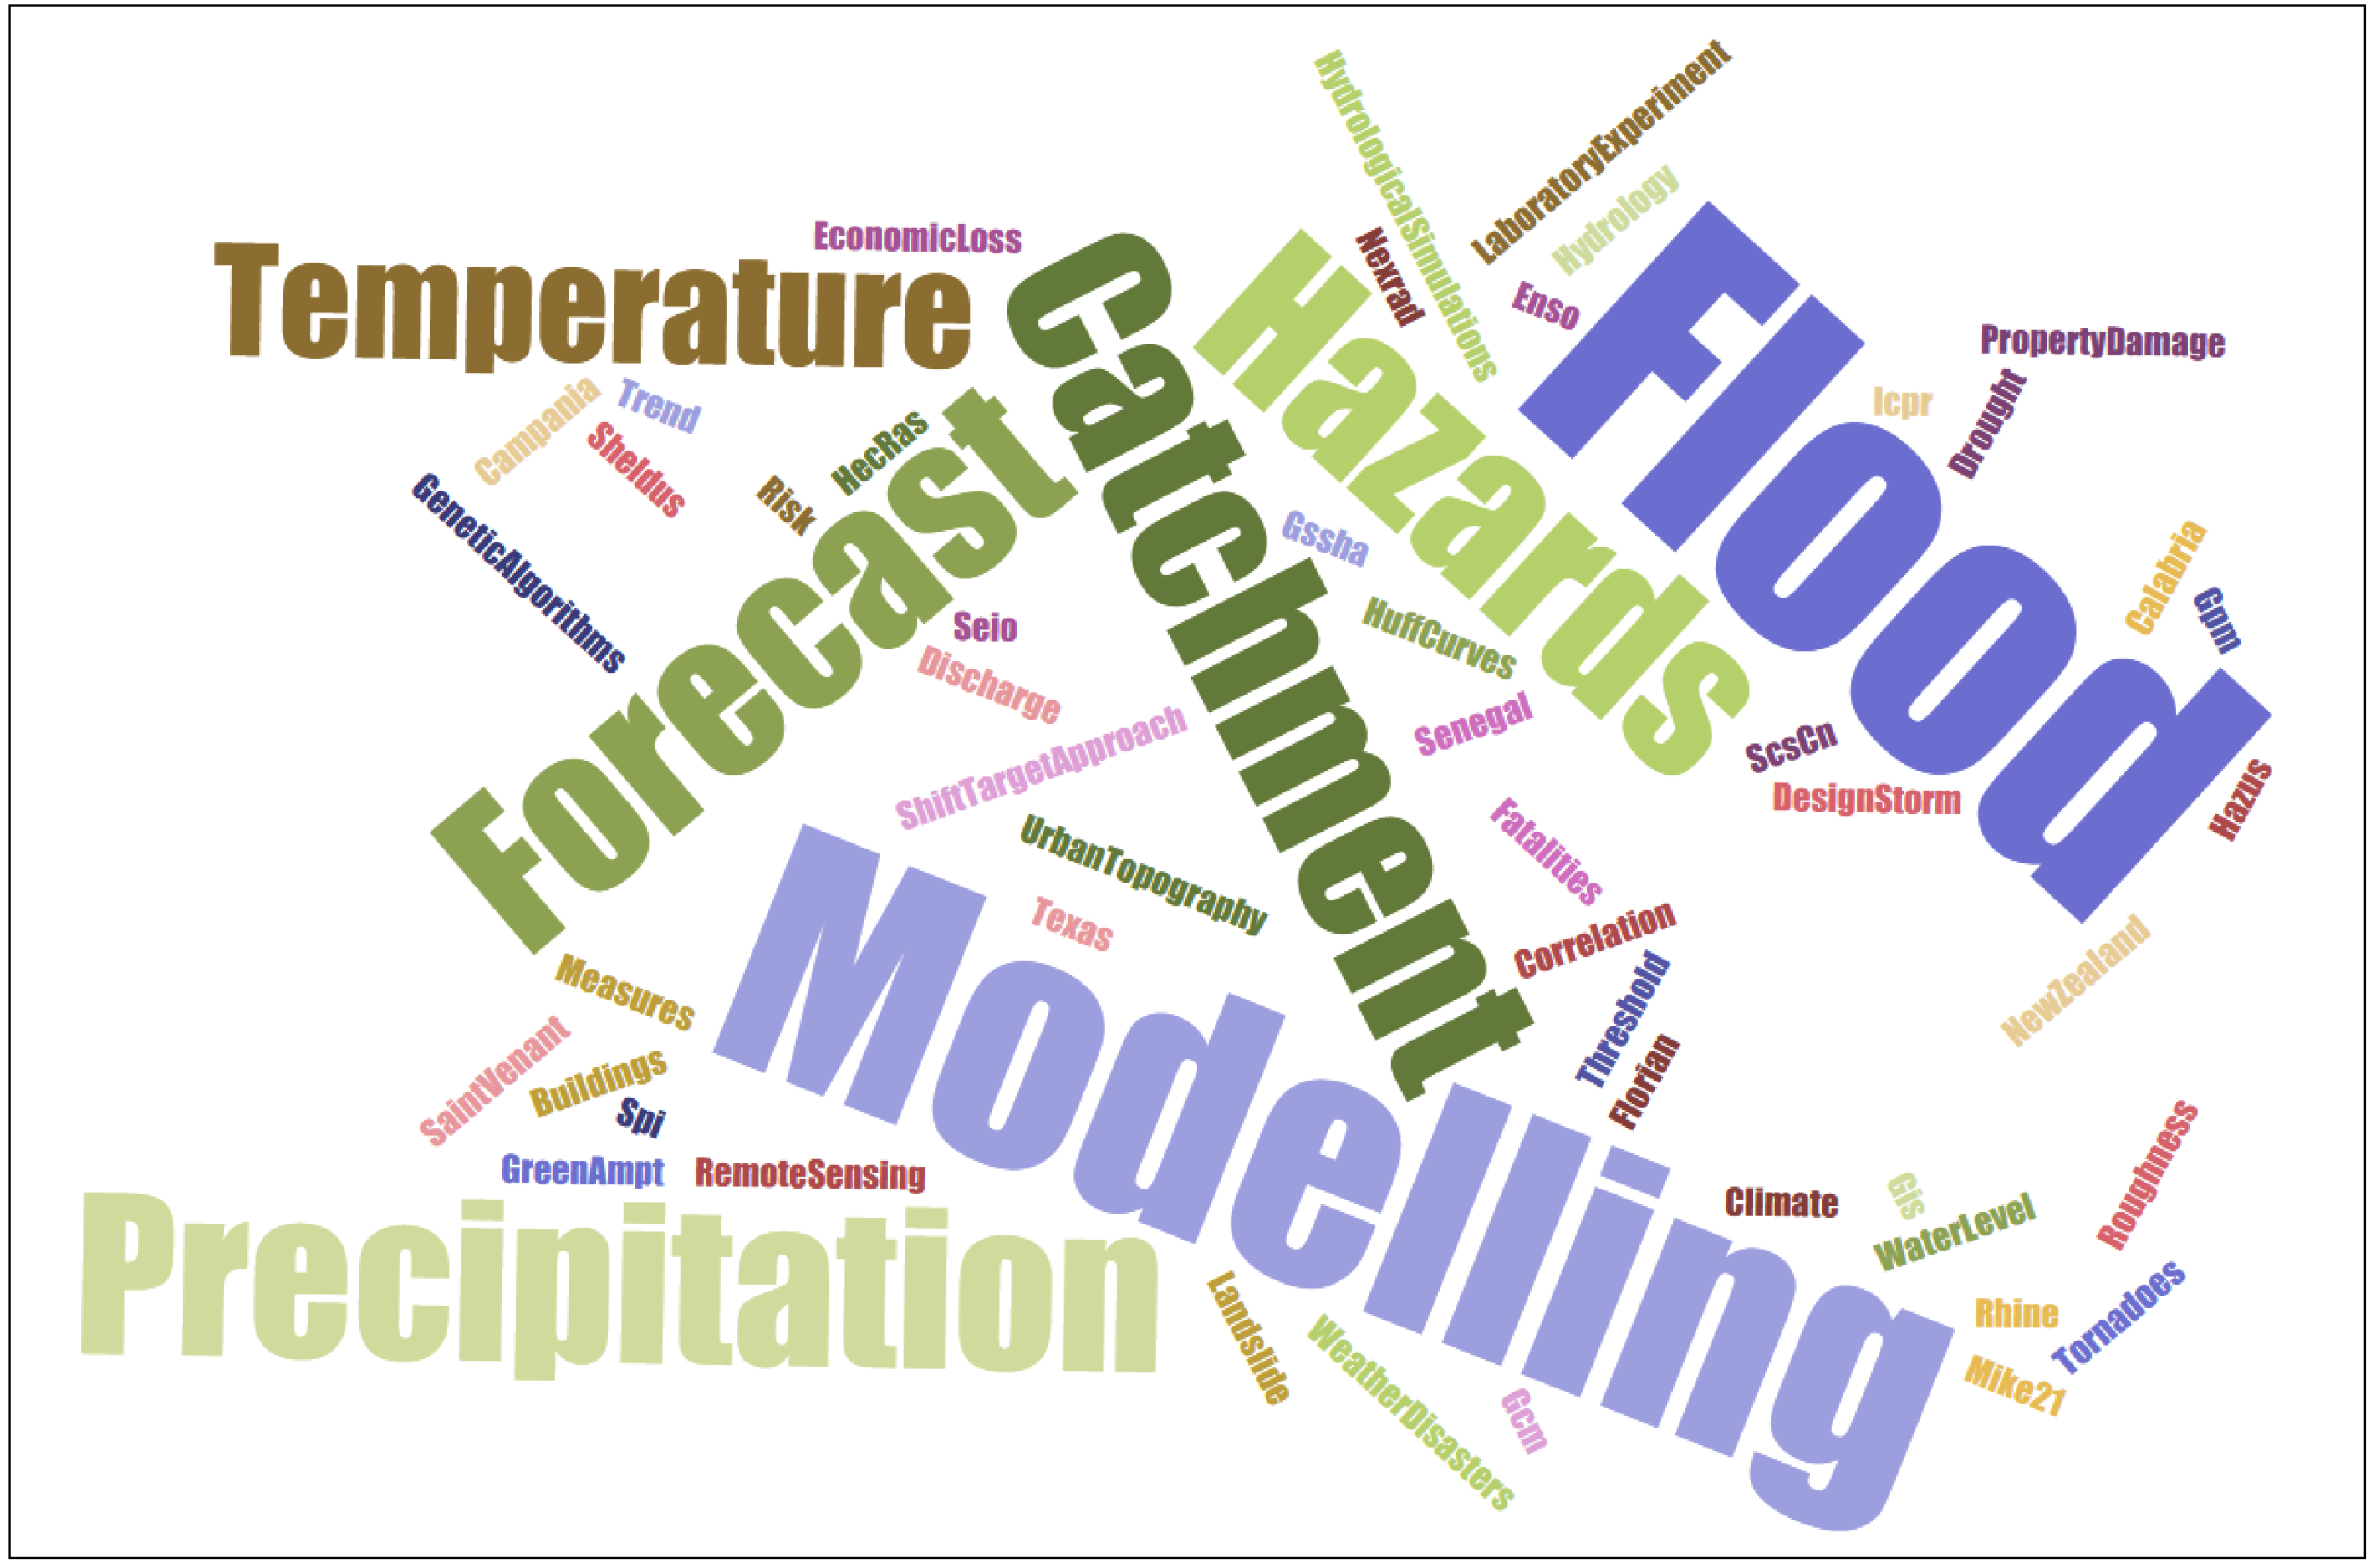
Figure 2 shows the word cloud of the keywords published in the papers of the Special Issue. From the analysis of the word cloud, it can be easily seen that “Flood” is the predominant keyword, cited in 8 out of 13 articles, followed by “Modelling” (6 out of 13), and “Catchment” (or basin) and “Precipitation” (or rainfall), which have each been cited in 3 papers.
3. Overview of the Special Issue Contributions
Terranova et al. [
4] applied the GASAKe, an empirical-hydrological model that aims at forecasting the time of occurrence of landslides, in four case studies in two different regions of Italy—three rock slides in Calabria and one soil slip in Campania. As a result, for two of the Calabrian rock slides, the activation dates were correctly predicted by the model, probably thanks to an accurate knowledge of the activation history of the landslide and a proper hydrological characterization of the site. For such cases, GASAKe could be applied to predict the timing of activation of future landslide activations in the same areas. In the other two cases, weaker model performances have been detected, probably because of an inaccurate knowledge of the activation dates and/or rainfall series.
Bezak et al. [
5] investigated the impact of the design rainfall on the combined 1D/2D hydraulic modelling results in the Glinščica Stream catchment (Slovenia), which is ungauged in terms of discharges. In particular, Bezak et al. [
5] evaluated 10 different design rainfall events (scenarios) that were used as inputs to the hydrological model. Using calibrated and validated hydrological models, the inputs for the hydraulic model were determined. The results indicated that the selection of the design rainfall event should be regarded as an important step, as the hydraulic modelling results for different scenarios differ significantly. As an example, the maximum flooded area extent was twice as large as the minimum one, and the maximum water velocity over flooded areas was more than 10 times larger than the minimum one. This means that the design rainfall definition can significantly influence the hydraulic modelling results, leading to the production of very different flood hazard maps, and consequently the planning of very different flood protection schemes.
Beretta et al. [
6] tested three different methods to simulate the influence of buildings on flood inundation by performing a number of laboratory experiments carried out with a simplified urban district physical model, and reconstructing results with a hydraulic mathematical model considering both the solution of the full shallow water equations and the diffusive simplification. Simplified methods were also tested for the simulation of a real flood event, which occurred in 2013 in the city of Olbia, Italy. The results showed that use of a 2D diffusive model and setting a high friction instead of detailed building geometry are effective methods to assess flood inundation extent.
Lombardi et al. [
7] suggested a low computational cost method to produce a probabilistic flood prediction system using a single forecast precipitation scenario perturbed via a spatial shift. The method was applied to three basins located in the northern part of Milan city (northern Italy): Seveso, Olona, and Lambro. To produce hydro-meteorological simulations and forecasts, a flood forecasting system, which comprises the physically-based rainfall-runoff hydrological model FEST-WB and the MOLOCH meteorological model, has been used. In particular, the performance of the shift-target approach was compared with the “unperturbed” MOLOCH forecast over a period of four years. The results showed how the shift-target approach complements the deterministic MOLOCH-based flood forecast for warning purposes.
Bouvier et al. [
8] analyzed the skill of two well-known event-based models, the Soil Conservation Service model and the Green-Ampt model, in reproducing the flood processes in a semi-arid agricultural catchment of Senegal (Ndiba). In particular, twenty-eight flood events have been extracted and modelled. As a result, both the models were able to reproduce the flood events after calibration, but they had to account for the fact that the infiltration processes are highly dependent on the tillage of the soils and the growing of the crops during the rainy season, which made the initialization of the event-based models difficult. Specifically, the Soil Conservation Service model performed better than the Green-Ampt model, because the latter was very sensitive to the variability of the hydraulic conductivity at saturation. The variability of the parameters of the models highlights the complexity of this kind of cultivated catchment, with highly non-stationary conditions.
Caloiero [
9] studied dry and wet periods in New Zealand using the Standardized Precipitation Index (SPI) and by means of a new graphical technique, the Innovative Trend Analysis (ITA), which allows trend identification of the low, medium, and high values of a series. The results show that, in every area currently subject to drought, an increase of this phenomenon can be expected. Specifically, the results of the paper highlighted that agricultural regions on the eastern side of the South Island, as well as the north-eastern regions of the North Island, are the most consistently vulnerable areas. In fact, in these regions, the trend analysis mainly showed a general reduction in all the values of the SPI; that is, a tendency toward heavier droughts and weaker wet periods.
Paul et al. [
10] analyzed the fatality rates caused by hydrometeorological disasters in Texas for the period 1959–2016 in an effort to identify counties and metropolitan areas that have a greater risk for particular hydrometeorological disasters. The study examined temporal trends, spatial variations, and demographic characteristics of the victims from 1959–2016. The results showed that the number of hydrometeorological fatalities in Texas has increased over the 58-year study period, but the per capita fatalities have significantly decreased. Moreover, seasonal and monthly stratification identifies spring and summer as the deadliest seasons, with the month of May registering the highest number of total fatalities dominated by flooding and tornado fatalities. Finally, demographic trends of hydrometeorological disaster fatalities indicated approximately twice the amount of male fatalities than female fatalities from 1959–2016 and that adults are the highest fatality risk group overall.
Hossain et al. [
11] assessed the efficiency of a non-linear regression technique in predicting long-term seasonal rainfall. The non-linear models were developed using the lagged (past) values of the climate drivers, which have a significant correlation with rainfall. More specifically, the capabilities of south-eastern Indian Ocean and El Nino Southern Oscillation were assessed in reproducing the rainfall characteristics using the non-linear regression approach. Three rainfall stations located in the Australian Capital Territory were selected as a case study. The analysis suggested that the predictors that have the highest correlation with the predictands do not necessarily produce the least errors in rainfall forecasting. The outcomes of the analysis could help the watershed management authorities to adopt an efficient modelling technique by predicting long-term seasonal rainfall.
Furl et al. [
12] investigated the performance of several satellite precipitation products with respect to gauge corrected ground-based radar estimations for nine moderate to high magnitude events across the Guadalupe River system in south Texas. The analysis was conducted across three nested watersheds (with area ranging from 200 to 10,000 km
2) to capture and quantify the effect of the scale on the propagation of the error. In order to understand the propagation of rainfall error into the predicted runoff, hydrologic model simulations were implemented. In particular, the Gridded Surface Subsurface Hydrologic Analysis, a physically-based fully distributed hydrologic model, forced with those ten satellite-based precipitation products, was used to simulate the rainfall-runoff relationship for the basins. The results showed that the satellite-based precipitation products provide very high spatiotemporal resolution precipitation estimates. However, the estimates lack accuracy, especially at a local scale. The products underestimate heavy storm events significantly, and the errors were amplified in the runoff hydrographs generated.
Islam et al. [
13] assessed the present and future water level and discharge in the Betna River (Bangladesh) by applying a process-based hydrodynamic model (MIKE 21 FM) to simulate water level and discharge under different future climate conditions. The MIKE 21 FM model for the Betna River was set up, calibrated, and validated using the observed water level and discharge data. The model was then used to project the future (2040s and 2090s) water level and discharge. The modelling results indicated that, compared with the baseline year (2014–2015), both the water level and the monsoon daily maximum discharge are expected to increase by the 2040s and by the 2090s, with the sea level rise mostly responsible for the increase in water level.
Ferrari et al. [
14] carried out a joint analysis of temperature and rainfall data by comparing time series recorded in some gauges located in Calabria (Southern Italy) over two distinct 30-year sub-periods (1951–1980 and 1981–2010). In particular, the anomalies of the seasonal values of temperature and precipitation, standardized by means of the mean values and the standard deviations of the period 1961–1990, were analyzed. The series has been selected based on the normality hypothesis. The isocontour lines of the probability density function for the bivariate Gaussian distribution have been considered as ellipses centered on the vector mean of each sub-period. Specifically, the displacements of the ellipses have been quantified and tested for each season, passing from the first sub-period to the following one. The main results concern a decreasing trend of both the temperature and the rainfall anomalies, predominantly in the winter and autumn seasons.
Paul and Sharif [
15] tried to verify the assertion that the increase in property damage is a combined contribution of stronger disasters as predicted by climate change models and increases in urban development in risk prone regions such as the Texas Gulf Coast. Within this aim, the study intended to provide a review of historic trends and types of damage and economic losses caused by hydrometeorological disasters impacting the coastal and inland property and infrastructure of Texas from 1960–2016. Spatial analysis of actual and normalized damage, as well as a supplemental assessment of three major disasters causing extensive damage in Texas (Hurricanes Carla 1961, Hurricane Alicia 1983, and Hurricane Ike 2008), highlight the risk as a function of wind or flooding damage and the growth of exposure in hazard prone regions.
Schmid-Breton et al. [
16] presented the method and the GIS-tool named “ICPR FloRiAn (Flood Risk Analysis)”, developed by the International Commission for the Protection of the Rhine (ICPR) to enable the broad-scale assessment of the effectiveness of flood risk management measures on the Rhine. Moreover, the first calculation results have been also shown. The tool uses flood hazard maps and associated recurrence periods for an overall damage and risk assessment for four receptors: human health, environment, culture heritage, and economic activity. For each receptor, a method is designed to calculate the impact of flooding and the effect of measures. The tool consists of three interacting modules: damage assessment, risk assessment, and measures. Calculations using this tool showed that the flood risk reduction target defined in the Action Plan on Floods of the ICPR in 1998 could be achieved with the measures already taken and those planned until 2030.


