Article

Analysis of Damage Caused by Hydrometeorological Disasters in Texas, 1960–2016

Department of Civil and Environmental Engineering, University of Texas at San Antonio, San Antonio, TX 78249, USA
*
Author to whom correspondence should be addressed.
Geosciences 2018, 8(10), 384; https://doi.org/10.3390/geosciences8100384
Submission received: 20 September 2018 / Revised: 16 October 2018 / Accepted: 18 October 2018 / Published: 20 October 2018
(This article belongs to the Special Issue Hydrological Hazard: Analysis and Prevention)

Abstract

:
Property damages caused by hydrometeorological disasters in Texas during the period 1960–2016 totaled $54.2 billion with hurricanes, tropical storms, and hail accounting for 56%, followed by flooding and severe thunderstorms responsible for 24% of the total damages. The current study provides normalized trends to support the assertion that the increase in property damage is a combined contribution of stronger disasters as predicted by climate change models and increases in urban development in risk prone regions such as the Texas Gulf Coast. A comparison of the temporal distribution of damages normalized by population and GDP resulted in a less statistically significant increasing trend per capita. Seasonal distribution highlights spring as the costliest season (March, April and May) while the hurricane season (June through November) is well aligned with the months of highest property damage. Normalization of property damage by GDP during 2001–2016 showed Dallas as the only metropolitan statistical area (MSA) with a significant increasing trend of the 25 MSAs in Texas. Spatial analysis of property damage per capita highlighted the regions that are at greater risk during and after a major disaster given their limited economic resources compared to more urbanized regions. Variation in the causes of damage (wind or water) and types of damage that a “Hurricane” can produce was investigated using Hazus model simulation. A comparison of published damage estimates at time of occurrence with simulation outputs for Hurricanes Carla, 1961; Alicia, 1983; and Ike, 2008 based on 2010 building exposure highlighted the impact of economic growth, susceptibility of wood building types, and the predominant cause of damage. Carla and Ike simulation models captured less than 50% of their respective estimates reported by other sources suggesting a broad geographical zone of damage with flood damage making a significant contribution. Conversely, the model damage estimates for Alicia are 50% higher than total damage estimates that were reported at the time of occurrence suggesting a substantial increase in building exposure susceptible to wind damage in the modeled region from 1983 – 2010.

1. Introduction

Recent decades have witnessed a worldwide increasing trend in both the number of natural disasters and the resulting damages. In the two most recent years of the current study, the number of natural catastrophic events has increased from 730 events ($103 billion) in 2015 to 750 events ($175 billion) in 2016. Weather-related events such as severe storms and floods had the most significant increase in frequency. During the period 1980–2016, there were a total of 16,584 natural disaster events resulting in $4.3 trillion of damage worldwide, of which 80% were either hydrological or meteorological events and 20% climatological or geophysical events [1]. During the period 1980–2017, the U.S. experienced 233 weather and climate related disasters in which overall damages/costs reached or exceeded $1 billion (2018 CPI adjusted) for a total cost exceeding $1.5 trillion [2]. As of the date of this study, 2017 has set the record for the most expensive year for damage due to natural disasters in recorded history both globally and in the U.S.
Assessment of damages due to historic natural disasters can include direct and indirect replacement cost estimates and/or insurance payout information. The former use in this study is more applicable in longitudinal research since it is a function of available exposure value and includes all property whether insured. The Congressional Research Service reported that inflation-adjusted disaster appropriations have increased 46% from a median of $6.2 billion between 2000 and 2006 to $9.1 billion between 2007 and 2013. The hurricanes in 2017 were immense and had a much costlier impact as they collided with growing cities with higher exposure. As more people compete for real estate thereby pushing up the property values in disaster prone regions such as coastal Florida, Texas, and California, the level of property damage also increases [3]. Damage data are widely available from public sources such as Munich Re and SHELDUS but typically exclude long-term indirect costs such as healthcare discontinuity and investment opportunity cost. Therefore, there is significant uncertainty in the exact total costs of natural disasters especially when comparing damage over time and across areas of varying degrees of urban development.
There is general agreement among public and private organizations and governmental agencies including the Government Accountability Office (GAO) that the cost of natural disasters in the U.S. is increasing at a significant rate. However, there are different perspectives on whether the increase is due to more violent storms or if the increase is due to the increase in population and wealth of property that is susceptible to damage. The U.S., as well as many other countries around the world, has experienced a rise in the number of natural disaster events and losses in the last four decades primarily due to convective events which are disaster events developing out of thunderstorms, such as hail, heavy precipitation, tornadoes and strong straight-line winds. Gall et al. noted that direct losses from convective disaster events such as hurricanes, flooding, and severe storms are increasing and contribute about 75% of the total damage with hurricane and flood losses having tripled over the last 50 years [4]. A study by Sander et al. found that 80% of all losses in the U.S. from 1970 to 2009 were due to convective events that had normalized losses exceeding $250 million. The study also suggests that there is a correlation between the increase in losses and the changes in meteorological potential for severe thunderstorms driven by changes in the humidity of the troposphere [5].
The scientific community largely in agreement that the rise of humidity in the air over the last decades can be attributed to warming oceans and increased evaporation from their surfaces. The intuitive consequence is that the increase in disaster events due to climate change is responsible for the increased damage losses. However, although the relationship of climate change to disaster occurrence is accepted, the relationship of disaster occurrence and the increasing trend in property damage is still a debated topic. One perspective is that the reported increasing damage and losses from hurricanes are not necessarily evidence of any increase in hurricane or tropical storm activity but are due only to the changes in population and wealth of the impacted regions [6,7,8]. Klotzbach et al. reported that damage caused by tropical cyclones adjusted for inflation and normalized by regional wealth and population factors did not show an increasing trend from 1900 to 2016 in the U.S., suggesting that the increase in damages are more a function of the increased regional wealth and property exposure than the increase in number of cyclones [8].
Texas is second in population (2010 Census) only to California and has a large and diverse terrain that combines a gulf coastline that is extremely susceptible to tropical storms and hurricanes; flooding and flash flooding at the base of the Balcones Escarpment running through the mid-section of the state; heat and drought conditions in the south/southwest; and rural cold extremes in the northwest panhandle. Hydrometeorological events are the predominant disasters in Texas and have resulted in a high number of fatalities and losses to infrastructure [9,10]. The overall population growth coupled with the rapid urban and coastal development in recent decades have created an environment in which fatality rates are decreasing per capita due to population increases but property damage is increasing due to more people with more valuable property moving into more vulnerable (disaster prone) regions. This nexus of nature and society will continue to grow in Texas in the foreseeable future and warrants ongoing analysis to help policy and decision-makers identify and prioritize the social vulnerabilities that can be managed to reduce the risk to Texas life and property. This study is intended to provide a review of historic trends and types of damage and economic losses caused by hydrometeorological disasters impacting the coastal and inland property and infrastructure of Texas from 1960 to 2016. Spatial analysis of actual and normalized damage as well as a supplemental assessment of three major disasters causing extensive damage in Texas (Hurricanes Carla 1961, Hurricane Alicia 1983, and Hurricane Ike 2008) highlight the risk as a function of wind or flooding damage and the growth of exposure in hazard prone regions.

2. Study Area

Texas is the second largest state in the United States by population and area, with a population of 27,862,596 and a land area of 695,662 km2. The southeast of Texas shares 591 km (367 miles) of coastline with the Gulf of Mexico and is susceptible to hurricanes and coastal flooding. A major topographical feature that affects weather disasters in Texas is the Balcones Escarpment that consists of a series of cliffs dropping from the Edwards Plateau to the Balcones Fault Line. This outer rim of the Hill Country is the formation point for many large thunderstorms, which frequently stall along the uplift and then hover over the region for prolonged rainfall. This flood prone region is known as “Flash Flood Alley” and includes counties having the fastest population growth rates in Texas [11].
Texas is the fastest growing state in the country by actual population and the fifth fastest by percentage. Between 1940 and 2010, Texas averaged 21.6% rate of growth per decade, compared to 13.3% for the U.S. Based on a conference presentation in 2013 by the Texas State Demographer’s Office, the overall population is projected to increase to 55 million by 2050 assuming a continuation of the 2000–2010 migration pattern The split between the rural and the urban share of the population has experienced a complete reversal from 1910 to 2010 with nine out of ten Texans living in one of the state’s 25 metropolitan areas and nearly two out of every three Texans living in Dallas-Fort Worth, Houston, Austin or San Antonio. Much of this growth is occurring within regions having high risk of hydrometeorological disasters such as hurricanes and flooding along the Texas Gulf Coast (e.g., Houston metropolitan area). Texas doubled the national job growth percentage in 2012 at 2.7% which translates to higher income and wealth exposure in preferred coastal regions of the state [12].

3. Data Sources

The primary source of property damage data is the Spatial Hazard Evaluation and Losses Database for the United States (SHELDUS) maintained by the Center for Emergency Management and Homeland Security at Arizona State University [13]. The database aggregates hazard losses across 18 different disaster categories. In Texas, the relevant disaster types are reduced to 15 with the omission of earthquakes, tsunamis, and volcanoes. SHELDUS losses are based on information from the National Centers for Environmental Information (NCEI, formerly the National Climatic Data Center, NCDC), the U.S. Geological Survey (USGS), and other credible sources. Building damage from the disaster case studies is generated from the HAZUS-MH hazard analysis model developed by the Federal Emergency Management Agency (FEMA) that contains detailed sociodemographic data for residences based on the 2010 census and Dun and Bradstreet data for commercial buildings [14]. The HAZUS hurricane model simulates the entire storm track with a series of engineering-based models and multiple nationwide inventory databases to develop damage and loss functions. The sub-models in the HAZUS hurricane model include a storm track model, a wind field model, a wind load model, a windborne debris model, a physical damage model, and building loss models [15,16]. The HAZUS hurricane model provides estimates of building damage and content losses and income-related business interruption due to the impact of wind damage to the infrastructure. The HAZUS model is a conservative estimate as noted by previous analytical comparisons [17,18,19].

4. Methodology

This study defines a hazard as a natural event that has the potential to cause harm and a disaster as the effect of the hazard on a community. Hydrometeorological disasters are defined as natural processes or phenomena of atmospheric, hydrological or oceanographic nature [20]. The analysis of annual distribution of damage for the entire state over the 57-year period (1960–2016) includes adjusted damage ($2016) and damage normalized by population and GDP. Before 1997, the basis of GDP was the Standard Industrial Classification (SIC). It transitioned from SIC to the North American Industry Classification System (NAICS) in 1997 resulting in two different GDP values for that year. The arithmetic average of the 1997 SIC GDP and 1997 NAICS GDP was used as the 1997 GDP in the analysis. The effect of population and GDP was also analyzed across metropolitan statistical areas (MSA) for the period (2001–2016) in which NAICS-based GDP data were available.
Normalization of the property damage provides an indication of the relationship between the damage, regional wealth, and population over time. The method used can be based on national adjustment factors as described by Pielke et al., in which the combined effects of inflation, wealth, and population were considered to adjust damage in the year occurrence to the perceived damage in the base year [7]. Wealth adjustment factor can be based on a number of metrics available through the U.S. Bureau of Economic Analysis (BEA) including Net Stock of Fixed Assets and Consumer Durable Goods or Gross Domestic Product (GDP). The current study used regional GDP made available by the USBEA by metropolitan statistical areas (MSA) as the wealth adjustment factor to normalize the damage trends. Normalization per capita was based on median population of either county or MSA with respect to the period analyzed.
Spearman’s rho and kendall’s tau were used for non-parametric correlation analysis to determine the statistical significance of property damage trends over time since both methods are conducive to environmental forensics but each has advantages and disadvantage. Spearman’s rho is more sensitive to error and better for larger sample size and kendall’s tau is less sensitive to error and more appropriate for smaller sample size [21]. Ranking of linear strength in the positive direction was selected based on general guidelines of correlation analysis: <0.3 (weak), 0.3–0.5 (moderate), and >0.5 (strong) with a similar opposite ranking for negative trends with a statistically significance based on a 5% significance level [22,23]. Quantitative boundaries for linear strength relationships were not adjusted for specific environmental forensics since the significance level represented by the p-value was the critical identifier of significance related for the analysis. The p-values associated with the correlation less than 0.05 were considered statistically significant with smaller p-values representing greater statistical significance.

5. Results

All property damage used in the historic trend analysis was inflation adjusted to $2016 unless otherwise specified as actual property damage in year of occurrence. Natural disasters caused more than $725 billion in property damage in the U.S. during 1960–2016 in which 8% ($54.2 billion) was due to Texas property damage. Convective storms such as thunderstorms, heavy precipitation, tornadoes and strong straight-line winds that cause extreme directional wind or object forces (hail), appear to result in a disproportionate amount of damage. Fifty-eight percent ($424 billion) of the total property damage in the U.S. was due to convective storm disasters. Texas property damage due to convective storm disasters accounted for 80% ($43 billion) of the total property damage. Hurricanes and tropical storms caused the greatest property damage in the U.S. and in Texas at 36% and 34% of their respective total property damage. Texas property damage was a significant percentage of the national property damage with hail accounting for 33%, followed by coastal property damage at 32% and drought damage at 28% (Table 1). In addition to the total extent of the property damage observed during the 57-year period, the current study analyzed temporal distribution of damage which indicated a distinct increasing annual trend as well as seasonal variation that may reflect some influence of climate change. As suggested by Sander et al., the changes in meteorological potential for severe thunderstorms driven by changes in the humidity of the troposphere (rise of humidity in the air over the last decades can be attributed to warming oceans and increased evaporation from their surfaces) may be contributing to the increase in hurricane winds and rainfall [5]. This increase in magnitude coupled with the increase in exposure will continue to result in escalating property damage particularly along hurricane prone regions.

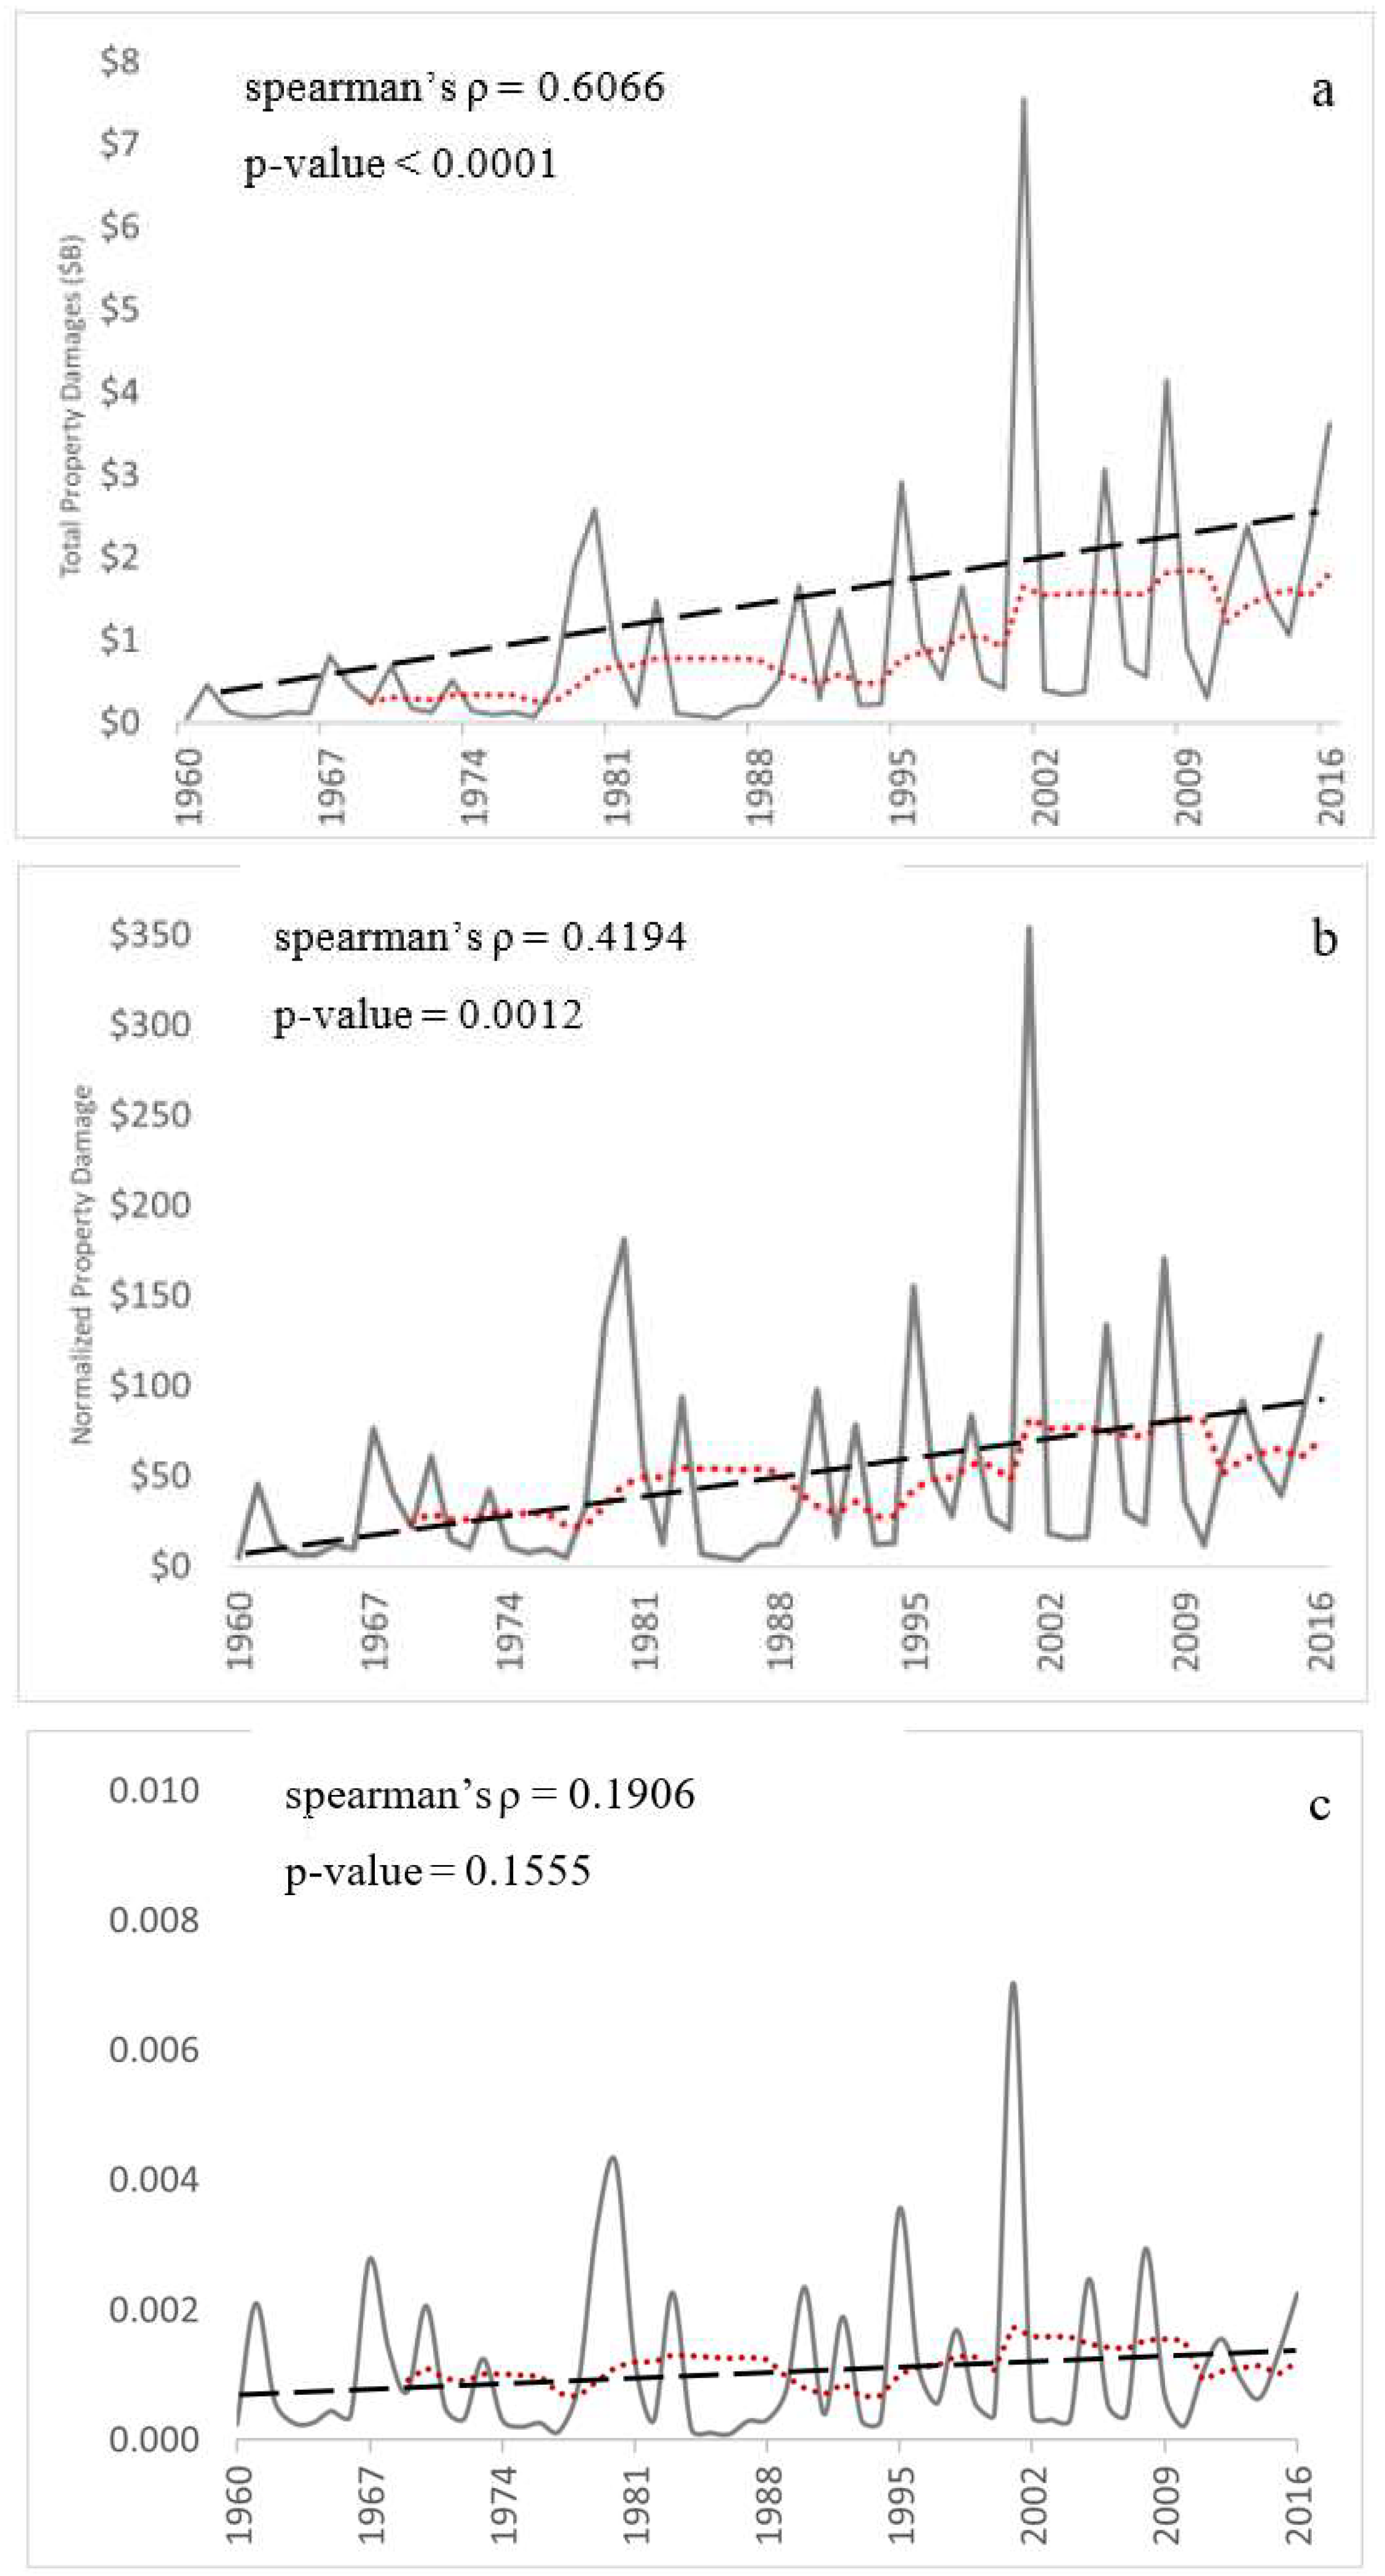
5.1. Annual Distribution of Damage

The average annual property damage between 1960 and 2016 is $951,075,059 ($2016) with a significant increasing trend (p-value < 0.0001 at the 5% significance level) (Figure 1a). Major disaster events such as hurricanes, tropical storms, widespread flooding in 1980, 1983 (Alicia), 1996, 2001 (Allison), 2005, and 2008 (Ike) resulted in the high variability of actual property damage over the 57-year period (coefficient of variation (COV) = 1.65) that is reduced to COV = 1.38 after adjusting the property damage to 2016 U.S. dollars.
Adjusted property damage per capita has a significant positive trend suggesting that the inflation rate outpaced the population growth. Actual property damage per GDP displays a non-significant positive trend display increasing trends over time highlighting substantial growth of the economy specifically building exposure susceptible to damage. The coefficient of variation of the damage per capita over the study period is 1.22 and has a statistically significant increasing trend (spearman’s ρ = 0.4194, p-value = 0.0012) at the 5% significance level (Figure 1b). GDP appears to be a stronger contributor to the time series increase compared to population given the reduction in trend strength and significance (spearman’s ρ = 0.1906, p-value = 0.1555) at the 5% level (Figure 1c). A secondary verification of linear strength and significance using Kendall’s tau reduced the linear strength but did not change the significance in either normalization trends, respectively (kendall τ = 0.2897, p-value = 0.0015 and kendall τ = 0.1278, p-value = 0.1621). Furthermore, GDP normalization of damage results in the greatest reduction in variability (COV = 1.13).

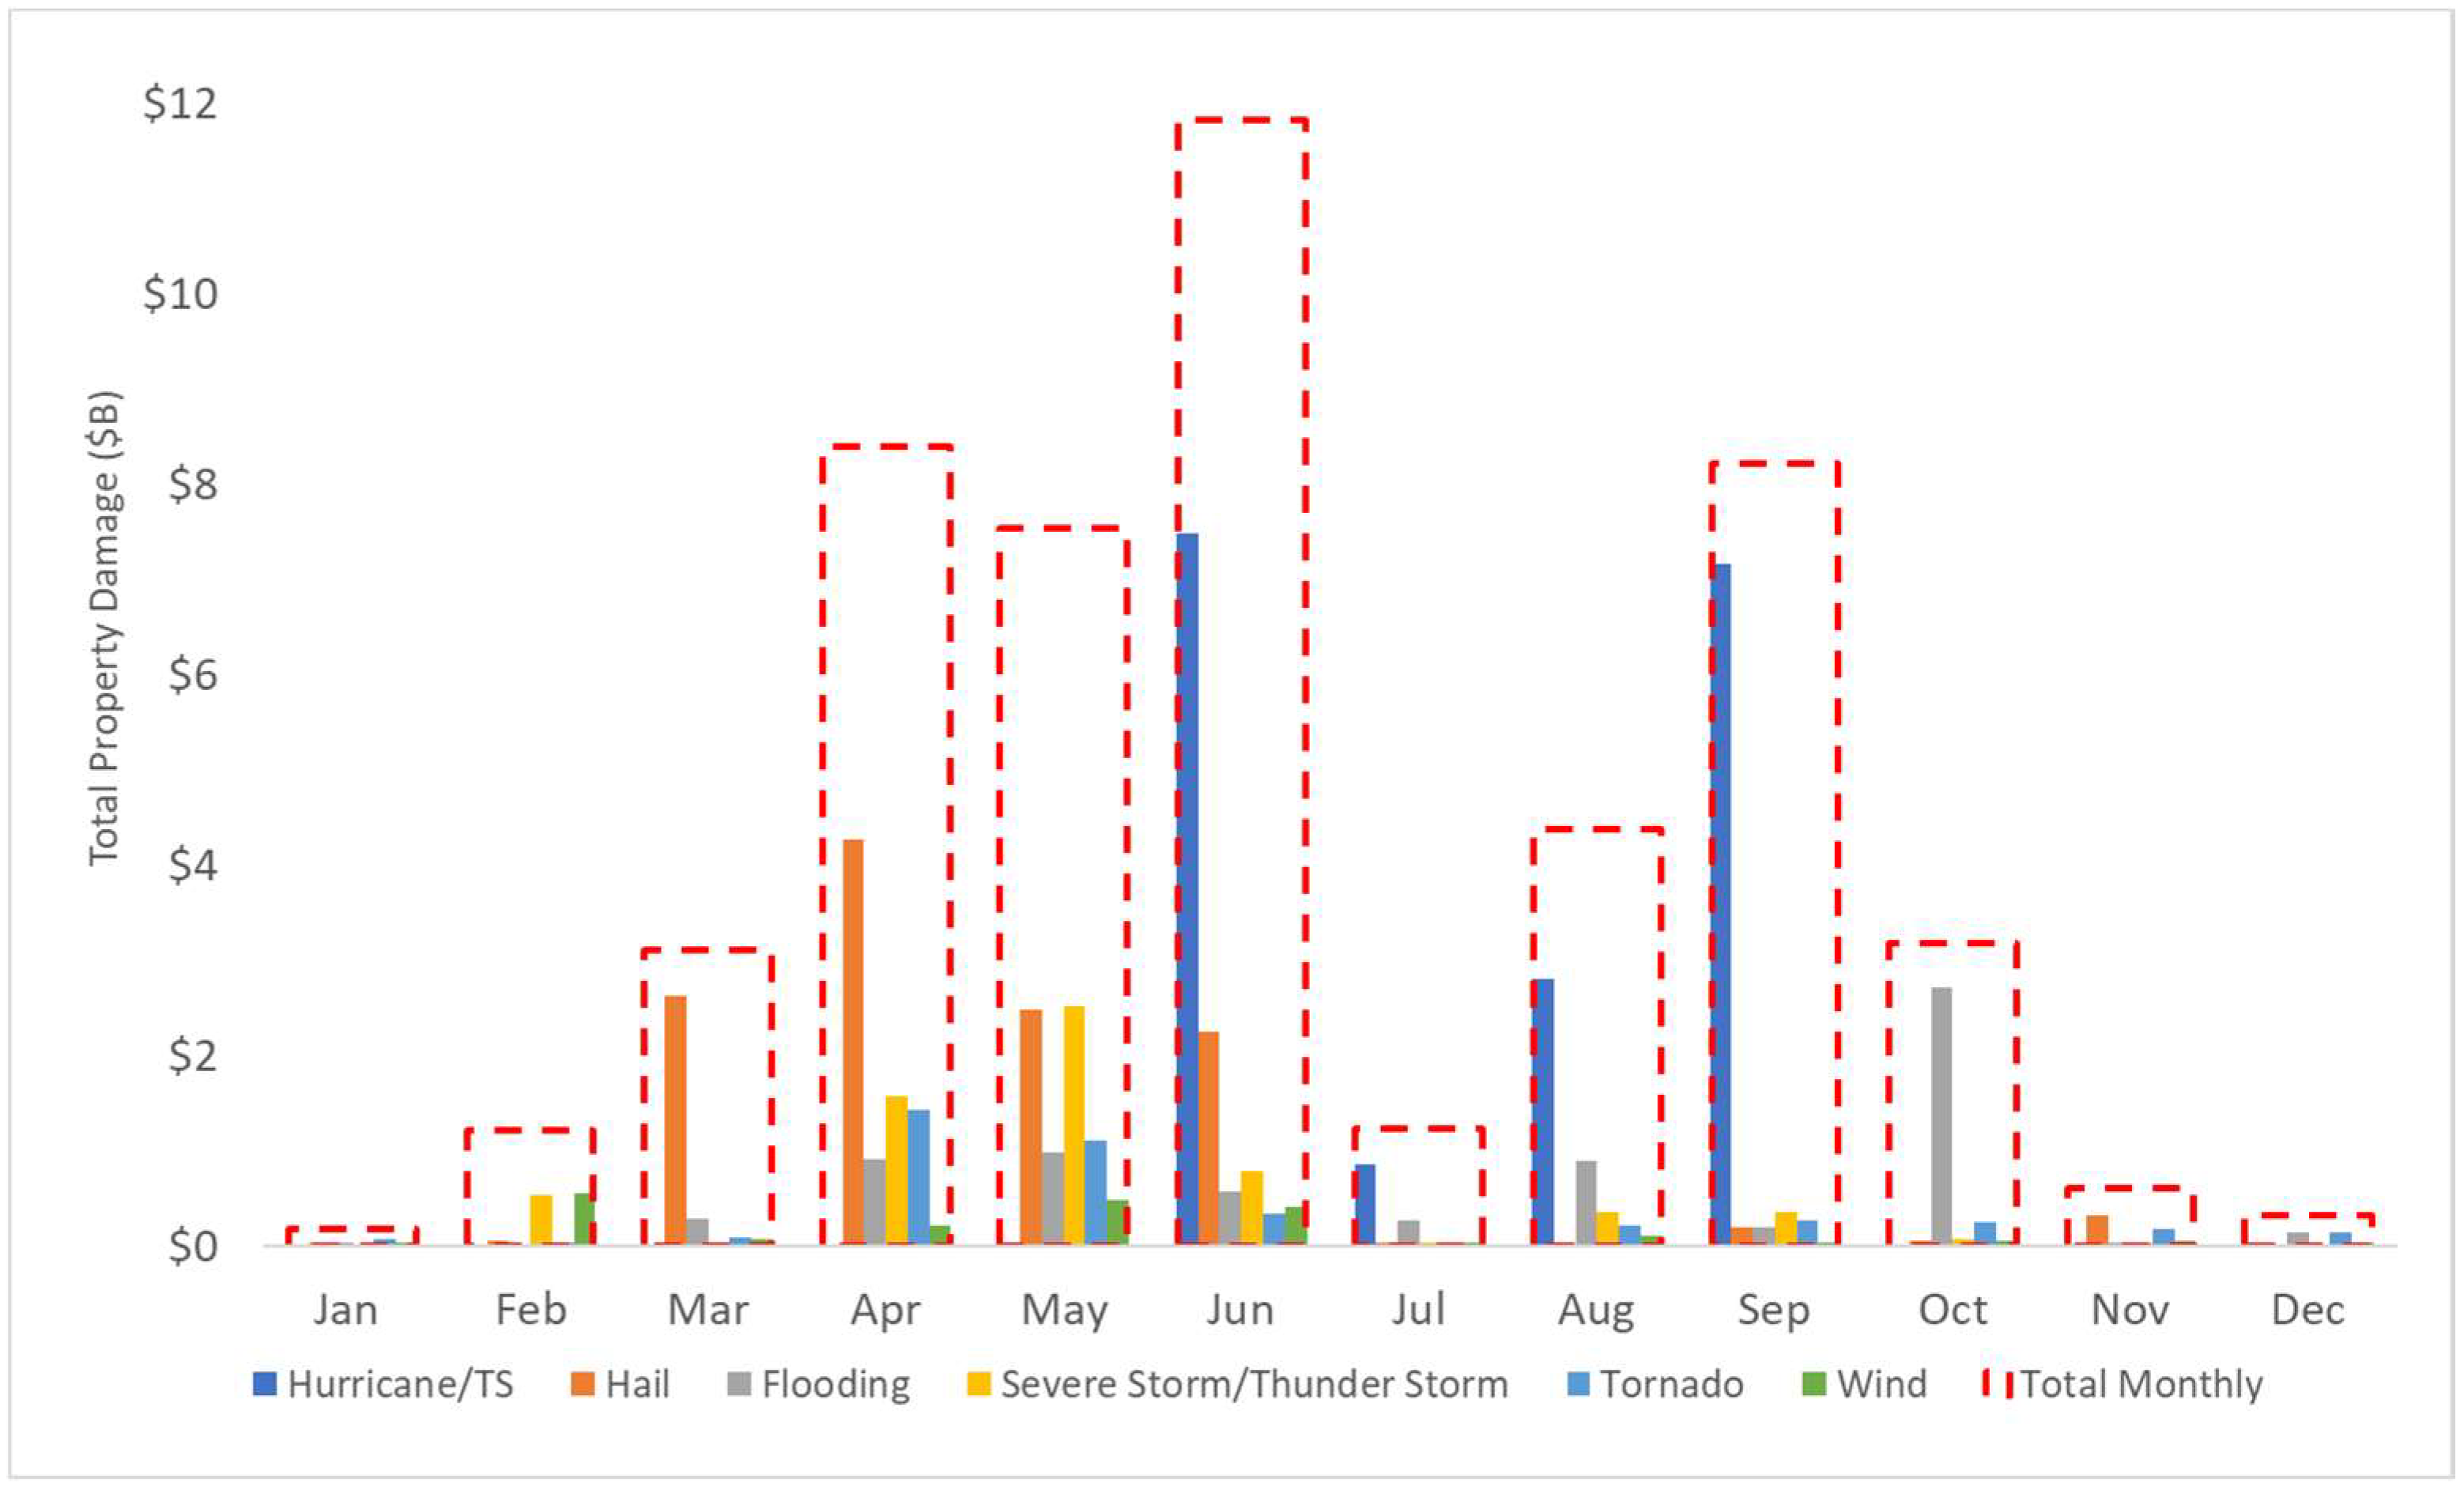
5.2. Monthly Distribution of Damage

Monthly distribution of damage highlights a significant difference between damages incurring in Winter and those incurring in the other seasons. The winter months (December, January, and February) account for only 5% of the total damages. Spring is the costliest season (March, April, and May) accounting for 36% of the total damages followed by summer (34%) and fall (25%). The monthly analysis of property damage suggests that the property damage is in sync with the North American hurricane season. A tri-modal distribution with peaks in April, June, and October can be observed in Figure 2. Hail was the predominant cause of damage in April and hurricanes/tropical storms the dominant contributor to damage in June and September.
Approximately 93% of the total property damage during 1960–2016 was caused by six of the 13 disaster types listed in Table 1. Monthly stratification of property damages caused by the hydrometeorological disasters shows that hurricane and tropical storms are the leading cause in four of the 12 months (June, July, August, and September). Hail damage is the leading cause of property damage in the months of March, April, May, and November. Flooding damage is highest in October. Hail, severe/thunderstorms, tornado, and wind overlap from February to June indicating the favorable seasonal conditions for storms that have intense wind and hail characteristics. The total damage for this period was $24.8 billion in property damage (46% of total). The bimodal annual characteristic of damage due to hurricanes and tropical storms is highlighted as well peaking in June and September when meteorological conditions are most favorable. The N.A. Atlantic hurricane season is 1 June–30 November and is closely aligned with the monthly damage totals suggesting a relationship between hurricanes and flooding. Flooding damage begins at the end of the June (peak hurricane month) and spikes in October toward the end of hurricane season which is likely a result of saturated conditions due to the cumulative amount of precipitation throughout the hurricane season.

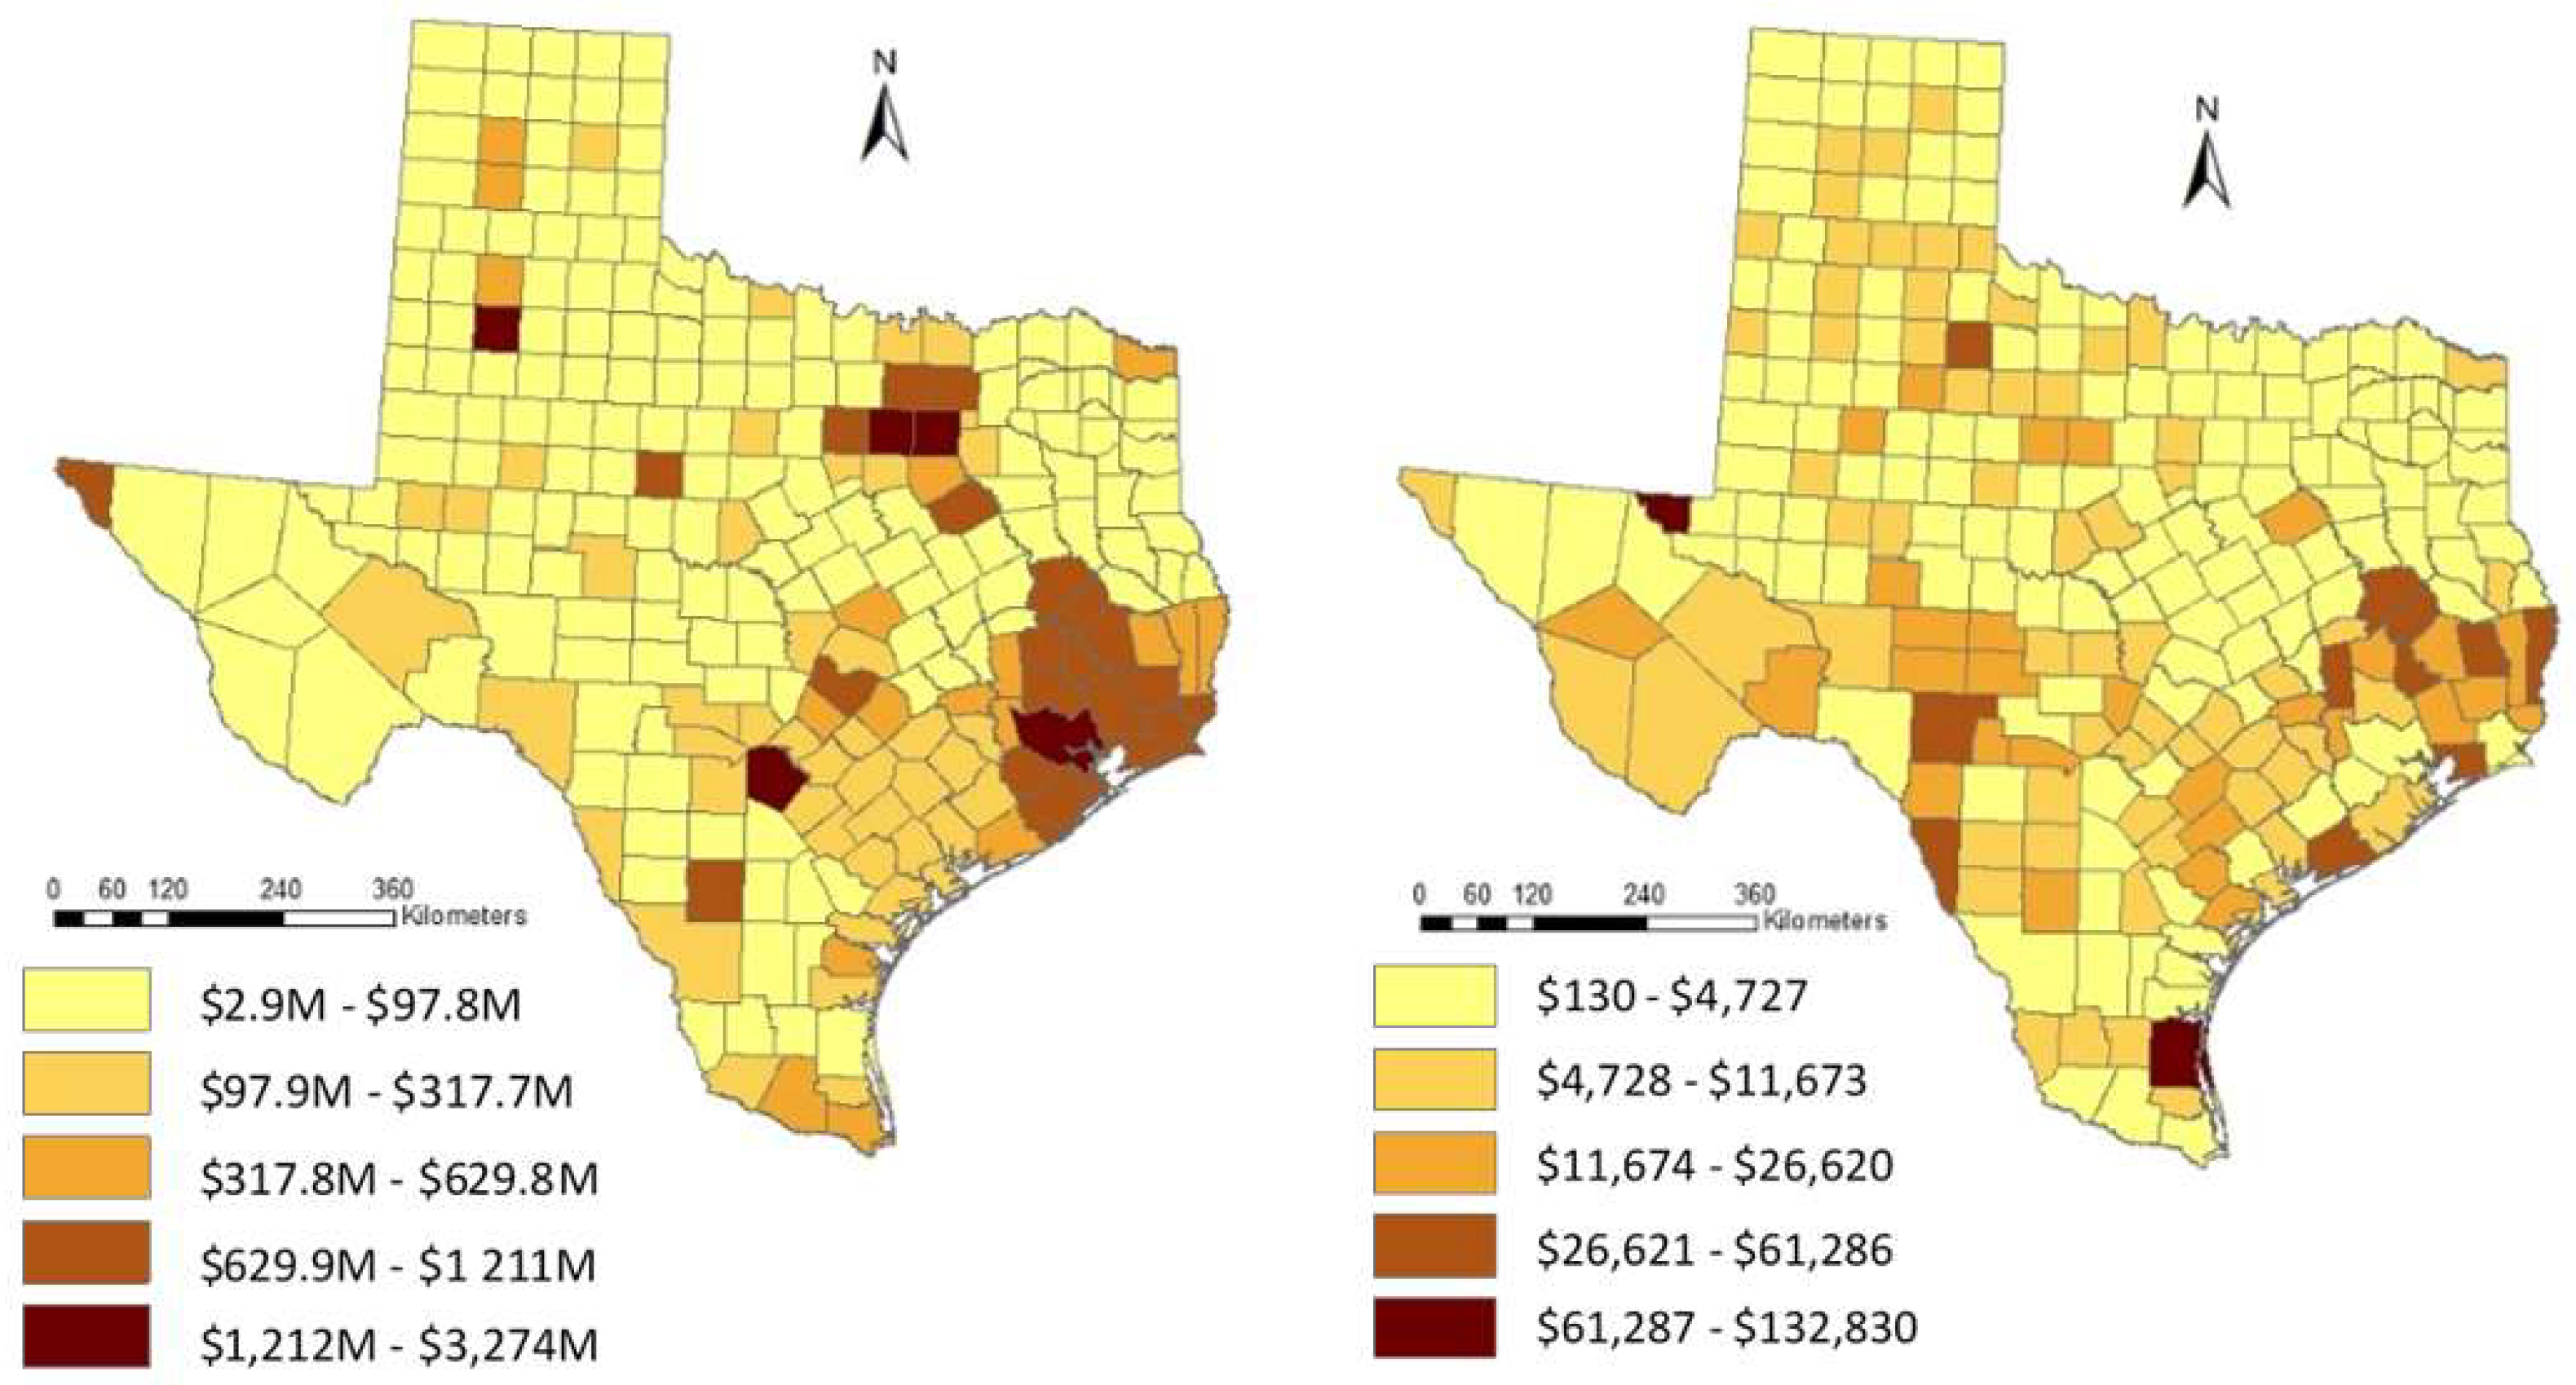
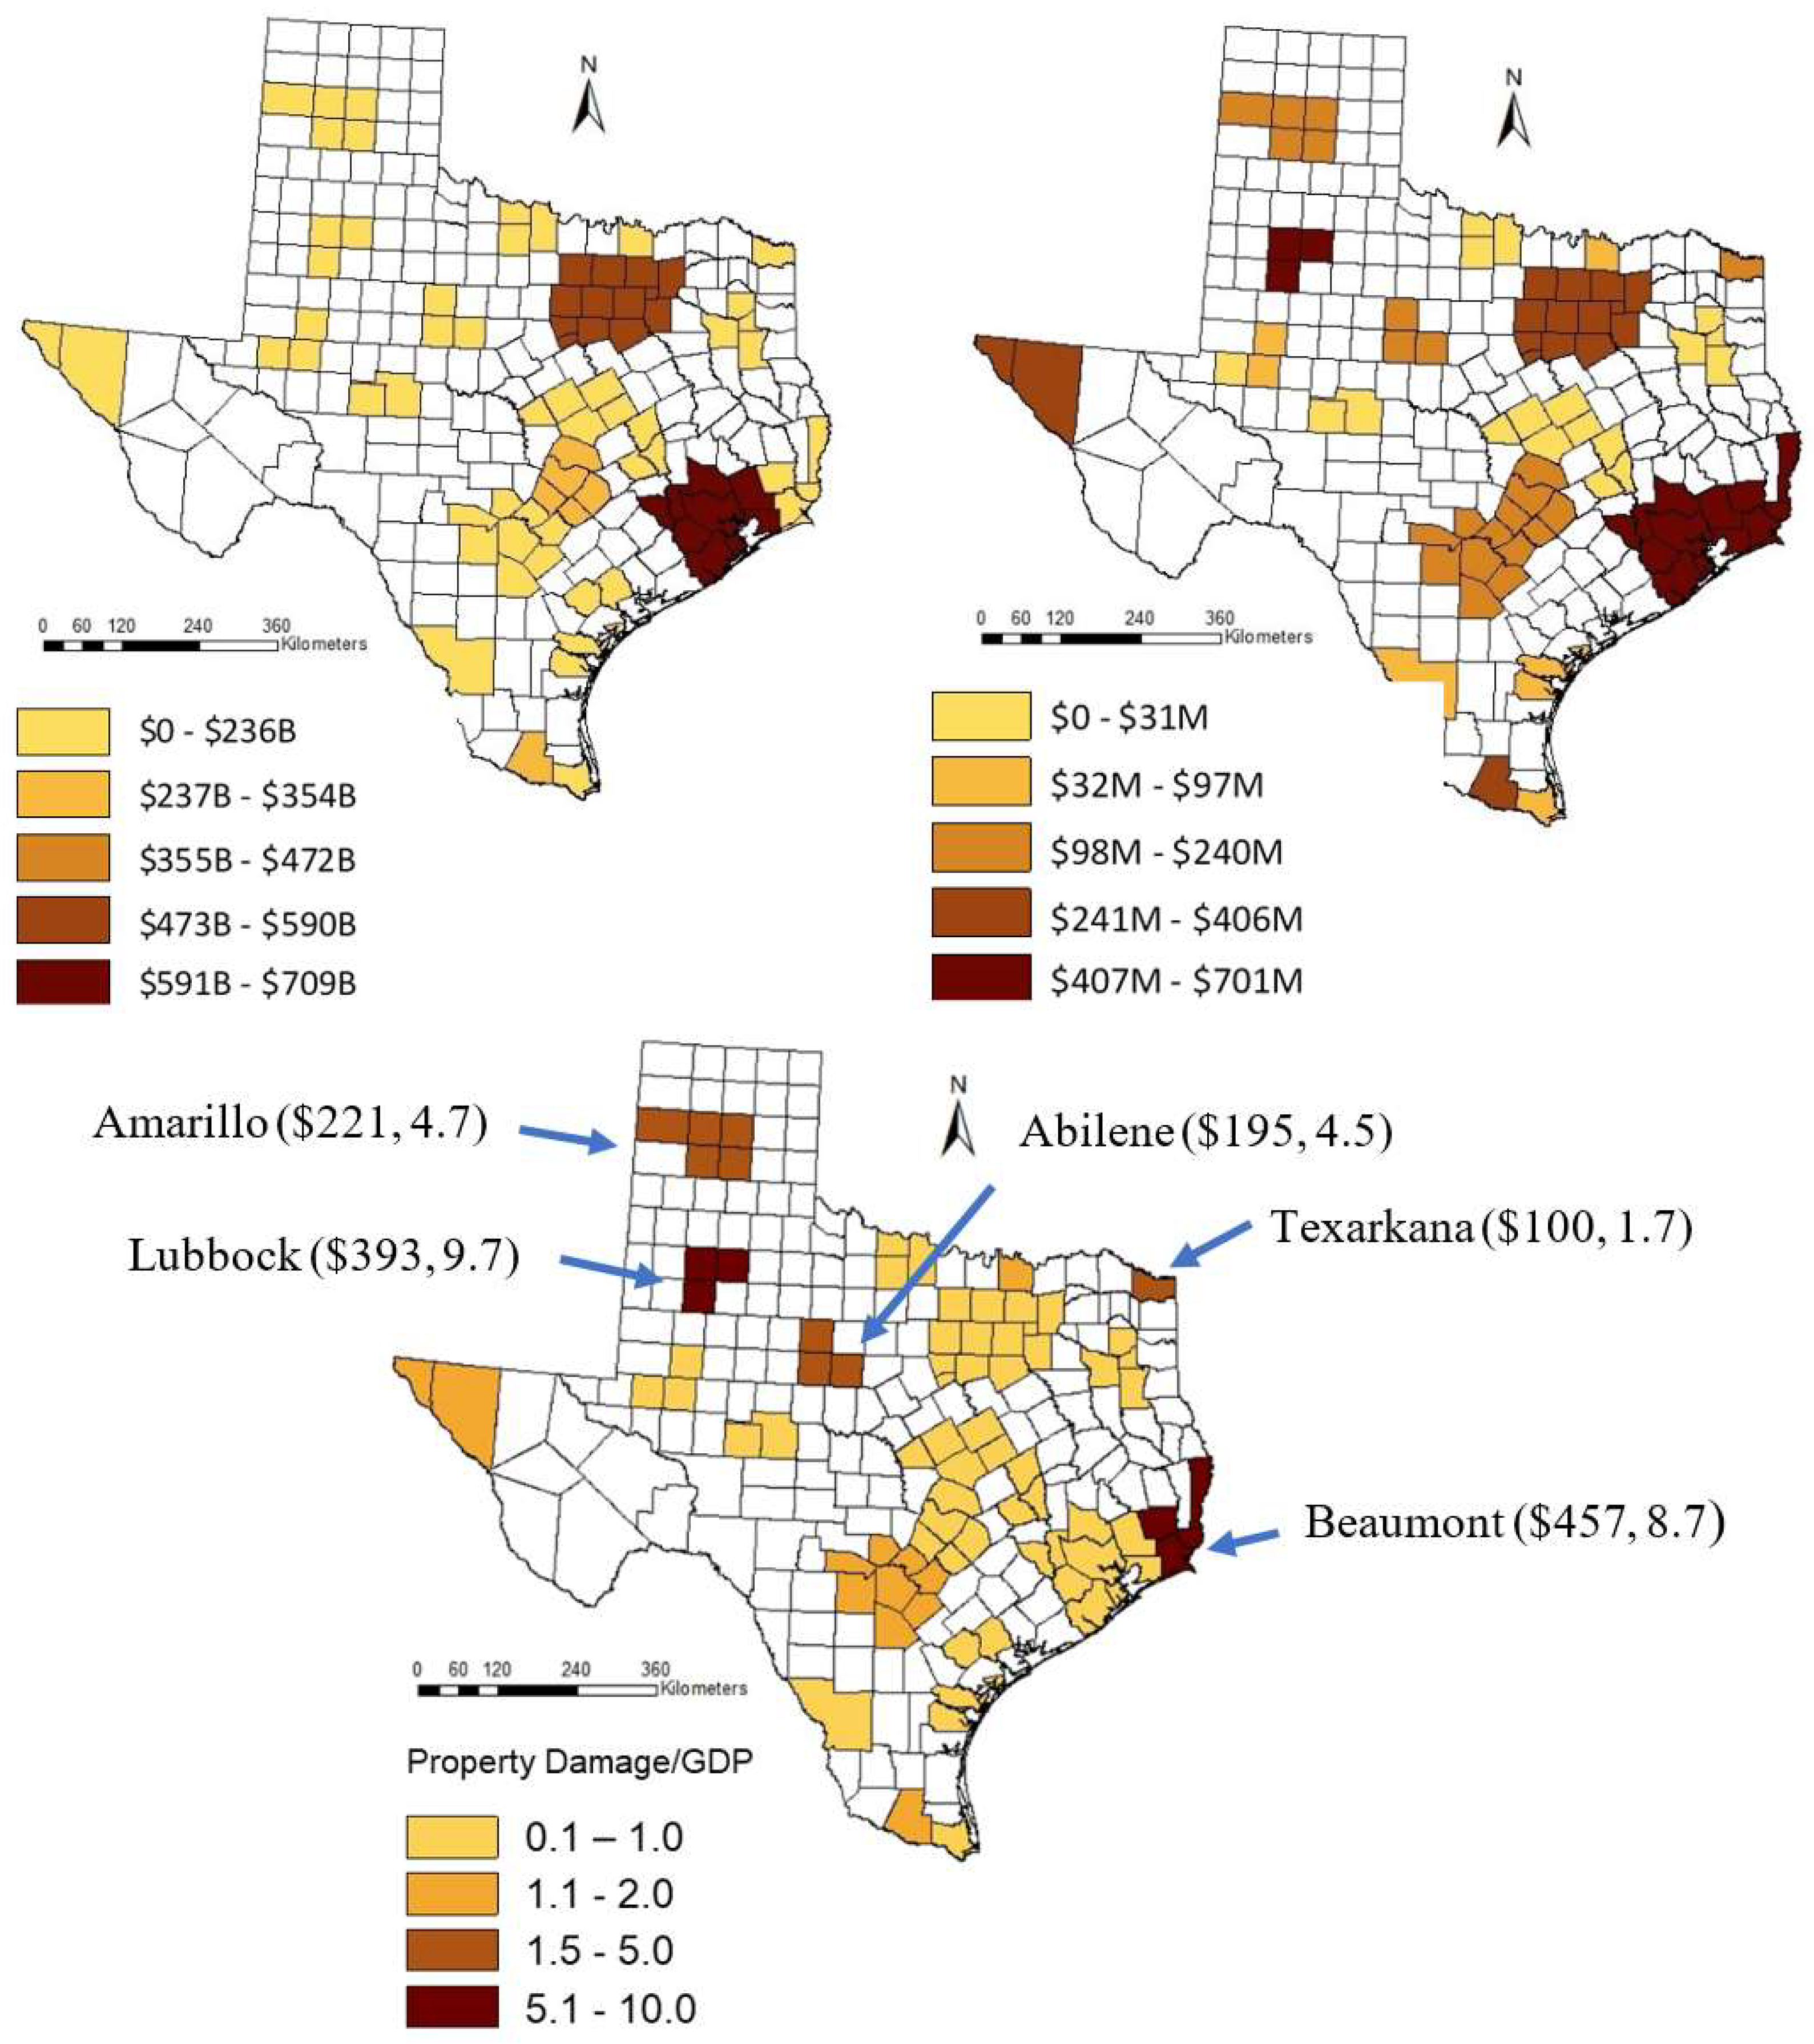
5.3. Regional Normalized Trends and Spatial Distribution of Damage

Additional analysis of damage and risk to property as a result of natural disasters included groupings of counties known as metropolitan statistical areas (MSAs). The MSAs are currently the lowest level in which the U.S. BEA maintains GDP data. County level GDP is not yet available but is under development [24]. The MSAs represent economic subdivisions in which the wealth measured as GDP for each county within the MSA is combined and represented as the total GDP for the MSA. In Texas from 2001 to 2016, 18 of the 25 MSAs had greater average annual increase in GDP than the U.S. annual average (4.8%). The Texas MSAs with the highest relative GDP are centralized around the major cities of Houston, Dallas/Ft. Worth, San Antonio, Austin, and El Paso.
The limited time study of 16 years is not a large sample size, but can provide high-level perspectives on the effects of wealth on property damage across the geographically dispersed MSAs. Actual property damage normalized by the GDP for the MSAs follow increasing trends similar to the statewide annual trends (1960–2016) for 44% of the MSAs. Fourteen of the 25 Texas MSAs exhibited non-significant decreasing but trends at the 5% significance level and 11 MSAs exhibited increasing trend in property damage with only the Dallas MSA indicating a strong linear relationship and statistically significant trend (ρ = 0.8176, p-value = 0.0001). The Dallas and Houston MSAs had very similar total and annual average GDP yet had opposite trends suggesting that there is a significant difference in the periodicity of major damaging events over the 16-year period between the two regions. Dallas is an inland region that is prone to tornado and hail damage which caused almost all reported property damage in 2012 and 2016, while the property damage to the Houston regions is primarily due to hurricane winds and related flooding. The non-significant decreasing trend for the Houston coastal region reflects the extreme damage and irregular occurrence of hurricanes specifically in 2001 (TS Allison) and 2008 (Hurricane Ike) resulting in an inconsistent linear trend, while the tornado and hail damage events in the Dallas region are more frequent and continuous resulting in increasing in property damage due to increasing exposure.
Spatial comparison of property damage ($2016) for the period 1960–2016 shows regional differences in Texas with higher property damage concentrated in counties with high population and urban development. Not surprisingly, the regional density of property damage due to natural disasters is clustered around the four largest metropolitan areas (Houston, Dallas, Austin, and San Antonio) and is also in alignment with the raw fatality densities discussed in previous research [9,10]. This is expected since an area of greater property exposure is more susceptible to higher damage during a natural disaster event. Considering the property damage per capita and per GDP as the wealth indicator provides a closer look of the relationship of damage and exposure.
Distinct counties of high property damage without adjustment for population or wealth normalization over the 57-year period is depicted in Figure 3 (Left). The counties with the highest overall property damage were Harris, Dallas, Tarrant, Bexar, and Lubbock. Other than Lubbock, the counties with highest damage are counties with high population and wealth. Lubbock is unique in that, even though it is not a large urban center with high wealth, the county is affected by frequent damage due to multiple types of disaster, mostly hail, wind, severe storms, flooding, and tornados, that span over seasonal changes resulting in higher overall damages. Counties in coastal Texas and the “Flash Flood Alley” region show higher damage losses.
Normalizing the property damage by median population (1988) reveals that the most affected counties with highly urbanized counties have below average normalized damage (Figure 3, Right). The most significant effect of this normalization is observed in the counties surrounding the Houston and Dallas metropolitan areas which have a much lower per capita damage due to the high population density in the counties compared to counties near the Gulf coast, along the southern edge of the Balcones Escarpment in north Texas, and other sparsely populated counties.
As noted previously, the effect of population and wealth on property damage cannot currently be evaluated at the county level since the lowest level of sub-state GDP data is at the MSA level. The total adjusted property damage ($2016) and total GDP for all MSAs during 2001–2016 was $30 billion and $19 trillion, respectively. The Houston and Dallas MSAs had the highest total GDP by a large margin (four times that of the Austin MSA or San Antonio MSA). The average adjusted property damage per capita highlights the regions of relatively high property damage with low population increase over the 16-year period. Normalized actual property damage by GDP highlights the regions (MSA) with relatively high property damage and lower GDP (Table 2).
More than 75% of the Texas MSAs exceeded the national average annual growth in GDP (4.8%) during 2001–2016. The highest annual growth in GDP was noted in the Odessa (10%), Midland (9.1%), Austin (8.9%), McAllen (8.3%), and Tyler (7.5%) MSAs. The top MSAs for total property damage in Texas were Houston ($5.6 billion), Dallas ($5.3 billion), Beaumont ($2.8 billion), Lubbock ($1.9 billion), and San Antonio ($1.6 billion). The regions with larger increases in average annual GDP suggest that these areas may have a higher risk of increased property damage in future disaster events. The GDP and property damage for each MSA clearly identifies the Houston and the Dallas MSAs as the wealthiest regions that also experienced the greatest property damage. Several of the MSAs in the western counties such as Amarillo, Lubbock, and El Paso have significantly lower GDP but relatively high property damage resulting in an appreciable normalized risk of economic loss (Figure 4, top).
The annual average adjusted property damage per capita and property damage normalized by GDP highlights regions of greater risk (Figure 4, bottom). The lower populations and relative wealth of these types of regions such as Lubbock (290,805/$171 billion), Beaumont (403,190/$324 billion), Abilene (165,252/$95 billion), and Amarillo (251,933/$172 billion) can create a greater critical need for assistance after a major disaster given their respective historic property damage ($1.9 billion, $2.8 billion, $524 million, and $860 million, respectively) and their limited resources compared to more urbanized regions.

5.4. Detailed Event Damage

The preceding review of historic damage estimates provides an assessment of damage trends, regional wealth diversity, and the relative impacts of different types of disasters on regions with different economic status. The damage estimates were culled from the SHLEDUS database that only includes direct property damage estimates adjusted to 2016 U.S. dollars. Natural disasters are difficult to categorize since the disaster types can overlap. In the current study, SHELDUS differentiates damage caused between hurricanes, severe thunderstorms, hail, flooding, and tornados among other categories. However, in reality, the damage due to a major natural disaster such as a hurricane will be a combination of the hurricane high winds, the extreme rainfall, possible hail, and the subsequent flooding. Additionally, hurricanes sometimes spawn tornados that cause extensive damage which may or may not be attributed to the original hurricane. It can be of value to model specific disaster types in a specific region of known economic wealth to obtain additional details of the damage across specific types of damage and types of property and disruption to the economy such as transport, communication, utilities, and displacement costs can provide perspective to benefit the development of risk mitigation strategies.
Extensive research and development are ongoing to develop or improve simulation and prediction modelling systems in the field of natural disasters. A paper published and presented at the 4th International Conference on Emerging Ubiquitous Systems and Pervasive Networks highlights the development emphasis with focus on an agent-based methodological framework that allows for customizable desired observables [25]. Researchers at the NOAA Geophysical Fluid Dynamics Laboratory are currently in the process of enhancing the predictability of major weather events by replacing existing models with new generation prediction model known as the FV3 [26]. Disaster modeling is also a critical component in emergency management that facilitates response planning and prioritization of resources based on predicted aftermath of a major disaster. FEMA has developed the HAZUS-MH Multi-hazard damage estimation tool which allows for modeling of known historic or probabilistic disaster events in any region of the U.S. to facilitate the estimation of property damage, business and infrastructure interruption in a user-defined region and 2010 building exposure and population [27].
The assessment of the historic hurricane damage during 1960–2016 highlighted the changes to specific types of infrastructure damage based on growth in population and development. The damage and loss information generated by HAZUS is a snapshot of the types of damage that can be caused by a hurricane to different types of building, facilities, and utility systems and can be used as a risk assessment surrogate for other regions. HAZUS-MH (v.4.0) was used to model the specific damages that resulted from three historical hurricanes but using 2010 population, building and infrastructure exposure based on the regional Level 1 inventory imbedded in Hazus model with the output adjusted to 2014 exposure valuation. Hurricane Carla made landfall in 1961, Alicia made landfall in 1983, and Hurricane Ike made landfall in 2008. The total economic losses output from HAZUS also includes cost of business interruption such as lost wages and, displacement costs. The modeled hurricanes are representative of major storm events that caused at least 80% of all property damage in Texas in the year of occurrence. The counties included in the simulation were those in the immediate vicinity of landfall for the hurricanes since they have the greatest potential for damage due to high winds which is the main contributor to building damage. These counties are also representative of the types of building and infrastructure given the population and extent of economic development of the region. Results of the current study indicate that hurricanes caused the greatest percentage of total economic losses in Texas with each event representing the majority of damage in the given year. Three hurricanes occurring 22 years and 25 years apart were simulated to provide insight into the relative risk and economic loss across building types as well as show the variation in damage estimates as a function of wind damage, flood damage, regional development, and data source variation. The storm tracks and residential exposure for the three hurricanes generated by the Hazus hurricane model are depicted in Figure 5.

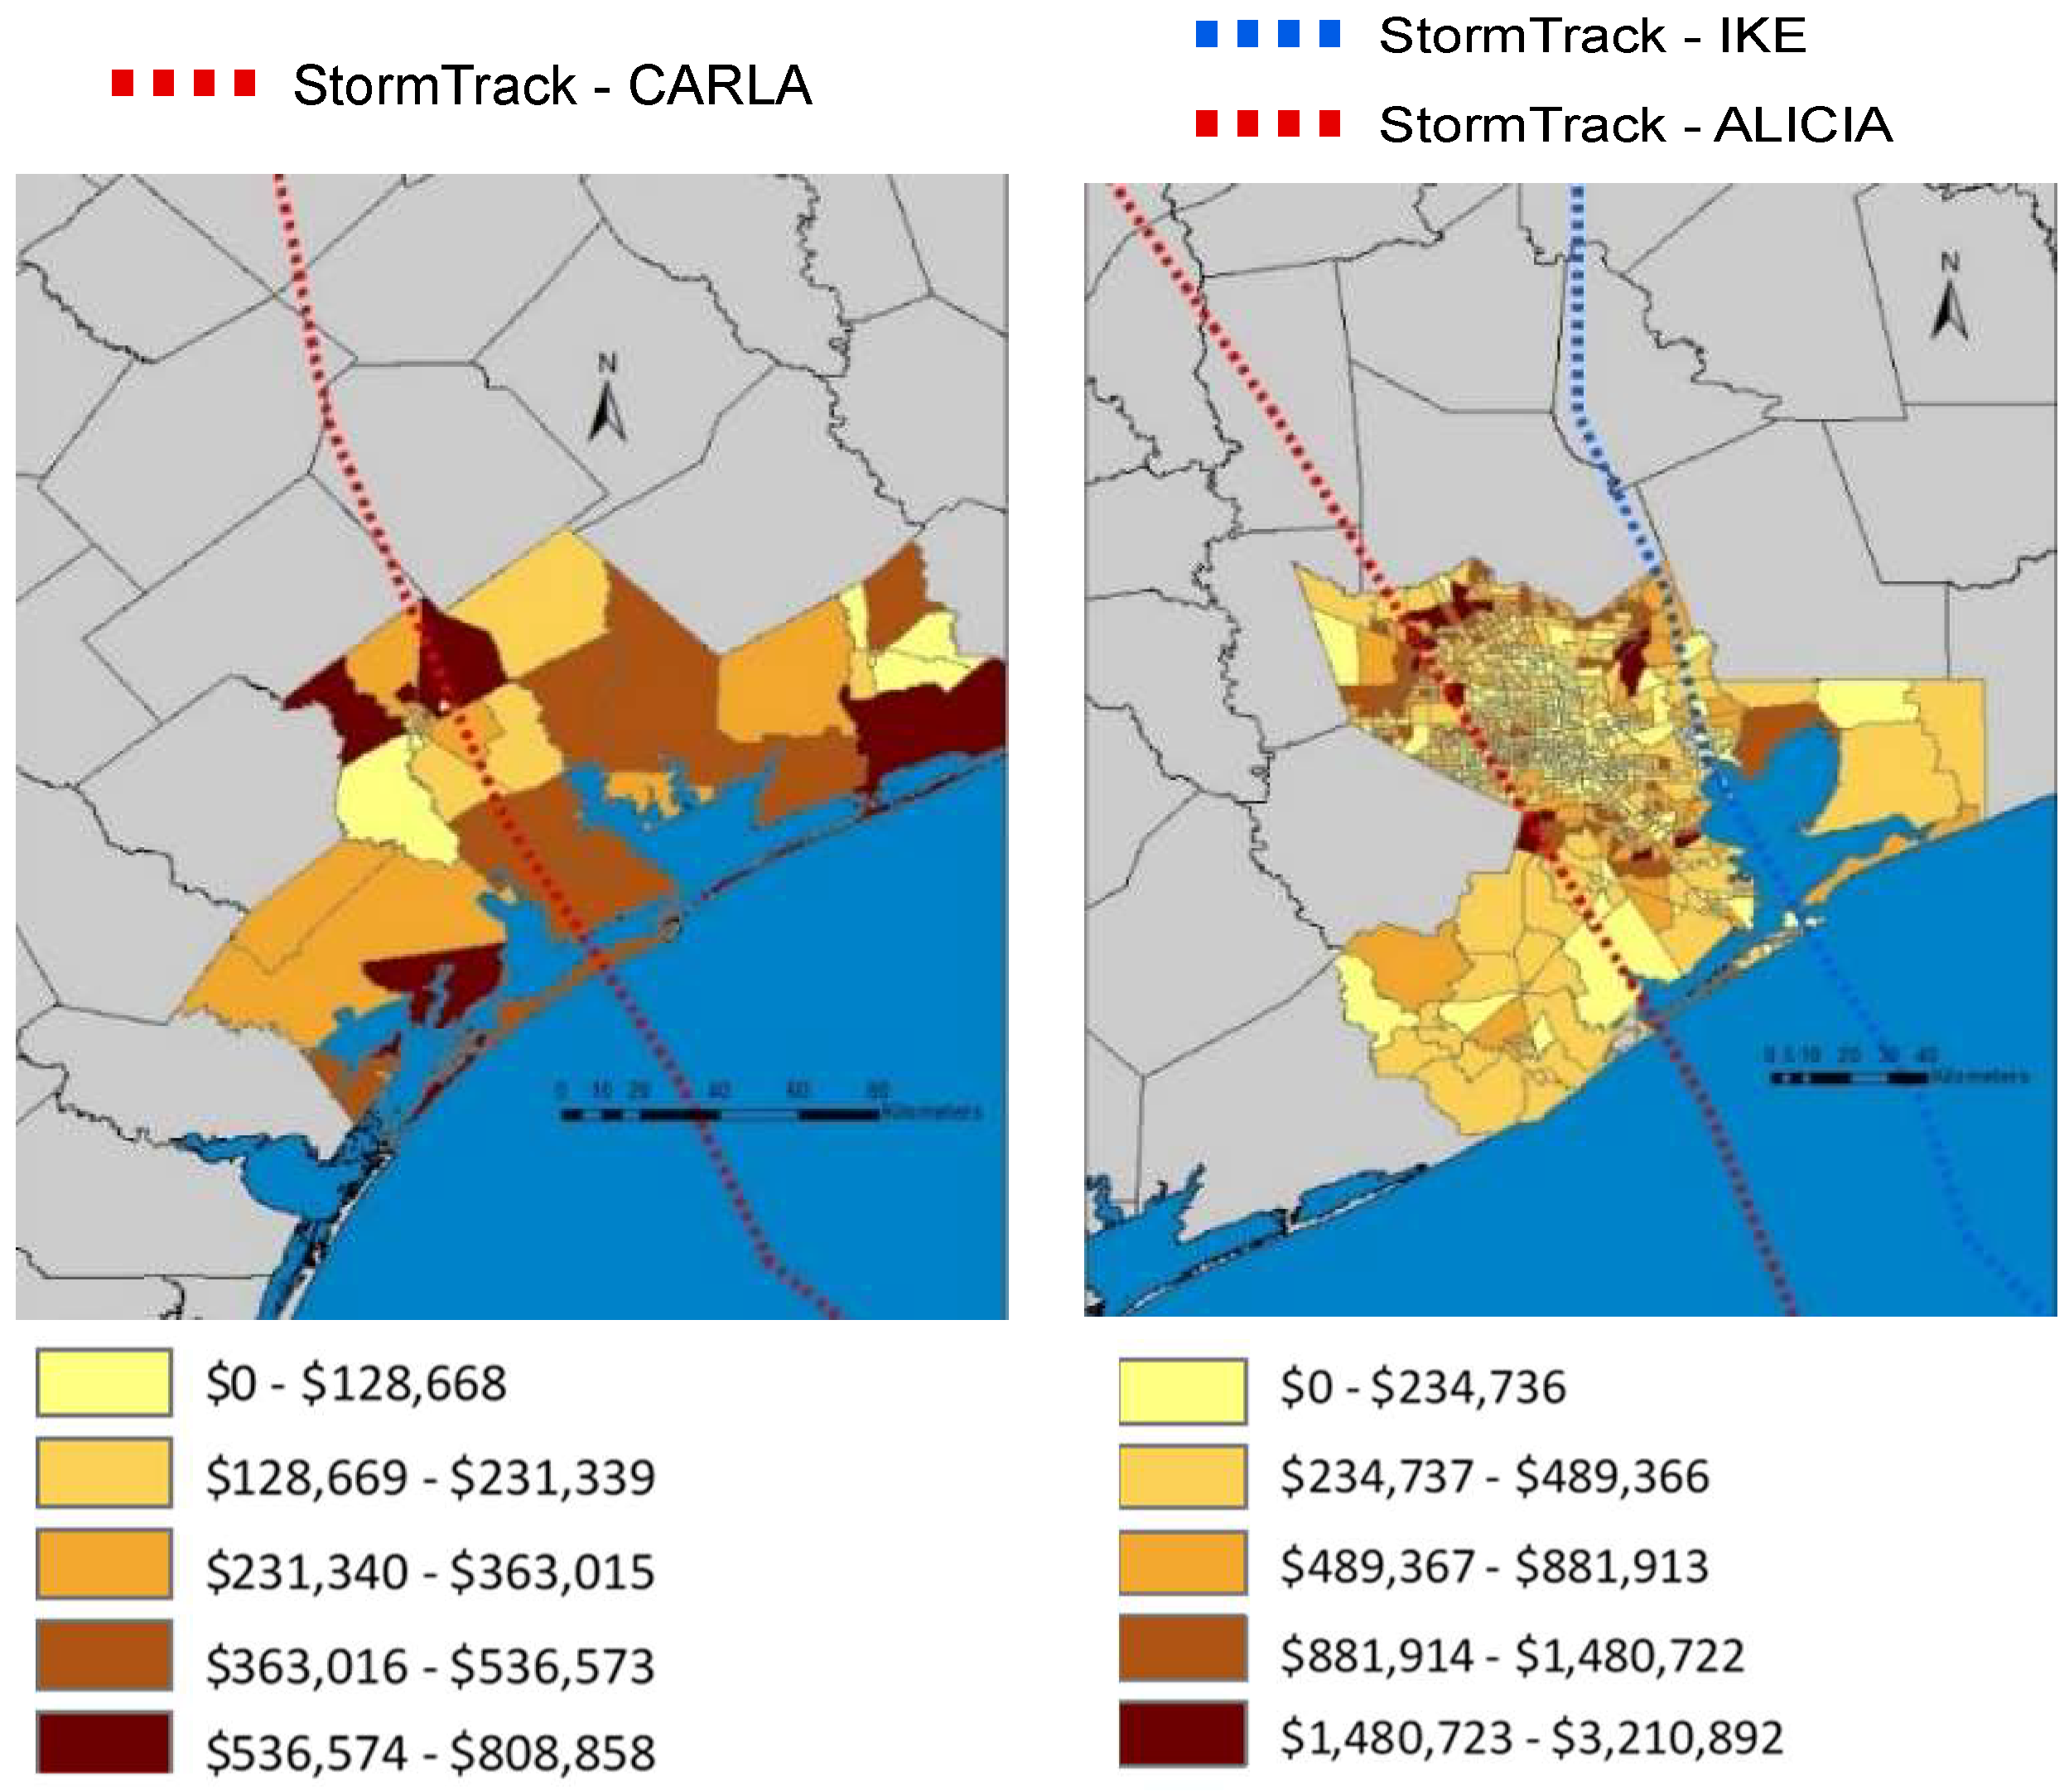
5.4.1. Hurricane Carla (2014 U.S. dollars)

Hurricane Carla made landfall on 11 September 1961 near Port O’Connor as a Category-5 hurricane but weakened quickly as it moved further inland in a northerly direction. Carla brought only small amounts of precipitation (3.15 in (80 mm)), but very strong wind gusts as high as 170 mph (280 km/h) in Port Lavaca. Since Hurricane Carla made landfall in proximity to Port O Conner (Calhoun county), the region selected for the model consisted of six counties in the immediate impact zone (Aransas, Calhoun, Jackson, Matagorda, Refugio, and Victoria) which is an area of 4468 square miles (11,572 km2), and with 2010 census has 86,470 buildings, 71,000 households and a population of 189,492. Ninety-three percent of buildings and 80% ($17.1 billion) of the total building value are designated as residential. Commercial buildings comprise the majority (10.6%) of the non-residential buildings in the region. Essential facilities include 10 hospitals with a total bed capacity of 989 beds, 100 schools, 35 fire stations, 22 police stations, and no emergency operation facilities.
The model simulation of Hurricane Carla making landfall in 2010 at the same proximate location resulted in a total economic loss (property damage and business interruption) of $796 million representing 3.9 % of the total replacement value ($20.6 billion) of the region’s buildings. The total losses consist of 85% direct property damage ($679 million) with the remaining 15% losses due to business interruption losses which include the inability to operate a business and temporary living expenses for those people displaced from their homes. The largest loss (both for property damage and business interruption loss) was sustained by the residential occupancies which made up over 86% of the total losses across all building types. The residential homes are primarily wood framed structures at an average cost of $213,207 per home. Seven percent of all wood structures would incur at least moderate damage.

5.4.2. Hurricane Alicia (2014 U.S. dollars)

Hurricane Alicia made landfall in August 1983 at Galveston Island as a Category-3 hurricane, with sustained winds of 100 mph (161 km/h) and gusts up to 127 mph (204 km/h). Alicia was not a particularly strong hurricane, but the area of maximum winds crossed a large metropolitan area (Galveston-Houston) with a majority of the structural damage caused by high winds. The region selected for Model simulation included Brazoria, Chambers, Galveston, and Harris counties, an area of 4237 square miles (10,974 km2), 1,435,808 buildings, 1,662,000 households and a population of 4,732,030 people. Ninety-one percent of buildings and 80% ($417.7 billion) of the total building value is designated as residential. Commercial buildings comprise the majority of non-residential buildings in the region. Essential facilities in HAZUS simulation include 76 hospitals with a total bed capacity of 15,898 beds, 1546 schools, 95 fire stations, 135 police stations and 11 emergency operation facilities.
The model simulation of Hurricane Alicia making landfall in 2010 at the same proximate location resulted in a total economic loss of $11.4 billion representing 2.2% of the total replacement value ($522 billion) of the area’s buildings. The total losses consist of 89% direct property damage ($10.2 billion) with the remaining 11% losses due to business interruption losses. The largest loss (both for property damage and business interruption loss) was sustained by the residential occupancies which made up over 89% of the total losses across all building types. The residential homes are primarily wood framed structures at an average cost of $318,547 per home. Three percent of all wood structures would incur, at least, moderate damage.

5.4.3. Hurricane Ike (2014 U.S. dollars)

Hurricane Ike made landfall near the city of Galveston on 13 September 2008 as a strong Category-2 storm with a central pressure of 951.6 millibars and maximum sustained winds of 110 mph (177 km/h). Hurricane Ike differs from the two previous case studies in that more than 50% of the total damage was due to storm surge in coastal Galveston, Harris, and Chambers counties, whereas wind was the primary cause of damage in Hurricanes Carla and Alicia. Since Hurricane Ike made landfall in very close proximity to where Alicia made landfall, the same four county (Brazoria, Chambers, Galveston, Harris) area was selected for HAZUS simulation with geographical specifications and property exposure count and value.
The model simulation of Hurricane Ike making landfall in 2010 at the same proximate location resulted in a total economic loss is $7.2 billion representing 1.4% of the total replacement value of the region’s buildings. The total losses consist of 91% direct property damage ($6.5 billion) with the remaining 9% losses due to business interruption losses. The largest loss (both for property damage and business interruption loss) was sustained by the residential occupancies which made up over 90% of the total losses across all building types. As was the case with Hurricane Alicia, the residential homes in the selected region are primarily wood framed structures at an average cost of $318,547 per home. Slightly less than 2% of all wood structures would incur, at least, moderate damage.

5.4.4. Variability and Limitations in Damage Estimates

The model damage estimates for the three hurricanes were adjusted from 2014 to 2016 US dollars to allow for comparison with each other and to other sources. The variability between the damage estimates provides some insight into the primary cause of damage (wind or flood), the level of property exposure in the modeled region, and the limitations of the modeling tool and database information used in the study (Table 3).
First, even though all three of the historic disasters modeled were hurricanes, the type and extent of damage varies widely depending on the specific characteristics of the hurricane such as wind velocity, storm surge, and rainfall induced flooding. The HAZUS Hurricane model used in this study only calculates damages caused by the high winds recorded in the historic disaster parameter database. Hazus also has developed a Flood Model that could be used in conjunction with the Hurricane Model to aggregate damage estimates from both disaster types for the same region. This was not done in the current study since comprehensive damage prediction is not a focal point of the paper.
Secondly, the damage estimates are based on internal algorithms of structural design directly dependent on the types and number of structures are in the hurricane storm track. This structural inventory will vary depending on the selected region (one or more counties) and the level of urban development in these counties which increases with time in regions with population and GDP growth such as Texas. Since the model only analyzes wind damage across the user-defined subset of counties created for the model, the true actual damage across all regions affected by the storm track will always be greater.
Thirdly, the level of urban development is a dynamic variable that is critical in generating robust economic loss as a function of property damage and business interruption. Damage due to disasters is usually reported in current year dollars and then updated as new information is received and adjusted to the later year inflation factor (CPI). The version of the Hazus modeling tool used in the current study is developed with a structure inventory database that is based on 2010 census for residential buildings and 2010 Dun and Bradstreet for commercial buildings considered a Level 1 inventory. The model has the capability to be updated with more precise and current building data that would enhance the accuracy of the damage, repair and replacement cost estimates. Comparing the modeled damage estimates for Hurricanes Carla, Alicia, and Ike to other sources exemplifies the potential variation that can be attributed to one or more of these discontinuities.
For comparison to the Carla simulation, a SHELDUS data query for all property and crop damage caused by hurricane/tropical storm, coastal, flooding, hail, and severe thunderstorms for all Texas counties in the month of September 1961 reports $205 million property damage and an equal loss for crop damage. The Texas Almanac archives document total property and crop damage for Carla at $2.4 billion which is similar to the NWS estimate of $2.6 billion in which 2/3 was property and 1/3 crop damage. Storm surge played a major role in the damage for this hurricane which is not capture in the Hazus model. The NWS reports 1915 homes and 983 businesses, farm buildings, and other buildings were completely destroyed. Major damage occurred to 7398 homes and 2601 businesses, farm buildings, and other buildings. Minor damage was reported to 43,325 homes and 13,506 businesses, farm buildings and other buildings [28]. The Hazus model for Carla resulted in $688 million in property damage and $119 million in business interruption.
Similarly, for comparison to Alicia, a SHELDUS query for all property and crop damage caused by hurricane/tropical storm, coastal, flooding, hail, severe thunderstorms for all Texas counties in the month of August 1983 reports $1.2 billion in property damage and an equal loss for crop damage. The Texas Almanac archives report total property and crop damage for Alicia at $7.2 billion which is similar to the NOAA estimate of $7.3 billion. A report by the NRC Committee on Natural Disasters published in 1983 reported $602 million in economic loss for Galveston, Harris, Brazoria, and Chambers with about 50% due to property damage and the other 50% damage due to roads, utilities, agriculture, marine, and vehicles. Alicia was a high wind damage hurricane that spawned at least 22 tornadoes resulting in an additional 18 fatalities and property damage [29]. The Hazus model for Alicia resulted in $10.3 billion in property damage and $1.23 billion in business interruption.
The difference in actual to model was most pronounced with Ike. A SHELDUS query for property and crop damage caused by hurricane/tropical storm, coastal, flooding, hail, and severe thunderstorms for all Texas counties in the month of September 2008 reports $3.76 billion in property damage. The Texas Almanac archives report $15.6 billion in the counties of Harris, Chambers, Galveston, Liberty, Polk, Matagorda, Brazoria, Fort Bend, San Jacinto, and Montgomery, with an estimated $8.9 billion of that due to storm surge in coastal Galveston, Harris, and Chambers counties. The NOAA reports a much higher value of $33.4 billion but include all counties in the storm track suggesting that much of the Ike damage was not in these Texas counties. The Hurricane Ike Impact Report published by the Office of Homeland Security Division of Emergency Management in 2008 breaks out the damage as follows: housing damage ($3.8 billion), infrastructure repairs ($2.7 billion), Public buildings ($1.9 billion), hospital damage ($791 million), and transportation ($147 million) [30]. The Hazus model for Ike resulted in $6.63 billion in property damage and $697 million in business interruption (Table 3).

6. Discussion and Conclusions

The spatiotemporal trends of annual damage caused by natural disasters in Texas highlight the disproportionate impact of hurricanes, tropical storms, and hail accounting for approximately 70% of total property damage during 1960–2016. The extreme susceptibility of coastal property damage due to hurricane is explicit in Texas (34% due to hurricanes) and supported by national damage statistics in which 40% of all U.S. property damage during this period is due to hurricane or tropical storms. Given the ongoing progress in scientific understanding of climate change and the record setting temperatures around the world in recent years being investigated and made public by several scientific NGOs as well as the International Panel on Climate Change (IPCC) [31], it is a natural tendency to gravitate to the assumption that the primary driver of our increasing disaster losses is due to the increase in frequency and intensity of hydrometeorological events. The change in disaster severity is generally increasing but the change in frequency remains an open debate. Conversely, the increase in property damage due the disasters is most definitely increasing and not debated. This suggests that the increase in damage is due to other factors outside the disaster itself such as the exposure, wealth and level of development of the regions with high risk of hurricane activity (e.g., coastal communities).
Annual distribution of property damage (2016 U.S. dollars) due to hydrometeorological disasters during the 57-year study period exhibited a statistically significant increasing trend with high annual variability that decreases when normalized per capita. Actual property damage (year of occurrence) normalized by annual GDP further decreases to a non-significant statistical positive trend suggesting a relationship of population and wealth to the level of damage in the impacted region. Additional inference of wealth effects on property damage is observed with trend analysis of the 25 Metropolitan Statistical Areas (MSA) in Texas during 2001–2016. Although a 16-year study period is limited in prediction value for trend analysis, it does provide some high-level results that highlight the differences in regional wealth in Texas. Actual property damage normalized by the GDP for each of the MSA regions property damage results in increasing trends similar to the statewide annual trends (1960–2016) for 11 of the MSAs with only the Dallas MSA indicating a strong linear and significant correlation. Fourteen of the Texas MSAs exhibited non-significant decreasing trends based on non-parametric correlation analysis at a 5% significance level suggesting that growth in GDP is outpacing the actual property damage in those regions.
Simulation of three historic hurricanes using the HAZUS hurricane modeling estimation tool generated conservative estimates of total economic loss as expected given the limitation noted in Section 5.4.4. However, the simulation can be useful as a source of information for the types of buildings most susceptible to wind damage as well as an indirect indication of the number of counties impacted by the entire storm track. The model simulations provide a microcosm of lower level building level damage within one specific disaster event that may be representative of disaster damage that may occur in future disasters and therefore be useful as a loss predictor. The HAZUS modeling tool is designed and managed by FEMA to serve as a predictor of damage and resource disruption to aid emergency management personnel and is not intended to provide a precise account of the financial impact of a disaster. Within that context, the model output was substantially different from the total damage estimations produced by other sources that can provide perspective on the nature and extent of the modeled hurricanes.
Hurricane Carla made landfall at Galveston Island in 1961 and headed northwest into Harris county. Carla caused damage to many counties along its northeasterly track from Texas into the Great Lakes region resulting in $2.4–2.6 billion in total property and crop damage along its path (Texas Almanac and NWS). The SHELDUS aggregate data estimate for the entire month of September 1961 was $410 million and the Hazus simulation model using 2010 building inventory for six counties around the Texas landfall showed $688 million in property damage and $119 million in business interruption. The fact that the model output is higher than the other sources suggests that Carla was a combination of wind and water damage along the landfall counties due to storm surge and the building exposure has likely increased significantly from 1961 to 2010. Hurricane Alicia and Hurricane Ike made landfall within 40 km of each other around Galveston Island, albeit 25 years apart. These two hurricanes were drastically different in wind and rainfall which affected the type and location of damage. Alicia spawned at least 22 tornados causing excessive wind damage and Ike had heavy rainfall causing much more flood damage than wind damage. NOAA reported $7.3 billion in total damage for Alicia and $33.4 billion total damage for Ike which includes property and crops of all affected areas. SHELDUS data for the entire month of August 1983 indicated $2.4 billion (property and crop) and $3.8 billion (property) damage for September 2008. The Hazus simulation model (2010 inventory) was $11.5 billion (property damage and business interruption) for Alicia and $7.3 billion for Ike. In summary, both the Carla and Ike simulation models captured less than 50% of their respective estimates reported by other sources suggesting a broad geographical zone of damage with flood damage making a significant contribution. Conversely, the Alicia model damage estimates are 50% higher than total damage estimates reported at the time of occurrence by NOAA suggesting a substantial increase in building exposure in the modeled region that was damaged by high winds captured by the model.
In conclusion, it is apparent that damage estimates for historic disaster events can vary widely based on data source and methodology. Particularly in hurricane events where there is overlap in damage causality of wind, storm surge, and flooding, the estimates are very dependent on the categorization of the disaster type and the regions of impact. Deriving meaningful conclusions from historic data or simulation model data based on historic events should be tempered with the known limitations of the source data. For example, the damage reported by SHELDUS is spread out over the affected counties equally even if the event may have impacted one county disproportionately. In addition, prior to 1995, the database only reported an event that caused at least one death or over $50,000 in damage neglecting all smaller events [25]. Further research into historic property damage assessment may consider securing access to a level of SHELDUS data that is aggregated by disaster event and presidential disaster declaration to better relate the damage to the disaster. The hurricane modeling used by the HAZUS-MH hurricane model only includes damage and losses caused directly and immediately by the hurricane wind. Moreover, the default building, infrastructure, and terrain data in HAZUS-MH is based on the best information available at the time of the application release which, at best, includes 2010 U.S. census for residential buildings and Dun and Bradstreet estimates for commercial buildings. The accuracy of HAZUS simulation output can be greatly increased by modeling the historic disaster of interest for wind, hail, and flooding in high risk areas and using advanced regional inventory, utility, transportation, and economic data. The noted constraints that limits the quantitative accuracy of the Hazus model output can be mitigated by: (1) Using multiple disaster models to account for damage due to wind and flooding when considering a hurricane event. (2) Upgrading the Level 1 building inventory and infrastructure database with user defined building files obtained from the property tax assessment agency and current hazard maps that provide accurate flood depth grids and boundaries and hurricane wind fields. (3) Building the model region to include as many counties as practical in the storm track.

Author Contributions

H.O.S. provided research supervision and professional guidance in all aspects of writing this paper. S.H.P. performed the data mining, quantitative analysis, qualitative interpretation and discussion, and is responsible for all content in this paper.

Funding

This research received no external funding.

Acknowledgments

The authors thank David and Bethene Player for review of the manuscript and providing a sounding board for interdisciplinary perspective.

Conflicts of Interest

The authors declare no conflicts of interest.

References

  1. Munich, R. NatCatSERVICE, Natural Catastrophe Know-how for Risk Management and Research. Natural Catastrophe Online Tool. Available online: http://natcatservice.munichre.com/ (accessed on 18 September 2018).
  2. National Oceanic and Atmospheric Administration (NOAA). National Centers for Environmental Information. Storm Events Database 2017. Available online: https://www.ncdc.noaa.gov/billions/overview (accessed on 18 September 2018).
  3. Irfan, U.; Resnick, B. Megadisasters Devastated America in 2017. And They’re Only Going to Get Worse. Storms, Fires, Floods, and Heat Caused at Least $306 Billion in Destruction Last Year. 2018. Available online: https://www.vox.com/energy-and-environment/2017/12/28/16795490/natural-disasters-2017-hurricanes-wildfires-heat-climate-change-cost-deaths (accessed on 18 September 2018).
  4. Gall, M.; Borden, K.A.; Emrich, C.T.; Cutter, S.L. The Unsustainable Trend of Natural Hazard Losses in the United States. Sustainability 2011, 3, 2157–2181. [Google Scholar] [CrossRef] [Green Version]
  5. Sander, J.; Eichner, J.F.; Faust, E.; Steuer, M. Rising Variability in Thunderstorm-Related U.S. Losses as a Reflection of Changes in Large-Scale Thunderstorm Forcing. Am. Meteorol. Soc. 2013. [Google Scholar] [CrossRef]
  6. Pielke, R.A.; Landsea, C.W. Normalized Hurricane Damage in the United States: 1925–95. Am. Meteorol. Soc. 1998, 13, 621–631. [Google Scholar] [CrossRef]
  7. Pielke, R.A.; Gratz, J.; Landsea, C.W.; Collins, D.; Saunders, M.A.; Musulin, R. Normalized Hurricane Damage in the United States: 1900–2005. Nat. Hazards Rev. ASCE 2008, 9. [Google Scholar] [CrossRef]
  8. Klotzbach, P.J.; Bowen, S.G.; Pielke, R.A.; Bell, M. Continental U.S Hurricane Landfall Frequency and Associated Damage, Observations and Future Risks. Am. Meteorol. Soc. 2018. [Google Scholar] [CrossRef]
  9. Paul, S.; Sharif, H.; Crawford, A. Fatalities Caused by Hydrometeorological Disasters in Texas. Geosciences 2018, 8, 186. [Google Scholar] [CrossRef]
  10. Sharif, H.; Jackson, T.; Hossain, M.; Zane, D. Analysis of Flood Fatalities in Texas. Nat. Disasters Rev. 2014, 16. [Google Scholar] [CrossRef]
  11. Gaines, J.; Hunt, H. Tierra Grande. Housing Markets. Publication 2028. 2013. Available online: https://assets.recenter.tamu.edu/documents/articles/2028.pdf (accessed on 18 September 2018).
  12. Potter, L. The Changing Population of Texas and West Texas. In Proceedings of the Cross Roads Healthcare Transformation in West Texas Conference, Lubbock, TX, USA, 5 June 2013; Office of State Demographer: Austin, TX, USA, 2013. [Google Scholar]
  13. CEMHS. Spatial Hazard Events and Losses Database for the United States, Version 16.1; Center for Emergency Management and Homeland Security, Arizona State University: Phoenix, AZ, USA, 2018. [Google Scholar]
  14. Schneider, P.; Schauer, B. Hazus-Its development and its future. Nat. Hazards Rev. 2006, 7, 40–44. [Google Scholar] [CrossRef]
  15. Vickery, J.; Lin, J.; Skerlj, P.; Twisdale, L.; Huang, K. Hazus-MH hurricane model methodology I: Hurricane hazard, terrain, and wind load modeling.” and “Hazus-MH hurricane model methodology II: Damage and loss estimation. Nat. Hazards Rev. 2006, 7, 82–93. [Google Scholar] [CrossRef]
  16. Hahn, D.; Emmanuelle, V.; Ross, C. Multi-Hazard Mapping of the U.S. J. Risk Uncertain. Eng. Syst. Part A Civ. Eng. 2017, 3. [Google Scholar] [CrossRef]
  17. Gordon, P.; Richardson, H.W.; Davis, B. Transport-related impacts of the Northridge earthquake. J. Transp. Stat. 1998, 1, 21–36. [Google Scholar]
  18. Burrus, R.; Dumas, C.F.; Farrell, C.H.; Hall, W.W., Jr. Impact of low-intensity hurricanes on regional economic activity. Nat. Hazards Rev. 2002, 3, 118–125. [Google Scholar] [CrossRef]
  19. Pan, Q. Case Study: Economic Losses from a Hypothetical Hurricane Event in the Houston-Galveston Area. ASCE Nat. Hazards Rev. 2011, 12, 146–155. [Google Scholar] [CrossRef]
  20. Hydrometeorological Hazards. Disaster Risk Reduction. Natural Sciences. United Nations Education, Scientific, and Cultural Organization (UNESCO). Available online: http://www.unesco.org/new/en/natural-sciences/special-themes/disaster-risk-reduction/natural-hazards/hydro-meteorological-hazards/ (accessed on 18 September 2018).
  21. Gautheir, T. Detecting Trends Using Spearman’s Rank Correlation Coefficient. Environ. Forensics 2001, 2, 359–362. [Google Scholar] [CrossRef]
  22. Wilson, L.T. Statistical Correlation. 2009. Available online: https://explorable.com/statistical-correlation (accessed on 8 October 2018).
  23. Statistics Solutions, Complete Dissertation. Available online: https://www.statisticssolutions.com/kendalls-tau-and-spearmans-rank-correlation-coefficient/ (accessed on 8 October 2018).
  24. Guci, L.; Mead, C.; Panek, S. A Research Agenda for Measuring GDP at the County Level, Bureau of Economic Analysis. 2016. Available online: https://www.bea.gov/system/files/papers/WP2016-4.pdf (accessed on 18 September 2018).
  25. Mustapha, K.; Mcheick, H.; Mellouli, S. Modeling and Simulation Agent-Based of Natural Disaster Complex Systems. In Proceedings of the 4th International Conference on Emerging Ubiquitous Systems and Pervasive Networks (EUSPN-2013), Niagara Falls, ON, Canada, 21–24 October 2013. [Google Scholar]
  26. FV3: Finite-Volume Cubed Sphere Dynamical Core, Geophysical Fluid Dynamics Laboratory (GFDL), Princeton University Forrestal Campus. Available online: https://www.gfdl.noaa.gov/fv3/ (accessed on 18 September 2018).
  27. Federal Emergency Management Agency (FEMA). U.S. Hazard Multi-hazard Estimation Tool, Hurricane Model; HAZUS-MH 4.0; Federal Emergency Management Agency (FEMA): Washington, DC, USA, 2018. [Google Scholar]
  28. National Weather Service (NWS). National Oceanic and Atmospheric Administration, Carla 50th Anniversary, Storm Summary. Available online: https://www.weather.gov/crp/hurricanecarla (accessed on 8 October 2018).
  29. Savage, R.P. National Research Council (NRC), Committee on Natural Disasters, Commission on Engineering and Technical Systems. In Hurricane Alicia: Galveston and Houston, TX, USA, 17–18 August 1983; National Academy Press: Washington, DC, USA, 1984. [Google Scholar]
  30. Colley, J.; DeBlasio, S.M. Hurricane Ike Impact Report-December 2008; Office of Homeland Security, Division of Emergency Management: Austin, TX, USA, 2008. [Google Scholar]
  31. International Panel on Climate Change (IPPC). Summary for Policymakers of IPCC Special Report on Global Warming of 1.5°C Approved by Government. 2018. Available online: https://www.ipcc.ch/news_and_events/pr_181008_P48_spm.shtml (accessed on 8 October 2018).
Figure 1. (a) Adj property damage caused by natural disasters in Texas (1960–2016); (b) Adj property damage per capita; and (c) Actual property damage by GDP. Notation: 10-year moving average (red dots) and linear trend (black dash).
Geosciences 08 00384 g001
Figure 2. Top 6 disaster types monthly distribution of property damage (1960–2016).
Geosciences 08 00384 g002
Figure 3. Spatial distribution of property damage ($2016) by Texas county (1960–2016): (Left) total property damage; and (Right) total property damage per capita.
Geosciences 08 00384 g003
Figure 4. Spatial distribution of property damage for Texas MSAs (2001–2016): (top left) total GDP; (top right) total adjusted property damage; and (bottom) average actual property damage per capita and actual property damage by GDP (× 10−3).
Geosciences 08 00384 g004
Figure 5. Storm tracks and residential (single-family) building exposure (2014): (Left) Hurricane Carla; and (Right) Hurricanes Alicia and Ike.
Geosciences 08 00384 g005
Table 1. Total property damage caused by natural disasters in U.S. and Texas (1960–2016).
Disaster TypeTX ($2016)US ($2016)
Hurricane/Trop Strm18,325,926,908 258,877,397,419
Hail12,301,331,729 37,295,600,013
Flooding7,035,494,246 152,447,938,320
Severe /TStrm6,298,129,432 35,434,257,137
Tornado4,103,255,471 58,871,799,205
Wind2,095,538,316 33,335,423,825
Drought1,454,769,396 5,121,265,940
Coastal940,709,789 2,955,956,179
Winter Weather795,182,868 26,391,427,257
Wildfire692,696,316 22,497,632,949
Lightning159,383,681 3,101,409,332
Fog6,885,490 58,142,521
Heat1,794,114 504,346,195
Landslide179,521 18,864,695,667
Avalanche1,064 30,299,599
Grand Total54,211,278,340655,787,591,561
Table 2. Normalized property damage and trend correlation for Texas MSAs (2001–2016). Ranked by decreasing linear trend strength.
16-year Average16-year Annual Trend
MSA—Actual/GDPAdj PD/CapitaAct PD/GDPSpearmanpKendallp
Dallas-Fort Worth-Arlington$48.120.7060.81760.00010.65000.0004
Lubbock$393.409.6720.48530.05670.36670.0476
Texarkana$100.051.7320.27960.29420.17570.3439
McAllen-Edinburg-Mission$27.871.2620.22640.43640.18680.3520
Tyler$1.900.0300.13190.66760.10260.6255
El Paso$57.661.7410.06820.80200.03420.8558
Austin-Round Rock$43.820.7270.06430.81990.04760.8046
Corpus Christi$25.530.5830.04400.88660.07690.7143
Killeen-Temple$4.510.1060.03820.88820.00001.0000
Sherman-Denison$39.401.2120.03820.8882−0.01670.9283
Longview$10.990.2290.00590.98270.00840.9640
Laredo$16.250.527−0.06040.84450.00001.0000
San Angelo$36.720.882−0.12730.7092−0.09090.6971
Waco$5.130.122−0.14710.5868−0.11670.5285
Brownsville-Harlingen$16.000.712−0.17290.5377−0.14090.4788
San Antonio-New Braunfels$44.830.956−0.23410.4010−0.22970.2344
Amarillo$221.044.698−0.23570.3977−0.16190.4002
Houston-The Woodlands-Sugar Land$69.441.034−0.26340.3242−0.19250.2999
Odessa$5.410.117−0.28130.2912−0.20170.2789
Victoria$2.320.055−0.30910.3848−0.33330.1797
Beaumont-Port Arthur$457.188.690−0.31760.2306−0.26670.1497
College Station-Bryan,$6.040.168−0.33700.2018−0.24270.1912
Abilene$194.884.499−0.36260.2026−0.25270.2080
Wichita Falls$14.090.261−0.40590.1188−0.28330.1258
Midland$91.180.693−0.47940.0706−0.39420.0420
* Green highlighted rows are decreasing trends.
Table 3. Comparison of damage estimates for Hurricane Carla, Hurricane Alicia, and Hurricane Ike (all dollar values adjusted to 2016 U.S. dollars).
Disaster Event NameHurricane CarlaHurricane AliciaHurricane Ike
Month/DaysSeptember 8–14August 15–21September 11–12
Saffir-Simpson ClassificationCat-5Cat-3Cat-2
Year196119832008
LandfallPort O’Connor, TxGalveston, Tx
Primary Cause of DamageWind/Storm SurgeWind/TornadoesFlooding
Texas Almanac (total damage)$2.4 billion$7.2 billion$15.6 billion
NWS/NOAA (total damage)NA$7.3 billion$33.4 billion
SHELDUS (property damage)$204.4 million$1.23 billion$3.8 billion
SHELDUS (crop damage)$204.4 million$1.23 billionNA
HAZUS model countiesAransas, Calhoun, Jackson, Matagorda, Refugio, VictoriaBrazoria, Chambers, Galveston, Harris
Counties population (2010)189,4924,732,030
Hazus model (2010 building exposure)$20.9 billion (80% wood residential)$529 billion (80% wood residential)
Hazus model (property damage)$689 million$10.3 billion$6.63 billion
Hazus model (business interruption)$119 million$1.23 billion$697 million

