1. Introduction
The north area of Lisbon in general and the Grande da Pipa River (GPR) basin in particular have natural conditions that greatly favor the occurrence of landslides, most of which are related to degradation of soil mechanical properties (e.g., strength reduction, volume changes due to clay swelling, and retraction). Through the last decades this area has been the object of several studies with different approaches on the topic [
1,
2,
3,
4,
5,
6]. Especially since the nineties of the 20th century, most of these studies have been focusing on one of the two following approaches on the subject of landslides in the north area of Lisbon: medium scale studies intended for planning purposes and large scale studies for detailed engineering design purposes.
The first approach is concerned with spatial and temporal distribution of landslides, aiming to provide useful information to land use planning [
7,
8,
9]. These are essentially focused on landslide susceptibility [
10,
11] and hazard assessment, for instance, critical rainfall thresholds for regional instability and antecedent rainfall thresholds [
12], in order to temporally pinpoint potential instability events. Given their purpose, these studies are normally based on data-driven methods and are applied at the regional scale.
The second approach focuses on the geotechnical behavior of materials, and on failure mechanisms and influence of water in the stability of slopes, for example, through back-analysis [
13,
14,
15,
16,
17]. For the specific case of the north area of Lisbon, there are also several examples of studies dedicated to the understanding of the geotechnical behavior of materials [
18,
19,
20,
21]. This type of studies is usually more concerned with the response of the soil to a specific engineering intervention which may imply increase of weight over the soil, important changes of topography or on groundwater flow paths. Generally, by definition, the scale of analysis is mainly local.
Slope instability is a hot topic of geomorphological and geotechnical studies, and for a better understanding of causes and evolution of landslides, multidisciplinary procedures are needed to combine different types of measurements and stability calculation methods in order to overcome the inherent uncertainties of the involved variables.
Several studies show that in the area north of Lisbon in general [
22,
23], and specifically in the GPR basin [
10,
24], widespread events of landslides occur after a threshold of precipitation is exceeded. Given this relationship, we aim a further understanding on the relationship between the hydrodynamic behavior of the porous sedimentary rocks of the GPR basin and the occurrence of slope instability events.
The main goal of this study is to understand the main constraints, and the preparatory and triggering factors that control landslide occurrence in the Rio Grande da Pipa basin. As follows, our study uses both perspectives referred to above, a regional perspective concerned to understand the most common landslides, and a local perspective focused on two landslides that are not explained by the general model applied to the whole RGP basin.
In order to accomplish the main objective the following specific objectives were set: (i) Definition and implementation of a regional hydrological model to relate water table position and evidences of slope instability in the GPR basin; and, (ii) Development of back-analysis of specific landslides that do not fit within the explanation drawn by the hydrological model.
2. Regional Setting
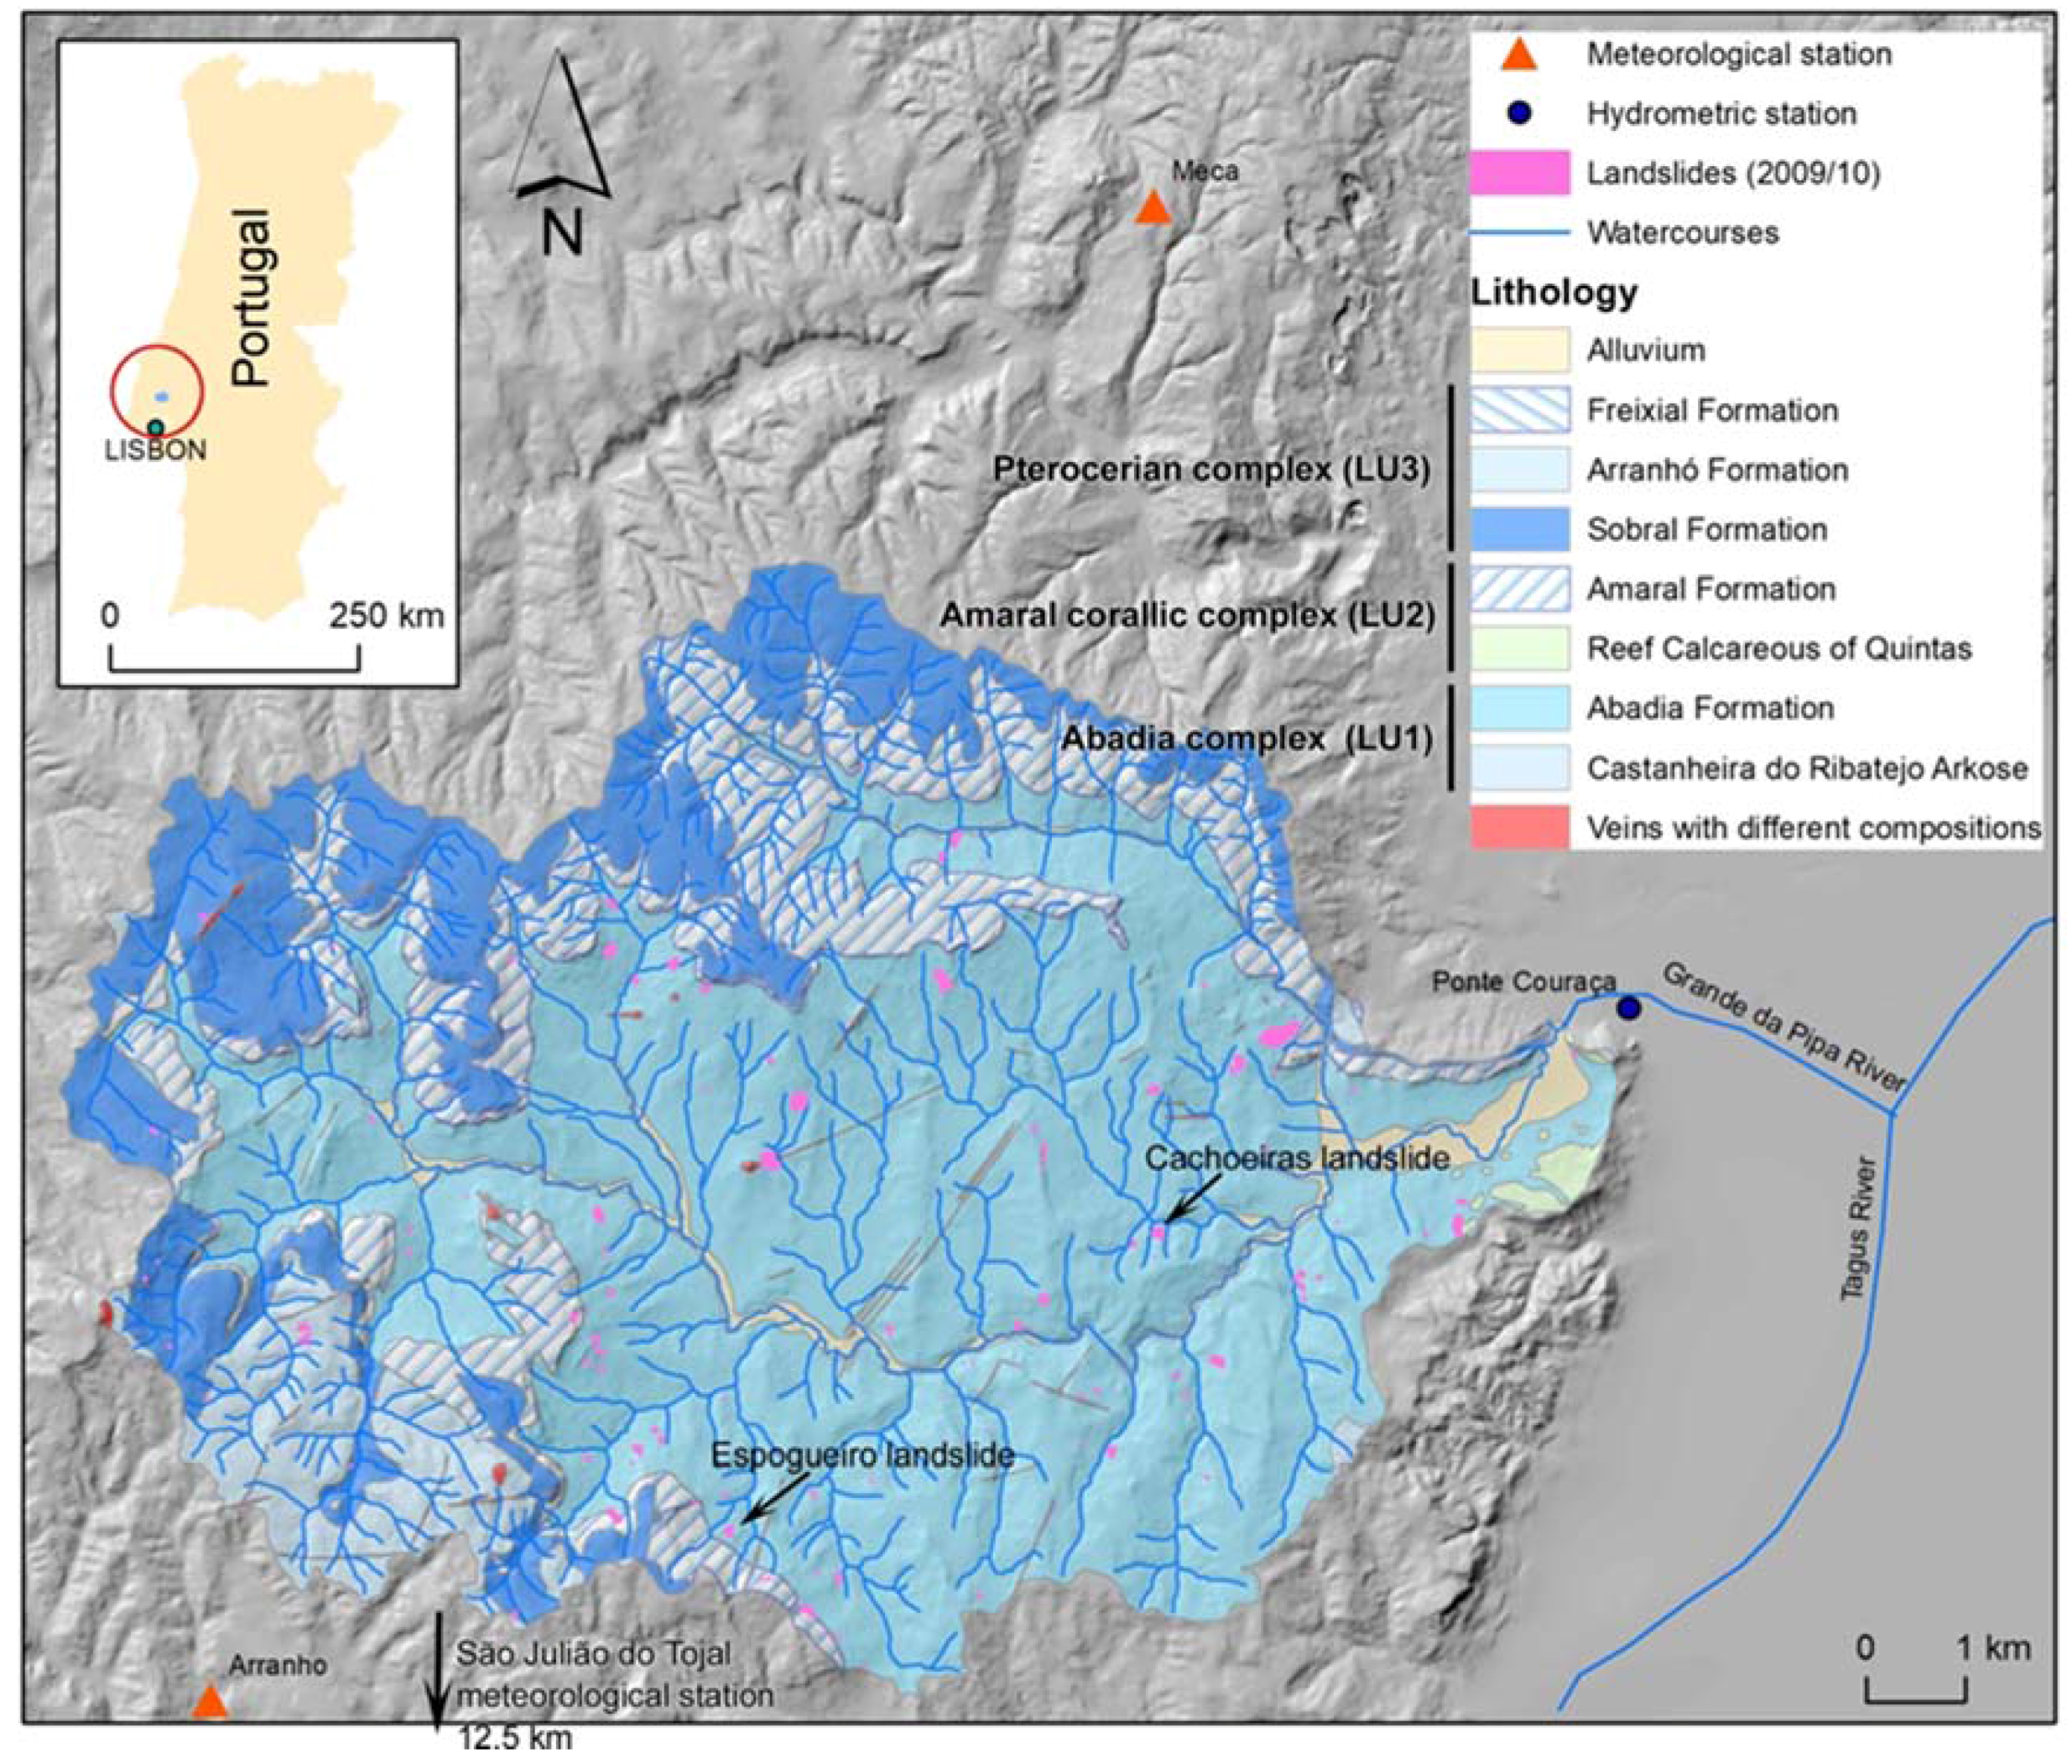
The Grande da Pipa River basin is located approximately 20 km north of Lisbon (
Figure 1) and is centered in the Arruda dos Vinhos municipality. It is a 110 km
2 basin with an ephemeral river network, in response to rainfall episodes, draining directly to the Tagus River that is located to the East.
Upper Jurassic sedimentary formations dominate the GPR basin (96.3%). The oldest and most common (58% of the basin area) rocks are included in the Abadia Complex of Kimmeridgian age, which forms the central area of the basin, while the youngest formation corresponds to Holocene alluvial deposits. In general, an alternating sequence of marls, limestones, and sandstones dominate the geological outcrops of the GPR basin.
The following main geological complexes and formations occur in the GPR basin (
Figure 1) and are synthesized in the three main lithological units (LU), which are the focus of the present work:
LU1—Abadia complex is a clayey complex about 800 m thick, which forms 58% of the GPR basin. It is composed of argillites, marly argillites, marly siltstones, and gray marls, interbedded with resistant sandstone layers, with thickness spanning generally from 5 to 20 cm and more rarely between 60 cm and more than 2 m. These marls are normally sandy with greyish color, and becoming yellowish in the weathered and degraded upper layers [
25]. When referring only to argillites or marls from this complex, LU1a will be used.
LU2—Amaral coral complex (Amaral and Calcareous Reef of Quintas formations) is mainly composed of limestones and marls, which occupy about 16.4% of the GPR basin, forming up to 10 m high cliffs (limestone cornices) in the upper part of slopes. This complex is formed by a calcareous reef massif alternating with yellow and grey marly levels [
26].
LU3—Pterocerian complex (which include the Arranhó, Sobral, and Freixial formations) is characterized by alternating layers of limestones and marls with intercalations of yellowish sandy-marl beds [
26]. The lower levels of the complex are composed of limestones which are similar to those of the LU2.
Over the three basement lithological units, there are recent colluvium and alluvium deposits with high geographical expression. The first are essentially silt-clayey and silt-sandy colluvium deposits, with small sandstone and calcareous fragments and plant roots. They are a result of superficial weathering from underlying formations and cover extensive areas of the study area. For this reason these colluvium deposits are not presented in the geological map (
Figure 1). Alluvium deposits, on the other hand, are present along major watercourses.
In terms of hydrogeological properties, the Jurassic units and the alluvium act as an interbedded sequence of aquitards and small scale porous aquifers, respectively.
In terms of elevation, the basin spans between 440 m a.s.l. (above sea-level) in the WSW and 10 m in the extreme East. Interfluves show altitudes of between 350 and 300 m a.s.l. and are dissected by the hydrographic network. The morphology of the RGP basin is strongly influenced by the geological structure and lithology [
5].
The Arruda dos Vinhos depression (which essentially corresponds to the RGP basin) relates to an inversion of the relief originated by differential erosion, with the oldest and less resistant materials outcropping in the center of the depression [
3]. Generally, around the basin the geological formations are characterized by a gentle monoclinal structure, which form monoclinal ridges with smooth dip slopes to the exterior of the basin and more abrupt front slopes towards the interior of the basin, which correspond frequently to scarps [
5]. Front slopes of monoclinal ridges are composed of LU2, which dominate the Arruda dos Vinhos depression cut in the LU1 [
2]. Slopes cut in the LU1 are extensive and with moderate slope angles.
The morphology of the basin is particularly associated with incision of valleys and erosion of terrains above the marls and clays of the LU1, which allowed for the decompression and expansion of these heavily over consolidated massifs. These processes are important in the morphological evolution of the area, particularly in slope stability, because they cause a strength reduction up to a significant depth due to the creation of cracks and to the superficial expansion of clays [
26].
3. Materials and Methods
The following subsections refer to the description of different materials and methods that are used in this study, which include: the characterization of the 2009/10 seasonal landslide inventory; the characterization of the regional rainfall pattern; the approach used to assess the regional fluctuation of the water table; and, the back-analysis procedures that are used to assess the triggering conditions and constraints of deep-seated rotational slides that do not fit the regional hydrological response of slopes. A more thorough explanation on materials and methods that are used in this study than that referred below can be found in [
27].
3.1. Landslides Inventory from 2009/10
The 2009/10 RGP basin seasonal landslide inventory used is a field inventory map, which is based on a systematic survey of slope mass movements [
24]. In a first stage, to constrain the date of landslide occurrence, all of the landslides were mapped as single points over an orthophotomap, with a 0.5 m of pixel resolution, printed at a 1:5000 scale. Landslide inventory/field mapping occurred at irregular intervals between November 2009 and June 2010, after each sequence of intense rainfall days. This approach allowed for assigning new landslides to the previous rainfall sequence and therefore to restrict the uncertainty relative to the landslide date of occurrence. On a second phase, all the landslides limits were mapped over orthophotomap (0.5 m of pixel resolution), printed at a 1:2000 scale and vectored in a GIS environment. To improve landslide inventory map precision and accuracy, all landslide limits were validated by photointerpretation of landslide limits on available aerial photographic and satellite images that were taken just after landslides occurrence. Landslide typology was defined according to the [
28] classification (e.g., rotational slide, translational slide, rockfall). In addition, for each landslide were also recorded: the material affected (e.g., LU1: Abadia complex), the type of slope (natural or artificial), and the maximum estimated depth of the rupture surface (shallow < 1.5 m, intermediate 1.5–5 m and deep > 5 m; adapted from [
29] classification).
During the hydrological year of 2009/10, 254 landslides were inventoried in the GPR basin, specifically between November 2009 and April 2010 [
24]. The frequency of landslides according to the depth of the rupture surface is as follows: 167 shallow-seated landslides, 74 intermediate-seated landslides, and 13 deep-seated landslides. From these, only translational and rotational slides were considered, excluding those whose affected materials were classified as debris or rock, or those that occurred in areas such as embankments, fills, and cut areas on slopes. When considering these criteria, the inventory was trimmed to 182 landslides (
Figure 1). In this selected inventory, 76% are rotational slides, 76% occurred in LU1, and 64% are shallow landslides (translational and rotational).
3.2. Precipitation Regime in the North Area of Lisbon
The north area of Lisbon has a Mediterranean climate with a precipitation regime, which is characterized by high interannual and interseasonal variability. Seasonal cycles can be defined by higher amounts of rainfall, in particular, between October and March [
30].
For the characterization of rainfall in the study area, we used data collected from São Julião do Tojal meteorological station (SJT), which has a more complete (1938 and 2010) and reliable set of recorded data than any other station in the area. On the north area of Lisbon, precipitation data from this station have been used as a reference to define rainfall thresholds for landslide triggering [
22,
24,
31,
32]. SJT station is located 18.3 km south from the center of the GPR basin. In SJT, mean annual precipitation between the hydrological years 1938/39 and 2009/10 is 714 mm, and the annual precipitation ranging between 263 and 1276 mm. At the monthly scale, maximum, and mean precipitation values indicate high interseasonal variability (447 and 102 mm in November, and 31 and 3 mm in July, respectively).
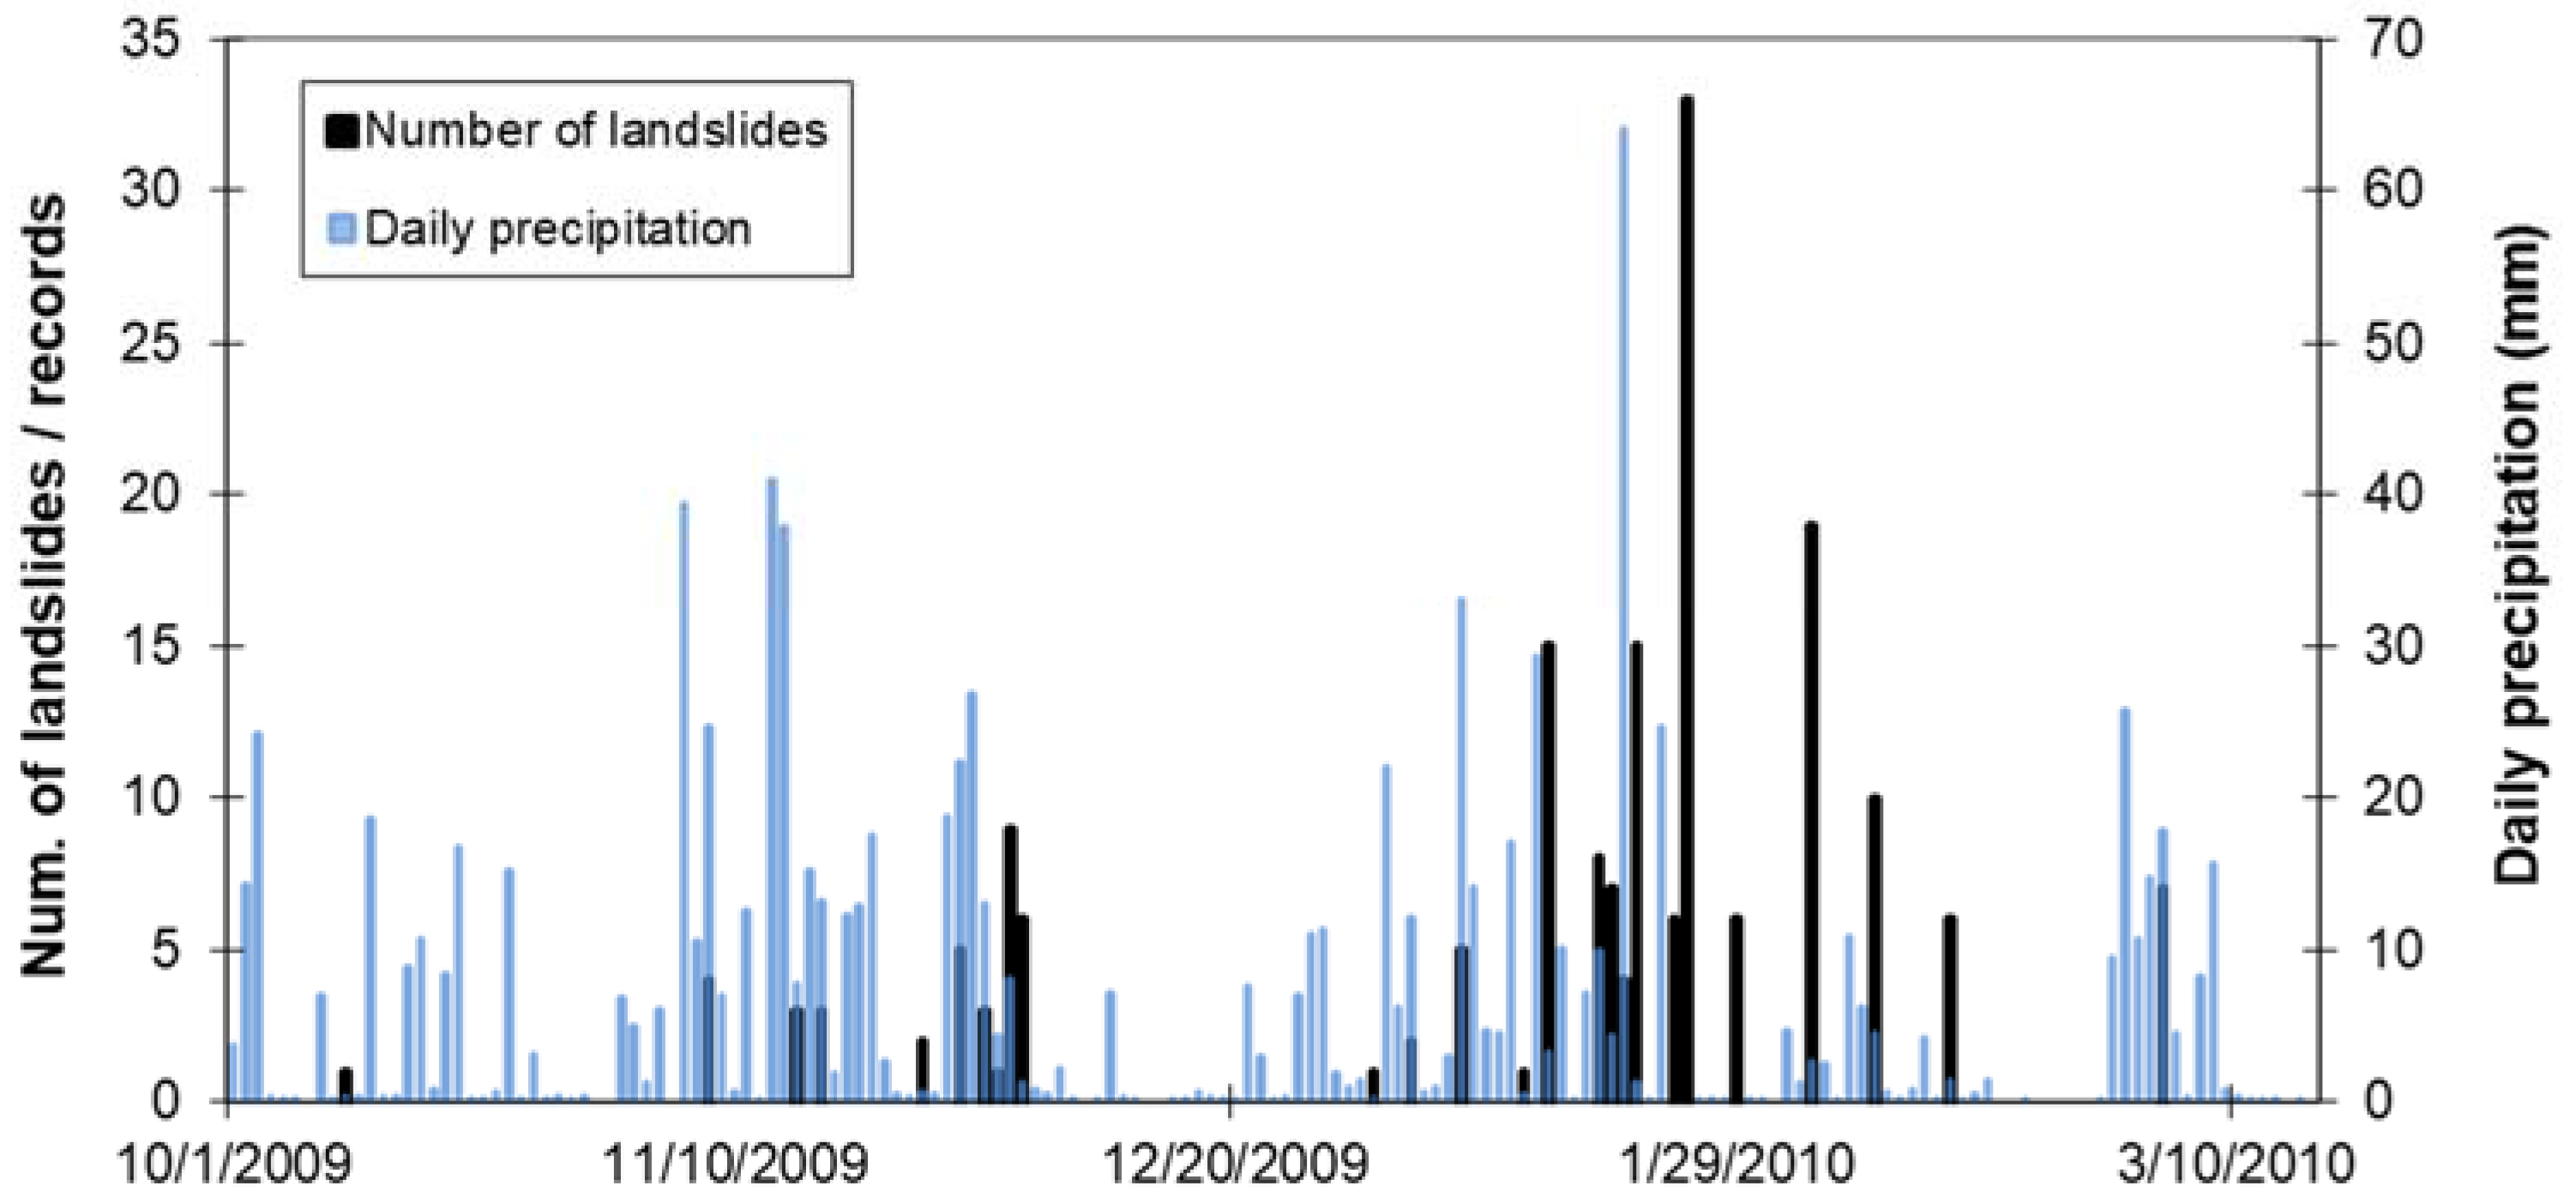
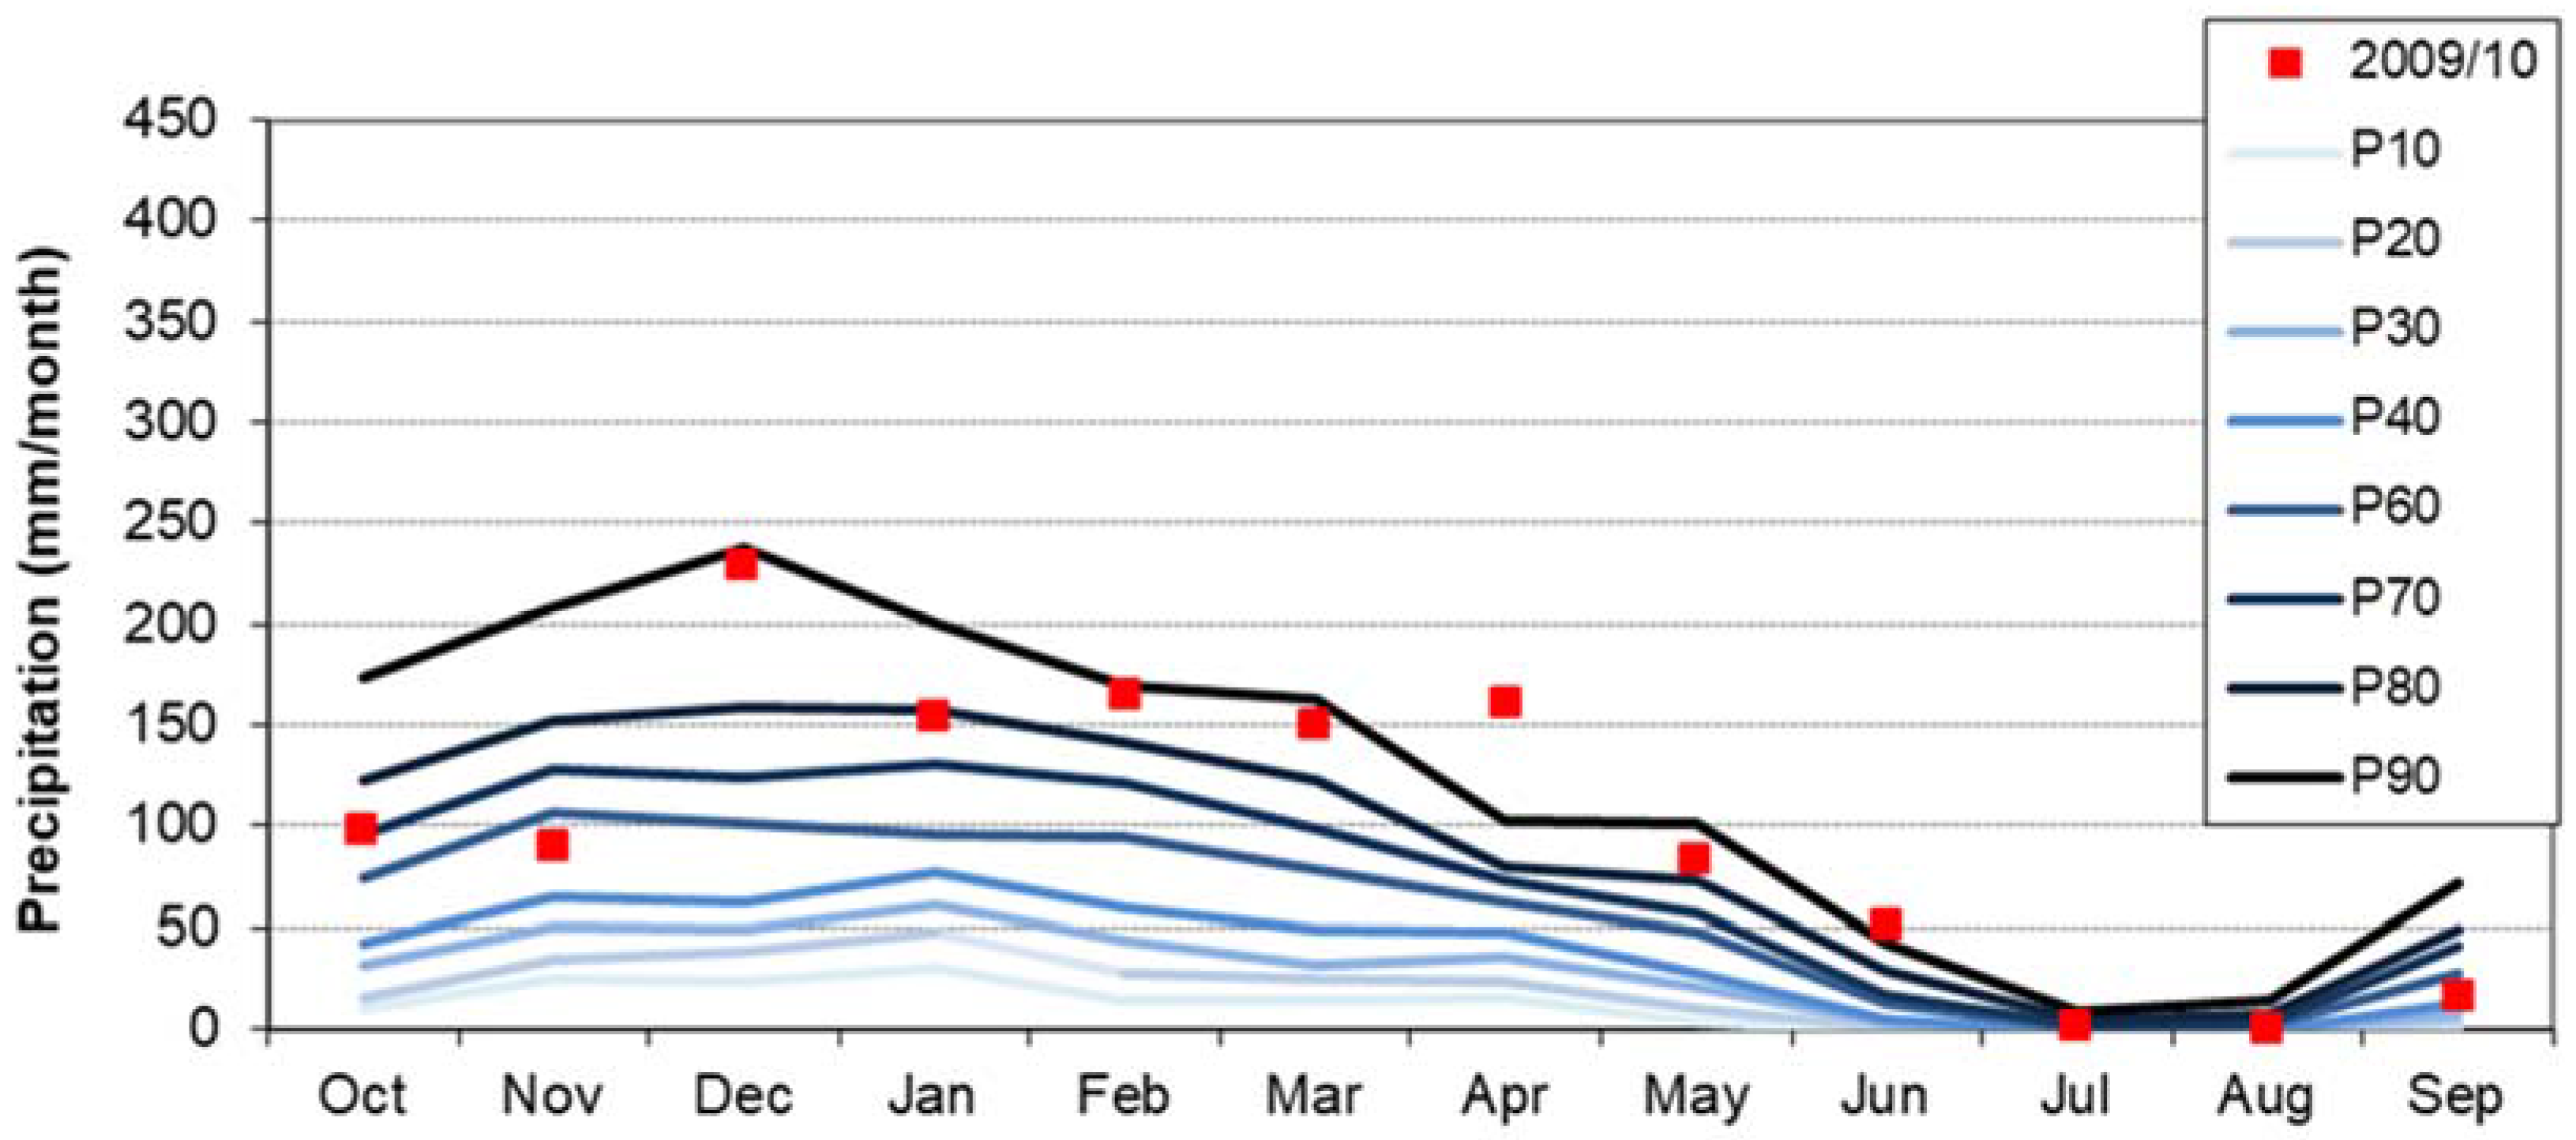
The precipitation recorded during the hydrological year of 2009/10 was the highest ever recorded (1276 mm) since 1938/39. In this hydrological year monthly precipitation between December 2009 and June 2010 was equal or higher to the 80th percentile of the whole monthly precipitation data (
Figure 2).
3.3. Hydrodynamic Modelling of the GPR Basin
The hydrodynamic regime of the GPR basin was studied by using Visual Balan v.2 [
33]. This is a lumped parameter model of daily sequential water balances in the edaphic soil, unsaturated zone, and saturated zone, which calculates the daily variations of the regional water table level, total stream flow, and other related variables (e.g., regional moisture content of the edaphic soil, subsurface flow in the unsaturated zone, and groundwater discharge).
Due to the lack of meteorological data within the GPR basin, the model of daily sequential water balances was defined with meteorological data (precipitation and temperature) from two stations that were located nearby the study area. Data from these two meteorological stations were treated by attributing a weighing factor that corresponds to the inverse of the distances between each station and the centroid of the GPR basin. A daily average value was then calculated for daily precipitation and temperature. For precipitation, we used data from Arranhó (20C/03G–SNIRH code) and São Julião do Tojal (20C/01C) stations, while for temperature, we used data from São Julião do Tojal (20C/01C) and Meca (19C/08C) stations.
This model was calibrated with stream hydrometric data from a station located in a downstream point of the GPR basin—Ponte Couraça station (19D/05H), which represents the total stream flow of the studied basin. These datasets were collected for the hydrological years (October to September) of 1987/88 and 1988/89. These are available in the National Water Resources Information System (SNIRH) of the Portuguese Environment Agency (
http://snirh.apambiente.pt). This station has a stage-discharge rating curve, which allowed for the direct conversion from mean daily stream level into mean daily stream flow rate. Calibration of the model relied on the search for the best fit between measured flow rate data in Ponte Couraça station and model-estimated flow rate. In this process, the values of the parameters identified in the column “Source” of
Table 1 as “Obtained/Adjusted through Calibration” were determined or changed, respectively, in order to minimize the difference between measured and model-estimated values.
Daily water flow measured in the Ponte Couraça station and those calculated by the model define a linear relationship with a coefficient of determination (R2) of 0.65. After obtaining this satisfactory model calibration for the period 1987 to 1989, the model was subsequently applied to the hydrological year of 2009/10.
All of the parameters used in the water balance model (
Table 1) were estimated through field work measurements, calculations, and calibration, or were obtained from literature focusing on the study area.
3.4. Back-Analysis of Deep-Seated Landslides
Back-analysis of selected deep-seated landslides was performed to assess the critical conditions (geotechnical and hydrological) that prepare the occurrence of landslides that do not fit the explanation that is drawn by the basin hydrological model. From the eleven deep rotational slides inventoried, two were selected to perform back-analysis. The selection criteria were the availability of geotechnical data or the existence of water wells for measuring oscillations of water table nearby the landslides. The two landslides are very different in terms of style and distribution of activity, which allows, at least in theory, a greater scope for the study. The landslide case study one (Cachoeiras landslide,
Figure 1) is a roto-translational slide that blocked circulation over a municipal road intermittently for almost three years (from 2010 to 2013). The landslide case study two (Espogueiro landslide), is a typical deep-seated rotational slide that partially destroyed an asphalted road and a house.
For each landslide case study, the limits of the landslide and its features indicative of soil internal deformation (e.g., secondary scarps, transverse fractures, back tilting lineaments) were acquired by doing a real-time GPS survey, made with a Magellan MobileMapperTM CX GPS and positioning real time correction with EGNOS (European Geostationary Navigation Overlay Service) system. Orthometric altitude of each point was determined by correcting the ellipsoidal altitude. The GeodPT08 model [
38,
39] was used for this purpose, allowing for an altimetric accuracy that was better than 4 cm for three-dimensional (3D) real-time GNSS (Global Navigation Satellite System) users [
38].
For each landslide case study, a geological model was constructed while considering borehole log and field data (e.g., identification of rock outcrops, measurements of water table). Afterwards, several stability analyses were carried out with the software Slope/W© 2004 (GeoSLOPE Int., Calgary, AB, Canada), which enables the performance of limit equilibrium slope stability analysis for different depths of water table and changing shear strength conditions. This allowed for the simulation of shear strength parameters’ degradation with time. The analyses carried out were performed using the Morgenstern-Price method, while considering a half-sine inter slice action function, and the pore water pressure based on high and low phreatic positions deducted from field data collected nearby, using the phreatic correction. Results are expressed as factors of safety (FS); values lower than 1 indicates that destabilizing shear forces are superior to resistant forces, and so the slope is unstable. For determining the position of the critical slip surface with the lowest factor of safety, the Grid and Radius method was used for the Cachoeiras landslide, yet for the Espogueiro landslide, the Entry and Exit method was used, which allow for specifying the location where the trial slip surfaces will likely enter the ground surface and where they will exit.
3.5. Methods: Summary and Critical Analysis
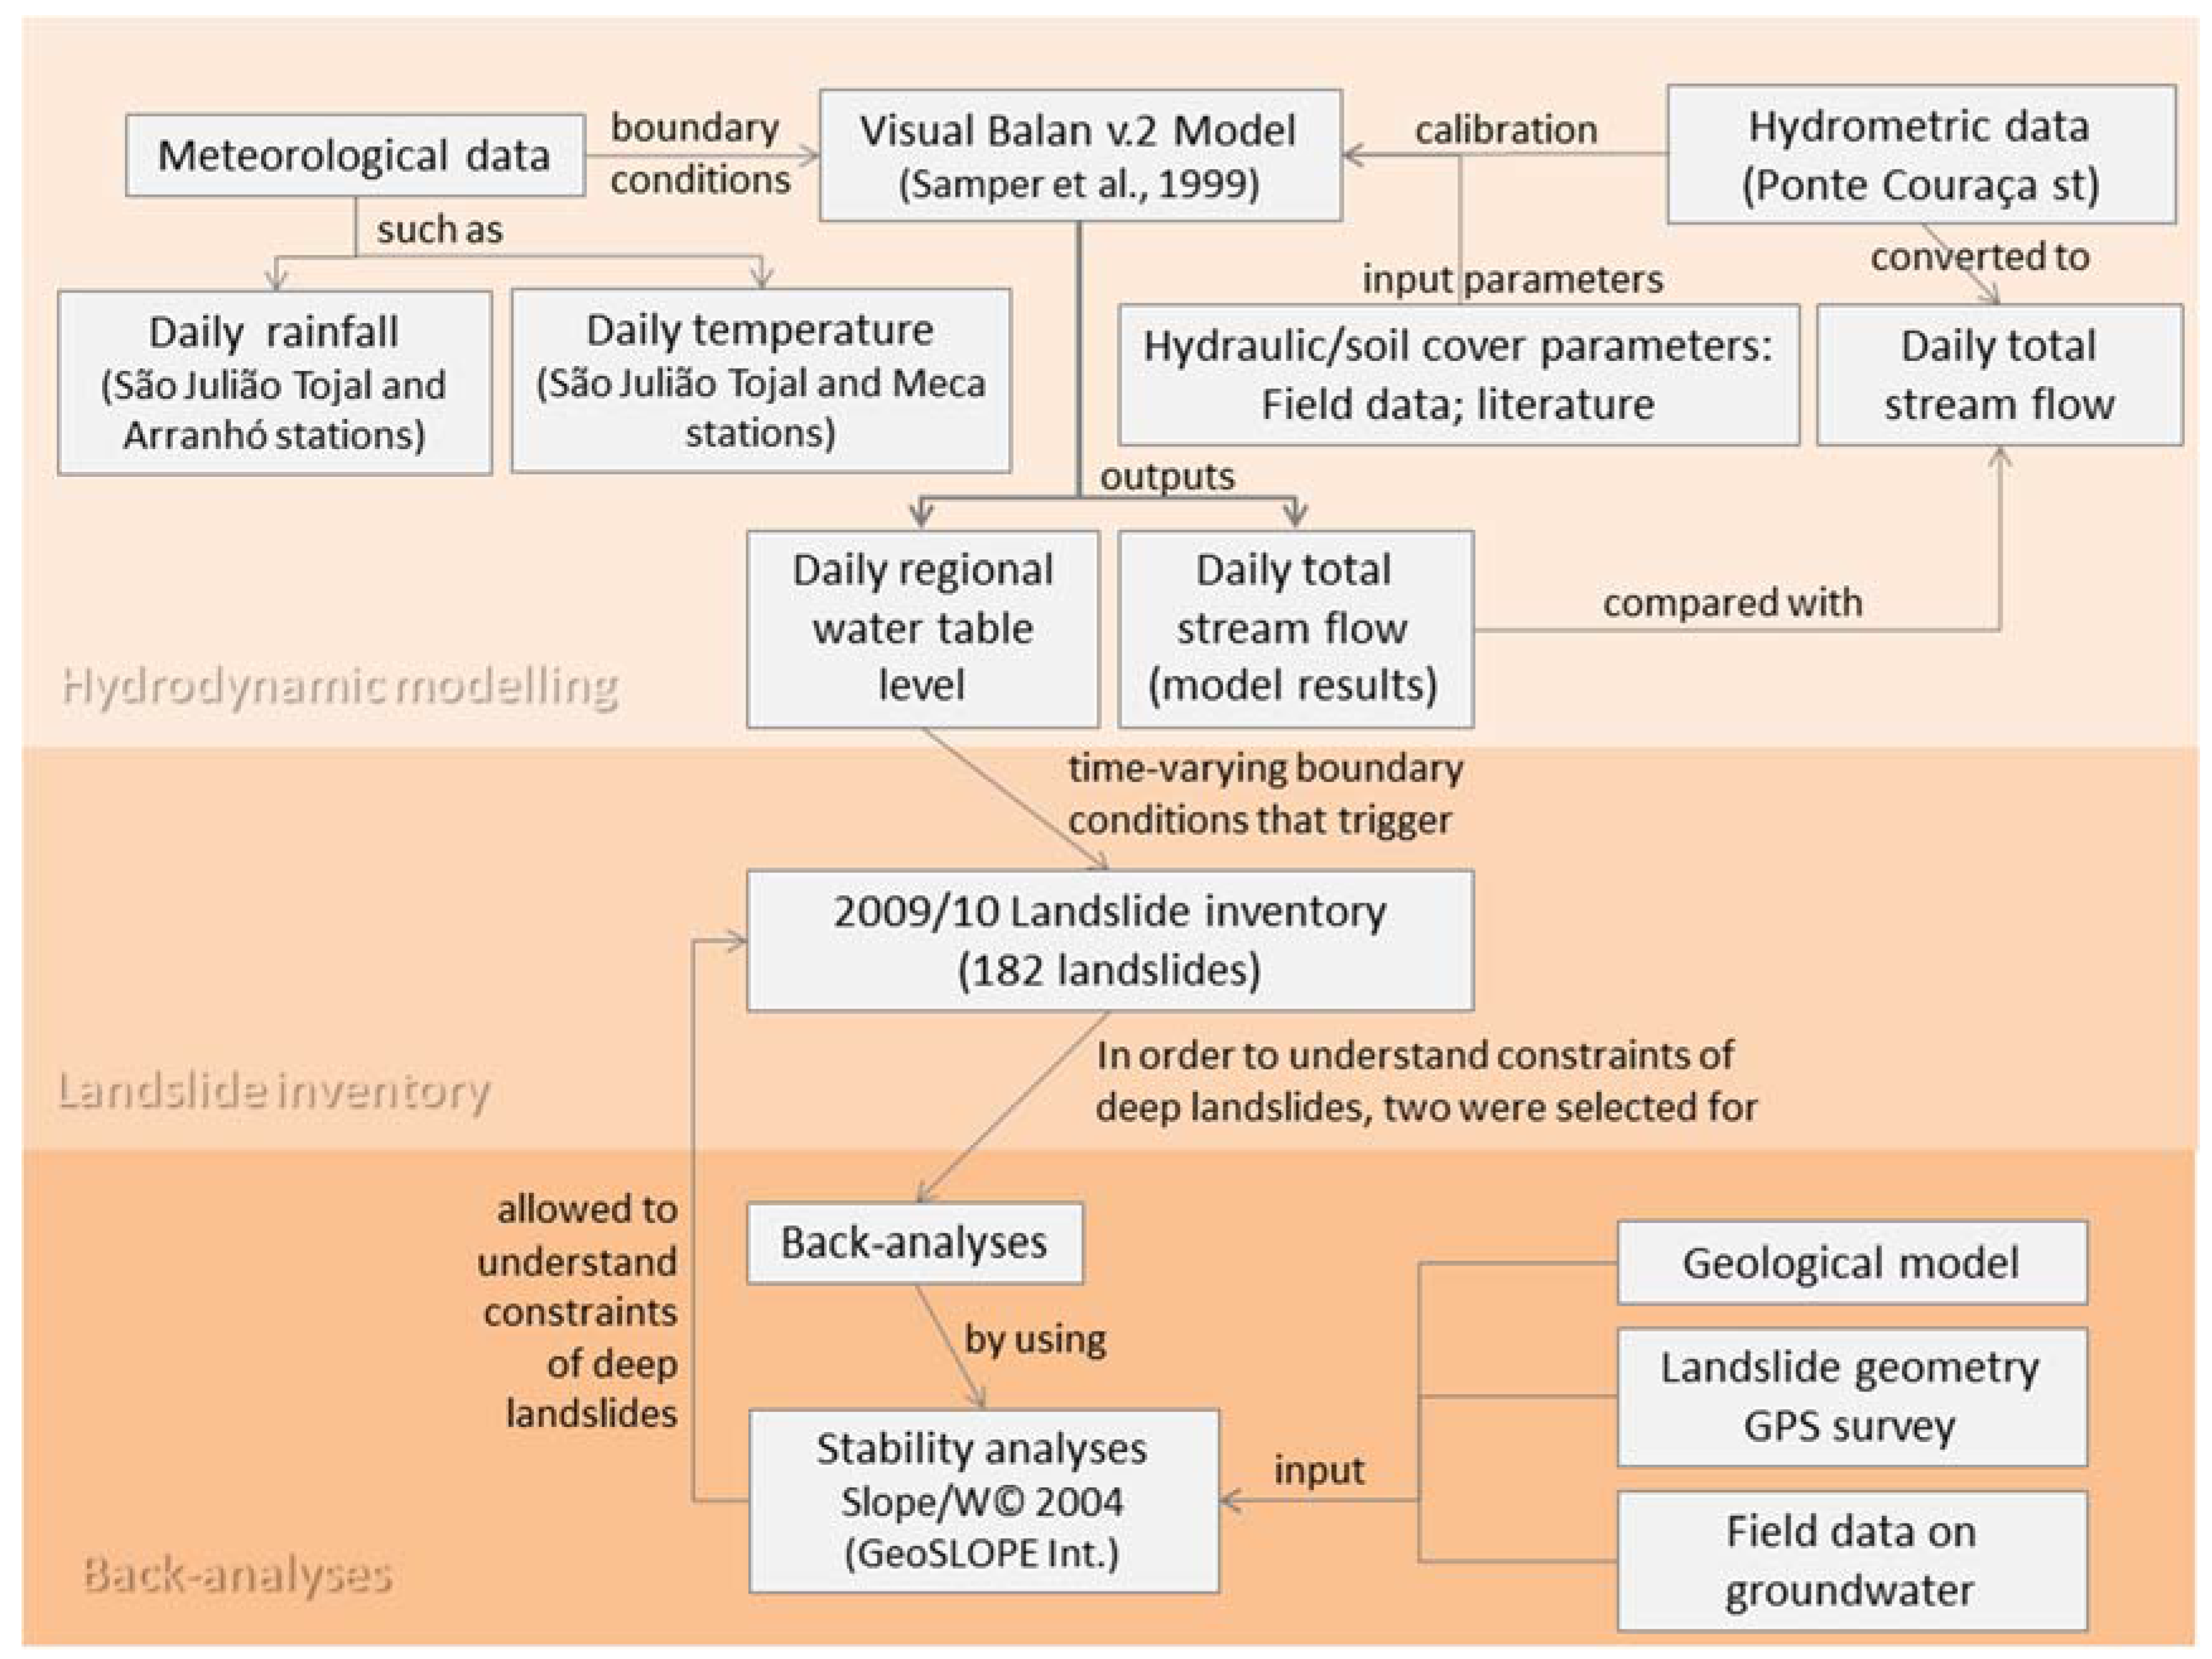
The flowchart in
Figure 3 summarizes methods used in the present study.
The methods that were used have the advantage of using a simple lumped parameter model, which turned out to be efficient to characterize oscillations of regional water table level on a daily basis. These results are important since they could contribute, in addition to the rainfall thresholds defined for this study area [
22], for a more accurate temporal prediction of landslide occurrence. In the methods used, the disaggregation of the water table oscillation according the outcropping geological formations is still a source of uncertainty and is a work in progress. Even so, in the most representative geological complex of the river basin, the Abadia complex, where most of the landslides occurred, there was a good adjustment of water table levels and landslide occurrence. Conclusions that are drawn in this paper, which compare the hydrodynamic character of the drainage basin and the occurrence of landslides, apply specifically for the hydrological year 2009/10, so it would be interesting to apply this same methods to other hydrological years to confirm the results here obtained. Back-analyses highlighted the importance of local conditions to understand the occurrence of specific landslides (e.g., existence of low resistance layers, occurrence of previous landslides in that specific area).
4. Results
4.1. Hydrodynamic Character of the Drainage Basin (Hydrological Year 2009/10)
The calibrated lumped parameter model of daily sequential water balances of the GPR basin for the hydrological year 2009/10 indicates that most of the precipitation (40%) returned to the atmosphere through actual evapotranspiration (AET). The remaining water percolated in the unsaturated zone as subsurface flux (28%), flowed above ground as surface runoff (18%), and contributed to groundwater recharge and subsequent discharge (14%).
When comparing to the average hydrological year, 2009/10 was atypical considering its lower AET and higher percentage of surface runoff. This change in water balance is related to the higher amounts of rainfall (and associated cloudiness) that occurred during the hydrological year. Specifically, as compared to the hydrological years 1987/88 and 1988/89 (which were used for model calibration), during 2009/10 more intense rainfall events (in terms of quantity/duration) were registered. These intense rainfall events exceeded the infiltration capacity of the soil, and so the remaining water became available for surface runoff. In addition, subsurface flow in the unsaturated zone was likely faster and more significant during these events.
The estimated daily regional moisture content of the edaphic soil during 2009/10 shows frequent oscillations that are associated to precipitation events, and the maximum value (~470 mm) is reached several times during this hydrological year. In contrast, daily excess of water in the soil (when volume of water surpasses the porosity of soil) shows less frequent and intense oscillations, and its maxima can be correlated to major precipitation events in terms of rainfall amount and duration.
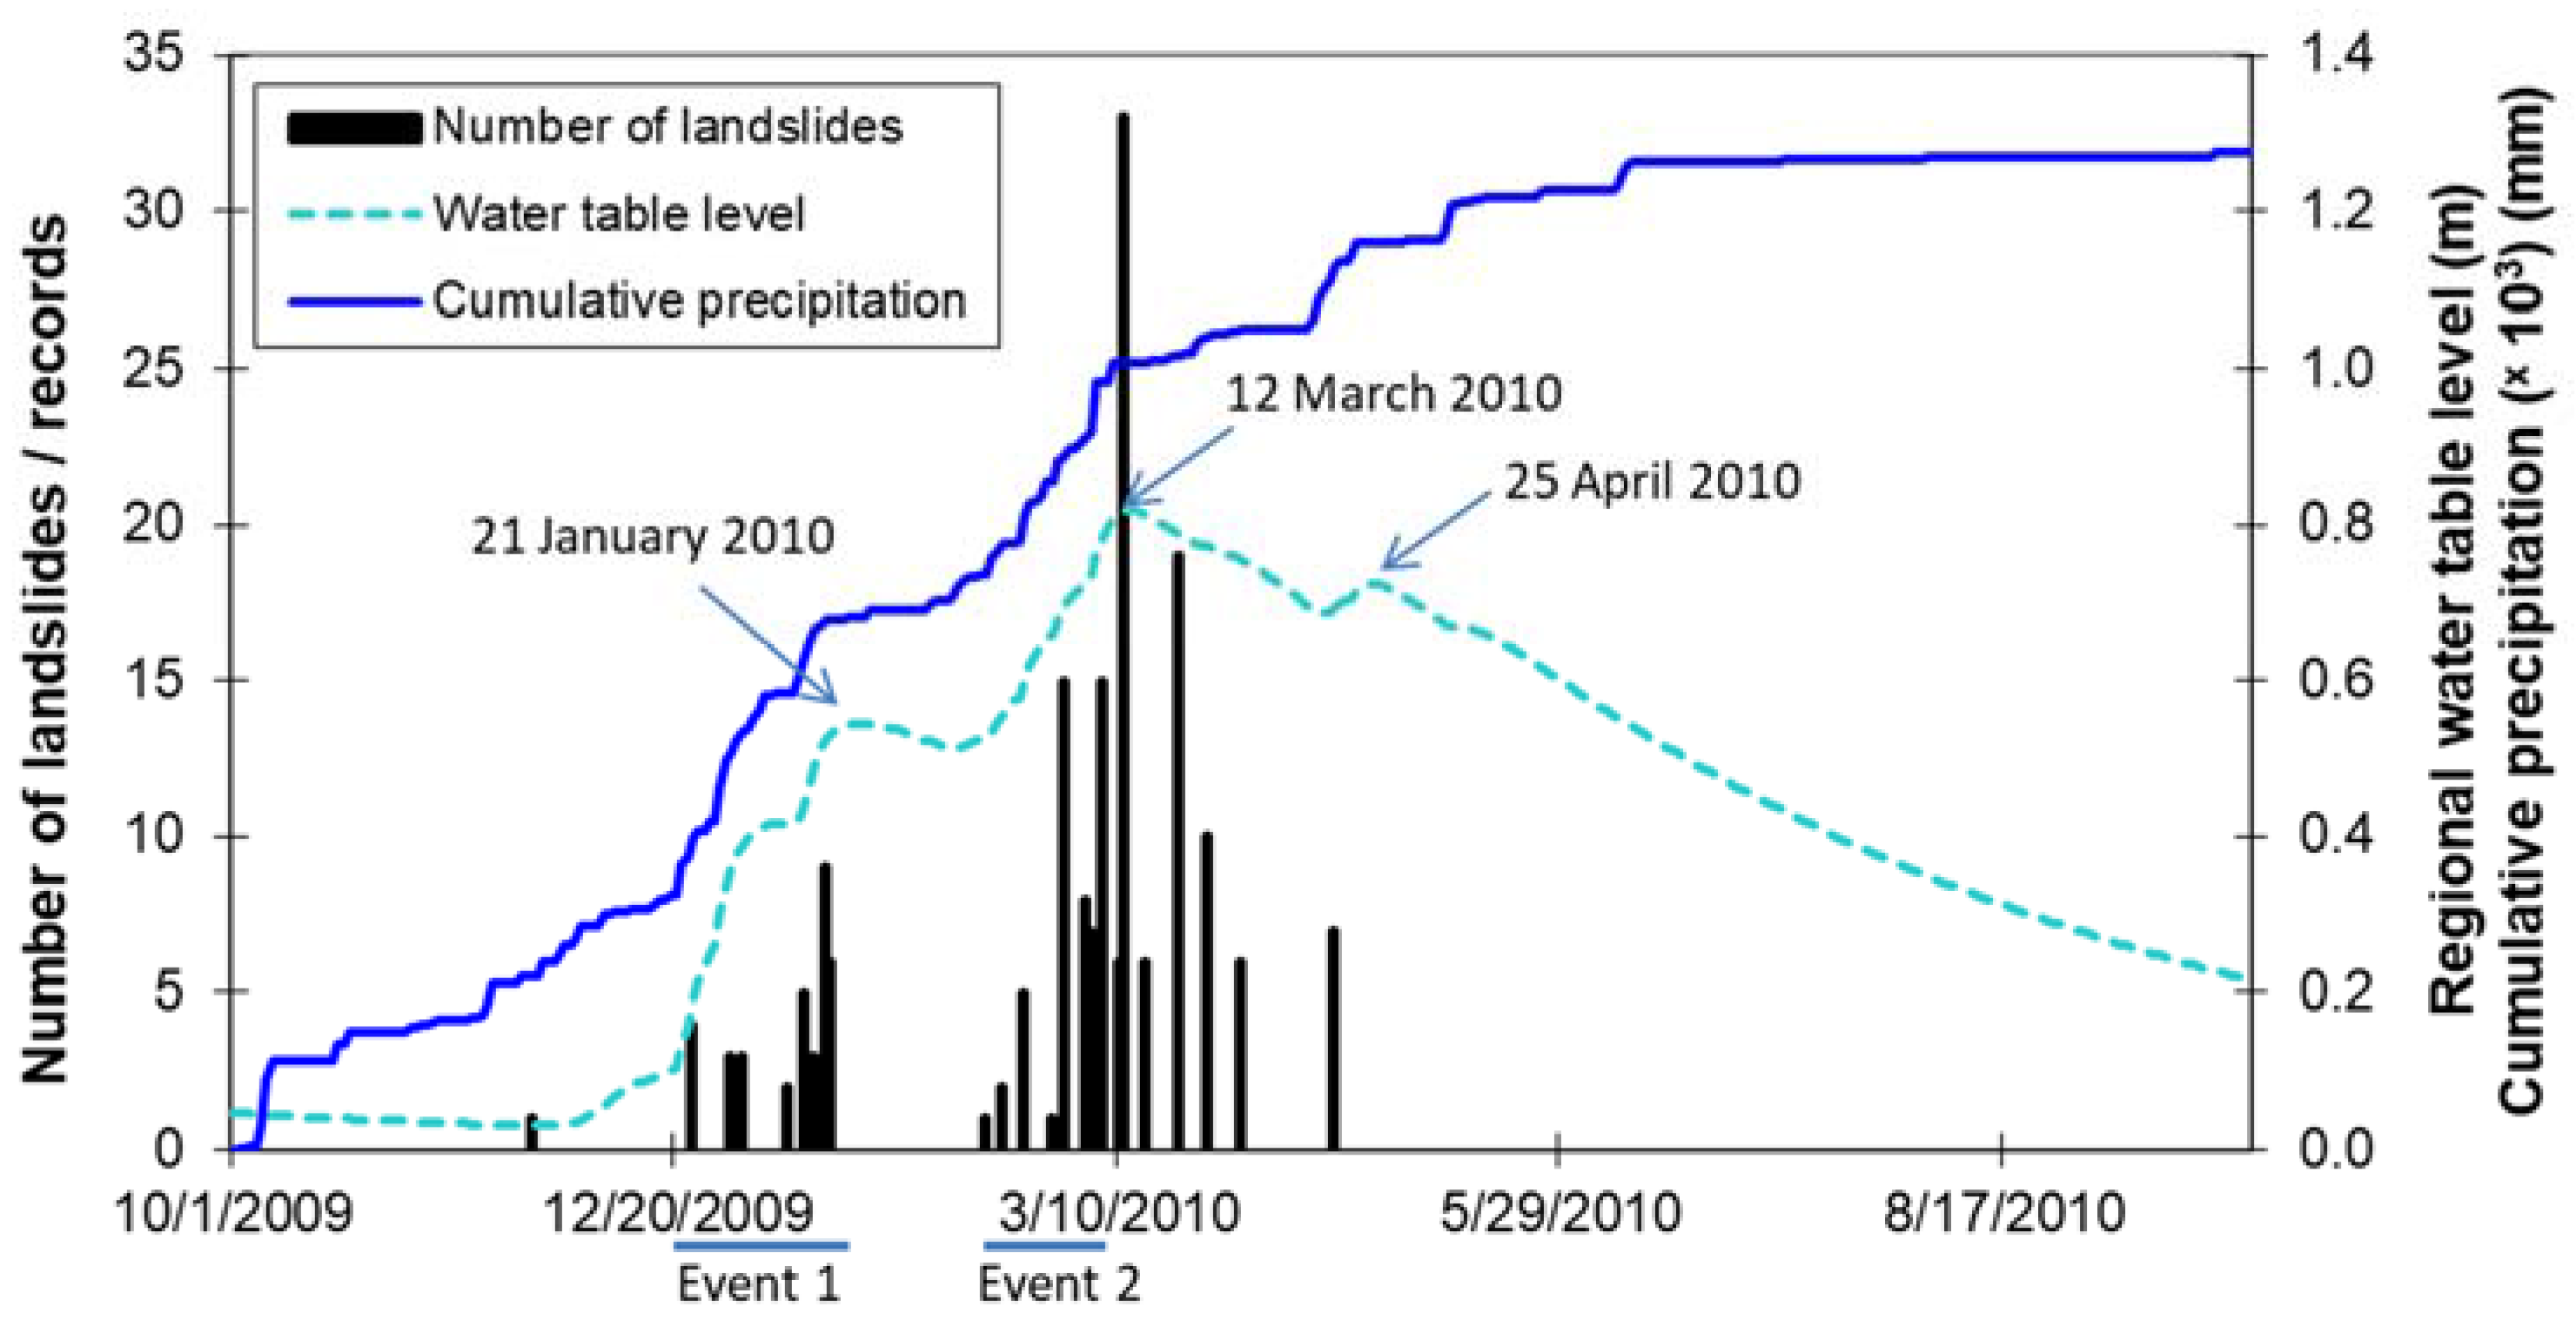
Estimated regional oscillation of the water table has lower frequency, and generally four oscillation cycles were identified throughout the hydrological year 2009/10. The regional water table reached three maximum values, the first on 18 January 2010, second on 11 March 2010, and finally on 23 April 2010. The water table level is referenced to a fictitious discharge level defined in the model in order to calculate the oscillation of water table level above this level where groundwater discharge occurs.
4.2. Relationship between the Occurrence of Landslides, Precipitation and Water Content in Edaphic Soil
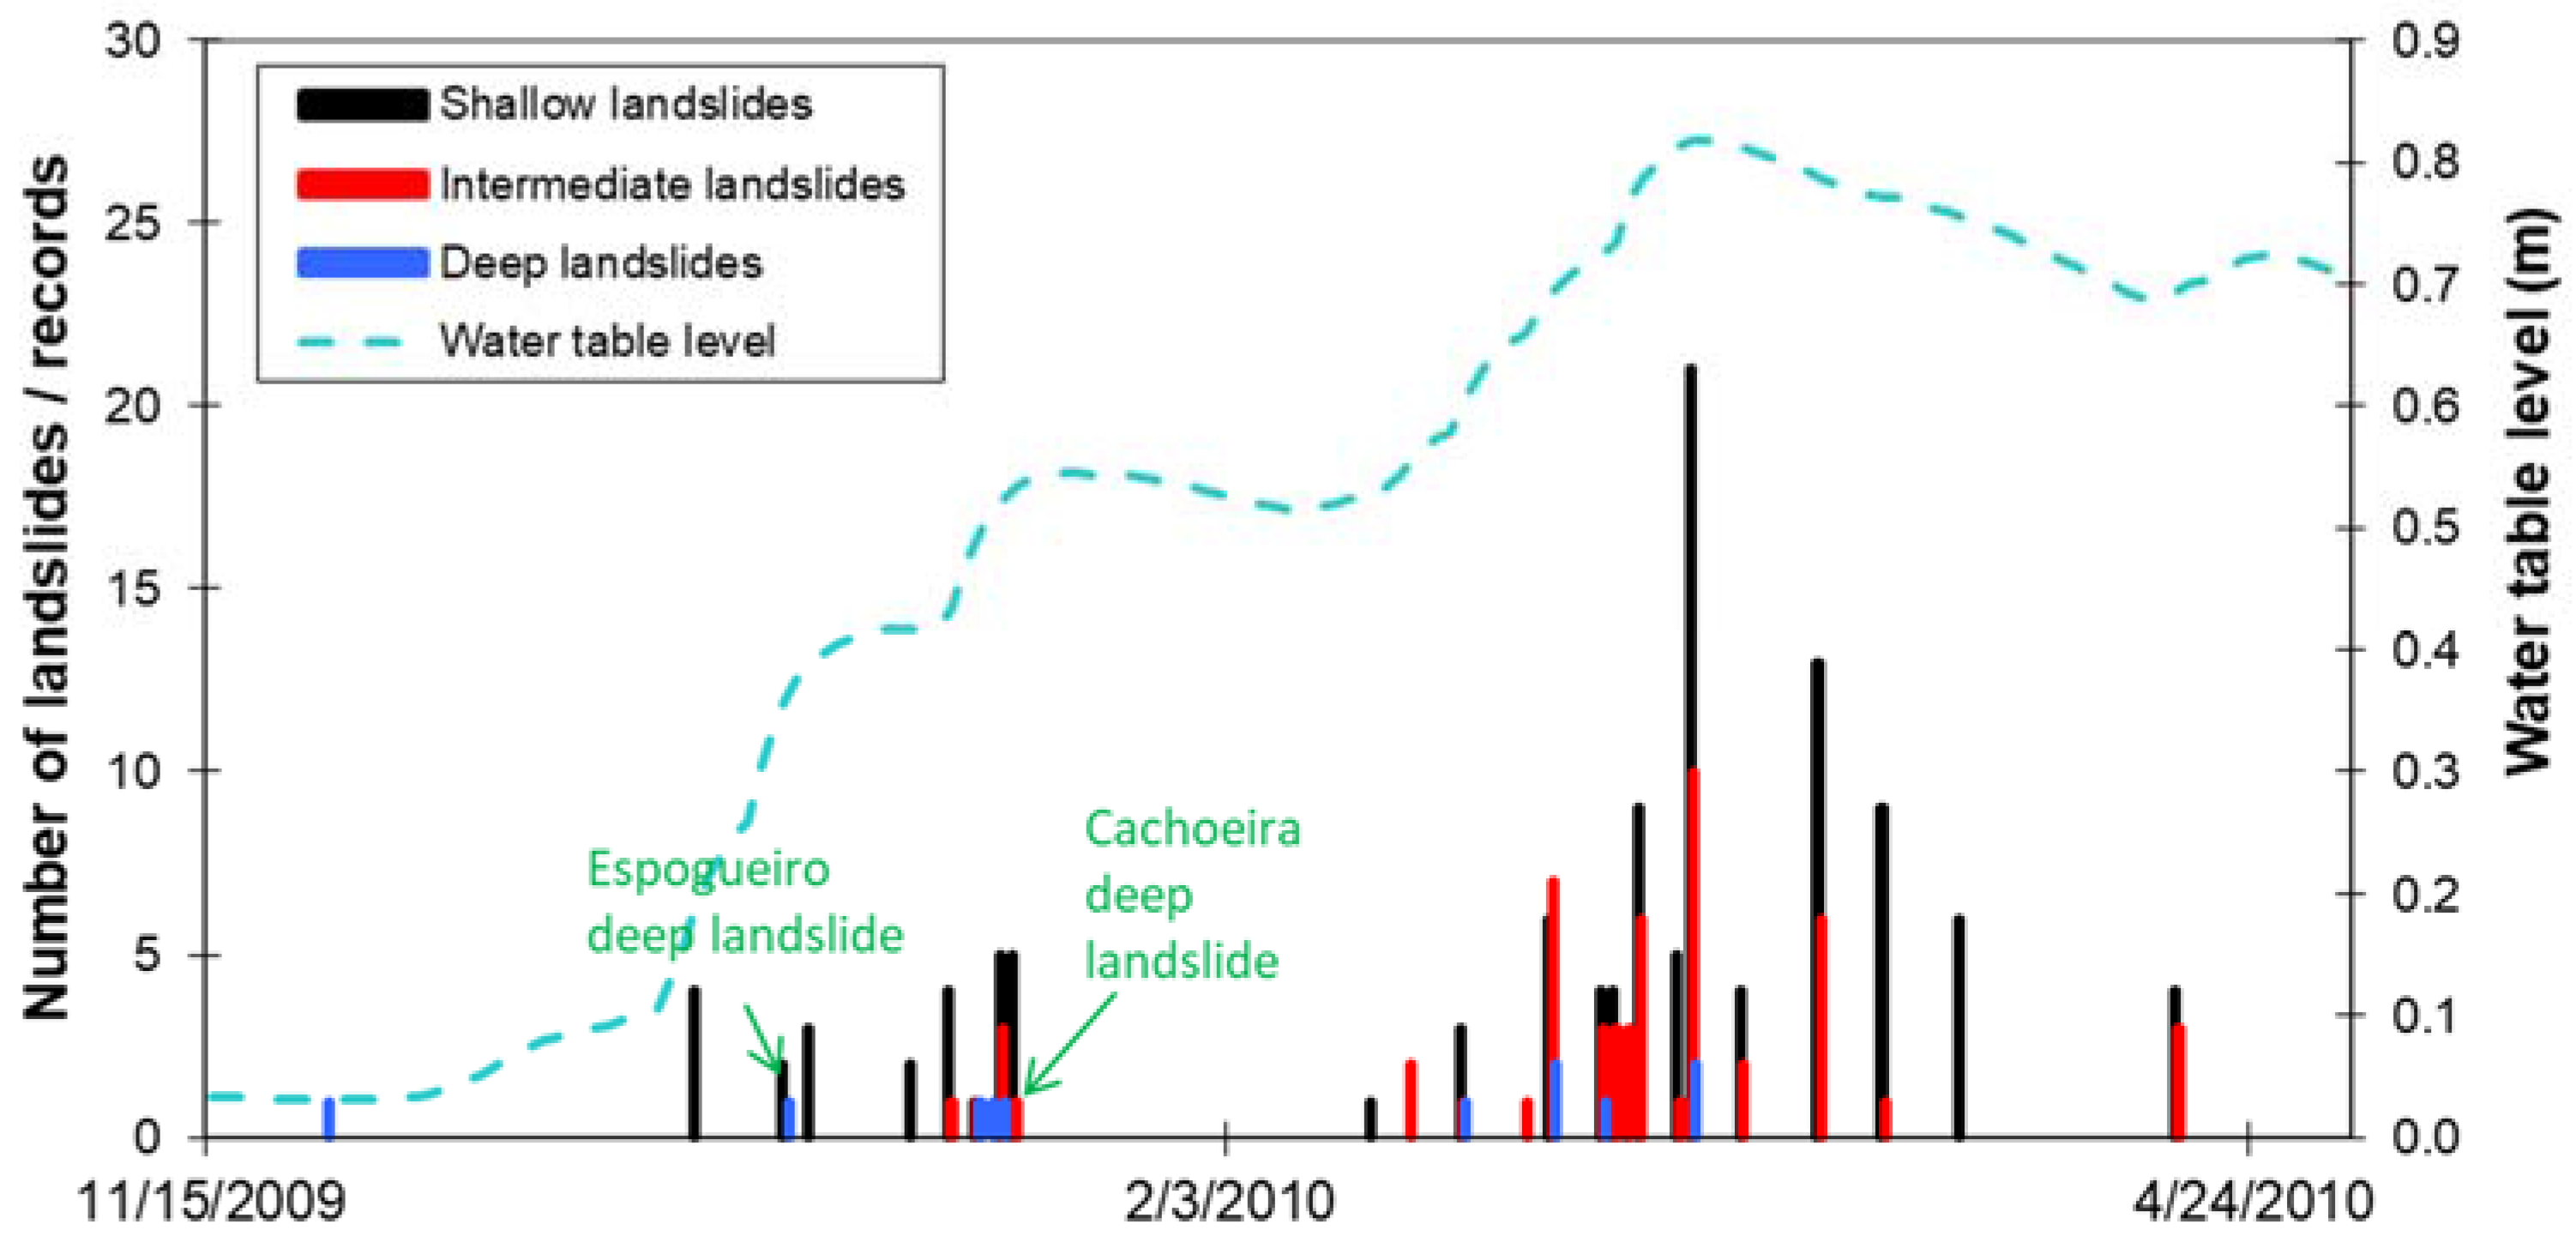
Daily precipitation peaks and higher number of recorded landslides seem to have a lag of 1–3 days (
Figure 4). This temporal relationship is somehow expected because it is not the precipitation itself that triggers landslides, but instead, water infiltration in the edaphic soils, percolation of water in the unsaturated zone, and fluctuations of the water table that increase driving stresses and reduce shear strength, and consequently favor conditions for slope instability.
Estimated daily soil moisture content and landslide occurrence records do not show a clear relationship amongst each other (not shown). While the first has frequent oscillations (values oscillated between 440 and 470 mm throughout the hydrological year in seven cycles), the second gradually increases throughout the hydrological year until March and decreases thereafter (
Figure 5).
Yet, temporal distributions of landslides occurrence and daily variation of regional water table reveal a clear resemblance amongst them (
Figure 5). For instance, three maxima of water table (21 January 2009, 12 March 2010, and 25 April 2010) occur right after those days with higher number of landslides (18 January 2009, 11 March 2010, and 23 April 2010, respectively).
Rise of regional water table started after cumulative precipitation reached 300 mm (7 December 2009), and practically it was after this date that landslide occurrences started (
Figure 5).
This positive relationship is particularly notorious only if the ascending phase of the water table curve is considered (
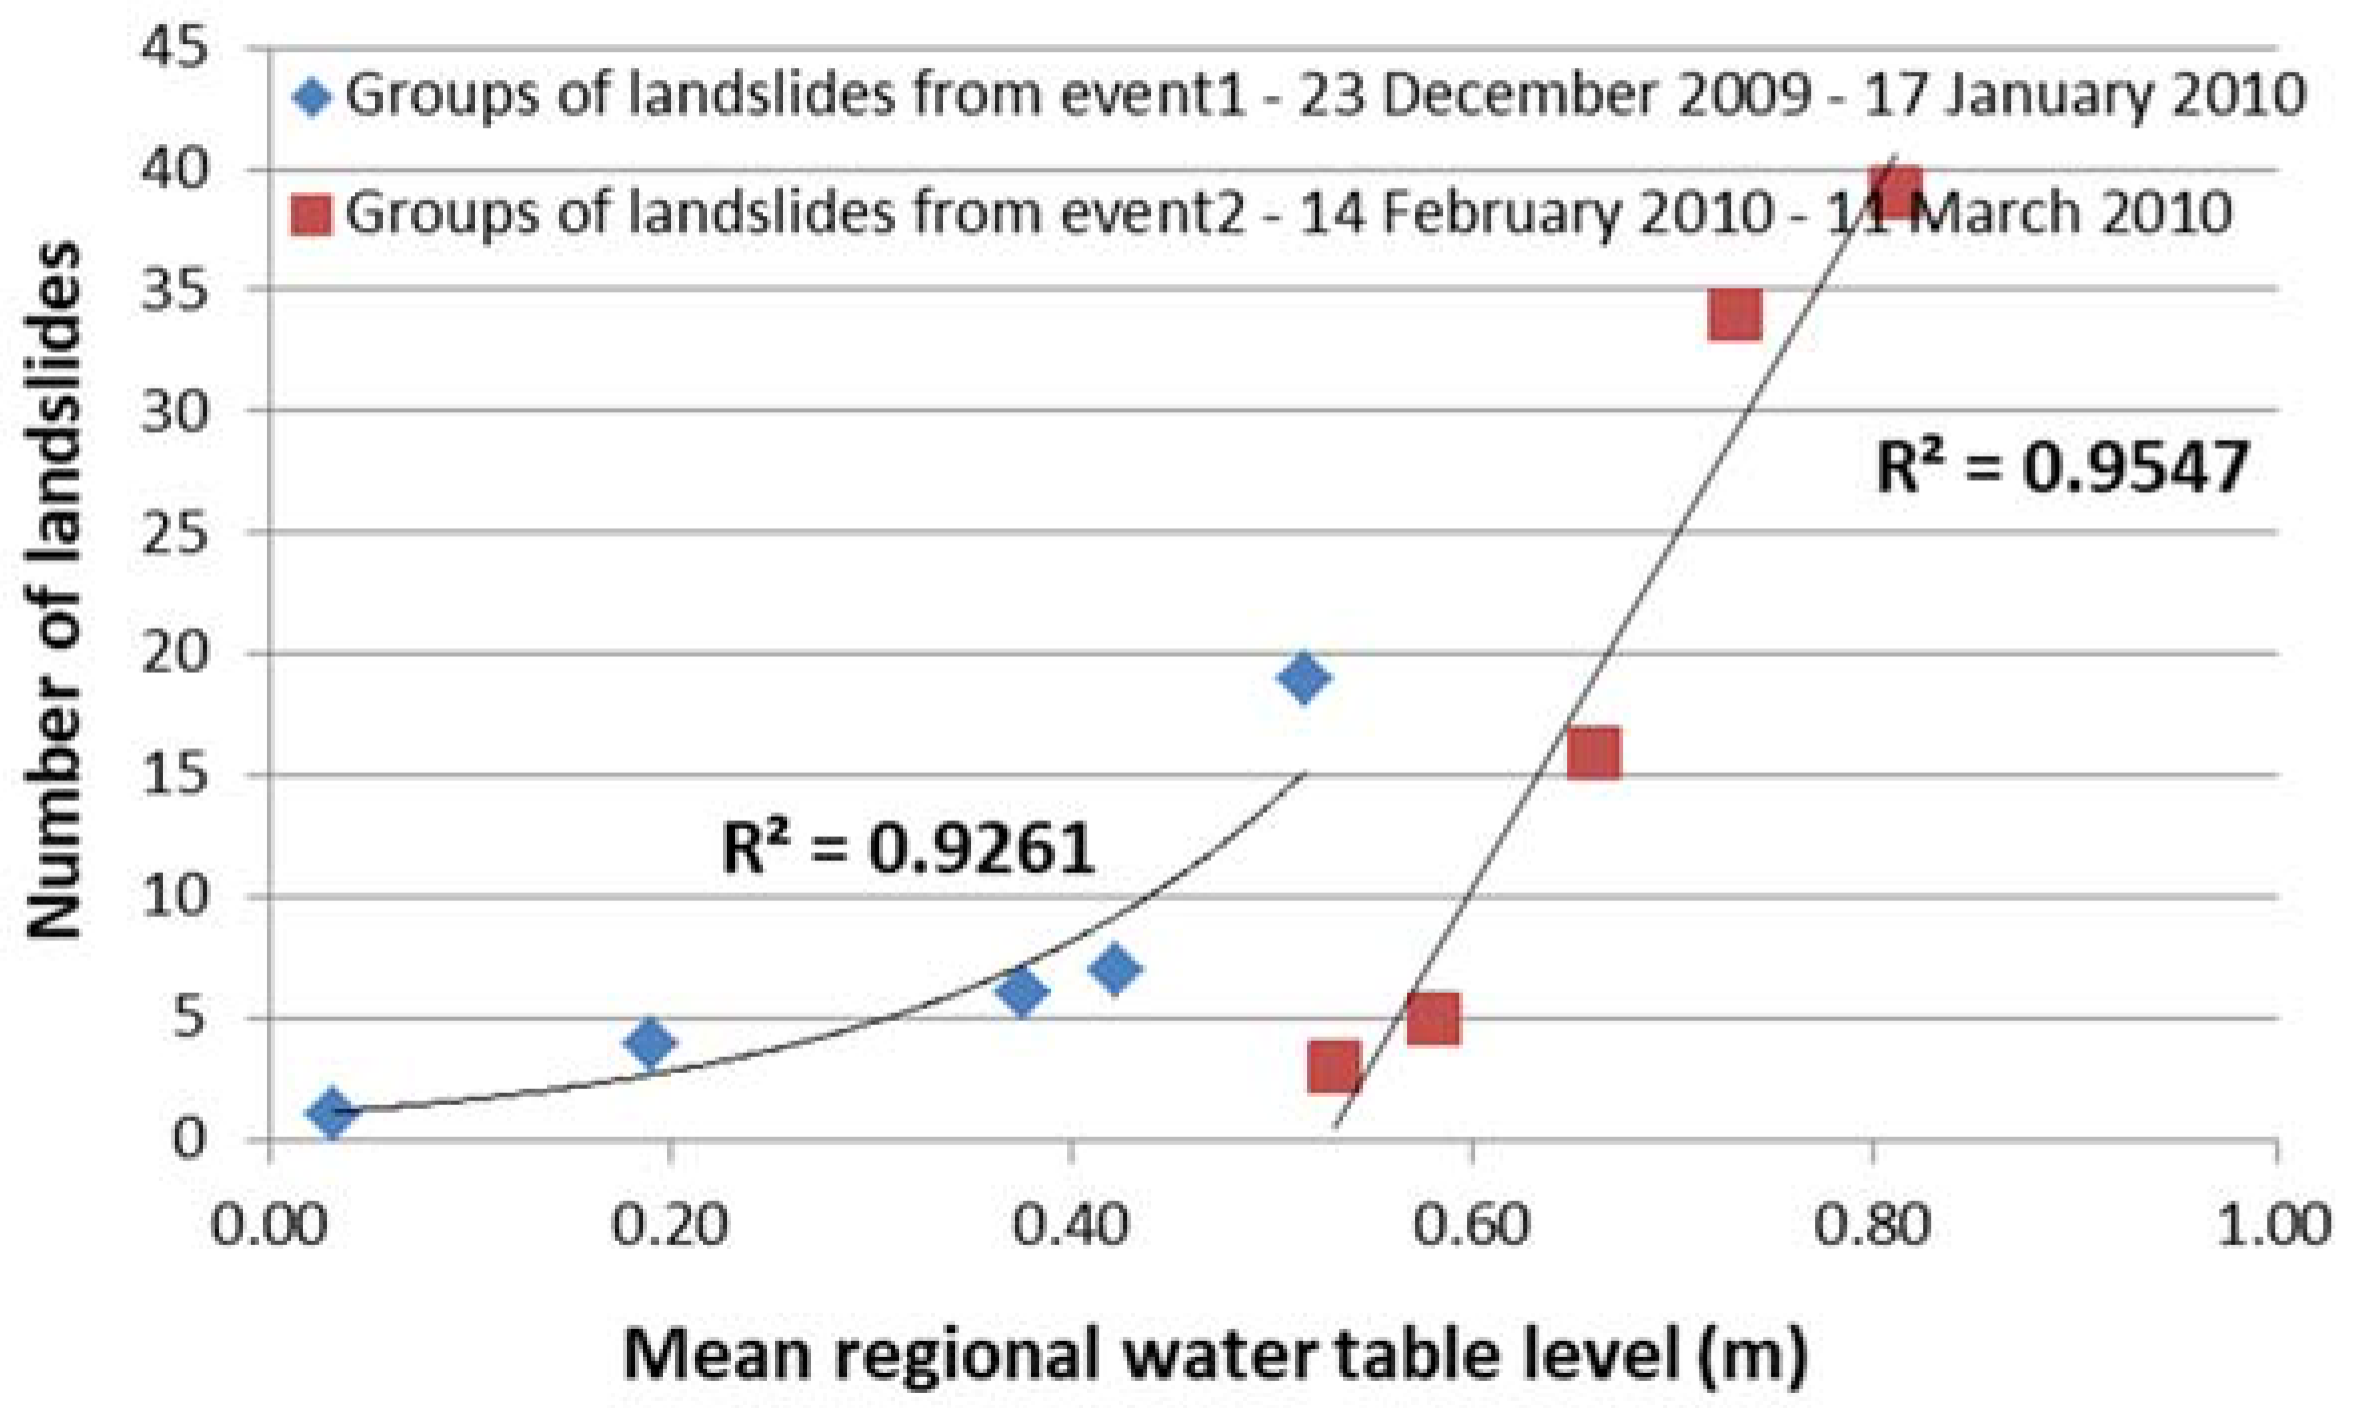
Figure 5 and
Figure 6). In
Figure 6, only landslides that occurred during the ascending phase of water table were considered and were analyzed separately if they occurred during different slope instability periods. Temporal distributions of landslides occurrence allow for the separation of two distinct “landslide events” (in this work landslide event is used as synonymous to different slope instability periods identified from the 2009/10 seasonal landslide event). The first event occurred between end of December 2009 and January 2010, and the second between middle February and middle April 2010 (
Figure 5). These two landslide events are in accordance with those identified in [
12] for the area north of Lisbon.
Is it expected that slope failures occur while water table is rising, gradually affecting new portions of the overlying unsaturated zone. This is why, in the second event, a mean water table rise around 0.5–0.6 m only led to three or five landslides, while previously in the first event the same regional water table level led to 19 landslides (
Figure 6). During the first event, most of the unstable areas affected by that water table level suffered failure, and so in the second event less areas where available to slide for that same water table level.
During the descending phase of the water table, landslides may also occur, but the potential for their occurrence decreases, and so the relationship between both variables changes.
When comparing the estimated regional water table oscillation to the frequency of landslides differentiated by the lithology affected (not shown), depth of the rupture surface (
Figure 7), and type of rupture (not shown), it becomes clear that landslides affecting the LU1, specifically those that were classified as shallow and intermediate regarding the depth of the landslide rupture surface and as rotational landslides are the most responsive to regional water table oscillation.
On the other hand, landslides affecting the LU2 or LU3 (not shown) do not seem to be related to the regional water table oscillation. Even deep-seated landslides do not seem very sensitive to this oscillation (
Figure 7).
In this way, in order to better understand the factors that trigger and constrain the occurrence of deep-seated landslides affecting LU1, back-analyses of two landslides from the inventory are done in the next section.
4.3. Back-Analyses of Two Specific Landslide Cases That Occurred in 2009/10
Back-analyses of two deep-seated landslides were performed to assess the critical geotechnical conditions that constrained and triggered those landslides that occurred in the GPR basin during the hydrological year of 2009/10. Note that both landslides were triggered while estimated regional water table was not at its highest level (at 30 October 2009 and 16 January 2010, Espogueiro and Cachoeiras landslides, respectively) (
Figure 7).
4.3.1. Cachoeiras Landslide Case Study
General Context and Landslide Characterization
The Cachoeiras case study is a complex landslide, in detail a deep roto-translational slide initiated in mid-January 2010 (
Figure 1). Regarding landslide deformation pattern, it started as a deep rotational slide in the upper section of the slope, and until 2013 it evolved by multiple progressions, on its frontal section to a translational slide in an advancing distribution of activity and retrogressing by extending the rotational slide rupture surface in the direction opposite to the movement of the landslide mass (according to the [
40] classification of landslide distribution of activity).
This landslide affected an area of 12,205 m
2, with a maximum length of 140 m and maximum width of 115 m. The part of the rotational slide component on the slope upper section affected an area of 8132 m
2, with a maximum length of 92 m and maximum width of 117 m. Landslide volume was estimated using the empirical equation proposed by [
41]. The rotational slide volume was determined to be 34.6 × 10
3 m
3. When considering this volume, the maximum depth of the rotational slide surface of rupture was estimated to be 6.1 m by using an adaptation of the empirical volume equation from [
42].
Generically, the slope where this roto-translational slide occurred has a low to moderate slope angle of between 5° and 16°. In the slope upper section there is a visible lump with a higher slope angle (24°). Near the base of the slope there is a paved municipal road that is used to access the Cachoeiras village and further upslope there is a major highway (A10). Before the occurrence of the landslide the slope had spontaneous vegetation, mainly herbaceous and shrubs.
In the area of the slope with the highest slope angle, a landslide was identified previously in the orthophoto of 1983, with its limits and deformation area of accumulation being well defined.
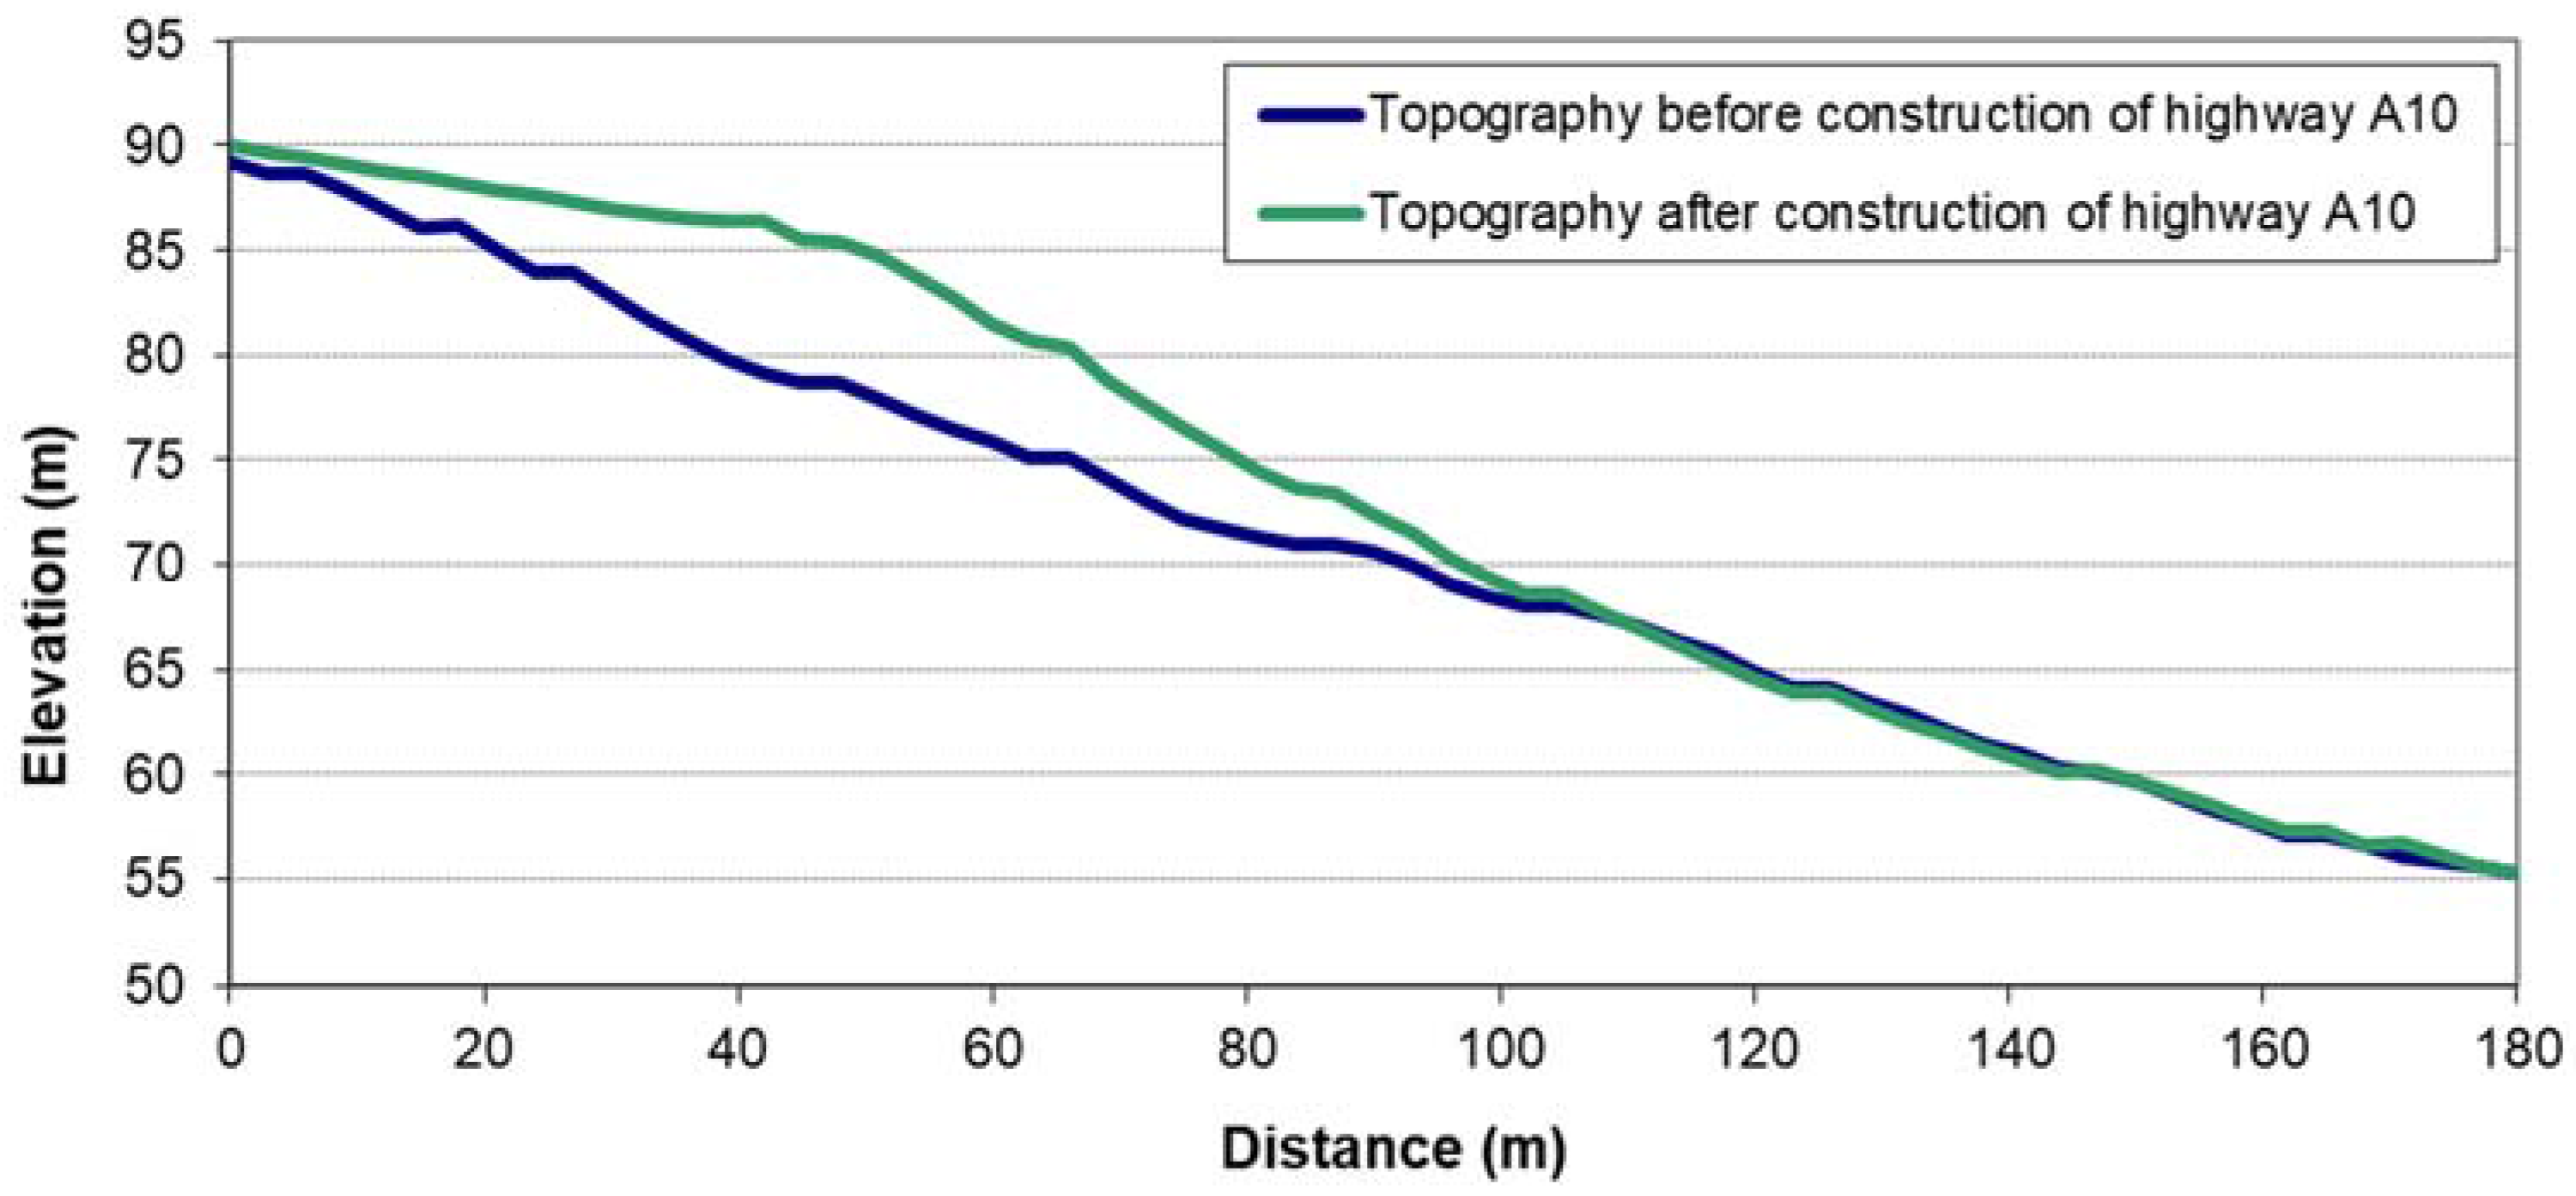
Figure 8 shows the topographic profile before (in 2003) and after (in 2009) the construction of the highway A10. The difference between both of the profiles shows the embankment that is constructed in the context of highway A10 works. According to [
25], this embankment was constructed with marls from a nearby area that had to be excavated during the construction of the highway. According to the detailed engineering design of this highway, the disposed soils were treated and the embankment compacted in order to obtain a friction angle of 30° and cohesion of 10 kPa.
Geology and Geotechnics
The Cachoeiras landslide occurred on LU1 according to the Geological Map of Portugal at 1:50,000 scale [
26]. The geological model of the profile used in the back-analyses was designed while considering the detailed geological and geotechnical recognition done for the engineering design of the highway A10 [
25].
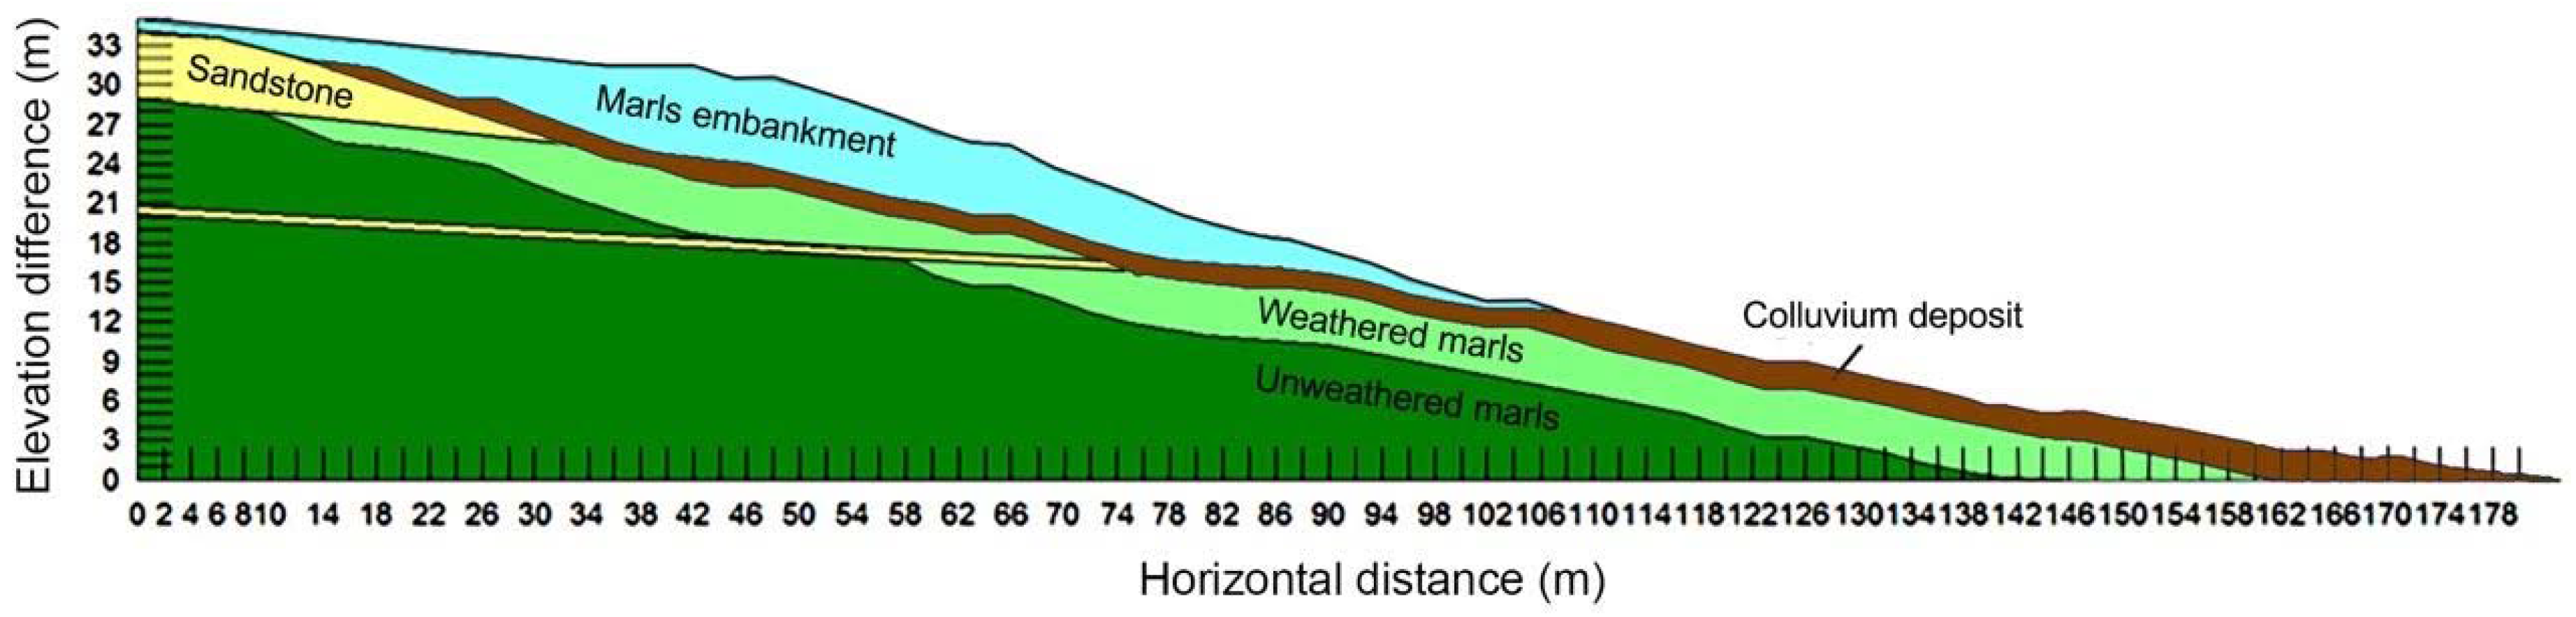
The geological model of the profile of the rotational component of the Cachoeiras landslide (
Figure 9) that was studied by back-analyses considers the following:
Marls embankment was defined as the elevation difference between the topographic profiles before and after the construction of the highway A10.
Edaphic soil thickness spans from 1.3 to 2.0 m between the upper and lower portions of the profile, respectively, and in accordance with what was found in borehole loggings done nearby.
Weathered marls occur in the profile until 3.5 m depth when considering topography before construction of highway A10.
The occurrence of sandstone beds was identified in the boreholes done nearby and in outcrops near the area allowing for the interpolation of these sandstone beds into the study area. We confirmed their existence during the stabilization works of the soils affected by the landslide. In this study area the most important sandstone beds is 5 m thick and forms a lump in the slope upper section. At the most advanced landslide deformation state (February 2013), water seepage was identified in the base of this sandstone layer. Additionally, a deeper sandstone layer with only several centimeters thick was considered in the geological model in accordance with nearby borehole data.
The rest of the profile is composed of unweathered marls (LU1).
Most of the shear strength parameters used in back-analysis are in accordance to those determined for engineering purposes in [
25], particularly those defined for the marls embankment (
Table 2).
Hydrometeorological Regime
The Cachoeiras landslide occurred in the right margin of the GPR basin. Four water wells located close to the landslide were monitored between 14 September 2013 and 1 February 2014 in order to assess the amplitude of the water table fluctuation between wet and dry periods.
All of the water wells are located in LU1, two of them upslope and the other two downslope relative to the landslide. Water table rise during the observation period reached values between 2 and 3 m, and in February 2014, three of these wells had water table at the topographic surface.
During field work, water seepage was observed inside the landslide area as well as in the base of the thicker sandstone layer.
The Cachoeiras landslide was triggered on January 2010 during winter time. Taking into account the precipitation that preceded the landslide occurrence, and considering the behavior of the water table observed in the four wells previously mentioned, it is fair to assume that water table should be close to the topographic surface when the landslide occurred and during its successive reactivations.
Back-Analysis
In the simulations that were made with Slope/W, two water table positions were assumed, one for the wet season, which is close to the topographic surface, and a second for the dry season located 3–4 m below the topographic surface. The saturated zone is thicker in the first case. Results are expressed as FS values, as indicated in
Section 3.4.
Degradation of the LU1a due to weathering has been described by different authors [
19,
21]. As the slope was stable even for the less favoring conditions of the water table position near the topographic surface, a progressive degradation of marls was simulated by reducing shear strength parameters of marls that compose the embankment. Different levels of degradation from W0 (not weathered) to W6 (very weathered) were considered in the back-analysis.
Table 3 shows these different levels of degradation of marls (LU1a) and calculated FS values. Geotechnical parameters on unweathered marls are according to those indicated in [
25], and the most degraded levels (W5 and W6) are according to the shear strength parameters that were obtained also in [
25] for LU1a (Abadia marls) remolded soil tests. Shear strength parameters considered in between (W1, W2, W3, and W4) correspond to a linear progression between both end-members.
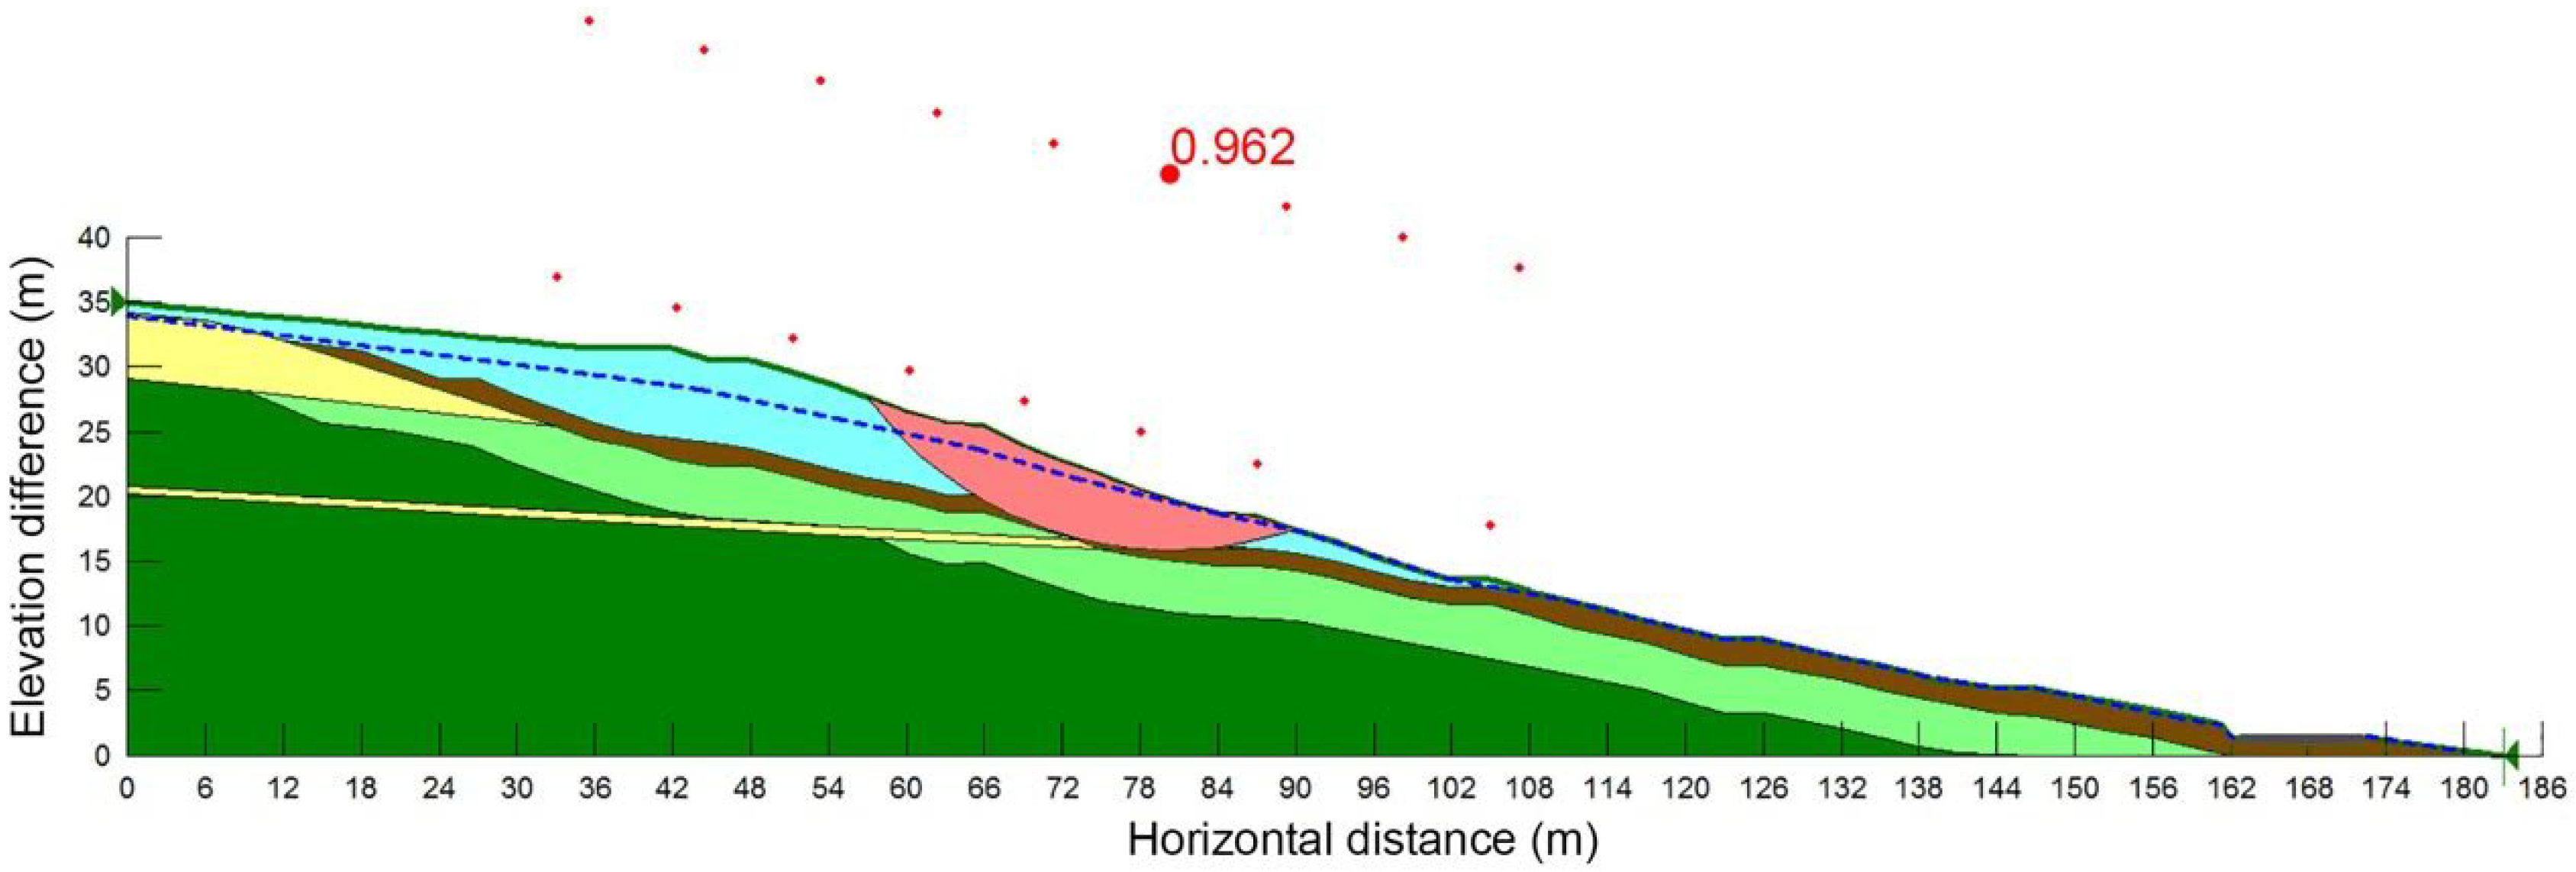
Different simulations that were done in the Cachoeiras profile shows that for those shear strength parameters defined in the detailed design (M0), the slope was stable. Nonetheless, with the degradation of these parameters, unstable conditions are reached when using values defined by W4 (
Φ = 22° and
c’ = 6 kPa) and high water table level (
Figure 10). It is interesting to notice that the slope was still stable for W6 conditions (
Φ = 19°,
c’ = 5 kPa), as long as the water table level remains low.
The slice defined as unstable resembles to the start of the landslide. As referred the Cachoeira landslide was a complex landslide with rotational and translational components and several reactivations.
4.3.2. The Espogueiro Landslide Case Study
General Context and Landslide Characterization
The Espogueiro landslide (
Figure 1) is a deep-seated rotational slide. It was initiated by the end of December of 2009 and evolved until the end of January 2010, when it was subjected to stabilizing interventions. This landslide occurred, in a 815 m long slope (in plan), which may be divided in two sectors: (i) an almost vertical upper section (limestone cornice), cut in the calcareous rocks of LU2; and, (ii) a longer medium and lower slope sections with a mean slope angle of 11° cut in LU1.
The area affected by the landslide includes two private properties with different land uses divided by an asphalted road. The upslope terrain was occupied by vineyards and in the downslope terrain a house was being built when the landslide occurred. In both of the properties soil was deposited previously to the landslide. In the upslope property an estimated volume of 4.5 × 10³ m3 of organic soil was deposited in the zone between the slide scarp and the downslope road, while in the downslope property an earth embankment was built for the construction of a house. According to the owner of the upslope property, soils composing the embankment came from the construction of the nearby highway A10 and are mainly marls from LU1a.
The Espogueiro landslide affected an area of 6860 m2, with a maximum length of 98 m and maximum width of 85 m. Following the approach used in the Cachoeiras landslide case study, landslide volume was estimated to be 27 × 103 m3 and the maximum depth of the surface of rupture was estimated to be 6.2 m.
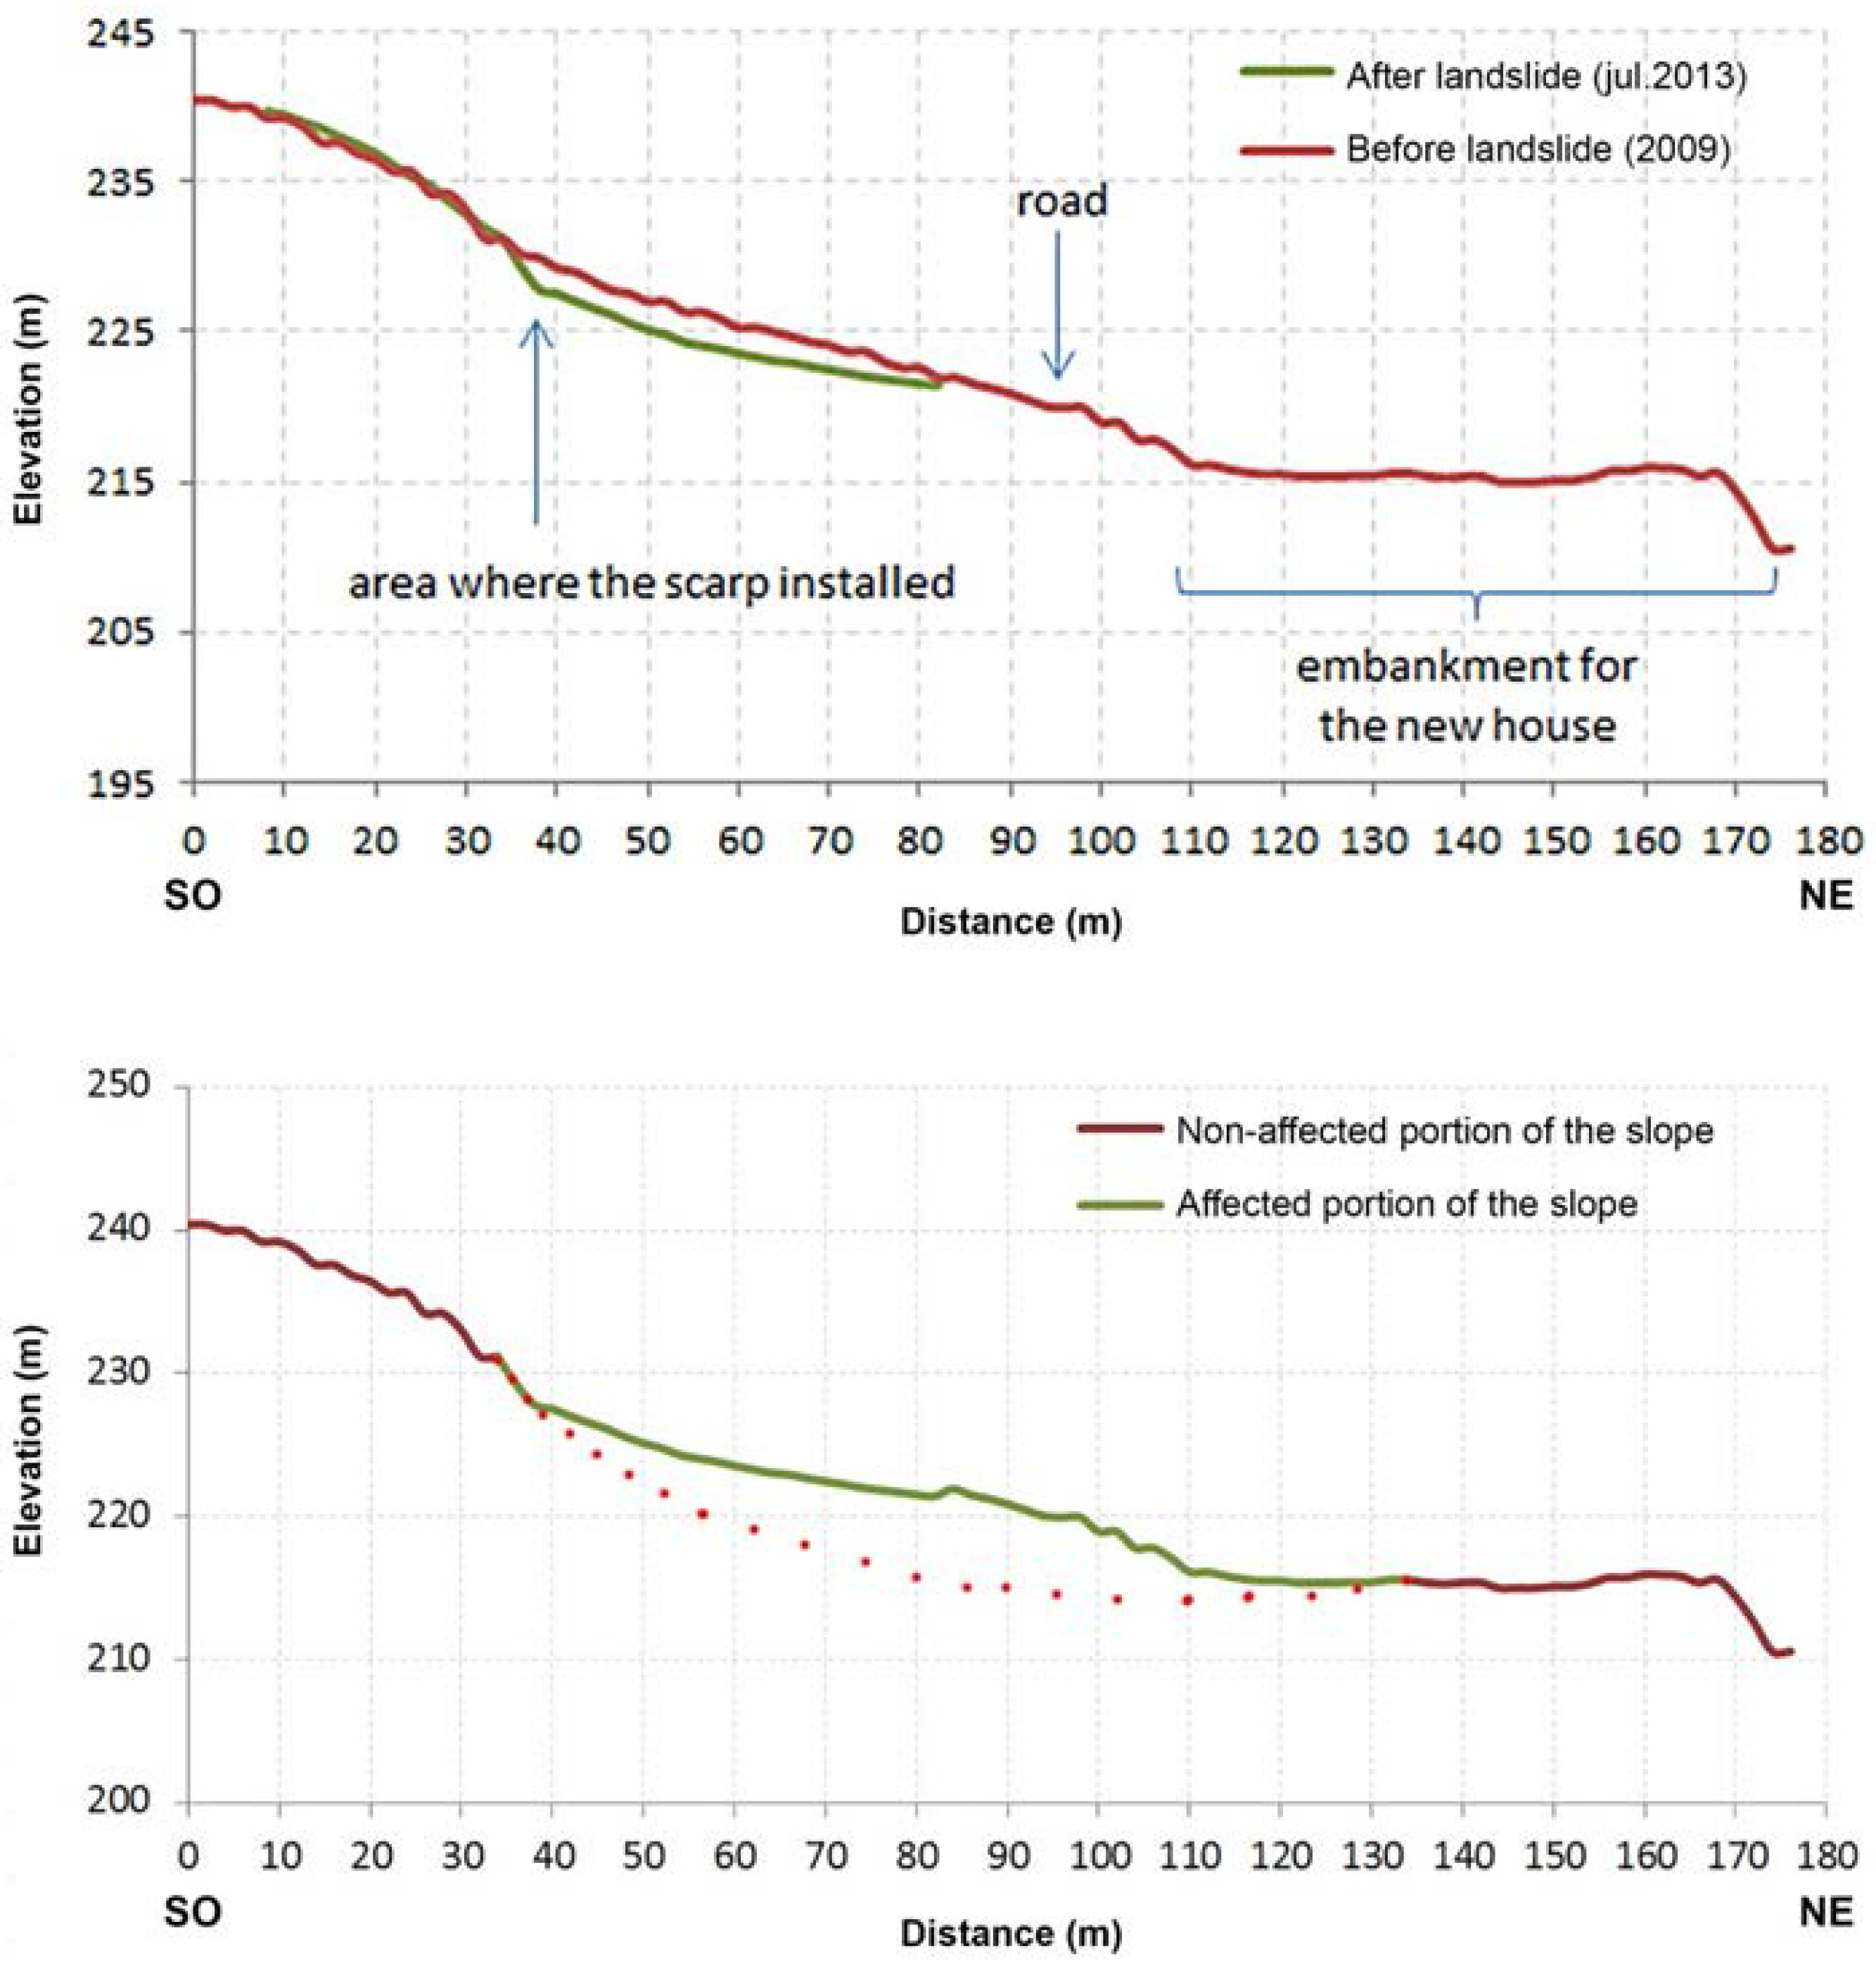
Figure 11 shows the morphology of the terrain in 2009 and in 2013 (before and after the occurrence of the landslide, respectively). In 2013, the area of the scarp suffered a vertical displacement of about 2 m.
Geology and Geotechnics
The Espogueiro rotational slide occurred on LU1 in close proximity with the LU2, according to the Geological Map of Portugal at 1:50,000 scale [
26].
To build the geological model of the study area and to collect the geotechnical information needed for back-analysis, we used data acquired, for the construction of a highway [
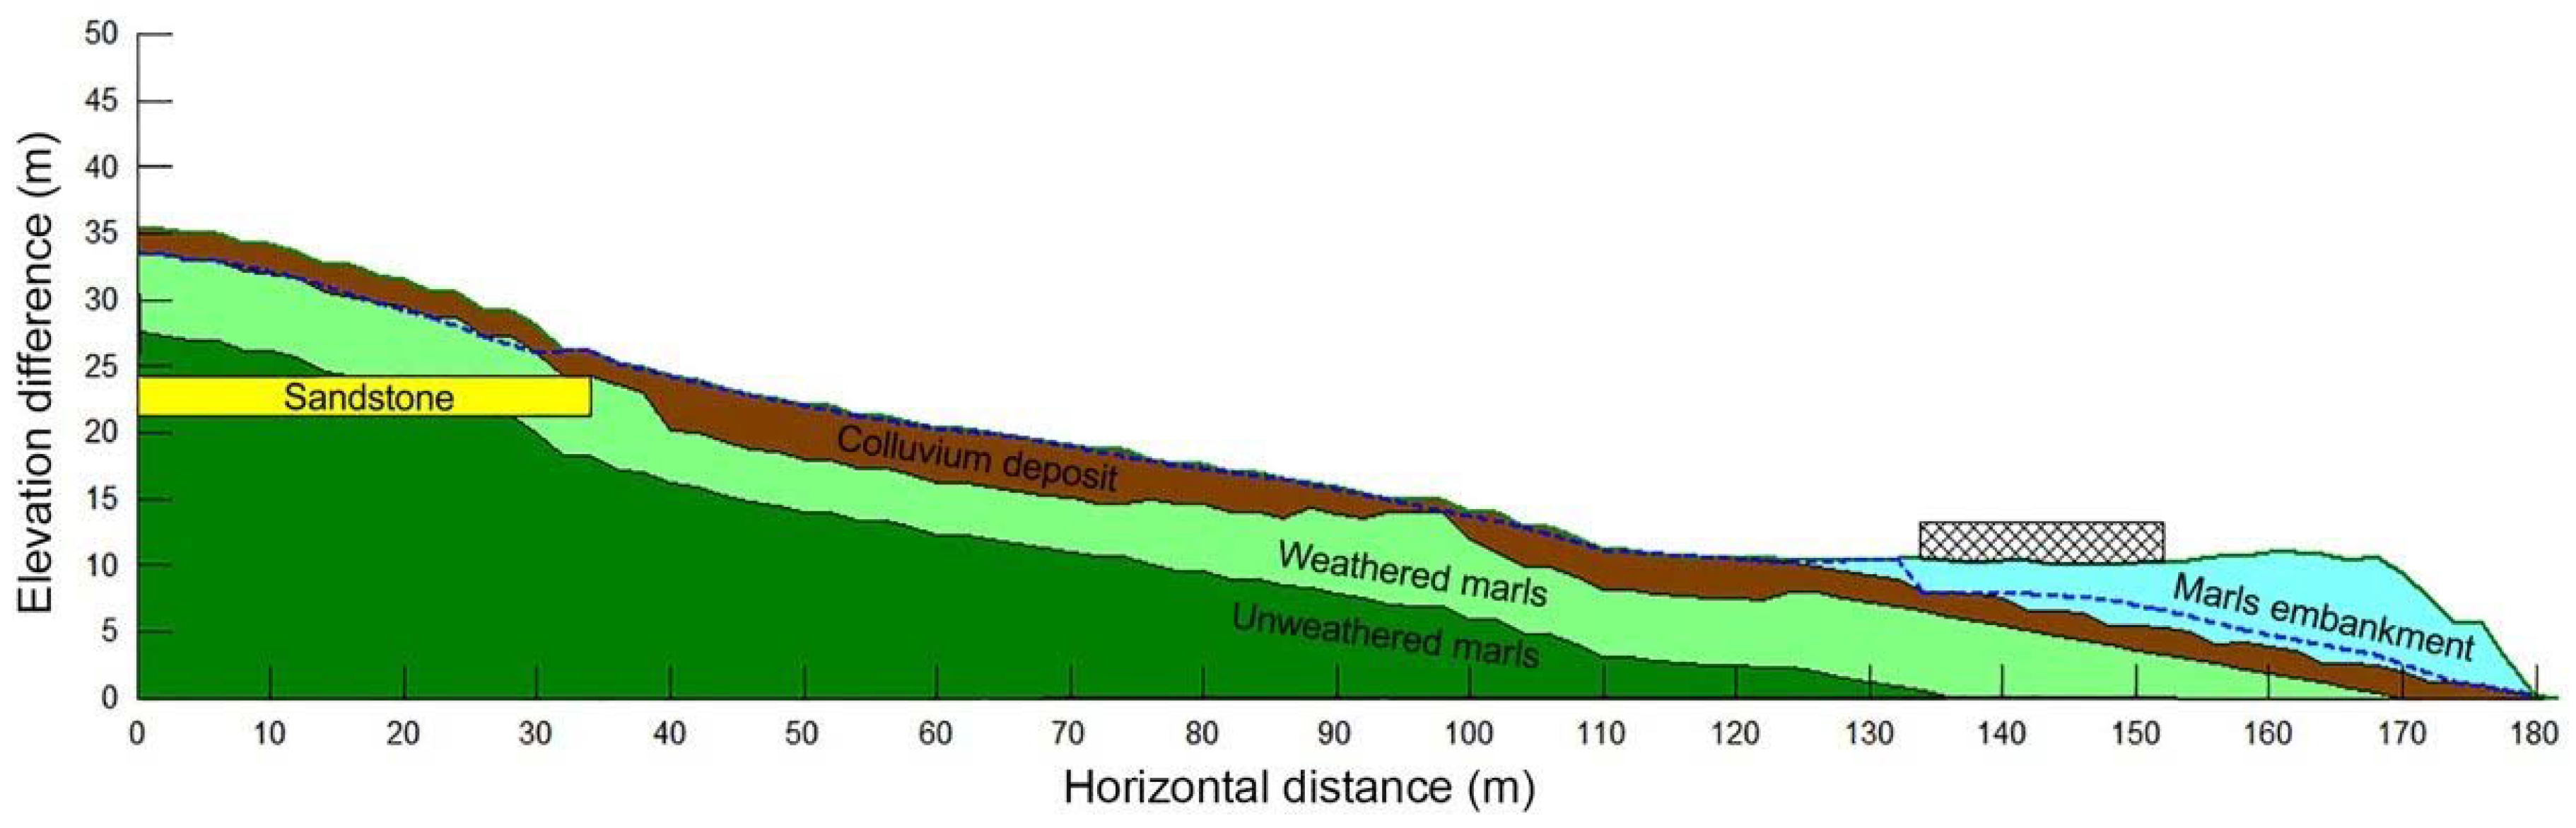
44] located 1500 m from this landslide, but in the same slope and similar geological/geomorphological context. The geological model of the profile that was subjected to back-analyses (
Figure 12) considers the following:
Shear strength parameters used in back-analysis are in accordance to those used also in the Cachoeiras geological model (
Table 2).
Hydrometeorological Regime
The landslide occurred at an upstream right margin of the GPR basin. Between September 2013 and February 2014, the water level in four wells that were located close to the landslide area was measured to assess water table fluctuations between wet and dry seasons. One of the wells is located in the slide main scarp. The owner built it because the area was frequently saturated with water, so that in most cases water table was at the topographic surface. The other three wells showed a fluctuation of the water table of more than 2.5 m between September 2013 and February 2014. It was confirmed that in 1 February the water table was close to the topographic surface in all the area represented by these four wells. In fact, the weather bulletin for January of 2014 [
45] classified this month as wet for the north and center area of the country (average value of 162 mm for January 2014 against the normal value (1971–2000) of 118 mm).
Back-Analysis
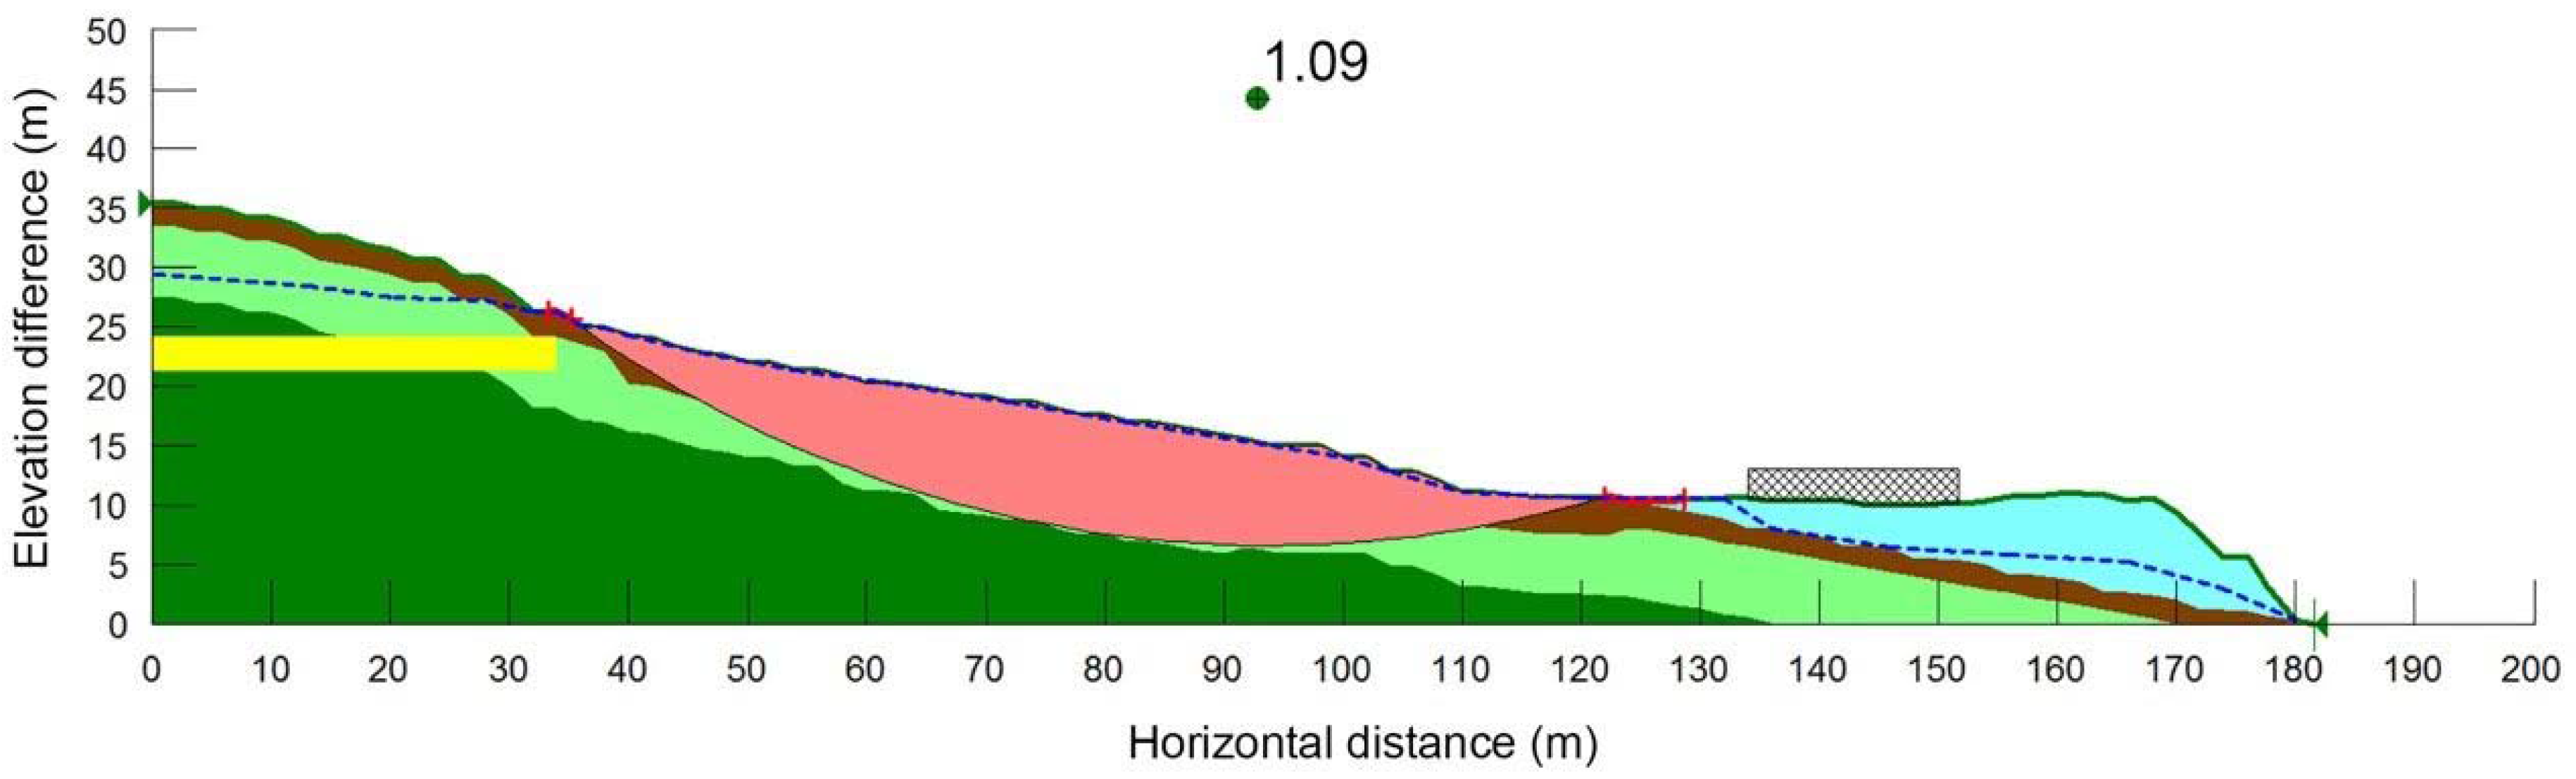
By several trials of circular ruptures in Slope/W, the results show that despite using shear strength parameters of degraded marls, such as Φ = 12°–19° and c’ = 2–7 kPa, and water table reaching the topographic surface, the area highlighted to be affected corresponds to a much smaller area displaced upslope than the one that actually is associated to the rotational slide by the end December of 2009.
As the places where the rotational slide intercepted the topographic surface are known, we calculated FS values using the option of Slope/W, which allows for defining locals of entrance and existing of the slide surface of rupture. To obtain a FS equal or inferior to 1 (
Figure 13), two conditions had to be stablished in the geological model: (i) shear strength parameters of degraded marls, such as
Φ = 12°–14° and
c’ = 2–7 kPa; and, (ii) degraded marls 1.5 m thicker in the central area of the profile than what was observed in [
44] in the adjacent slope area. Water table was located close to the topographic surface in every back-analysis simulation.
These geotechnical properties defined for degraded marls are indeed low, even for these types of materials. Nonetheless, in [
25] are reported direct shear test results for LU1a (Abadia marls) of residual shear strength parameters as low as
c’res = 0 and 2 kPa, and
Φ’res = 5° and 9.7°. In [
35], it was reached similar shear strength parameters of
Φ = 12° and
c’ = 7 kPa for LU1a through simultaneous back-analysis of several landslides by using the infinite slope model.
These low strength results imply that this rotational slide affected materials that were deformed previously, most probably by a previous landslide. It seems that the surface of rupture of this rotational slide was in fact a reactivation of an old rotational slide surface of rupture, probably due to changing of the equilibrium conditions reached after the first landslide.
Actually, the owner of the upper terrain where the slide scarp is located assumed the deposition of organic soils in the area between the slide scarp and the downslope road. Despite of not being an important slope embankment (as indicated above), this topographic modification in conjunction with the change of groundwater circulation caused by the construction of the embankment on the downslope terrain is assumed to generate the conditions that led to the occurrence of this landslide. The owner refers that the topographic surface that was obtained after the landslide resembles with the one existing before the deposition of organic soils in his own terrain.
5. Discussion
5.1. Rise of the Water Table as a Triggering Factor for Landslides
The GPR basin is a region prone to the occurrence of landslides in particular shallow and deep rotational slides [
24]. The hydrological year of 2009/10 was characterized by intense precipitation, which led to the occurrence of a high number of landslides.
Most of the landslides that occurred in this hydrological year were shallow landslides (67%) (depth of the rupture surface not exceeding 1.5 m). Most of the landslides also correspond to rotational slides occurring in LU1 (Abadia complex) (64%), which dominates the GPR basin area (58%).
The comparative analysis of the estimated water contents in the different hydrogeological layers (edaphic soil, unsaturated, and saturated zone) and landslides registered during the hydrological year 2009/10 show that these are, in general, sensitive to water table oscillation. Water table rise is therefore an important triggering factor for landslides in the GPR basin, and therefore by exploring the regional fluctuations of the water table in this basin it seems possible to stablish a temporal forecast of landslide occurrence. In fact, according to [
46], besides gravity, groundwater is the most important factor in slope stability as it can affect slope stability in different ways (e.g., reduces strength; changes the bulk density; generates pore pressures; and, others).
Landslides seem to have occurred especially during the phase of water table rise and during its high-stand, and reduce their frequency when the water table despite high started to decrease. This may be partially because when the water table rises, the upper soil, which is mostly unsaturated, becomes progressively saturated causing the cancelation of the negative pore pressures in a thicker portion of the soil, which contributes to destabilize the shallowest part of the slopes. On the other hand, when the water table is lowering most of the landslide prone areas have already slid and negative pore pressures are again generated in the unsaturated zone, which are favorable conditions to stability of the upper layers of the soil.
In detail, landslides occurring in LU1 (Abadia complex) seem relatively more sensitive to regional water table oscillation than those occurring in other lithologies. With regards to landslides affecting heterogeneous rock formations such as LU2 (Amaral complex) or LU3 (Pterocerian complex), regional water oscillation probably is not representative of what occurs in these formations as they are vertically heterogeneous in terms of lithology (from limestones to marls), and consequently, with important differences in terms of vertical permeability, which allows for the occurrence of perched water tables and/or the confinement local aquifers beds.
The same idea seems to apply for deep-seated landslides as their frequency did not increase when the regional water table rose to the highest values. When analyzing those two cases of deep-seated landslides into more detail, one may conclude that in both cases water table was probably very close to the topographic surface when they occurred. This could mean that the sensitivity of deep-seated landslides to the rise of water table is the same as that of intermediate and shallow landslides, however the frequency of deep-seated landslides did not increase during the highest levels of the water table because conditions necessary for their occurrence are not common in the GPR basin, particularly the presence of a thick layer of weathered marls (>5 m deep).
5.2. Degradation of LU1a (Abadia Marls) as the Main Constraint for Landslides
For landslides to occur it is not only important that the water table is high, but it seems also important that these marls had suffered a long term degradation of their shear strength parameters. According to [
19], LU1 is an over consolidated geological formation, which when exposed to weathering, alters very rapidly, especially when in contact with water. Water promotes dissolution of cement connections, with significant strength reduction and transformation into a loose clayey soil.
This degradation occurs particularly in the most superficial layer. According to [
21] and [
25], two layers of LU1a can be differentiated: a yellowish and more superficial layer and a greyish deeper layer. These can also be differentiated by geotechnical parameters and indexes (e.g., SPT N-values). According to [
21], the thickness of degraded marls varies between 0.5 and 5 m; note that on top of these normally are edaphic soils. Based on 38 borehole logs done in the LU1, these authors indicate that degraded marls have a maximum depth spanning between 2.6 and 7.7 m. However, the most common maximum depths are between 3.0 and 4.0 m.
The most common process of weathering corresponds to a continuous progression of decompression and degradation towards deeper layers from the topographic surface. Not accounting with slope geometrical constrains (e.g., length, width) to landslide rupture surface development, this could be an explanation why shallow, intermediate, and deeper landslides are progressively less frequent in this specific region.
However, an alternative and faster way to degrade deeper layers occurs when landslides occur (even small ones), since it will allow unweathered and deeper layers of marls to be rapidly weathered, starting a new cycle of the whole process and eventually leading to a new and deeper seated landslide.
The study of two particular cases of deep rotational slides shows that these occurred in areas where landslides had occurred previously, which means that deeper layers of marls have been deformed before, leading to residual strength parameters. The complete succession of landslides occurred in both landslide study cases may only be explained by the presence of a thick layer (7–10 m) of degraded marls with a friction angle between 12° and 14° and cohesion between 2 and 7 kPa. These values are in fact in accordance to those obtained in the laboratory for remolded marls [
25].
The occurrence of these two deep rotational slides is then assumed to be related to continuous degradation of marls (including those promoted by previous landslide occurrence/reactivations) and changes on other factors like the increase of overweight along slope or change of groundwater flows patterns. As referred to above, their occurrence is then triggered by the rise of the water table.
6. Conclusions
The GPR basin registered in the hydrological year 2009/10 a high total amount of precipitation, which led to the occurrence of 182 landslides in natural slopes in an area of 110 km2.
Data here presented shows that the estimated regional rise of the water table can be used as a temporal proxy for landslide triggering, particularly for those that are classified as shallow and intermediate landslides. Deep-seated landslides are also triggered by high water table levels, but conditions for their occurrence are not so wide spread in the basin.
The most important constraint for landslides occurrence that is found in this study is the degree of degradation and thickness of the degraded upper layers of marls. In most of the drainage basin, the degraded layer is less than 5 m deep, causing, predominantly, the occurrence of shallow and intermediate landslides. Deep-seated landslides were found in areas where landslides have occurred in the past. These landslides/reactivation events deformed soils leading to lower, residual shear strength parameters (friction angle and cohesion), and may have led to weathering processes in deeper layers of marls.


