3.1. Ellis Island Soil Particle Size
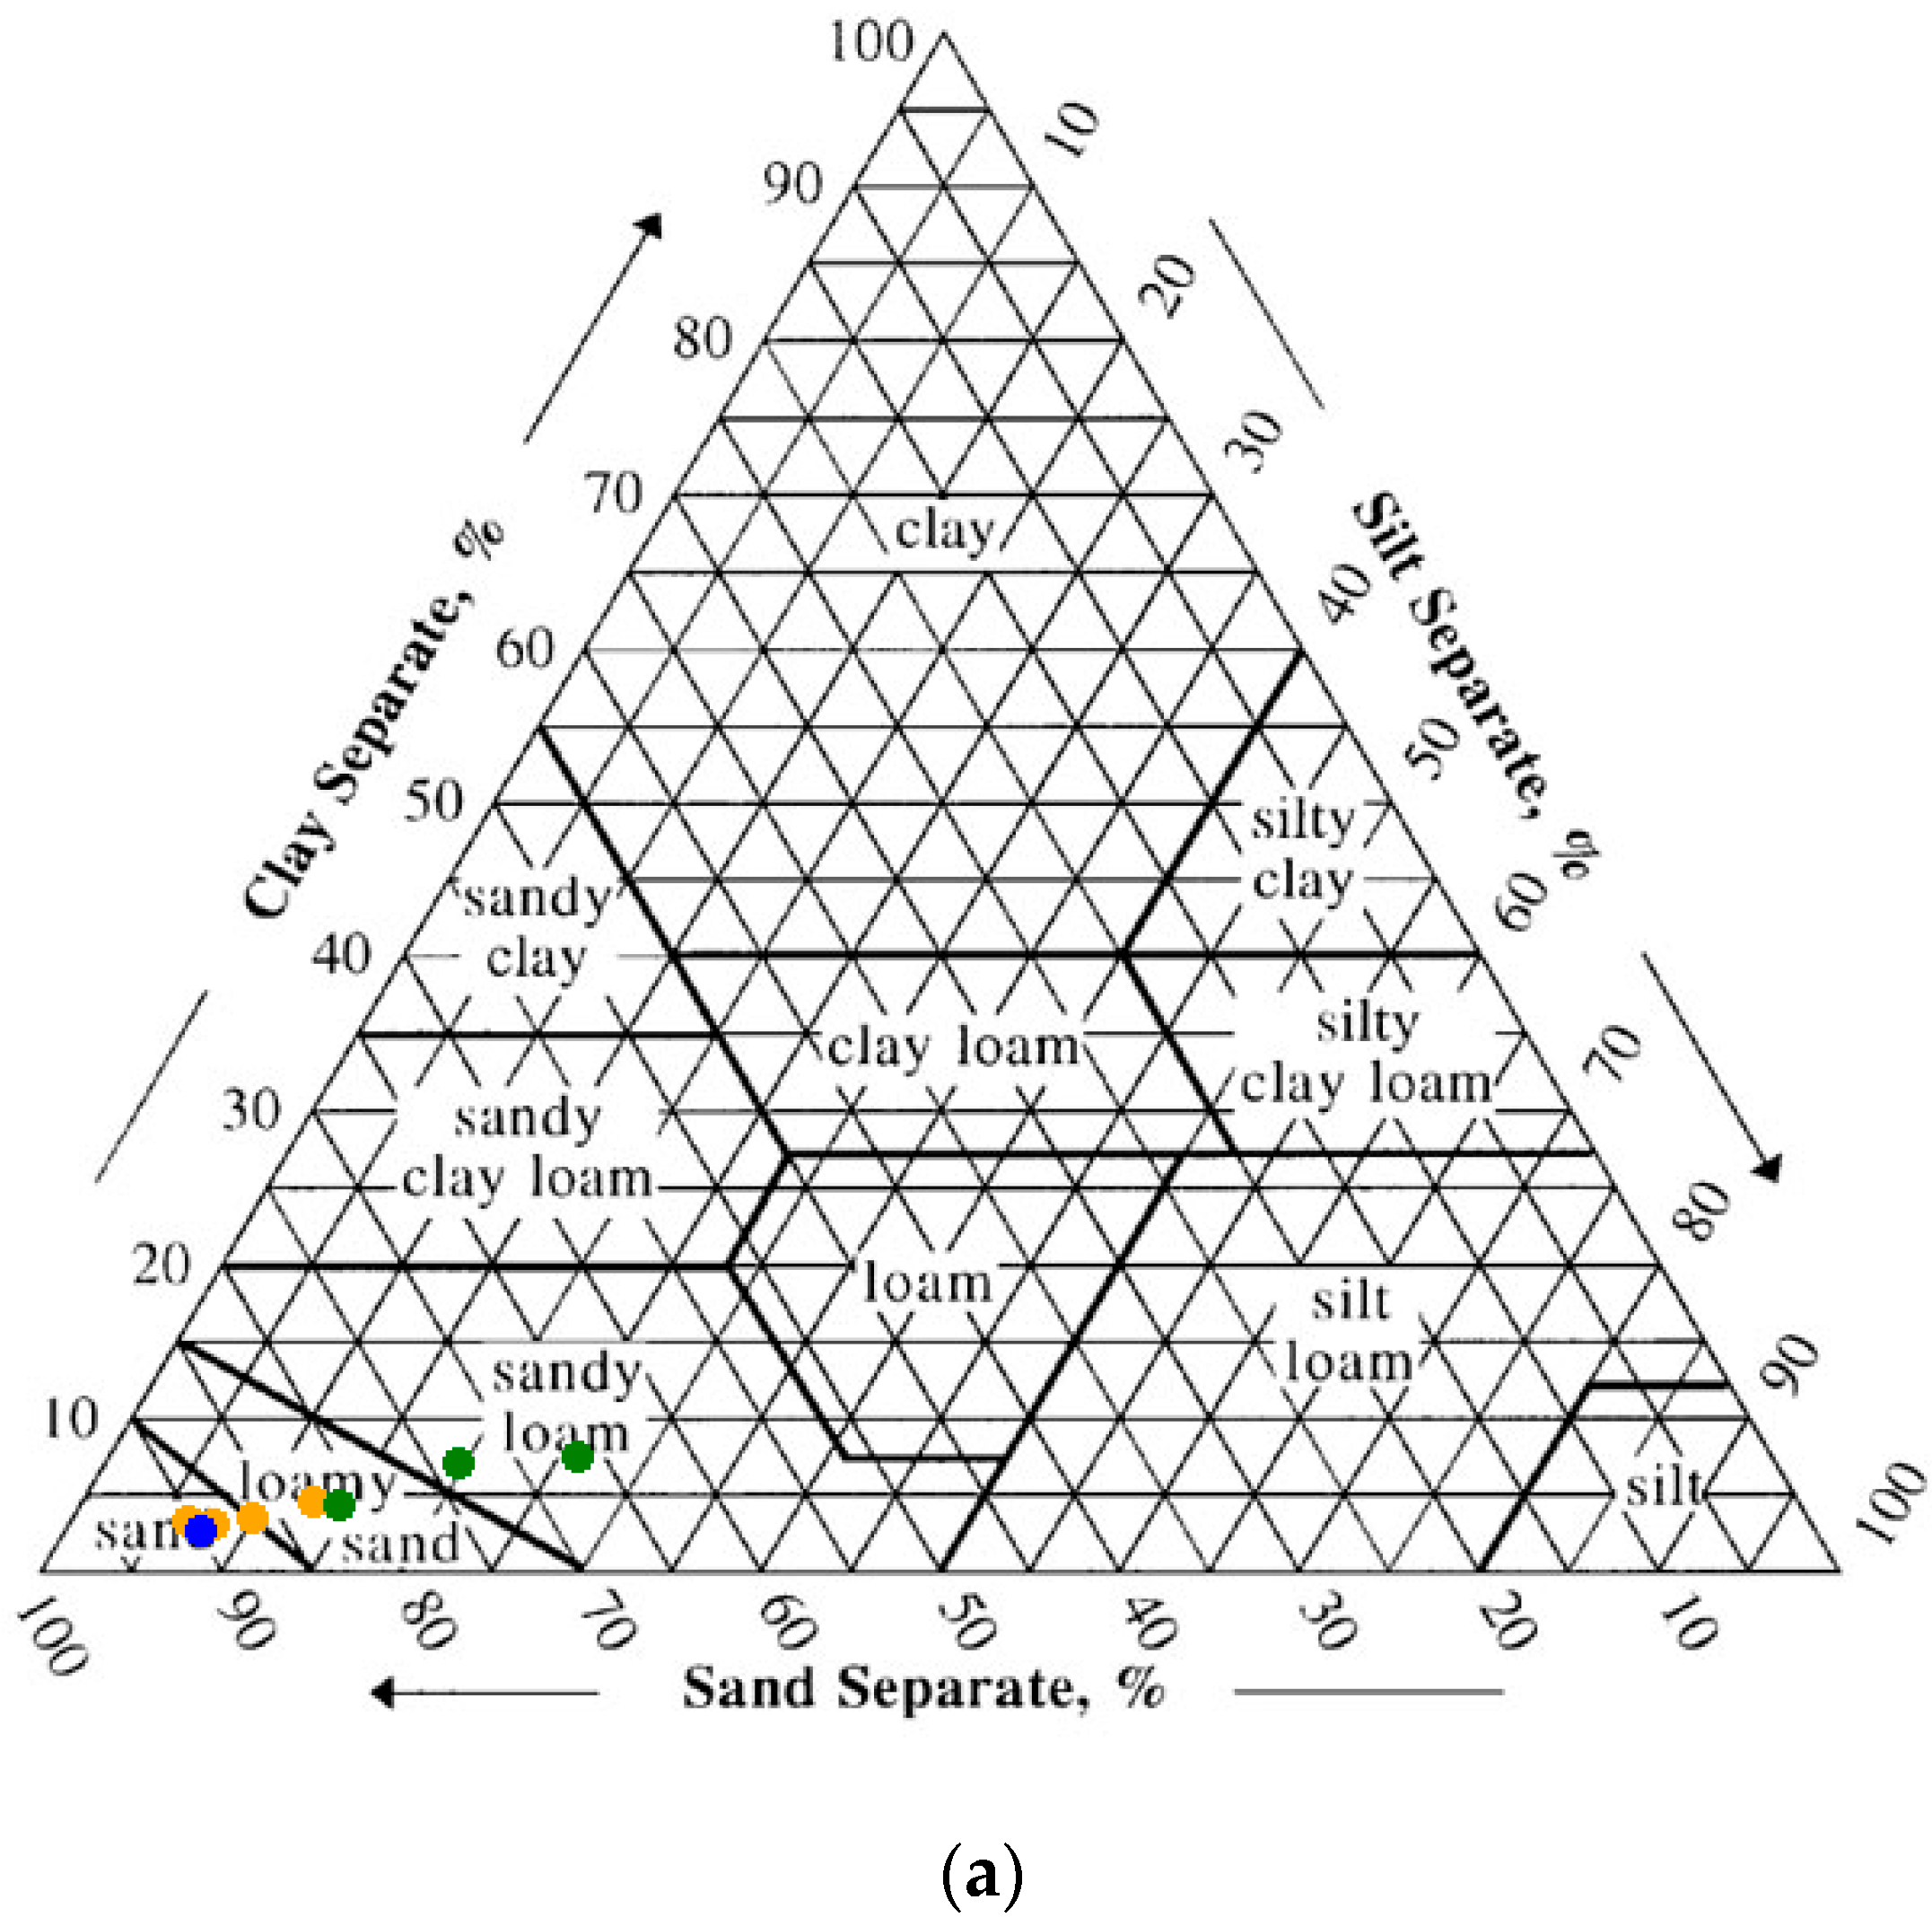
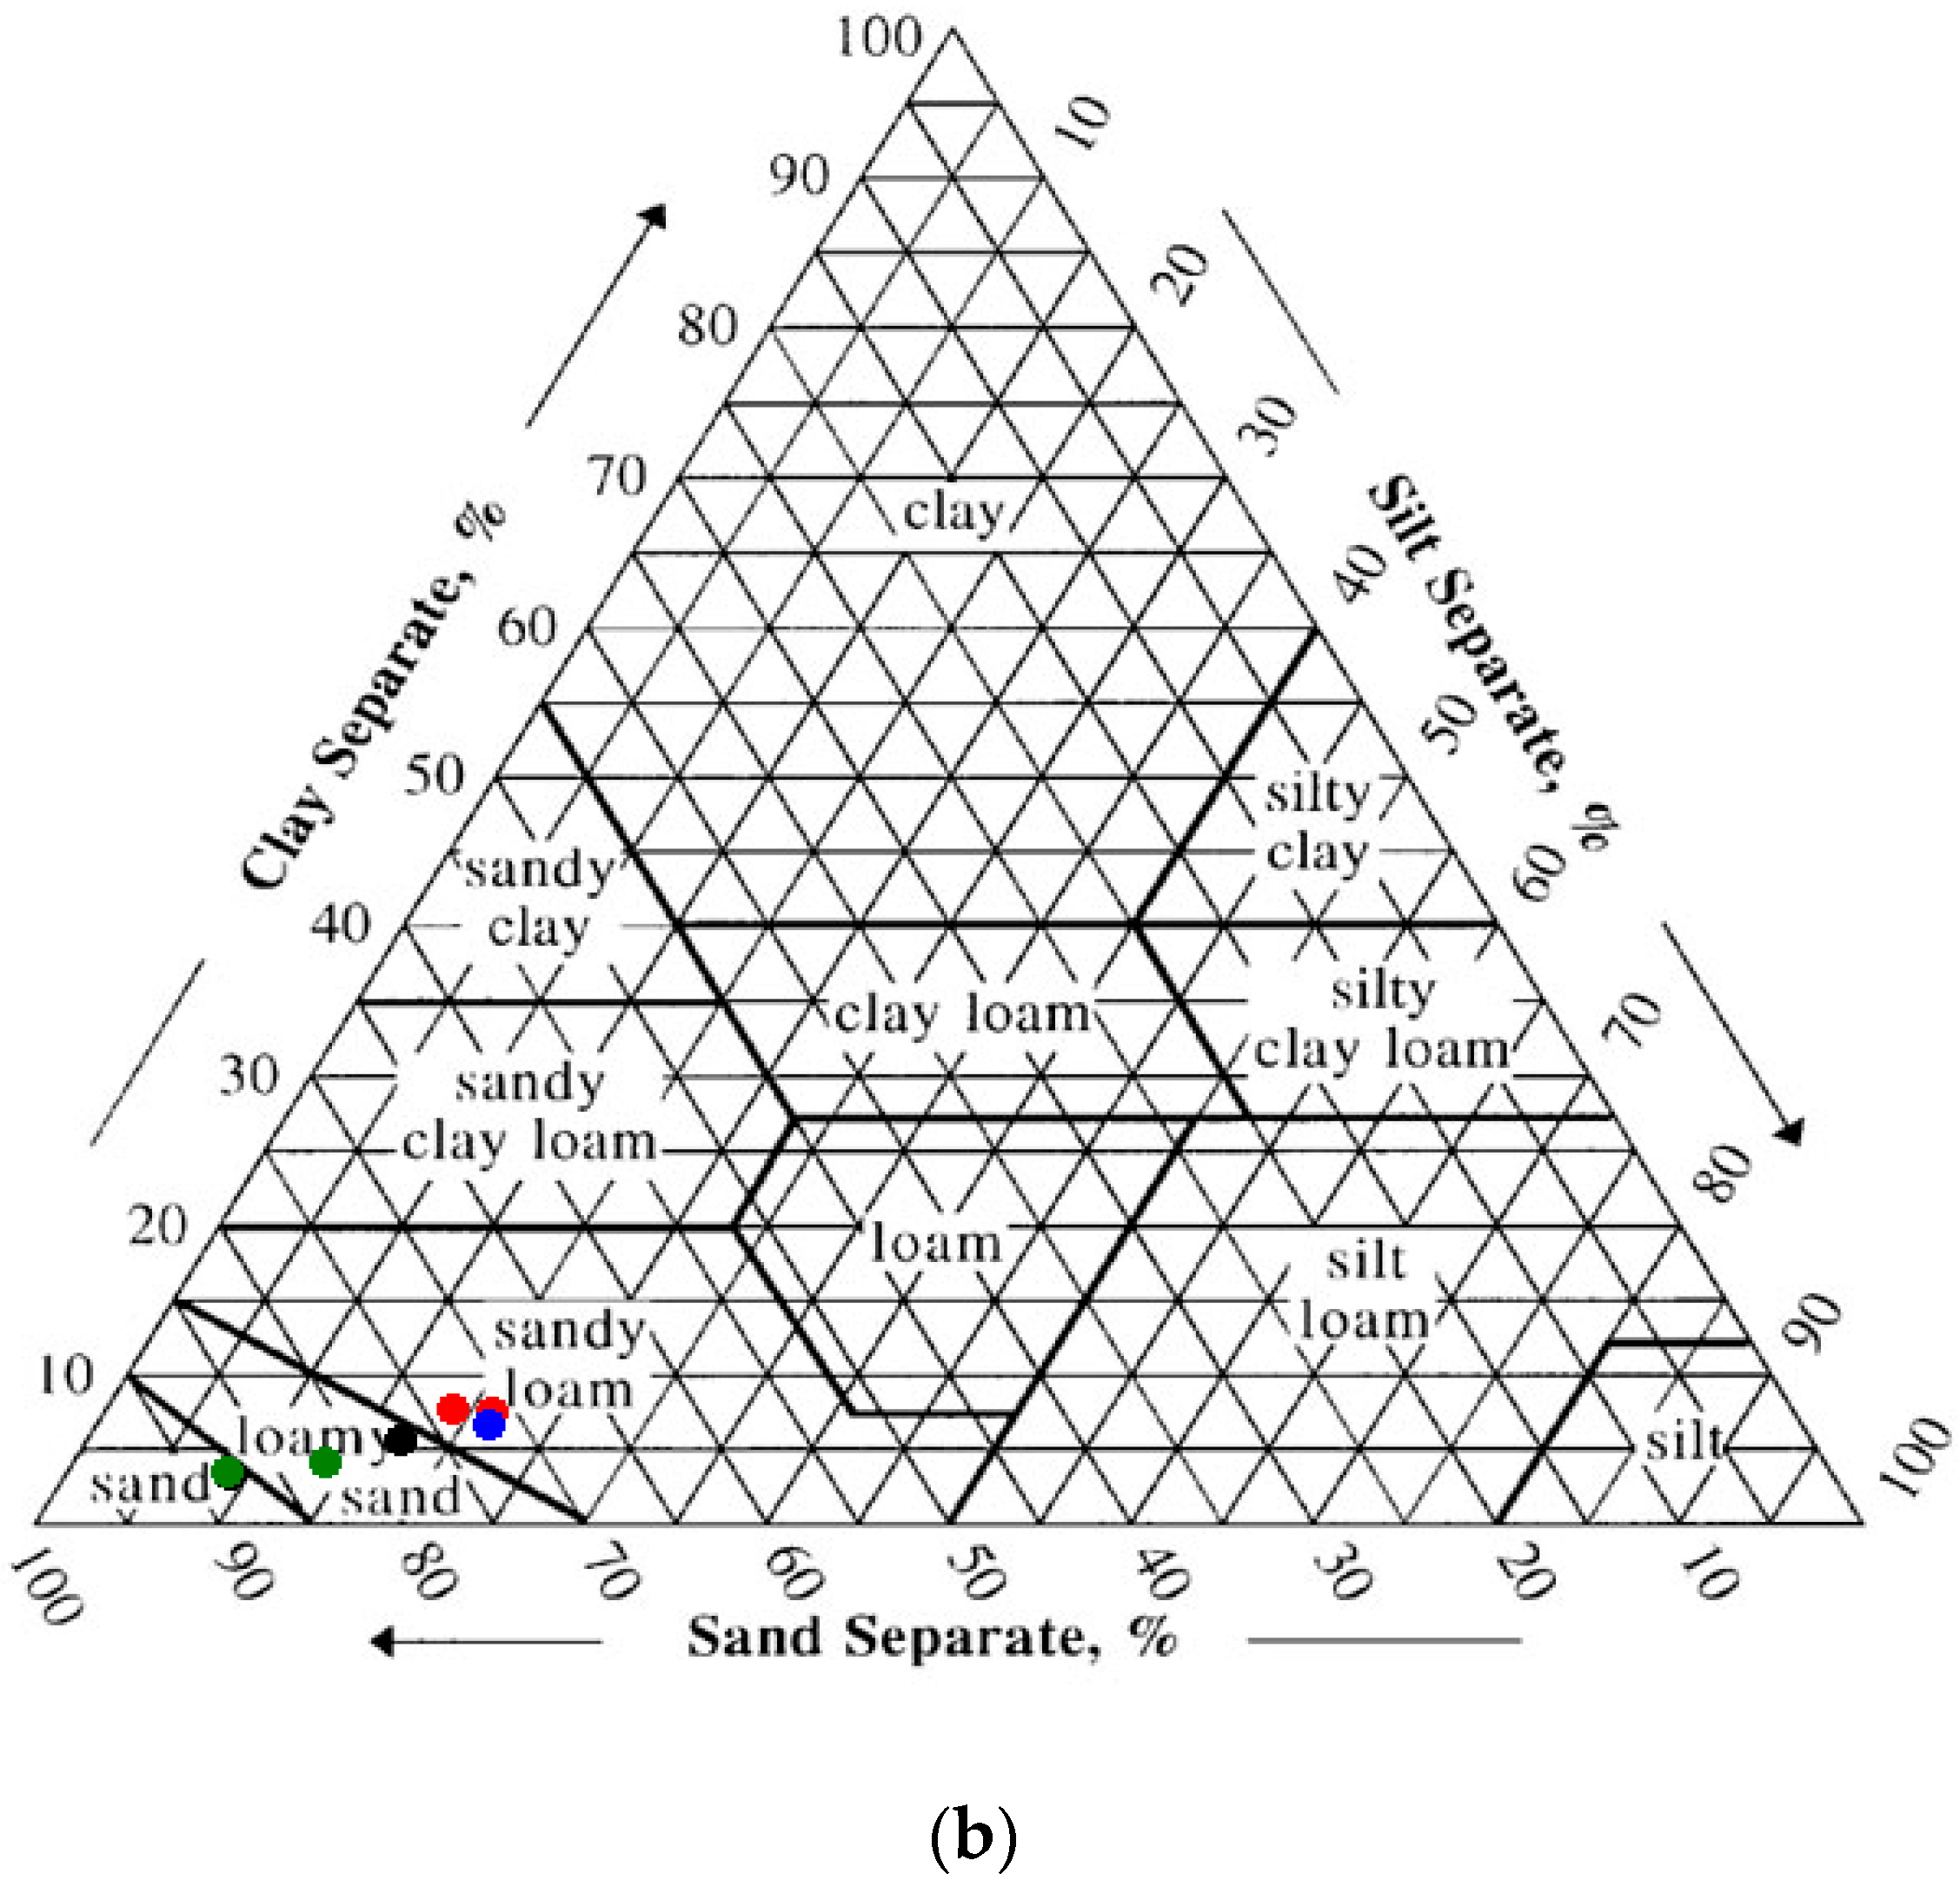
The sieving results showed gravel (>2 mm) fraction ranging from 3% to 36%. Depending on location, the >2 mm fraction was either true gravel (quartz and feldspar and lithic fragments) or anthropogenic debris (coal, brick and the like). The hospital complex on Ellis Island is built upon landfill sediments, therefore texturally most of the samples were poorly-sorted. The clay content of the soils ranged from 2.2 to 7.1%, with the vast majority of the samples containing around 4.5% clay (average 4.6 ± 1.8%). Using the NRCS soil texture calculator [
39], 40% of the samples were classified as “sand”, 27% as “loamy sand” and 33% as “sandy loam” (
Figure 3a,b). The NRCS Web Soil Survey indicates that the Ellis Island Hospital Complex is underlain by “URWETB” or urban land, wet substratum, with a 0–8% slope [
48]. The NRCS describes this soil as “asphalt over human-transported material and a coarse sandy loam” [
48]. Nominally the depth to water table is approximately 50.8 cm. Soil texture and type affects surface area and particle size distribution, which in turn can affect soil chemical and biological activity.
The heavy metal dynamics in soil is intricate, and the bioavailability, mobility and toxicity of metals in the soil fractions are influenced by a multiplicity of factors, including the properties of both the soil and the metal. The affinity of Pb and other metals to clay fraction is stronger than silt and sand [
49]. The presence of clays and hydrous Fe and Mn oxides in soils tend to increase metal adsorption and thus reduce soluble metal contents [
50]. The downward migration of Pb and Zn in soil is slowed by the attenuative properties of clays, cracks in the soil peds as well as the biopores in the clays, which might be the main routes of the migration of these metals [
51]. Clays as well as organic matter is the dominant soil constituent influencing adsorption of Pb [
52]. Upon studying soil texture in relation to extractable concentrations of Pb and Cu, Qian and others found that metals were generally enriched in the clay fraction; whereas relatively large amounts of available Cu and Pb were noted in the fine sand fraction, they also noted that available Pb concentrations were also high in the clay fraction [
53]. Al-Oud and others found that Cd mobility decreases with increasing amounts of iron oxide fractions; silt content and exchangeable Mg
2+ in the soils; and showed that Cd mobility is higher in those soils with a high percentage of sand [
54]. Additionally, Bloomfield has found that microbial action has also been observed to mobilize Pb, Zn and Cu from the carbonate and oxide residuals within soils [
55] and Ernst established that solubility of metals was also enhanced by the acidification of the soil by bacteria [
56].
3.2. Carbon, Nitrogen and Sulfur Composition in Ellis Island Soil
Carbon, nitrogen and sulfur are important nutrients for plants and microbes in the soil environment. The concentration of C, N and S are given in
Table 4. All samples were run in duplicate with averaged relative percent difference of 0.9%, 2.0% and 3.7% for C, N and S, respectively. Soil total carbon, organic carbon and total nitrogen are some of the most importance factors that affect soil productivity and soil ecosystem functions [
57].
The total carbon content in the soil samples varied from 5.41% to 11.90%, with the highest values from an area that included the coal-burning furnace. The higher soil carbon may be the result of years of coal deposition and storage within the furnace area where the additional carbon could have entered the soil environment through runoff or combustion fallout. Assuming that the inorganic carbon in the soil was solely in the form of calcium carbonate, then the relative abundance of soil inorganic carbon was estimated based on the Ca concentration measured with acid extraction (see
Section 3.3). The acid extraction efficiency for Ca was estimated to be 60% based on NIST 2711a. The inorganic carbon is thus calculated to contain up to 18% of total carbon in Ellis Island soil, with an average of 6%. The inorganic carbon content was significantly higher in the furnace area than other sampling areas (
p < 0.01), which is consistent with the area being a coal deposition and burning locality.
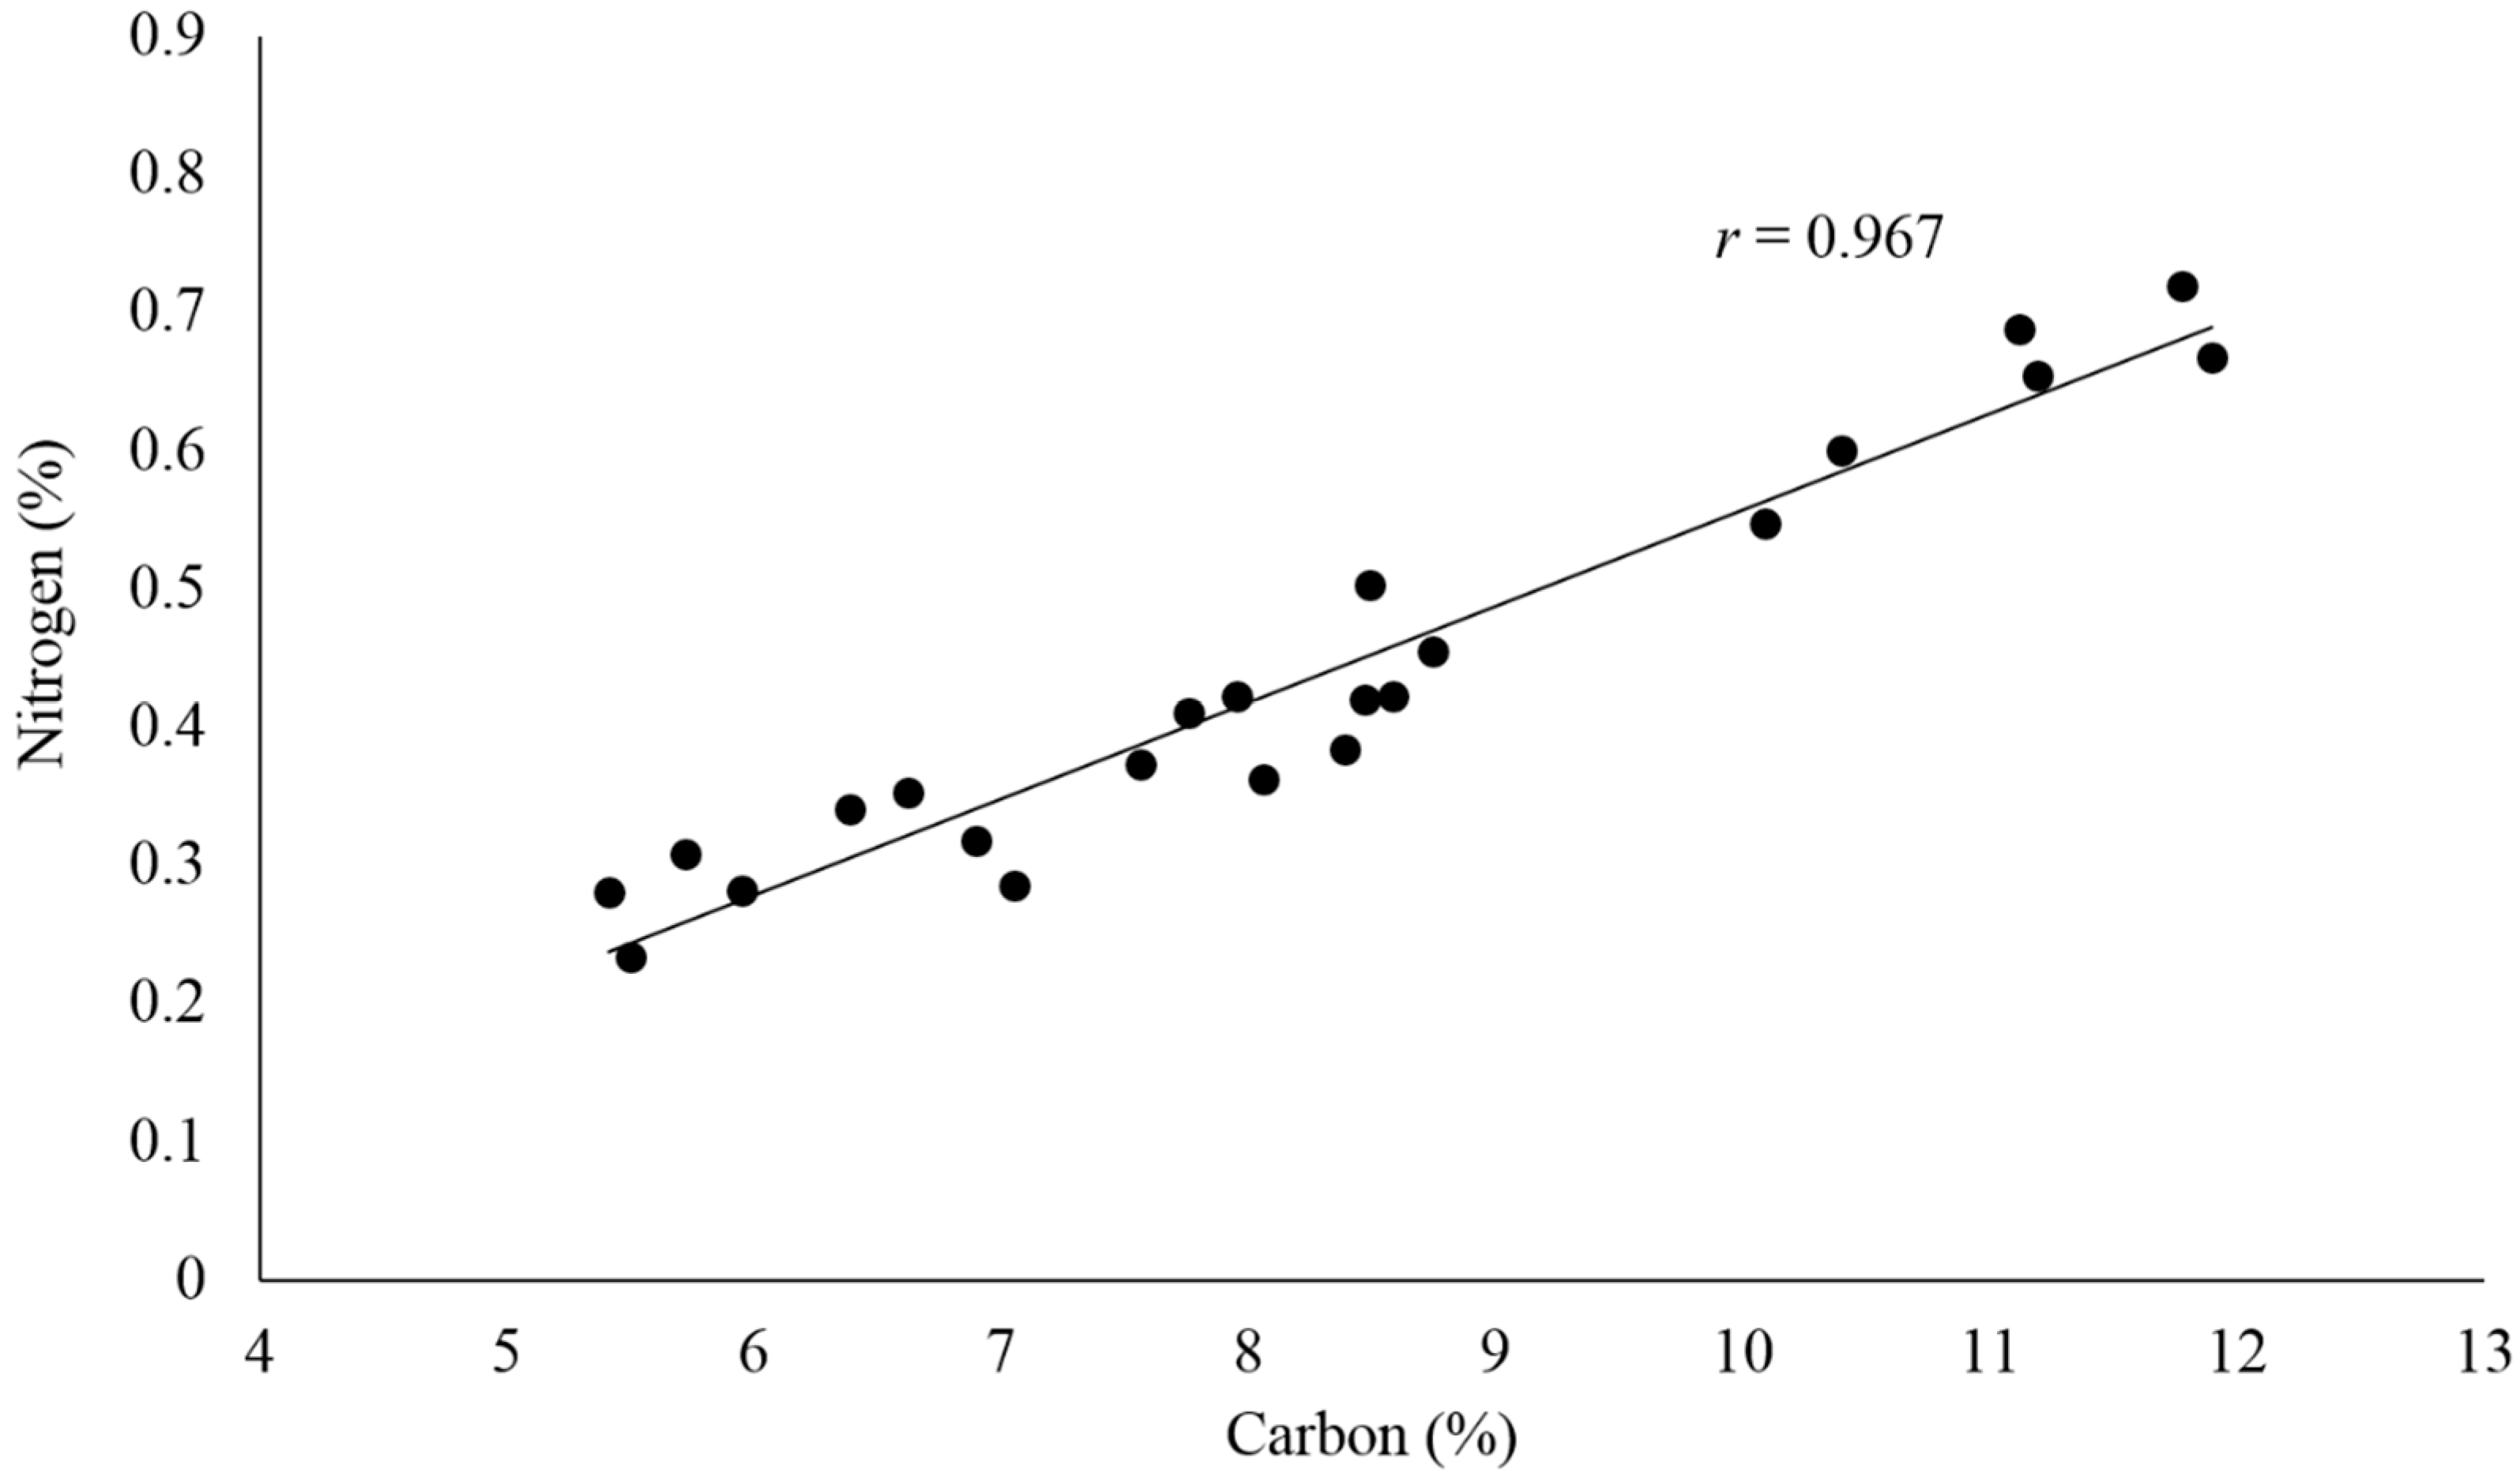
From the above estimation, the carbon in Ellis Island soil was mainly organic (>82% of the total carbon). There was a significant linear correlation (
r = 0.967) between the total nitrogen and carbon in the soil samples (
Figure 4). This agreed with earlier studies [
58,
59] and further suggests that organic matter decomposition was the main source of carbon and nitrogen in Ellis Island soil. Soil organic matter provides energy and essential nutrients to the soil ecosystem through the decomposition process, which is mainly regulated by soil microbes that utilize both organic carbon and nitrogen [
60,
61]. The C/N ratios for most of the Ellis Island soil samples were measured to be around 20:1, slightly lower than the optimum value of 24:1 that microbes need for metabolic processes. This suggests that the microbial mineralization of nitrogen may be prevalent in the soil environment, which will facilitate the conversion of inorganic nitrogen from its organic form and make it readily available to plants [
62,
63].
Sulfur is an essential element for plants and microorganisms. Typically, approximately 95% of sulfur in soil is found in the organic matter and thus sulfur tends to be highly correlated with organic carbon and total nitrogen [
64,
65]. Sulfur becomes bioavailable as sulfate when the organic matter breaks down through the mineralization process, which is affected by the C/S ratio of the organic matter, temperature and moisture. Whereas C/S ratios < 200:1 favor the sulfur mineralization which makes sulfur bioavailable, C/S ratio > 400:1 favor the immobilization process [
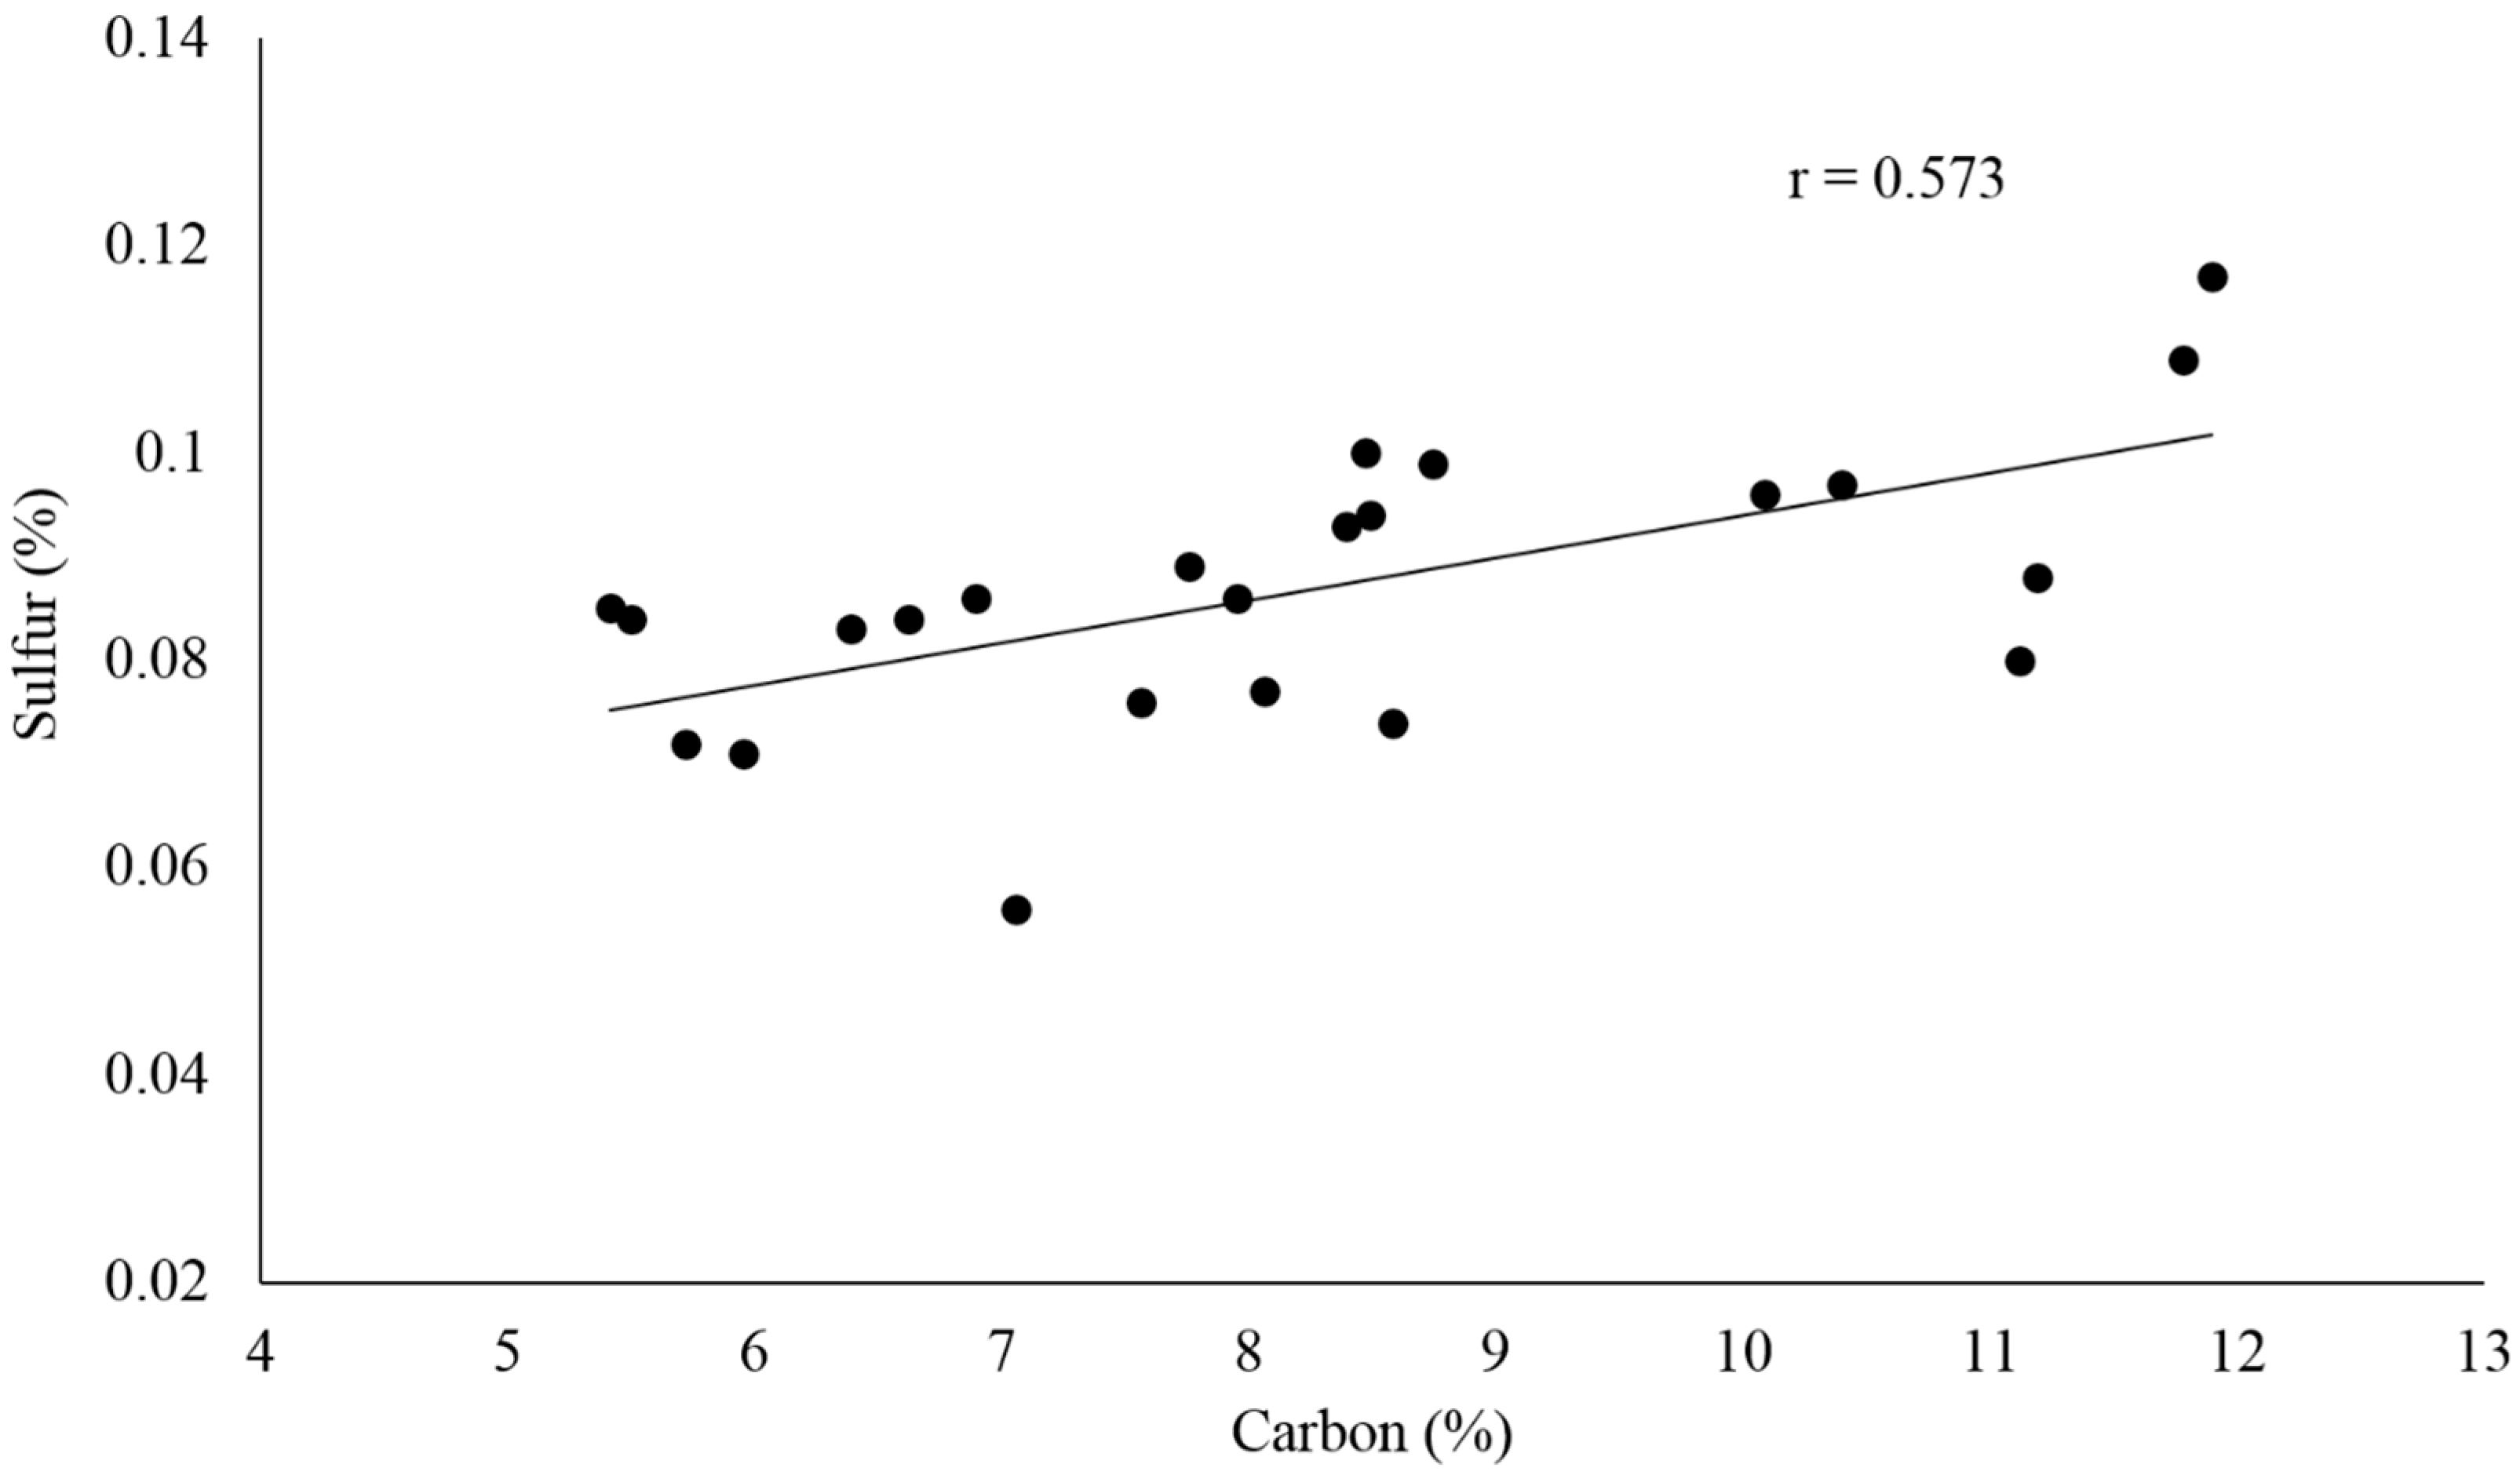
66]. The distribution of sulfur in Ellis Island soil samples ranged between 0.056% and 0.117% with an average of 0.087% ± 0.013%. Its weaker linear correlation with carbon (
r = 0.573) suggested that the source of sulfur in Ellis Island soil could be organic matter with possible mixing with inorganic carbon (
Figure 5). The C/S ratios in all soil samples averaged at 94:1 with the lowest value found in Central B (C/S = 64:1) and the highest near the hospital powerhouse in Furnace D (C/S = 127:1), possibly due to inorganic carbon addition from coal. Assuming the majority of carbon in Ellis Island soil was in the form of organic carbon, the relative low C/S ratio would indicate the soil environment favors the sulfur mineralization process, which provided bioavailable sulfate to the essential life processes of plants and microbial communities [
66].
3.3. Acid Extractable Major and Heavy Metals in Ellis Island Soil
EPA Method 3051 was designed to maximally release the acid extractable phase of the metals without dissolving the refractory portion of the sample [
67]. The method provides a rapid and efficient way to assess the mobility and bioavailability of trace metals in environmental samples while largely reduces the matrix effect in the digest [
68]. In this study, NIST standard reference material 2711a was analyzed as a recovery check. The acid extractable metal concentrations of 21 soil samples are shown in
Table 5.
As major elements in soil, the average concentrations of Mg and Ca were considerably higher in the furnace area soil samples (0.85 ± 0.29%, 1.69 ± 0.49%, respectively) compared to other locations (0.39 ± 0.16%, 0.47 ± 0.35%;
p < 0.005). The coal-burning activities during the functional years of the powerhouse might explain the higher Ca and Mg levels in the surrounding soil. The major source of coal supply to New Jersey in the early 1900s were Pennsylvania, West Virginia and Virginia [
69,
70,
71]. Coal production in West Virginia and Pennsylvania was from the Late Pennsylvanian age Monongahela Group, specifically the Pittsburgh Coal Seam, the most laterally extensive and the largest seam in the Appalachian basin [
70,
71]. The soil Ca and Mg near the furnace might have come from coal balls and other concretions that are associated with these Carboniferous age coal deposits, which contain high concentrations of calcite and dolomite [
72]. Additionally, both elements are in greater proportion than other trace metals in coal itself as well as in combustion products (fly and bottom ash) [
73,
74].
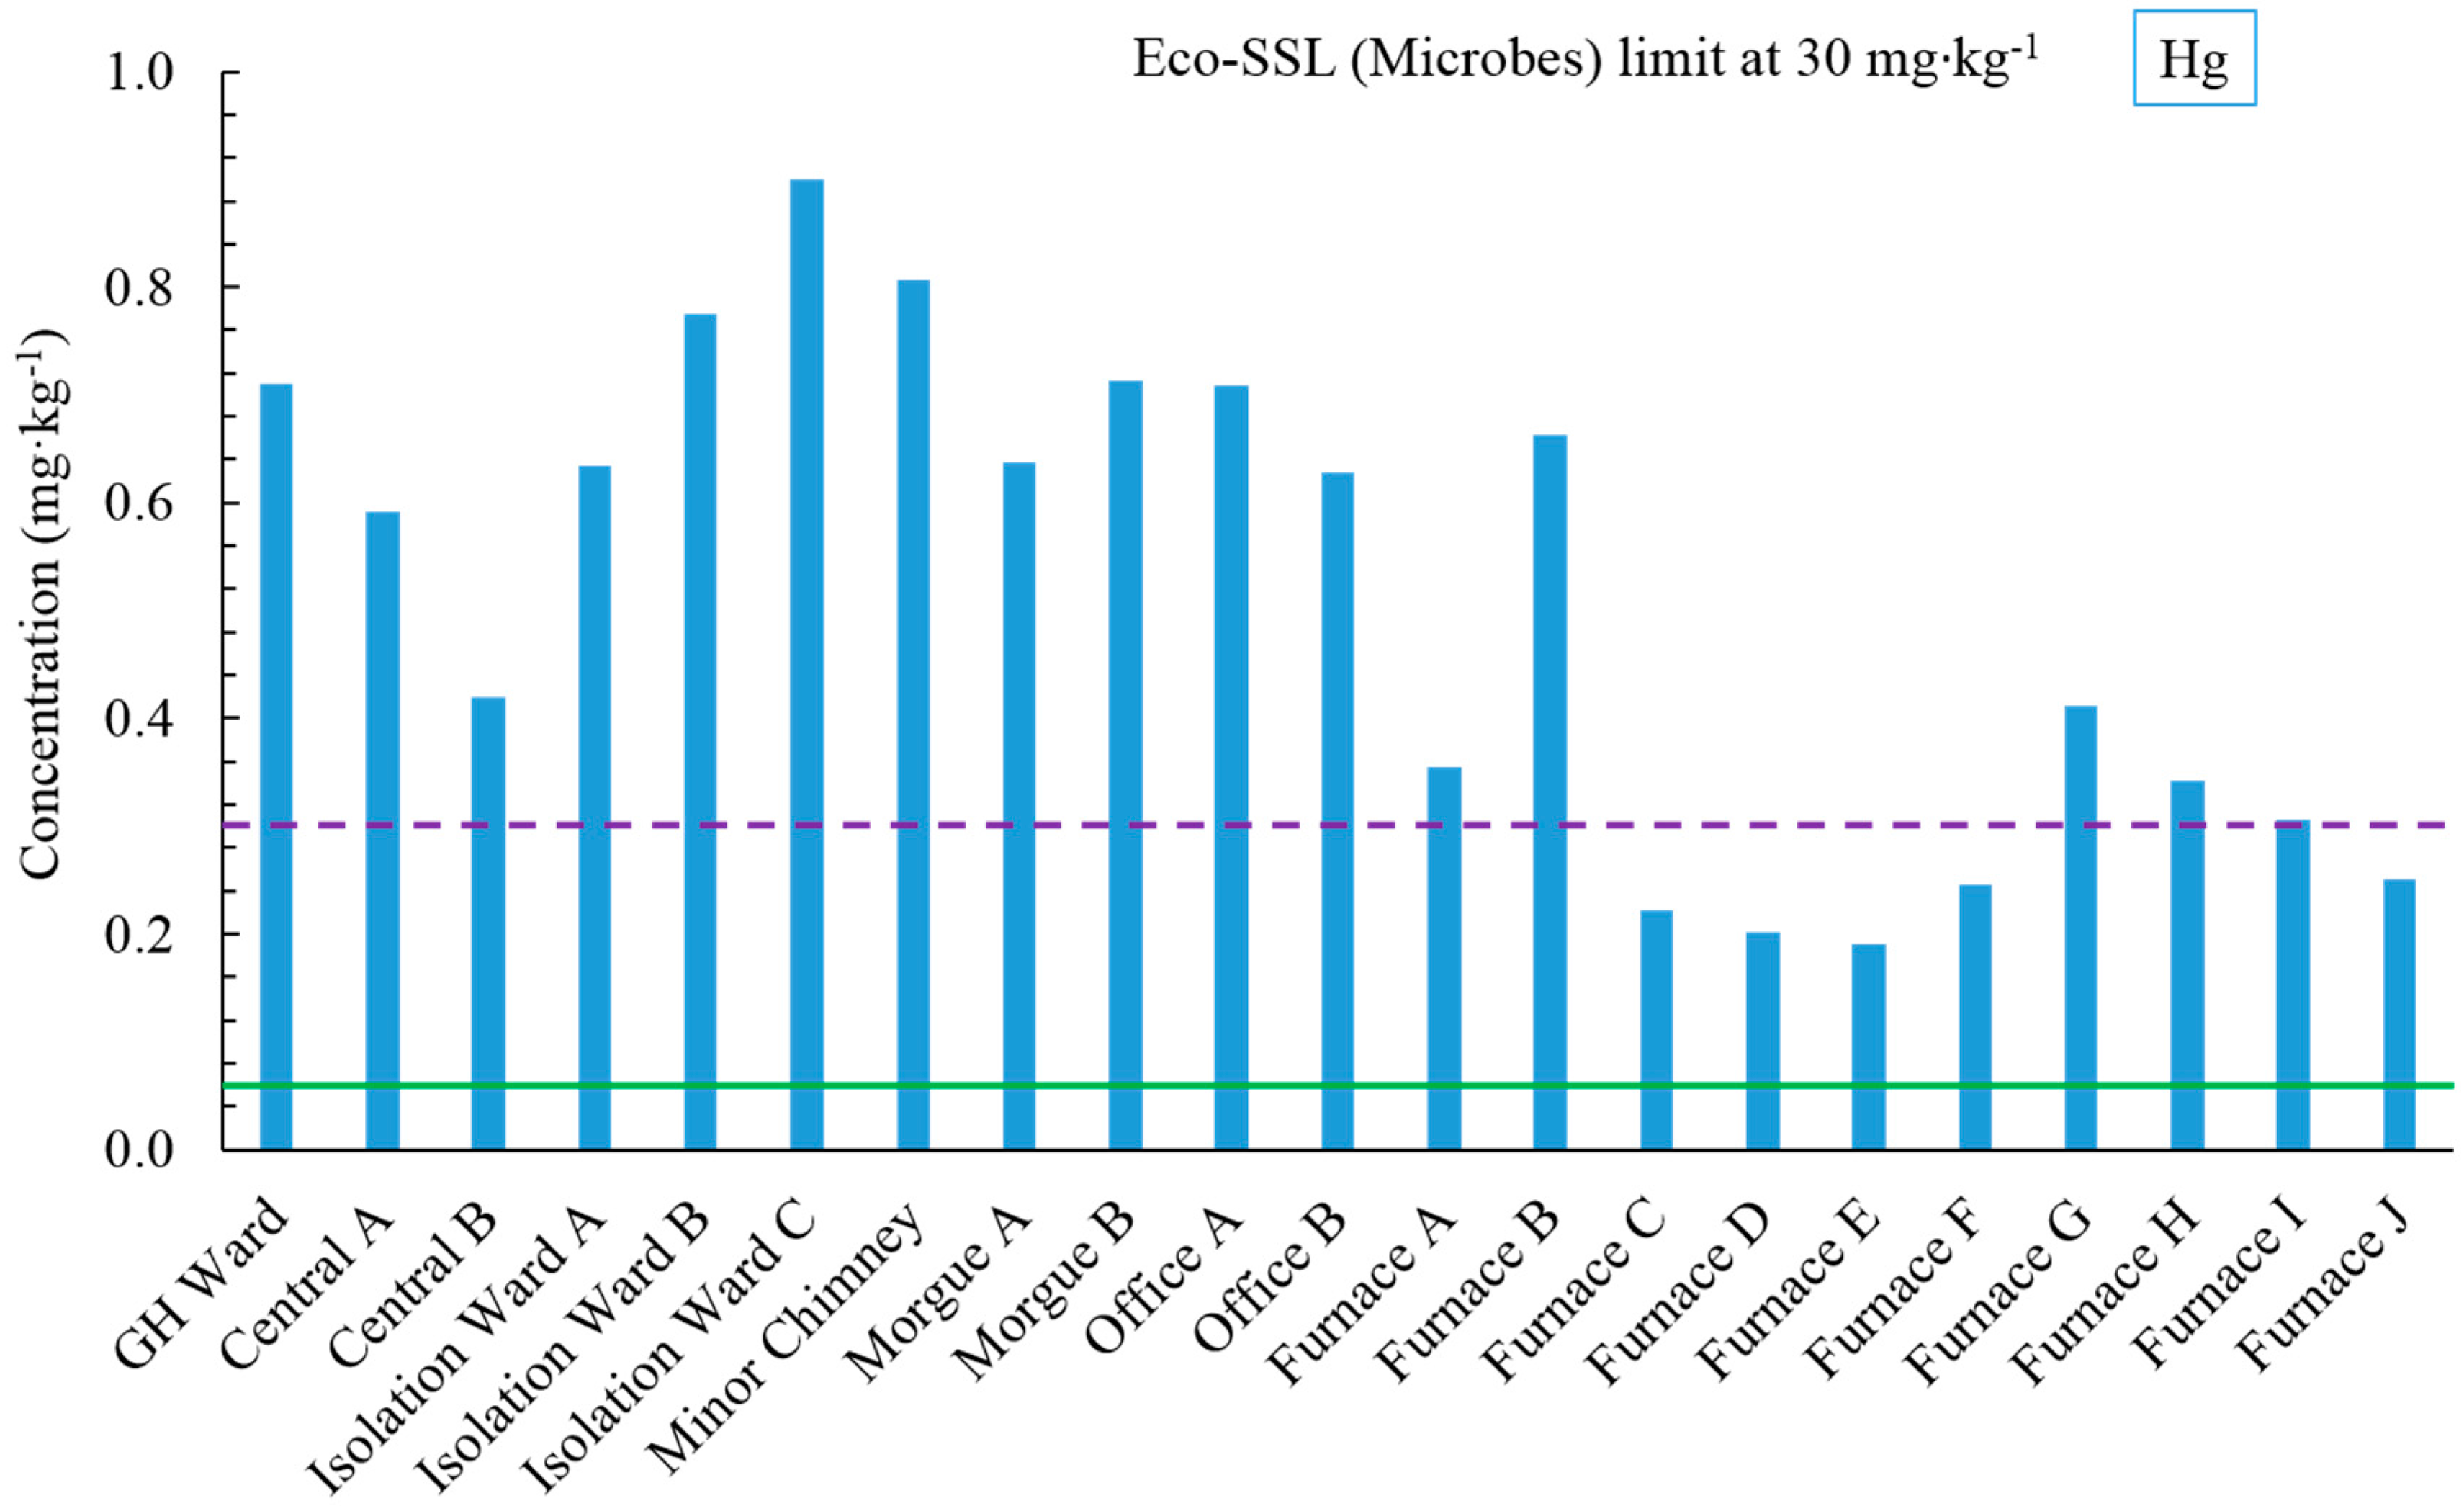
The acid extractable heavy metal concentration reflects the portion in soil that can be mobilized and become bioavailable, they also provide useful information regarding the chemical partitioning of elements in soil matrix. High acid extractable heavy metal concentration in soil can be concerning as it poses potential risk to plants, soil microorganisms and humans. In this study, Ecological Soil Screening Levels (Eco-SSL) for plants and microbes from the NOAA Screening Quick Reference Tables (SQuiRTs) were used to evaluate the acid extracted heavy metal concentrations in Ellis Island soil samples [
75]. Eco-SSL values are the safe limits of concentration of contaminants that ecological receptors commonly come into contact within soil or ingest through biota that live in or on soil [
76]. Although the Eco-SSLs are not purposed to provide a guideline for contaminant cleanup, these values are useful for the assessment of potential ecological risk from the contaminants. New Jersey background metal concentration in soil as well as soil cleanup criteria from New Jersey Department of Environmental Protection (NJ DEP) were also incorporated in the discussion to assess the ecological impact of the metal concentrations in soil [
77,
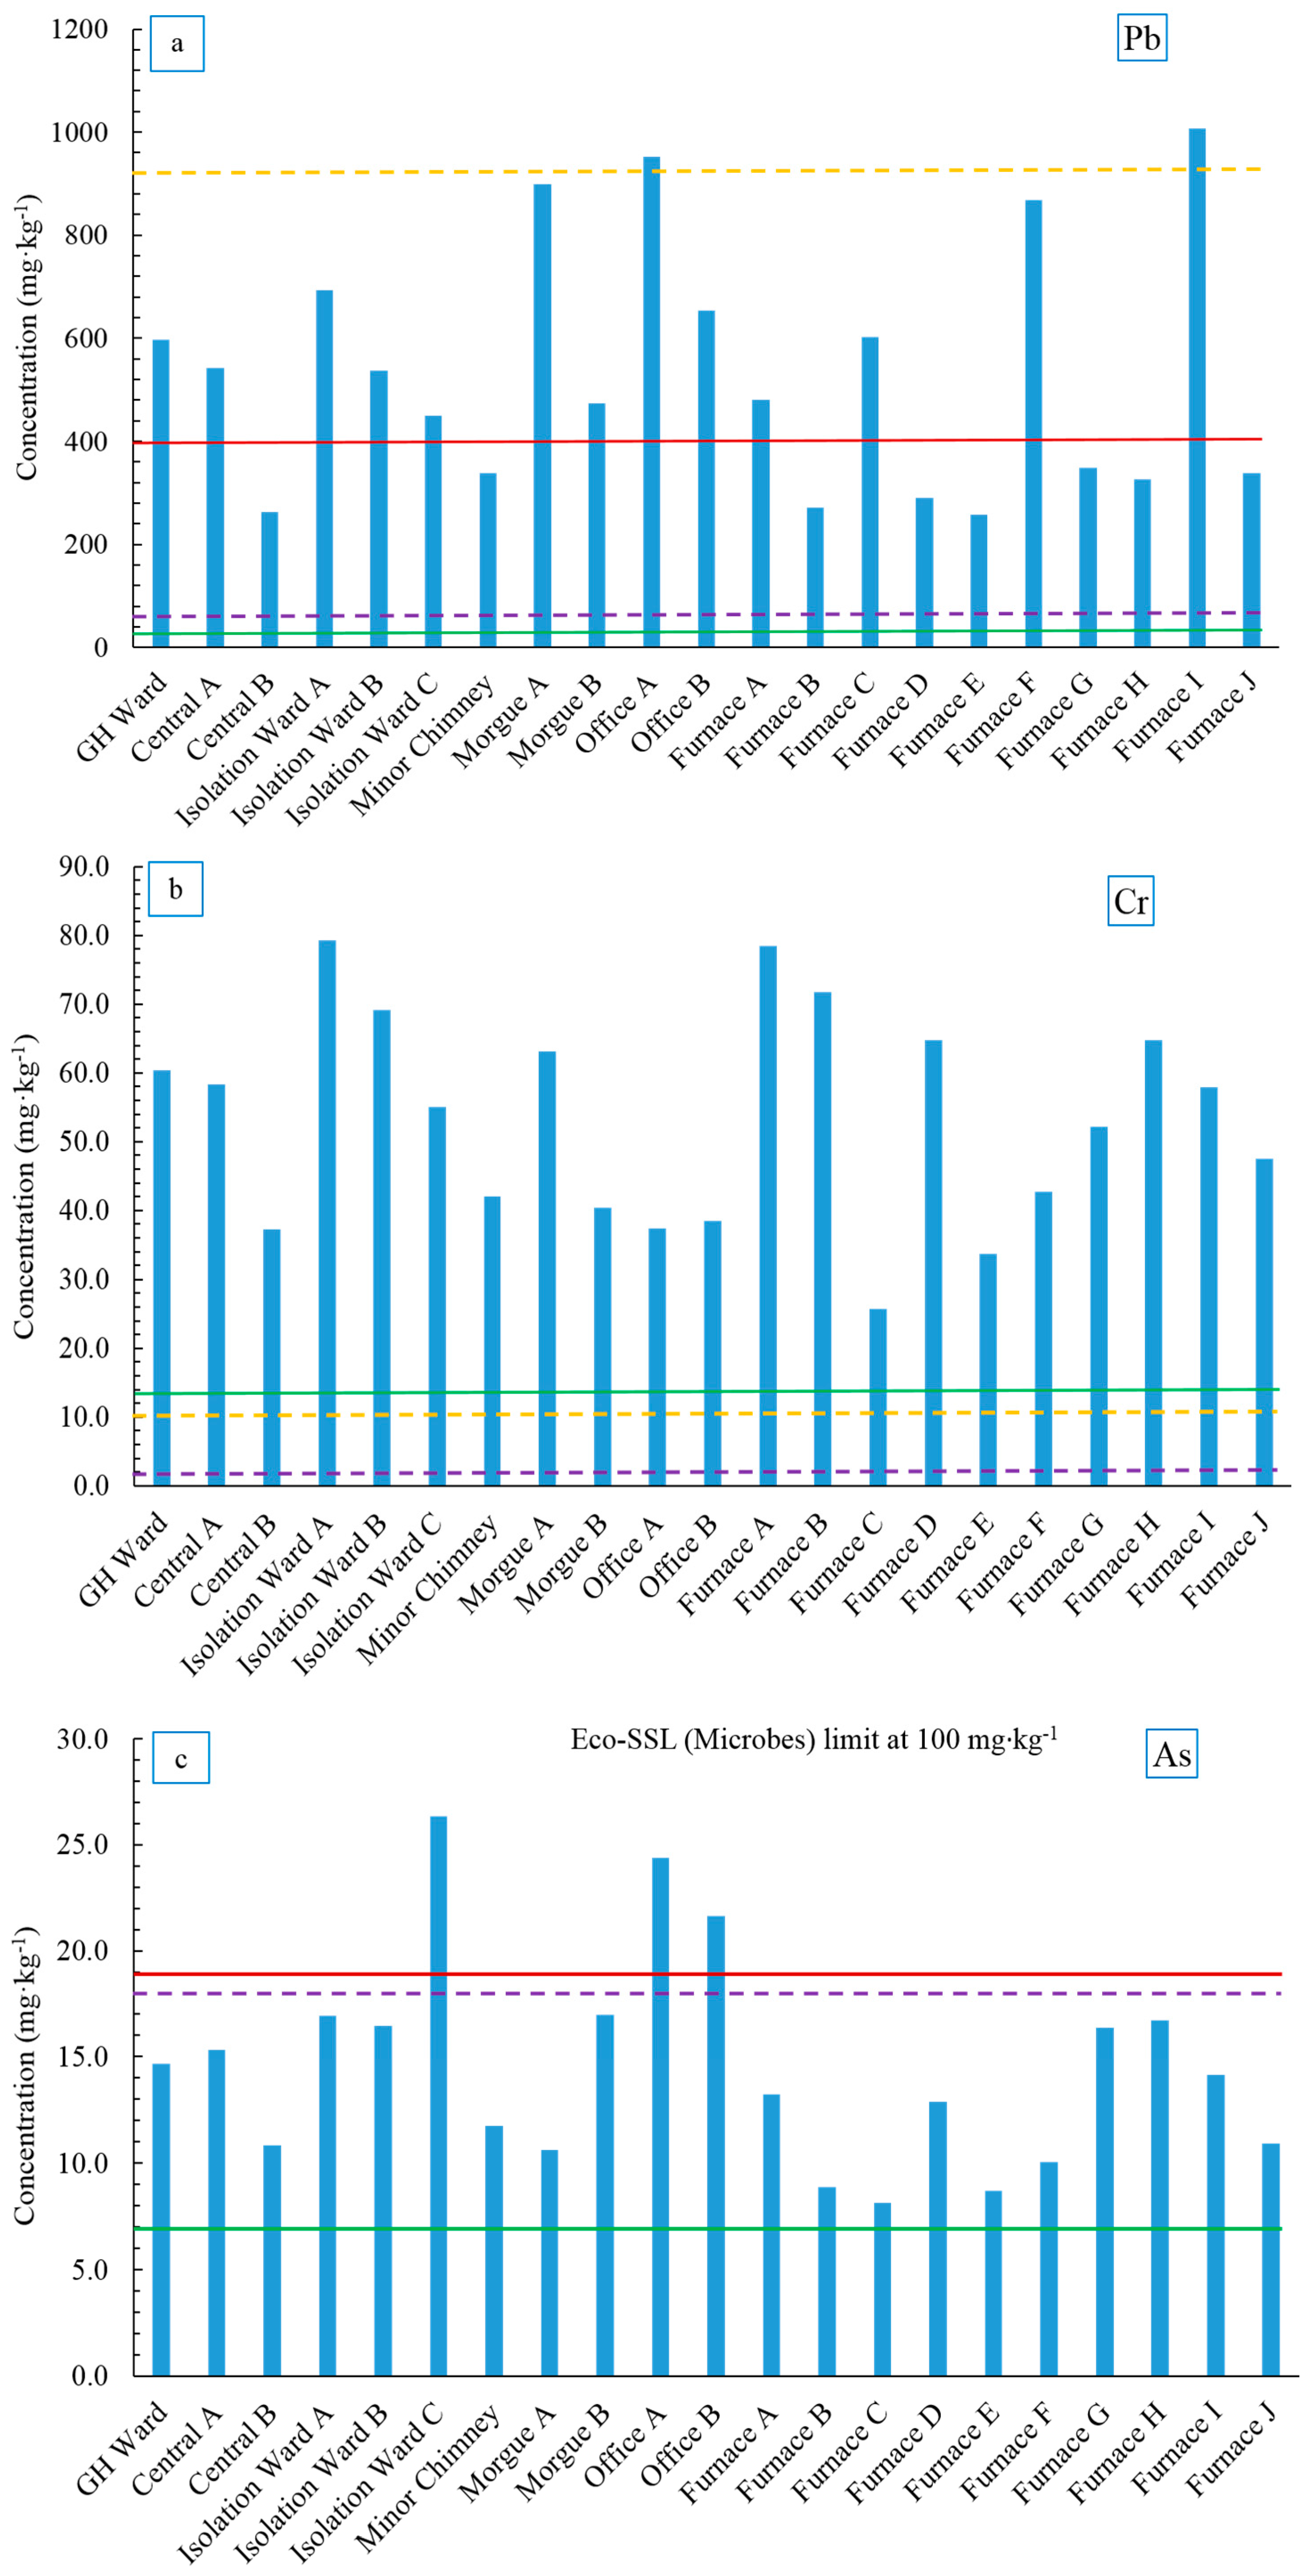
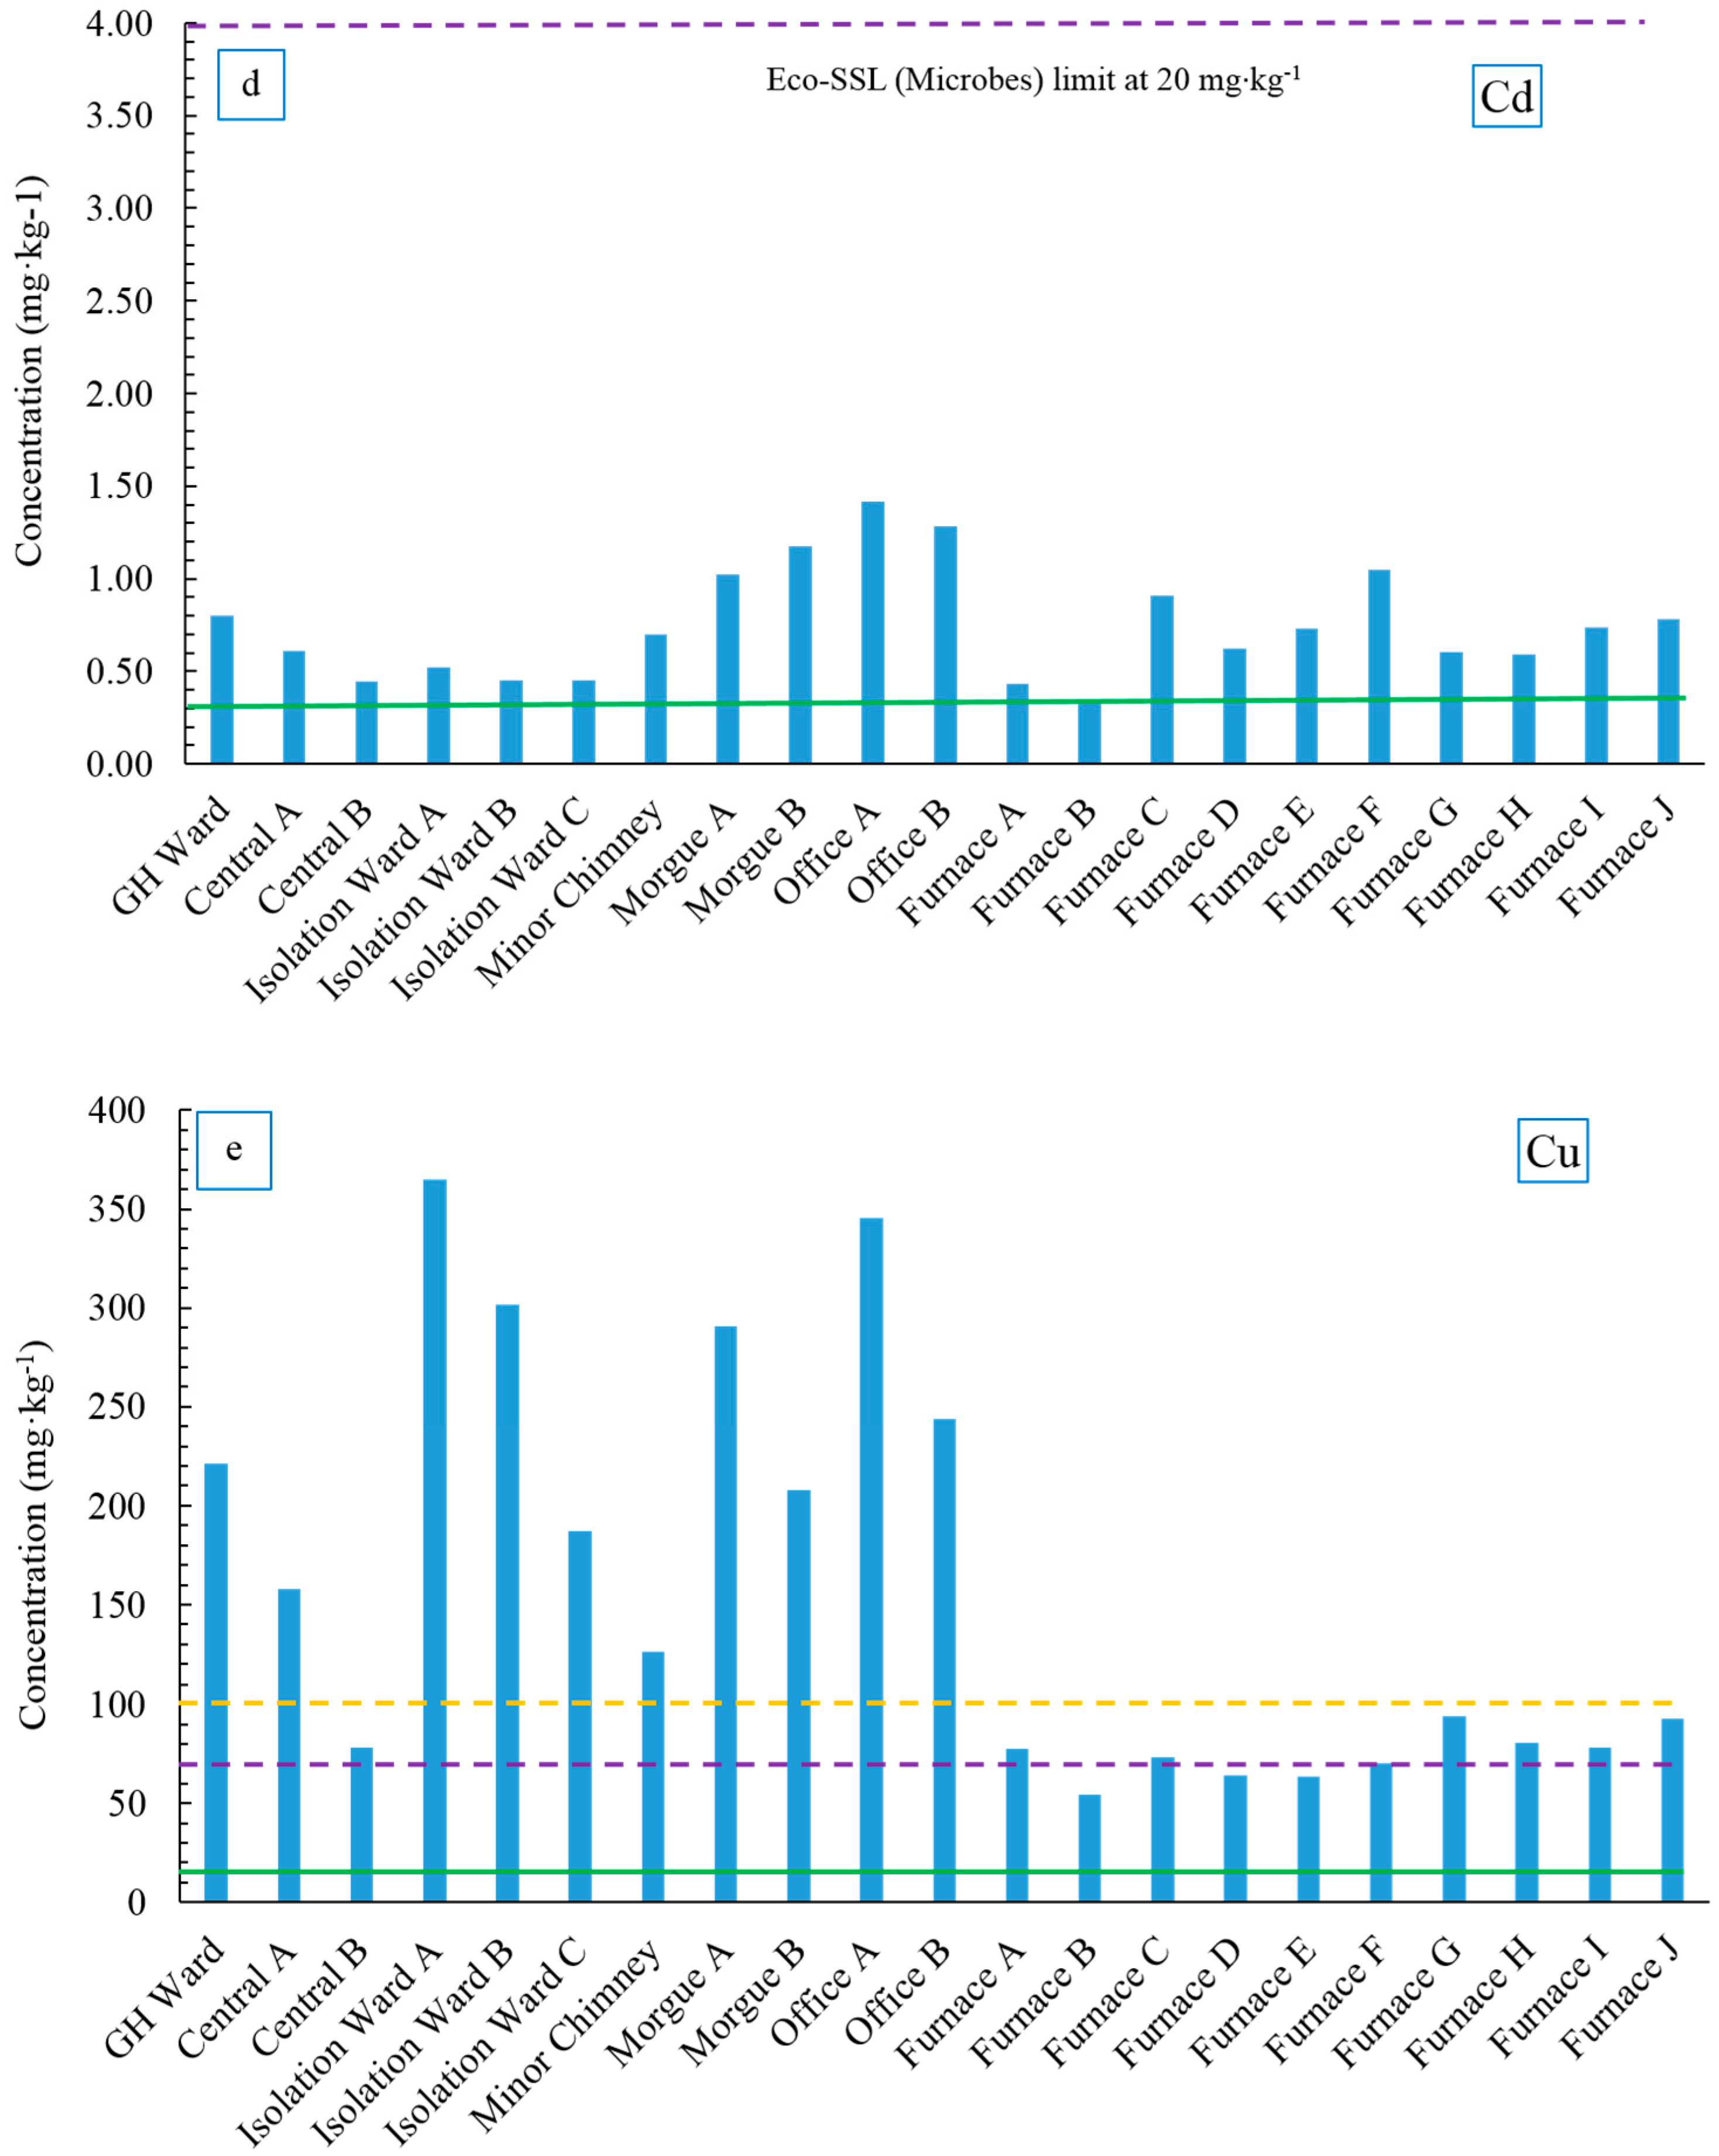
78]. Note that although the Eco-SSLs are based on total soil metal concentration, with the exception of Cr, all heavy metals extracted with EPA 3051 method showed good recovery from 95% to 100% (Cu, As, Cd and Pb). Concentration profiles for these heavy metals are compared to Eco-SSLs (Plants and Microbes) and NJ background values are shown in
Figure 6a–e. The NJ DEP soil cleanup criteria are summarized in
Table 6, as can be seen except for As and Pb, the guidelines levels are well above the amounts of heavy metals found in all Ellis Island soil samples.
Lead is a toxic heavy metal that persistently accumulates in the soil environment. The average Pb concentration in the Ellis Island soil samples was above the NJ Pb soil background level (533 ± 239 mg·kg
−1 vs. 35 mg·kg
−1). There was much variation in the concentrations observed between the samples (
Figure 6a). Lead concentration in all samples exceeded the Eco-SSL value for plants (50 mg·kg
−1) but was within the value for microbes (900 mg·kg
−1) except for Office A and Furnace I (952 mg·kg
−1 and 1008 mg·kg
−1, respectively). Thirteen out of 21 soil samples had Pb concentrations higher than the NJ soil cleanup guideline. As noted earlier, lead arsenate insecticide was used on the island prior to being abandoned, which may account for the high Pb levels. Another possibility was the use of leaded paint in the past, which contained lead acetate prior to about 1977. Flakes of paint have likely contributed Pb to the soil, particularly near the buildings. Lead has low mobility in soil as it tends to complex with soil organic matter, Fe and Mn oxides or precipitate with phosphates, sulfates and carbonates [
79,
80]. When in soil, Pb from lead arsenate is likely converted to more insoluble compounds, such as lead hydroxide and lead phosphate, which then become immobilized in the soil [
81]. Therefore, the heterogeneous Pb distribution in Ellis Island soil could be the combined results of insecticide application, use of leaded paint and low Pb mobility in soil.
Chromium is considered a micronutrient element to humans as it involves in the action of insulin, however higher level of Cr, especially Cr (VI) exerts toxicity and carcinogenicity to humans [
82]. In the soil ecosystem, Cr is phytotoxic to plants and adversely affects enzyme activities in soil microorganisms [
83,
84]. Chromium continues to increase in the environment due to anthropogenic inputs, such as disposal of Cr-containing products, coal fly ash, bottom ash and emissions from metal processing facilities [
85]. The acid extractable Cr concentrations in Ellis Island soil were higher than NJ background soils (13.9 mg·kg
−1,
Figure 6b) and were also significantly higher than the Eco-SSLs for both plants and microbes (1 mg·kg
−1 and 10 mg·kg
−1). The highest Cr concentration was found in Isolation Ward A (79.3 mg·kg
−1) and the lowest was found in one of the Furnace samples (Furnace C, 25.7 mg·kg
−1), although the rest of the furnace soil samples showed similar Cr levels as other areas (33.7–78.5 mg·kg
−1) in the complex. The low extraction efficiency for Cr (~31%) might due to the presence of insoluble Cr minerals such as chromospinels and chromites [
86], which further indicated the majority of the Cr in Ellis Island soil was not bioavailable. Though the source of overall high Cr on Ellis Island soil is not yet clear, it is possible that it could be from the disposal of fly ash and bottom ash from the coal-burning furnace in the powerhouse, which would contain high levels of Cr. In fact, fly ash and bottom ash disposal is the second largest anthropogenic source of Cr to the environment [
85]. Another possible source could be the landfill materials that were used to form the southern part of Ellis Island. Landfill sediments could have contained a higher Cr concentration , since Jersey City and its environs around Hudson County was, between 1905 and 1976, a center for chromate and dichromate chemical manufacturing, which received chromite ore from around the world [
87]. Over 2 million tons of residue from chromite ore processing was generated during that period and was disposed across Hudson County, NJ [
88]. The toxicity of Cr in the soil environment largely depends on the mobility and solubility of the presenting Cr species (Cr
0, Cr
3+ and Cr
6+), in neutral or basic soil environment, Cr predominantly present in the tetravalent form as Cr(OH)
3, which has very little mobility and solubility in water, hence limited bioavailability [
85,
89]. Therefore, Ellis Island soil might not pose a risk to the plants and microbes even with observed high Cr levels. However, further speciation analysis is needed to determine the fraction of Cr (III) and Cr (VI) in the Ellis Island soils to achieve a full evaluation of Cr risk to the Ellis Island soil environment.
Arsenic is a well-known non-threshold carcinogen to humans and can largely affect soil quality by influencing the nutrient cycling and soil biodiversity [
90]. Ellis Island soil samples generally contained twice the amount of As found in NJ soil background (14.6 ± 5.0 mg·kg
−1 vs. 7 mg·kg
−1), though the average was still below the Eco-SSL value for plants (17 mg·kg
−1,
Figure 6c). Three soil samples (Isolation Ward C, Office A and Office B) showed As concentrations higher than NJ cleanup criteria of 20 mg·kg
−1 (21.6, 24.4 and 21.6 mg·kg
−1, respectively). The source of As is not clear; however, it is reasonable to speculate that As might have originated from anthropogenic sources such as coal combustion products emitted during the years when the hospital was functional and lead arsenate insecticides, which were introduced to Ellis Island in 1894 for the purpose of controlling gypsy moths [
91,
92]. Arsenate is the dominant As species in most soil environments, it can be immobilized by Fe, Al and Mg oxides in the soil or by bacterial interaction [
93,
94]. The nearly neutral soil pH also tends to limit As mobility, which might also account for the higher As level in Ellis Island soils [
95,
96]. The fact that the Eco-SSL value for microbes is at 100 mg·kg
−1 is also a good indication that the microorganisms have a higher As tolerance than other species.
Cadmium negatively interferes with the uptake and transport of Fe, P and Mn in plants, causing stunting and chlorosis [
97]. The toxicity of Cd can also influence the soil microorganisms and microbial processes, affecting their population and activities [
98]. All acid extractable Cd concentrations in Ellis Island soil samples were well below Eco-SSLs for both plants and microbes (4 mg·kg
−1 and 20 mg·kg
−1, respectively,
Figure 6d). Additionally, most soil Cd concentrations were close to the NJ Cd soil background value (0.3 mg·kg
−1) with samples from the Office-Morgue area being slightly higher, which varied from 1.02 to 1.42 mg·kg
−1. Cadmium has high solubility in water and therefore high mobility in the soil environment [
99]. The sandy texture of Ellis Island soil could also result in close-to-background level Cd in the soil, since Cd mobility is higher in those soils with a high percentage of sand [
54].
As a nutrient element, Cu shows toxicity to both plant and microbes at higher levels. Copper can adversely affect plant root growth and inhibit Fe uptake and cause stunting [
100]. It could also adversely affect soil microbial biomass, activity and diversity because of its antimicrobial properties [
101,
102]. Copper concentrations were significantly lower in the furnace samples with an average concentration of 74.8 ± 12.5 mg·kg
−1, whereas samples from other locations averaged at 230 ± 91 mg·kg
−1 (
p < 0.001) (
Figure 6e). The average Cu concentration from the furnace area fell between the Eco-SSL values for plants and microbes (70 mg·kg
−1 and 100 mg·kg
−1, respectively), suggesting the soil near the furnace might provide a more hospitable environment for microbes to thrive; whereas the Cu concentration in most of the other areas exceeded the Eco-SSL for microbes. The cause of low Cu in the soil near the furnace area is unknown, as there is no obvious source altering the soil Cu concentration on the Island presently or even decades ago. However, certain soil bacteria might be the potential contributor to the Cu removal in soils that enhance the Cu mobility, bioavailability and the Cu accumulation in plants [
103]. With further studies of the soil bacteria diversity and the Cu levels in plants from the area, the cause of low Cu in the furnace area might be determined.
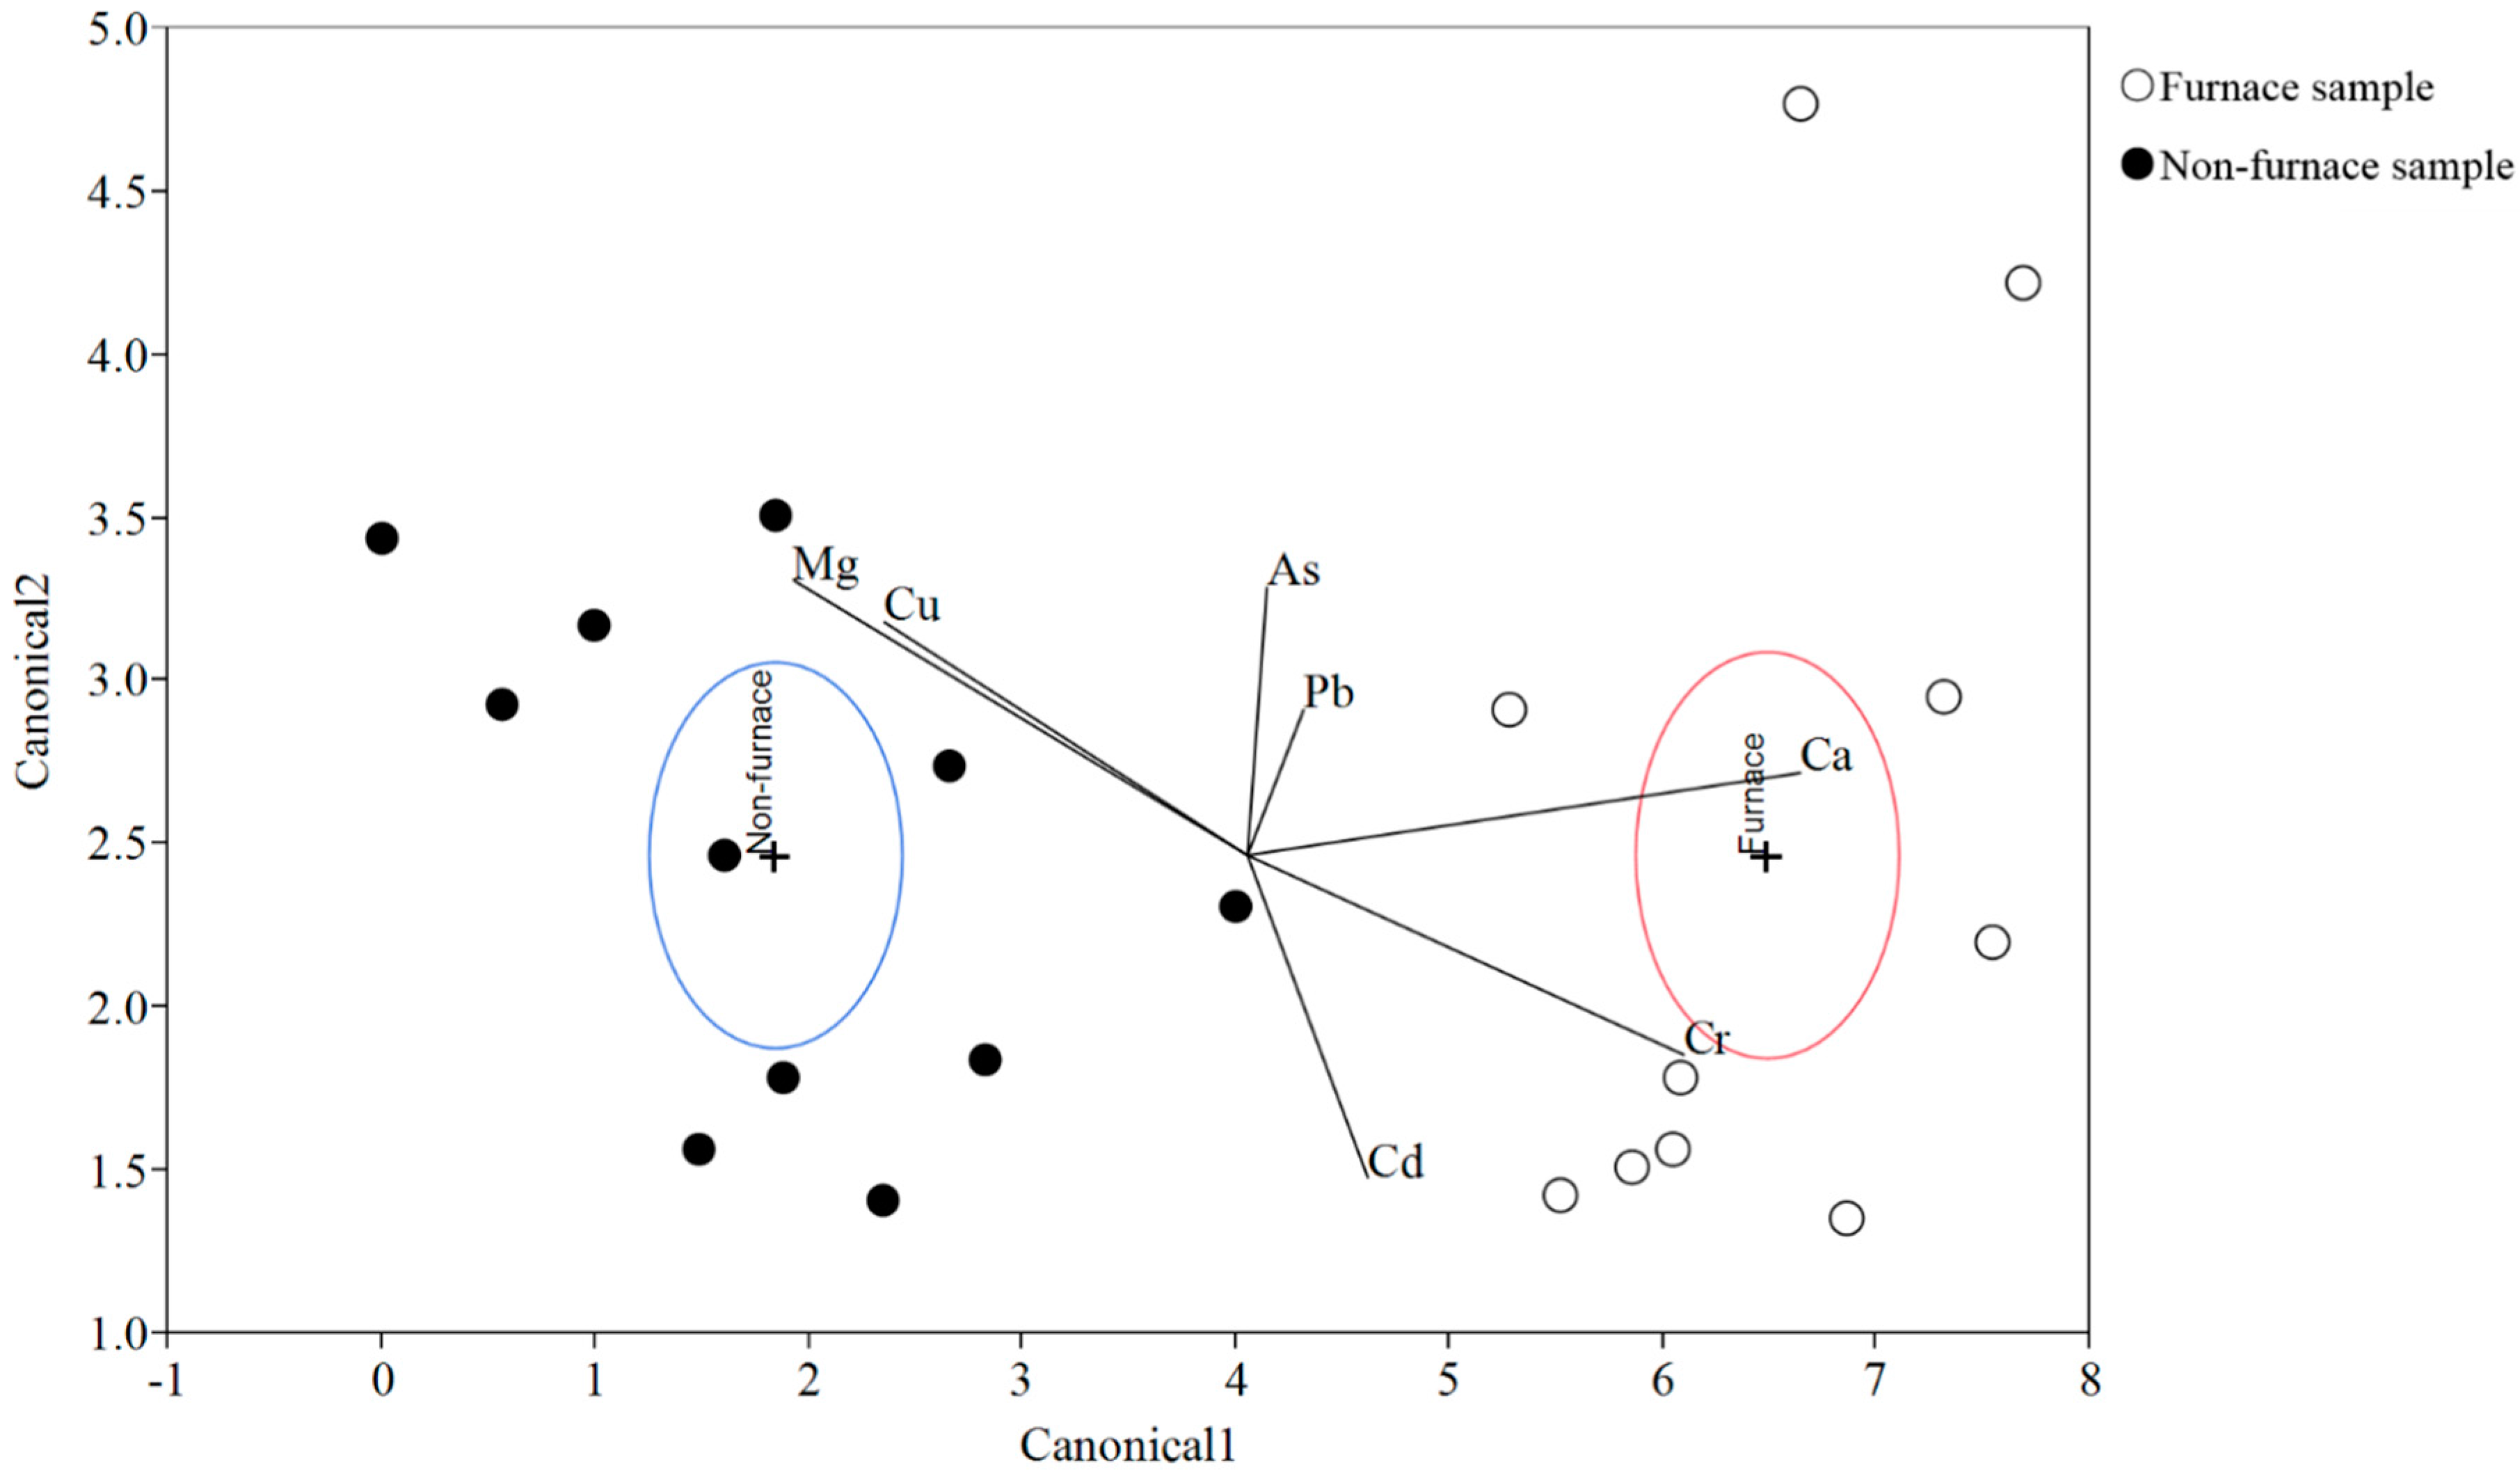
Discriminant analysis (DA) is a routine statistical technique which uses a set of linear combinations of quantitative variables to reveal the among-group differences. DA was performed in this study because the soil samples from furnace area had shown distinct metal profiles from those non-furnace samples. The DA results (
Figure 7) suggested that wthin a 95% confidence level, the means of the two groups, furnace samples and non-furnace samples, were statistically different. No sample was misclassified. The biplot rays further showed that the two groups were mainly discriminated along the first canonical variables (canonical 1), in which Ca, Mg and Cu were the dominant elements. Arsenic and Pb, Cu and Mg were strongly correlated, respectively, which indicated possible similar sources for both pairs of elements. Based on previous discussions, the unique environmental conditions around the furnace area (coal deposition and burning) might contribute to its significant different soil metal profiles.
