Abstract
To evaluate tsunami hazards with strong locality in urban areas, this study developed a novel tsunami inundation model based on nonlinear shallow water wave equations and a porous body model (PBM). By applying a kinematic boundary condition that includes both porosity and surface permeability of the porous medium, the proposed model could accurately incorporate geometric effects such as the flow anisotropy caused by the distributions of buildings. The proposed PBM demonstrated as good accuracy for the inundation heights around buildings near the coastline as with a conventional three-dimensional simulation with high resolution. In addition, the model showed its capability to reproduce a tsunami’s essential behaviors in urban areas. In particular, the amplification effect of flow velocity along straight roads surrounded by buildings was reasonably reproduced. It can be expected that the present model can become a useful tool to accurately evaluate the tsunami risks in urban areas.
1. Introduction
1.1. Background
The damage induced in heavily populated areas by the tsunami generated during the 2011 Great East Japan Earthquake was enhanced because the tsunami struck an urban area [1,2]. The flow of a tsunami is accelerated due to the contraction effect in urban areas where strong structures are lined up [2,3]. The existence of buildings reduces the visibility of evacuees and causes complex tsunami flow that strikes from an unexpected direction (e.g., from behind). Therefore, precise evaluations of the tsunami risks in urban and populated areas caused by urban-type tsunamis are especially important for disaster risk reduction planning.
Tsunami predictions in urban area have been conducted by using several kinds of models [4]. For example, Arikawa and Tomita [5,6] coupled a Storm surge and Tsunami simulator in Oceans and Coastal areas (STOC) [7] and a Super Roller Flume for Computer Aided Design of Maritime Structure in 3D (CADMAS-SURF/3D) [8] using a volume of fluid (VOF) method to efficiently simulate tsunamis from the source to run-up in both directions, and Suwa et al. [9] also developed a model integrating a Smoothed Particle Hydrodynamic (SPH) method and a two-dimensional nonlinear shallow water wave (NSWW) model (TUNAMI-N2 [10,11]). These three-dimensional tsunami inundation simulation models with high resolution (0.5 m–2 m) using the K computer, a Japanese supercomputer, are expected to provide detailed calculations not only of the reflections of tsunamis from buildings and the progression and confluence of a tsunami between buildings but also of the hydrodynamic forces acting on buildings because the individual shapes of buildings in urban areas are incorporated into the calculations. However, to implement additional, more effective countermeasures against tsunamis, it is important to estimate the human and property damages caused by various assumed tsunami scenarios. To examine various scenarios and areas for pragmatic tsunami risk evaluations over wide areas, a more practical calculation method that can be executed without a supercomputer is required.
Meanwhile, the vertically integrated two-dimensional calculation models for the investigation of near-field tsunamis (TUNAMI-N1, -N2 and -N3 [10,11]; MOST [12]; COMCOT [13,14]; NAMIDANCE [15]; TsunAWI [16]; ANUGA [17]), which are based on NSWW theory, have been widely applied for both research [18,19,20,21,22,23,24] and practical purposes. For example, the TUNAMI has been transferred to many countries in the Tsunami Inundation Modeling Exchange (TIME) project [11,25]. Most of the models are often solved using a leap-frog method and a finite difference method (FDM) with a structured mesh because of higher scalability and experience stock. Recently, tsunami inundation calculations with a relatively high resolution (approximately 5 m) have been performed on general-purpose computers. However, it is difficult to precisely reproduce the shape of buildings in the model with limited resolution depending on the size of the buildings. It has been noted that representative length scale of a building needs to be divided into eight sections to adequately express the geometric effects of buildings [26]. Namely, for a general house, a mesh size of approximately 1 m or less is required in models applying structured constant mesh system. It is obviously difficult to implement such high resolutions and large-scale calculations using a general-purpose computer. Indeed, such investigations are conducted only on a supercomputer; accordingly, Oishi et al. [22] concluded that a resolution higher than 1.67 m is necessary to have a well-converged solution for their simulation of Miyako City.
To apply the 2-D NSWW model with a practical resolution on a sub-grid scale to urban areas, various methods for incorporating the influences of groups of buildings have been proposed. Roughness-type models focusing on the mechanical effects of groups of buildings have been proposed:
- (Model 1) the roughness map model, which uses Manning’s roughness coefficient “n” according to the land-use type [27] (hereafter, Landuse-n model),
- (Model 2) the equivalent roughness model (Equivalent-n model), which considers the drag forces acting on buildings and incorporates it in the model as an equivalent roughness [28,29].
The features of roughness-type models were compared by Muhari et al. [19]. Since roughness-type models have high practicality, they are often applied to practical tasks. However, it is difficult to properly reproduce the geometric effects of buildings, such as rises in local water level around buildings [19].
The geometric effects of buildings have been modeled in some calculation models with a practical resolution. The models apply three-dimensional building shapes, referred to as the digital surface model (DSM), to topographic data:
- (Model 3) the roughness map and topographic model (Landuse-n/Topography model) (e.g., [18,19,20,23,30]), which is a hybrid model combining the Landuse-n model (or constant roughness model) with a topographical model.
- (Model 4) the equivalent roughness and topographic model (Equivalent-n/Topography model) [29], which is a hybrid model combining the Equivalent-n model with a topographical model.
- (Model 5) the coastal-forest model [31] and
- (Model 6) the flood model [32,33,34,35], which are porous-type models employed to reproduce the geometric effects of porous media.
The differential equations of the coastal-forest model (Model 5) were derived using an assumption that trees exist in the center of the unit volume element, result of which is that the porous media is marked by vertically dependent volume space but not restriction of flow path area in the horizontal direction. The flood model (Model 6) introduced an isotropic unit porous media with a characteristic value of porosity in the fundamental differential equations, which correspond to Equations (1) and (2) in Section 2.1. The models by [34,35] use the value based on volume porosity of the cell mesh as the flow path area at edge of that in their process of discretization by FDM, enabling the anisotropy of flow to be numerically reproduce, wherein the building height effect is not considered. Sanders et al. [33] derived an integral form of a porous-type model that can take anisotropy into consideration by combining the Reynolds transport theorem with the conservation within the cell mesh in the finite volume method (FVM). In addition, the influence of shape of the unstructured mesh in the model has been investigated by Kim et al. [36,37].
The features of existing calculation methods employed for urban areas are summarized in Table 1. Not only the high-resolution simulation model but also the porous-type model using the FVM proposed by Sanders et al. [33] would be expected to calculate the geometric effect of buildings more accurately. Meanwhile, various 2-D NSWW numerical models have been applied to tsunami risk evaluations for practical purposes in terms of the available perspectives. However, differential equations based on NSWW theory, which includes the anisotropic geometric effects of building group as shown in Table 1 and which can be directly applied to the FDM, have not been proposed so far. Furthermore, in the current situation, wherein various numerical models exist, it has been increasingly important to understand the similarities and differences of the tsunami hazard results obtained via the various methods and models.

Table 1.
Features of existing calculation methods for urban areas.
1.2. Objectives
In this study, a novel tsunami inundation analysis model using the FDM is developed to evaluate tsunami hazards with strong locality in urban areas, and characteristics of the tsunami hazards simulated by some conventional numerical models are also investigated.
1.2.1. Development of NSWW Theory and Numerical Model Based on a Porous Body Model
In order to consistently consider the anisotropy of building group in the process from theory to numerical discretization, NSWW differential equations based on the porous body model for anisotropic unit porous media proposed by Sha et al. [38] and Sakakiyama and Kajima [39] are derived. The voids in the porous media are continuous. Assuming tsunami inundation of an urban area with impermeable/non-destructive buildings, the equations are implemented to the conventional TUNAMI-N2 using the FDM.
1.2.2. Investigation of Characteristics of Tsunami Hazards Simulated by Numerical Models
Numerical simulations of the tsunami inundation for the high density of buildings in the town of Onagawa, Miyagi Prefecture, Japan, during the 2011 Great East Japan Earthquake are performed to compare to some conventional models. The Onagawa town was one of the affected areas that suffered tremendous damage during the tsunami [40,41,42,43,44,45]. The tsunami hazards and damages in this area have been investigated numerically by some researchers using some methods to be available for inundation simulation in urban area [5,6,9,23,24], providing useful data for comparing various methods. However, complex and various phenomena in this area—e.g., destruction of houses/buildings and breakwaters [42,43,44,45], and morphological change [44]—are not included in these models nor in the proposed model. Tsunami hazards might be affected by various phenomena, e.g., destruction of breakwaters [23] and houses/buildings [46,47], floating debris [47,48,49] or morphological change due to tsunami-induced sediment transport [50,51,52,53], although understanding of the mechanism and the influence is limited. These phenomena, as well as the tsunami source, are uncertainties for the numerical simulations. Therefore, discussions of the accuracy of the models modeling specific physics (i.e., geometric effects of building groups) compared with field survey results (including any uncertainties) do not always result in general conclusions. Meanwhile, we focus on investigating the characteristics of various models using simulated tsunami hazards rather than validation of the models with the tsunami including uncertainties.
2. Nonlinear Shallow Water Wave Equations Based on a Porous Body Model
2.1. Governing Equations
The NSWW differential equations based on a porous body model are derived. For an incompressible fluid in a porous medium (as shown in Figure 1), where the voids are assumed to be continuous in the medium, the three-dimensional continuity and momentum equations [38,39] are expressed as:
where γV and γi are the volume porosity (γV = fluid volume space/dxdydz) and components in the i-th direction of the surface permeability (e.g., γx = fluid surface area/dydz) in the unit element, respectively. The variables t, xi, ui, p, ρ and gi denote the time, components in the i-th direction of the spatial coordinates (x, y, z), components in the i-th direction of the fluid velocity coordinates (u, v, w), pressure, fluid density and gravity (0, 0, −g), respectively. The parameters Mi and Ri are the components in the i-th direction of the fluid inertia force and drag force, respectively, τij is the stress tensor acting on the surface of the unit volume element, and ui and γV ui (or γi ui) are the pore velocity and the Darcy velocity in the porous medium, respectively.
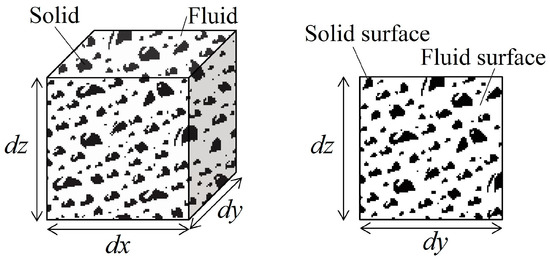
Figure 1.
Unit volume element in the porous body model, where the black and white are solid and fluid, respectively.
Long waves, such as tsunamis propagating in a porous medium, are considered. Assuming excess pore water pressure in the medium to be negligible, the vertical distribution of pressure is expressed as the following hydrostatic approximation:
where p0 and η are the atmospheric pressure and the water surface displacement in the porous medium, respectively.
2.2. Kinematic and Dynamic Boundary Conditions
To accurately evaluate the influences of flow path area (anisotropic permeability) and building height as shown in Table 1, we must construct a theory based on adequate boundary conditions. Hence, we introduce the following kinematic boundary conditions at the water and bottom surfaces considering both the porosity and the surface permeability in the porous medium [54]:
where a fixed bed and the Darcy velocity are used. The depth-averaged values of γV and γi are defined using the integral values of γV or i as follows:
Meanwhile, the dynamic boundary condition at the water surface is p0 = 0. The following derivation processes for the two-dimensional equations are explained using an x-z vertical plane for brevity.
2.3. Integration of the Continuity Equation
Equation (1) is integrated vertically from the bottom to the water surface using Equations (4)–(6).
Substituting the depth-averaged flow velocity in the x direction Ux(x, t) into Equation (7), we can obtain the general form of the continuity equation for the shallow water wave equations based on the porous body model as follows:
By using the flux in the x direction Qx(x, t) (Qx = UxD, where D = η + h is flow depth), Equation (8) can be rewritten as:
Next, assuming that the temporal variation in the porosity in the unit water column is sufficiently small, Equation (9) is rewritten as:
where the two-dimensional horizontal form of Equation (10) is:
The assumption imposed on Equations (10) and (11) holds when the vertical variation in the porosity is sufficiently small, i.e., when the temporal variation in the water level is similar to that of a long wave.
2.4. Integration of the Momentum Equation
We derive the momentum equation based on the porous body model. We substitute Equation (3) into Equation (2), which is then integrated vertically (see Matsutomi et al. [13] for descriptions of the terms Mi, Ri and τij), leading to the following:
Substituting U(x, t) into Equation (12), we can obtain the general form of the momentum equation of the shallow water wave equations for the porous body model as follows:
Equation (13) is rewritten into the following form by using the flux Q(x, t):
Using the assumption imposed on Equations (10) and (11), Equation (14) is rewritten as follows:
where the two-dimensional horizontal forms of Equation (15) are:
The proposed theory with anisotropy in porous medium would reproduce not only the local increase of the water level but also the flow acceleration around buildings due to a dam flow and a concentrative flow with exception a jet flow such as three-dimensional and non-hydrostatic flow. Moreover, the temporal variations, which are represented in their general form by Equations (8), (9), (13) and (14), in the properties of the porous medium are considered in the derived theory, and thus, an interaction between a solid and fluid due to the destruction of buildings and debris flow could be expected to be simulated by combining this model with a debris flow model [48,52,55], and the drag force coefficients, for example, in cases of debris dam, are also important to evaluate the decay of the energy in flow acceleration.
In this study, we focus on the geometric effects of buildings. Therefore, the drag force terms Mi and Ri are omitted, whereas the bottom friction due to τij is considered, although the terms represent important forces to simulate the hydraulics in urban areas where the effect of buildings suddenly changes spatially. Assuming that the temporal variation in the water level is sufficiently small similar to a long wave and that buildings are impermeable/non-destructive, Equations (11), (16) and (17) are applied as the basic equations in this study: by eliminating , e.g., the equations would overestimate the water level and flow velocity if a tsunami rapidly overflowed the buildings, and tsunamis passing through and staying in the buildings are not considered. The equations are incorporated into TUNAMI-N2 [10,11] using the FDM, and the proposed model is hereafter labeled a PBM in the following sections.
In the proposed PBM, the effects of both the anisotropy of the surface permeability and the building height, which both constitute challenges in conventional models using the FDM, are properly considered by calculating the porosity and surface permeability in the water column based on information regarding the planar distribution of buildings, the building heights and the simulated flow depth.
3. Establishing the Porosity and Surface Permeability for a Group of Buildings
In this section, the procedure used to establish the porosity and surface permeability for a group of buildings by using the positional relationships between the buildings and the calculation mesh as shown in Figure 2a–d is explained. Since the 2011 disaster, 3-D building data have been compiled by the Geospatial Information Authority of Japan (GSI) to mitigate disaster. The building data employed in this study are polygonal data with median values consisting of the building height for each building, which apply the above ground level (AGL) obtained from DEM and DSM measured by airborne LiDAR surveys [30]. The data of common and solid buildings was applied as building type. None of the buildings overlay.
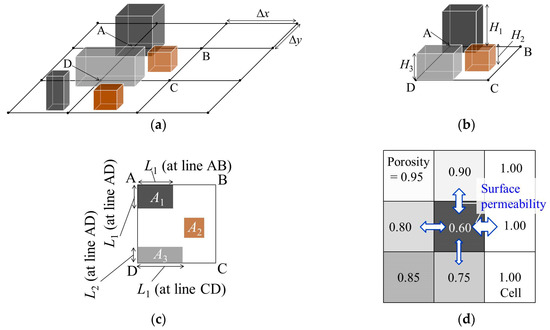
Figure 2.
Modeling process for buildings using the porous body model. (a) Buildings on computational mesh; (b) Buildings on cell mesh; (c) Occupancy area An on cell mesh and length Ln′ at the edge of cell mesh; and (d) porosity of the water column on cell mesh and horizontal surface permeability at the edge of the cell mesh.
3.1. Porosity of the Water Column
As shown in Figure 2a–c, we extract the occupancy area of each building An and the building height Hn from the calculation cell mesh, where n is the building ID within the cell mesh. In the case when the number of buildings that exist in the mesh is N, n = 0, 1,…, N, the integral values of the occupancy area and the characteristic building height on the cell mesh are defined as:
where Ac (=ΔxΔy) is the area of the cell mesh and Δx and Δy are the lengths of the edge of the cell mesh in the x and y directions, respectively.
The porosity of the water column for every calculation time step as shown in Figure 2d is calculated by referencing the flow depth D during each time step:
3.2. Horizontal Surface Permeability of the Water Column
As shown in Figure 2a–c, we extract the occupancy length of each building Ln′ and the building height H′n′ within the edge of the cell mesh, where n′ is the building ID in the edge of the cell mesh. In the case where the number of buildings that exist in the edge of the cell mesh is N′, n′ = 0, 1,…, N′, the integral values of the occupancy length and the characteristic building height on the edge of the cell mesh are defined as:
The surface permeability values of the water column for every calculation time step and as shown in Figure 2d are calculated by referencing the flow depth D′, which are the values in each edge of the cell mesh during each time step:
In this simulation, we use digital elevation model (DEM) data for the topographic data. When A/Ac > 0.95, we add the height H to the DEM to produce a DSM. Hence, the porous-type model is not applied to the cell meshes using DSM and is built by adding the porous medium to Landuse-n/Topography.
4. Differences between Conventional Porous-Type Models and the Proposed Model
Focusing on the geometric effects, the differences between the conventional porous-type models and the proposed PBM in terms of the and parameters defined in the previous section resulting from the kinematic boundary conditions of Equations (4) and (5) are clarified.
When , the proposed model corresponds to the coastal-forest model introduced by Matsutomi et al. [31], which considers the height of the porous medium. Meanwhile, the PBM is equivalent to the flood model proposed by Miura et al. [34] and MLIT [35], wherein the porosity and the surface permeability are expressed using the following formula:
where l and m are the mesh numbers in the x- and y- directions, respectively.
In the derivation process of the flood model, the unit volume element is a homogeneous porous medium, and thus, in Equations (1), (2), (4) and (5), the porosity and the surface permeability are not distinguishable, namely, γ = γV = γi. The surface permeability in the flood model is defined by using the value of porosity as shown in Equations (23) or (24), and building height is not considered, as shown in Equation (22). However, since the proposed PBM is based on adequate boundary conditions considering both the porosity and the surface permeability [54], the PBM can more accurately reflect the geometric effects of urban areas on the tsunami inundation simulations.
5. Numerical Simulations of Tsunami Inundation in Onagawa, Miyagi Prefecture, during the Great East Japan Earthquake
5.1. Background of the Target Domain
The town of Onagawa, Miyagi Prefecture, Japan (shown in Figure 3), was one of the affected areas that suffered tremendous damage during the tsunami generated by the 2011 Great East Japan Earthquake, where the maximum inundation height and run-up height were 18.5 m and 34.7 m, respectively [40,41]. Many houses and buildings in the inundation area were washed away. Six concrete structures were damaged (i.e., toppled and destroyed) [24,42,43,45]. Furthermore, the breakwater in the mouth of Onagawa Bay was greatly damaged, and the seabed around the opening was eroded by as much as 9 m [44]. This characteristic damage constituted enormous devastation. For these reasons, the tsunami hazards and damages in Onagawa have been investigated by many researchers, and thus, substantial amounts of data and knowledge have been accumulated to date. For example, time series of the flow depths and flow velocities in urban areas were obtained from an analysis of video images by Koshimura et al. [45], where the maximum flow depth and velocity in their analysis were approximately 15 m and 7.5 m/s, respectively. The tsunami hazards and disaster mechanisms in Onagawa have been investigated through three-dimensional, super-high-resolution simulations [5,6,9] and through two-dimensional simulations with the Landuse-n and Equivalent-n models [23,24]. In this study, the characteristics of inundation in an urban area simulated using various two-dimensional models are examined, and points of concern are also extracted from each model.
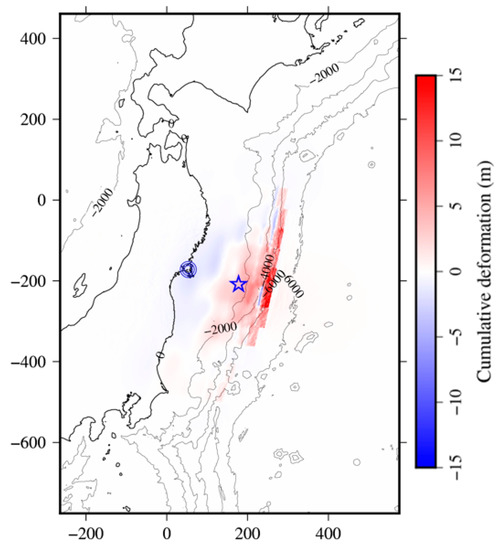
Figure 3.
Accumulation of crustal deformation in the tsunami source model proposed by Satake et al. [24], where the circle indicates the location of Onagawa, Miyagi Prefecture, Japan, and the star is the epicenter of the earthquake. The units of distance are km.
5.2. Initial Setup of the Tsunami Simulation
The 2011 tsunami is simulated using a nesting grid system consisting of six layers with mesh sizes of 1215 m, 405 m, 135 m, 45 m, 15 m and 5 m, as shown in Figure 4 and Figure 5. The influxes in the boundary of the smaller region are set to the linearly incorporated values from the larger region. The initial tide level is −0.42 m, and the tsunami for three hours after the earthquake is reproduced using the tsunami source model proposed by Satake et al. [56] as shown in Figure 3, including the spatial variability in the fault slip and time of rupture. The advantage to apply the tsunami source model is to be able to compare the numerical result by the proposed PBM with the three-dimensional, super-high-resolution simulations with same source [5,6,9]. The area of focus is the town of Onagawa with Δx = 5 m, as shown in Figure 5a. We compare two roughness-type models (Landuse-n and Landuse-n/Topography) and three porous-type models (the coastal-forest, the flood models using Equation (24) [34,35] in Section 4 and PBM). Manning’s roughness coefficients corresponding to the land use conditions presented by Kotani et al. [27], which are water bodies, buildings/houses and paved surfaces, are similarly applied to each of the five models. In the four models other than Landuse-n, the DSM defined in Section 3.2 is used as the topographic data. The DSM employed in this study is shown in Figure 5a,b, where the black colors indicate the locations where building heights are incorporated into the DEM. Figure 6 shows the distribution of the occupancy area ratio A/Ac, which is used in the porous-type models (i.e., the coastal-forest, the flood models and PBM).
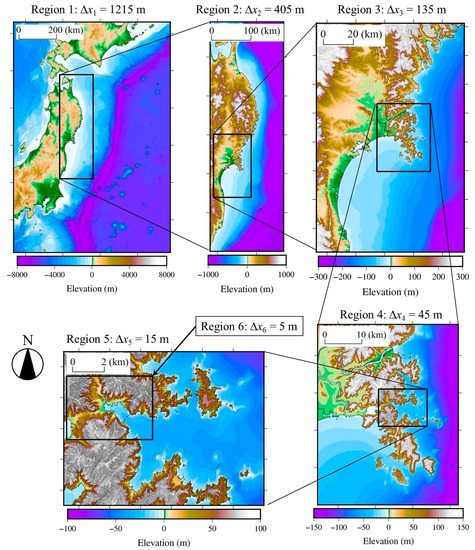
Figure 4.
Nesting grid system in the simulations (region 1–region 6).
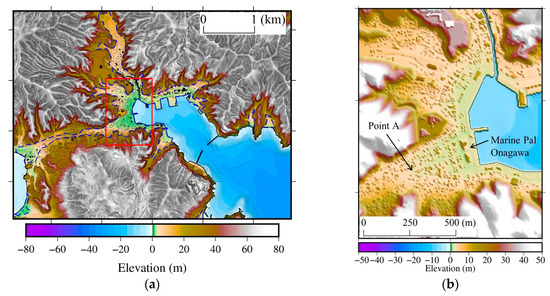
Figure 5.
Topography in Onagawa, Miyagi Prefecture, Japan (Region 6: Δx6 = 5 m). (a) The blue line is the inundation area measured by Haraguchi and Iwamatsu [57], and the black colors are the locations where the building height data are incorporated into the topographic data, i.e., it indicates A/Ac > 0.95 in Equation (18). (b) The ground elevation around Marine Pal Onagawa, which is the region in the red box shown in Figure 5a.
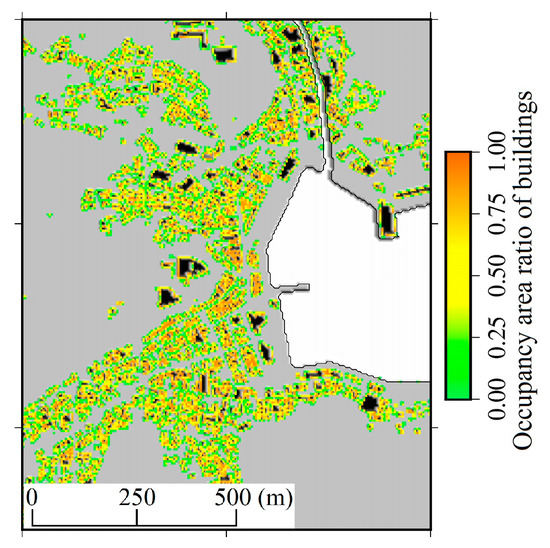
Figure 6.
The occupancy area ratio of buildings around Marine Pal Onagawa in Figure 5b. The black colors indicate the locations where building height data are incorporated into the topographic data, i.e., it indicates A/Ac > 0.95 in Equation (18).
The buildings/houses and the breakwater in the bay are assumed to be intact; thus, the roughness coefficients and the parameters of the unit volume element in the porous medium, namely, A, H, L and H′, are temporally constant values. As previously mentioned, the drag force terms are not included within the five models to focus on the geometric effect. Furthermore, we perform the simulation with a fixed bed, although it has been noted that morphological changes due to tsunami-induced sediment transport can affect tsunami hazards [50,51,52,53].
5.3. Results and Discussions
Figure 7a,b show the maximum water level obtained by Landuse-n and the proposed PBM, respectively, where the green lines are the field survey result for the inundation area by Haraguchi and Iwamatsu [57]. During the tsunami, the building destruction could lead to change the flow path area and inundation volume, while the generation of rubble might affect the drag force and the apparent viscosity in the multiphase flow. Furthermore, destruction of the breakwater and morphological change also occurred. However, despite the fact that the proposed PBM does not consider the destruction of buildings etc., the inundation area within the present model is relatively similar to the results of the field survey. These results imply that the inundation area was strongly limited by the steep slope behind the urban area and the large flow depth which is much greater than the building height rather than these uncertainties. Therefore, Figure 7 supports that notion that the numerical method and conditions including the tsunami source model are available to the tsunami inundation simulation in this area.
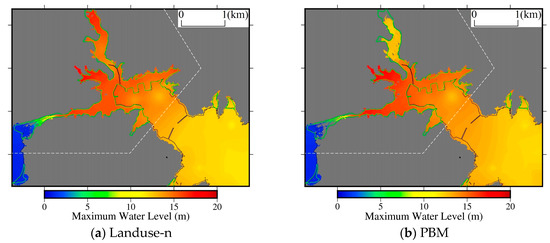
Figure 7.
Maximum water level obtained by the proposed PBM, where the green line is the field survey result for the inundation area [57].
Table 2 shows the inundation areas and the ratios to that using Landuse-n, where the target region is in the northwest range of the breakwater in the mouth of Onagawa Bay and is indicated by the dashed white lines as shown in Figure 7. The area using Landuse-n, which is one of the most practical methods, is applied as the reference value to compare between the models. The ratios for the field survey, Landuse-n, Landuse-n/Topography, the coastal-forest model, the flood model and PBM are 0.98, 1.00, 0.93, 0.95, 0.88 and 0.93, respectively. The numerical results except Landuse-n underestimate the field survey result within less than 10%, which probably is a consequence of the uncertainties mentioned above. For example, according to Adriano et al. [23], it is implied that their numerical results of inundation height and area might become closer to the field survey results by taking account of the destruction of the breakwater, which is one of uncertainties. Therefore, the differences between the ratios do not directly explain the accuracy of the modeling methods for the building effect. The improvements by considering uncertainties are the challenges in the future work.

Table 2.
Inundation area and maximum flow velocities in Onagawa town as shown in Figure 5a (field survey [57]; Landuse-n: roughness map model; Landuse-n/Topography: roughness map and topographic model; Coastal-forest: coastal forest model; Flood: flood model; PBM: proposed model based on porous body model).
The inundation area acquired by Landuse-n is the largest among the five numerical models, and the model reveals the most dangerous tsunami hazards in terms of the inundation area. In addition, although the features of the porous medium are added to Landuse-n/Topography in the coastal-forest model, the flood model and PBM, the inundation area represented by the coastal-forest model is larger than that obtained using Landuse-n/Topography. The porosity can increase the water level and the potential energy. Meanwhile, the surface permeability limits the flow and decreases the inundation volume. For these reasons, the coastal-forest model including the porosity but excluding the surface permeability might reproduce larger inundation areas than both Landuse-n/Topography and the other porous-type models.
Figure 8 shows the differences in the maximum water level between the porous-type models and Landuse-n/Topography. In urban areas, the flow depths calculated using the coastal-forest model are larger because of the effects of the porosity. The results using the PBM are similar to those in Landuse-n/Topography since the effects of the porosity and the surface permeability are moderately balanced. When using the flood model, since the porosity and surface permeability are vertically constant, the inundation volume within the urban area is greatly restricted, resulting in a decrease in the inundation height and an increase in the water level over the sea due to the reflection of the tsunami from the urban area.
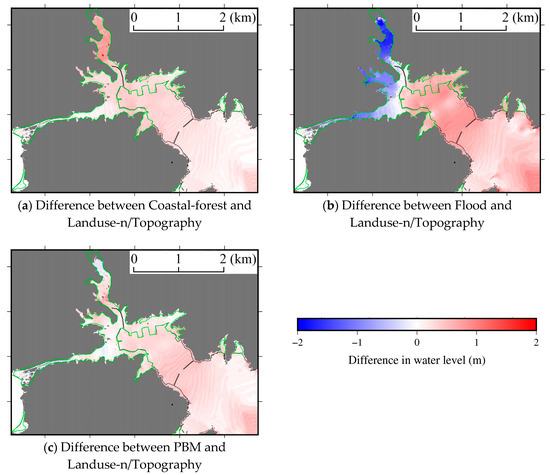
Figure 8.
Difference in the maximum water level between the porous-type models (Coastal-forest: coastal-forest model, Flood: flood model, PBM: proposed model based on the porous body model) and Landuse-n/Topography, where the green lines are the field survey result for the inundation area [57].
Figure 9 shows the distributions of the maximum flow velocity obtained by the five models; those simulated using the porous-type models (i.e., the coastal-forest model, the flood model and PBM) describe the Darcy velocity. In the porous-type models, the flow velocities between the buildings become large, thereby forming a reticulated high-flow velocity field. The differences in the maximum flow velocity between the porous-type models and Landuse-n/Topography are shown in Figure 10. The flow velocities calculated by the coastal-forest model in urban areas are smaller than those calculated using Landuse-n/Topography because of the increased flow depth with larger flow paths. Meanwhile, the flow velocities obtained using the flood model are relatively small due to the decreased inundation volume. Furthermore, the flow velocities from the PBM are locally larger than those from the other models. As shown in Table 2, the mean value of 100 % maximum velocity from Landuse-n is the largest among the five models. However, the values for the PBM in the 10% and 30% conditions are larger than those for the Landuse-n model as well as the other model, and it shows that the locally change in the velocity using the PBM is large. In the flood model, the inundation is restricted even if the flow depth is larger than building height as shown in Equations (22) and (24). For this reason, inundation volume is decreased, resulting in the decay of flow velocity across a wide area. Meanwhile, since both the flow path and the building height are considered in the present model, the local increase in flow velocity is simulated.
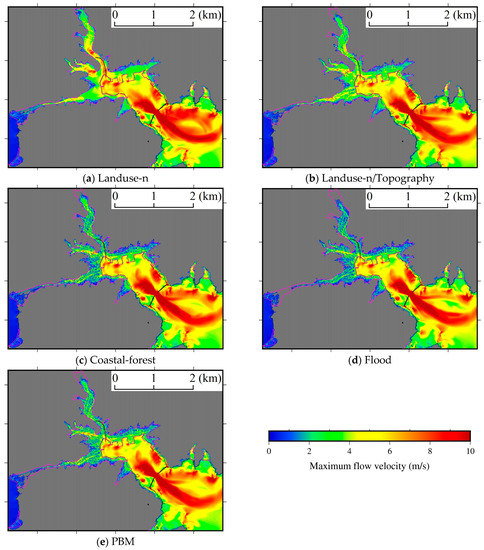
Figure 9.
Maximum flow velocities obtained using the (a) Landuse-n: roughness map model, (b) Landuse-n/Topography: roughness map and topographic model, (c) Coastal-forest: coastal forest model, (d) Flood: flood model, and (e) PBM: proposed model based on the porous body model, where the porous-type models (i.e., the coastal-forest model, the flood model and PBM) describe the Darcy velocity and the pink lines are the field survey result for the inundation area [57].
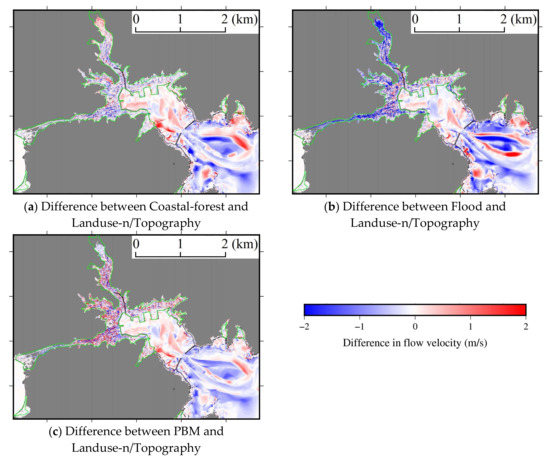
Figure 10.
Difference in the maximum flow velocity between the porous-type models (i.e., the coastal-forest model, the flood model and PBM) and Landuse-n/Topography, where the green lines are the field survey result for the inundation area [57].
Next, we examine the characteristics of the inundation processes calculated by the various models. Figure 11 shows the time series of the flow depth at the point near Marine Pal Onagawa shown in Figure 5b. The video analysis data were obtained by Koshimura et al. [45]. The three-dimensional calculation results using a volume of fluid (VOF) method with a 1-m resolution obtained by Arikawa and Tomita [5,6] are labeled “VOF (1 m, TT)” and “VOF (1 m, FS8)”, respectively. The tsunami sources are applied the models proposed by Takagawa & Tomita [58] and Satake et al. [56], which are hereafter called “TT” and “FS8” (Fujii and Satake model version 8.0), respectively. The “SPH (2 m, FS8)” calculated results were obtained by Suwa et al. [9] using SPH method with a 2-m resolution from the FS8 tsunami source model. The “Landuse-n/Topography (5 m, COGJ)” and “Equivalent-n (5 m, COGJ)” calculated results were acquired by Adriano et al. [23] using TUNAMI-N2 by employing the Landuse-n/Topography and Equivalent-n models for 5-m resolution, respectively, with the tsunami source model proposed by the Cabinet Office, Government of Japan [59], which is hereafter called the “COGJ” model.
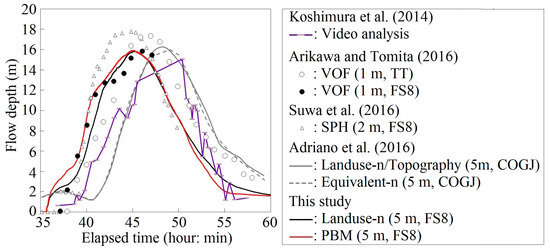
Figure 11.
Time series of the flow depth at the point near Marine Pal Onagawa shown in Figure 5b.
Comparing the results simulated by this study with those from three-dimensional simulations (the VOF and SPH) by using the FS8 tsunami source model, the results from the PBM agree well with the 3-D results obtained by Arikawa and Tomita [5,6]. It implies that the two-dimensional simulations demonstrate good accuracies for the inundation heights around buildings near the coastline. On the other hand, the maximum water level calculated by Suwa et al. [9] is larger than in the other models (i.e., the VOF, Landuse-n and PBM). As noted in their study, the reflections along boundaries, which connects the SPH method with the two-dimensional calculations, and the artificial viscosity term might result in an excessive increase in the water level.
However, the results from the PBM are different from the observation in term with the phase of the tsunami. It appears to be result of the applied tsunami source model. The accuracies of the numerical models shown in Figure 11 cannot be compared unconditionally with one another because the applied tsunami source models are different. The phases of the COGJ and TT tsunami source models are relatively similar to the video analysis results, whereas those of the FS8 model are relatively early. Meanwhile, the collapsed breakwater and the erosion of the seabed affect the phase of the tsunami in this area, and these damages could have accelerated the arrival time of the tsunami. For the tsunami in Onagawa town, the COGJ and TT models are more adequate than the FS8 model in terms of the phase of the tsunami, which also depends on these damage processes.
Comparing the two results obtained by this study or those reported by Adriano et al. [23], the differences in the modeled building effects do not significantly affect the maximum water level near the coastline. In fact, as far as we can compare the five sets of calculated results in this study (two from Landuse-n, Landuse-n/Topography, the coastal-forest model, the flood model and PBM are shown in Figure 11), the differences in the maximum water level at the point near Marine Pal Onagawa are less than 0.5 m. These results imply that differences in the modeling of buildings has a limited effect on the maximum water level near the coastline, which may be related to the topography, i.e., the aforementioned steep slope behind the urban area, and the vicinity of the observation point to the coastline. Namely, since the tsunami is blocked by the steep slope, which results in an increase in the water level, the flow at the maximum water level is relatively weak. Thus, an increase in the water level due to run-up with strong flow around a building, which results from the geometric effect, is unlikely at this location during the period with the maximum water level. In addition, in the case of a similar tsunami scenario wherein the city area is completely submerged, the water level around the coastline during the stagnation period of the flow strongly depends on the exterior scale of the tsunami, and thus, the building conditions within the city area hardly influence the maximum water level at the observation point. However, the differences in the modeled building effects might become substantial when, in contrast to a region with a steep slope, a progressive tsunami over a plain area is simulated, where the flow speed of a tsunami could become large when the water level is high. In fact, comparing the results using the PBM with those from Landuse-n in this study for the period of run-up before the water level reaches its maximum value (35 min–45 min), the water level in the PBM is higher than that in Landuse-n, which does not consider the geometric effect; therefore, this result is reasonable. Meanwhile, comparing the results from Landuse-n/Topography with those from Equivalent-n acquired by Adriano et al. [23] for the corresponding period, the mechanical effects modeled by Equivalent-n serve as geometric effects similar to found in Landuse-n/Topography. However, Muhari et al. [19] clarified that the flow depth and velocity calculated by Equivalent-n is locally smaller than that calculated by Landuse-n/Topography because these localities are gradually strengthened inside an urban area where buildings are lined up. Namely, the locality of tsunami hazards could become stronger (like an internal area of an urban setting).
Focusing on the inside area of urban setting, the characteristics of locally tsunami hazards from each model are examined. Figure 12a,b show snapshots of the water level calculated by the Landuse-n model and the PBM, respectively. The gradient of the water surface simulated using the PBM in the direction normal to the shoreline is larger than that obtained by Landuse-n because of the geometric effect on the interception of the tsunami. This indicates that larger pressure gradients will lead to an amplification of the flow velocity. As a result, a high-speed flow between the buildings will occur, especially to the west of Marine Pal Onagawa, where a large flow velocity is generated along the straight road, as shown in Figure 13.
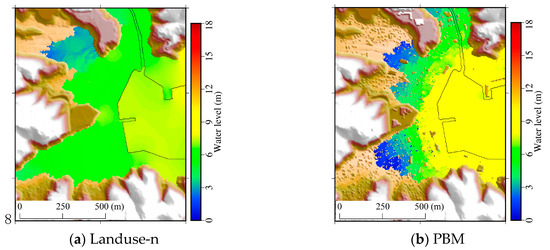
Figure 12.
Water level at 2400 s after the earthquake: (a) Landuse-n (roughness map model); (b) the proposed PBM based on the porous body model.
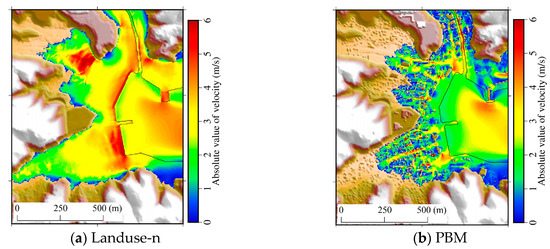
Figure 13.
Flow velocity at 2400 s after the earthquake: (a) Landuse-n (roughness map model); (b) the proposed PBM based on the porous body model, where the pore velocity is described.
Figure 14a shows the time series of the inundation height and the absolute value of the flow velocity at Point A shown in Figure 5b. Due to the geometric effects of the buildings in the Landuse-n/Topography model, the coastal-forest model, the flood model and PBM, the arrival times of the tsunami in those models are delayed coincident with a gradual rise in the water level (approximately 2300 s), after which the water levels are elevated suddenly (after 2400 s), leading to high flow velocities, especially in the flood model and the PBM (Figure 14b). However, the run-up speed calculated by the coastal-forest model is larger than that calculated by the Landuse-n/Topography model because the increase in the water level due to the porosity makes it easier for the tsunami to spread out over the land.
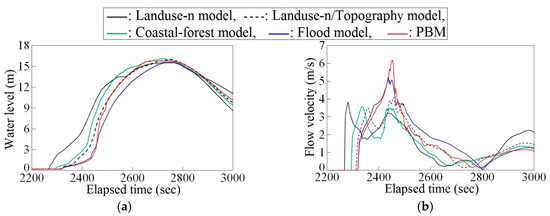
Figure 14.
Time series of the inundation height and flow velocity at Point A in Figure 5b: (a) inundation height; (b) flow velocity, where the pore velocity is described (Landuse-n: roughness map model; Landuse-n/Topography: roughness map and topographic model; Coastal-forest: coastal forest model; Flood: flood model; PBM: proposed model based on porous body model).
In the flood model, the surface permeability is expressed as the mean value of two porosities, as shown in Equation (24). Thus, in the case when D < H, the surface permeability in the flood model tends to be larger than in the PBM over the straight road, where the porosity spatially changes discontinuously. A large surface permeability value means that a tsunami over the road will tend to disperse. As a consequence, the flood model also exhibits smaller flow velocities than the PBM over the road. Namely, since the PBM considers the geometric effects of buildings in detail, the PBM will restrict the progress of the tsunami according the building distribution and reproduce an adequate flow field concentrating along the straight road.
According to the above results, the calculated tsunami hazards show that the results are reasonable and commensurate with the degree of the geometric effects introduced in the models. Therefore, consideration of the geometric effect demands evaluating the tsunami hazards with respect to the locality. The porosity is important for avoiding an underestimation of not only the inundation height but also the inundation area (based on the comparison of the Landuse-n model to the coastal-forest model, which adds porosity to the Landuse-n model), and the surface permeability plays an important role in representing the local high flow velocity. We must investigate the validity of the modeling and the applicability to fields including various uncertainties through comparisons to an ideal experiment or theory in the future.
6. Conclusions and Recommendations
To evaluate tsunami hazards with strong locality in urban areas, NSWW equations based on the porous body model were derived, and a two-dimensional horizontal tsunami inundation analysis model was developed. The proposed PBM introduces an adequate kinematic boundary condition that includes both porosity and surface permeability of the porous body model within the derivation process. Meanwhile, geometric effects such as the flow anisotropy and building heights of groups of buildings, which present a challenge in conventional models, were incorporated into the numerical model more accurately. The proposed numerical model was applied to a simulation of the tsunami inundation in the town of Onagawa, Miyagi Prefecture, Japan, during the 2011 Great East Japan Earthquake, and the characteristics of the tsunami hazards calculated by various numerical models were investigated. Our results suggest the following conclusions.
- The proposed PBM exhibited as good accuracy for the inundation heights around building near the coastline as with conventional three-dimensional simulation with high resolution.
- In the case where the inundation area is restricted by the topography with a steep slope behind the urban area and the flow depth is much greater than the building height, the differences in the modeled building effects and computational resolution do not significantly affect the maximum water level near the coastline. Therefore, two-dimensional simulations with a practical resolution demonstrate good accuracy while estimating the inundation height near the coastline, although we must examine the applicability of these models to regions where the locality can become stronger in future work.
- A model that includes porosity can yield an increase in the water level, which makes it easier for the tsunami to spread out over the land, thereby decreasing the flow velocity.
- A model that includes the surface permeability restricts the progress of the tsunami according to the distribution of the buildings and reproduces a flow field concentrated along the straight road.
- By properly incorporating the porosity and the surface permeability into the theory and the numerical model, the model can adequately reproduce high flow velocities due to the increase in the gradient of the water surface and the concentration of the flow during the inundation process within the urban area. In addition, the water level at the time will increase due to the flow and geometric effects. Therefore, a numerical model that does not consider geometric effects could underestimate the local hydrodynamic force.
The proposed PBM showed its capability to reproduce the tsunami’s essential behaviors in urban areas. It can be expected that the present model can become a useful tool to accurately evaluate the tsunami risks in urban areas. In future works, we will investigate the accuracy of the proposed model using the drag force term and its applicability in the field.
Acknowledgments
We thank Daisuke Sugawara (Museum of Natural and Environmental History, Shizuoka) for his help in developing the bathymetry and topography data. This research was funded by Tokyo Marine & Nichido Fire Insurance Co., Ltd. and through collaborative research grants at the International Research Institute of Disaster Science (IRIDeS), Tohoku University, for “Investigation of a region-customized tsunami analysis platform for tsunami resilient disaster prevention” and “Improvement of an integrated tsunami model”.
Author Contributions
Kei Yamashita developed the proposed model. He also analyzed the data and wrote the paper. Anawat Suppasri gave advises on the overall structure and discussions, Yusuke Oishi gave detailed discussions on the analysis and Fumihiko Imamura provided overall discussions and advices for improving the model and the paper.
Conflicts of Interest
The authors declare no conflict of interest.
References
- Nakamura, Y.; Kato, S. Testimony of the 3.11 Disaster—The Tsunami in Tagajo City. Kahoku-Shinpo, 13 May 2011; A106X0, K20110513A106X0050. (In Japanese) [Google Scholar]
- Oshiba, K. Tsunami that I Saw—A Sense of Despair Resulted from Heavy, Fast and Irresistible Tsunami. Kahoku-Shinpo, 15 June 2011; M206X0, K20110615M206X0020. (In Japanese) [Google Scholar]
- Rueben, M.; Holman, R.; Cox, D.; Shin, S.; Killian, J.; Stanley, J. Optical measurements of tsunami inundation through an urban waterfront modeled in a large-scale laboratory basin. Coast. Eng. 2011, 58, 229–238. [Google Scholar] [CrossRef]
- Suppasri, A.; Latcharote, P.; Bricker, J.D.; Leelawat, N.; Hayashi, A.; Yamashita, K.; Makinoshima, F.; Roeber, V.; Imamura, F. Improvement of tsunami countermeasures based on lessons from the 2011 Great East Japan earthquake and tsunami—Situation after five years. Coast. Eng. J. 2016, 58. [Google Scholar] [CrossRef]
- Arikawa, T.; Tomita, T. Development of High Resolution Tsunami Runup Calculation Method Based on a Multi Scale Simulation; Report of the Port and Airport Research Institute; Port and Airport Research Institute: Yokosuka, Japan, 2014; Volume 53, pp. 3–18, (In Japanese with English abstract).
- Arikawa, T.; Tomita, T. Development of high precision tsunami runup calculation method based on a hierarchical simulation. J. Disaster Res. 2016, 11, 639–646. [Google Scholar] [CrossRef]
- Tomita, T.; Kakinuma, T. Storm Surge and Tsunami Simulator in Oceans and Coastal Areas (STOC); Report of the Port and Airport Research Institute; Port and Airport Research Institute: Yokosuka, Japan, 2005; Volume 44, pp. 83–98, (In Japanese with English abstract).
- Arikawa, T.; Yamada, F.; Akiyama, M. Study of applicability of tsunami wave force in a three-dimensional numerical wave flume. Proc. Coast. Eng. JSCE 2005, 52, 46–50. [Google Scholar]
- Suwa, T.; Kazama, M.; Imamura, F.; Sugawara, D.; Yamashita, K. Resolution Dependency of Tsunami Simulation by an SPH Method; Proceedings of the Conference on Computational Engineering and Science; Japan Society for Computational Engineering and Science: Tokyo, Japan, 2016; Volume 21, (In Japanese with English abstract). [Google Scholar]
- Imamura, F.; Yalciner, A.; Ozyurt, G. Tsunami Modelling Manual; UNESCO Tsunami Modelling Course (UNESCO); UNESCO: Paris, France, 2006. [Google Scholar]
- UNESCO/IOC. IUGG/IOC Time Project: Numerical Method of Tsunami Simulation with the Leap-Frog Scheme; Manuals and Guides No. 30; UNESCO: Paris, France, 1997. [Google Scholar]
- Titov, V.V.; Gonzalez, F.I. Implementation and Testing of the Method of Splitting Tsunami (MOST) Model; NOAA Technical Memorandum ERL PMEL-112; NOAA: Silver Spring, MD, USA, 1997; 11p.
- Liu, P.L.F.; Cho, Y.S.; Yoon, S.B.; Seo, S.N. Numerical Simulations of the 1960 Chilean Tsunami Propagation and Inundation at Hilo, Hawaii, in Recent Developments in Tsunami Research; El-Sabh, M.I., Ed.; Kluwer Academic Publishers: Dordrecht, The Netherlands, 1994; pp. 99–115. [Google Scholar]
- Liu, P.L.F.; Cho, Y.S.; Briggs, M.J.; Synolakis, C.E.; Kanoglu, U. Run-up of solitary waves on a circular island. J. Fluid Mech. 1995, 302, 259–285. [Google Scholar] [CrossRef]
- Yalciner, A.C.; Pelinovsky, E.; Zaytsev, A.; Kurkin, A.; Ozer, C.; Karakus, H. NAMI DANCE Manual; Ocean Engineering Research Center, Civil Engineering Department, Middle East Technical University: Ankara, Turkey, 2006. [Google Scholar]
- Harig, S.; Chaeroni, C.; Behrens, J.; Schroeter, J. Tsunami Simulations with unstructured grids (TsunAWI) and a comparison to simulations with nested grids (Tsunami-N3). In Proceedings of the 6th International Workshop on Unstructured Mesh Numerical Modeling of Coastal, Shelf and Ocean Flows, London, UK, 19–21 September 2007. [Google Scholar]
- Nielsen, O.; Roberts, S.; Gray, D.; McPherson, A.; Hitchman, A. Hydrodynamic modeling of coastal Inundation. In Proceedings of the MODSIM 2005 International Congress on Modeling and Simulation, Melbourne, Australia, 12–15 December 2005; Zerger, A., Argent, R.M., Eds.; Modeling and Simulation Society of Australia and New Zealand: Melbourne, Australia, 2005; pp. 518–523. [Google Scholar]
- Taubenböck, H.; Goeseberg, N.; Setiadi, N.; Lämmel, G.; Moder, F.; Oczipka, M.; Klüpfel, H.; Wahl, R.; Schlurmann, T.; Strunz, G.; et al. “LastMile” preparation for a potential disaster—Interdisciplinary approach towards tsunami early warning and an evacuation information system for the coastal city of Padang, Indonesia. Nat. Hazards Earth Syst. Sci. 2009, 9, 1509–1528. [Google Scholar] [CrossRef]
- Muhari, A.; Imamura, F.; Koshimura, S.; Post, J. Examination of three practical run-up models for assessing tsunami impact on highly populated areas. Nat. Hazards Earth Syst. Sci. 2011, 11, 3107–3123. [Google Scholar] [CrossRef]
- Taubenböck, H.; Goeseberg, N.; Lämmel, G.; Setiadi, N.; Schlurmann, T.; Nagel, K.; Siegert, F.; Birkmann, J.; Traub, K.P.; Dech, S.; et al. Risk reduction at the “Last-Mile”: An attempt to turn science into action by the example of Padang, Indonesia. Nat. Hazards 2013, 65, 915–945. [Google Scholar] [CrossRef]
- Oishi, Y.; Imamura, F.; Sugawara, D. Near-field tsunami inundation forecast using the parallel TUNAMI-N2 model: Application to the 2011 Tohoku-Oki earthquake combined with source inversions. Geophys. Res. Lett. 2015, 42, 1083–1091. [Google Scholar] [CrossRef]
- Oishi, Y.; Imamura, F.; Sugawara, D.; Furumura, T. Investigation of reliable tsunami inundation model in urban areas using a supercomputer. J. Jpn. Soc. Civ. Eng. Ser. B2 (Coast. Eng.) 2016, 72, I_409–I_414, (In Japanese with English abstract). [Google Scholar] [CrossRef]
- Adriano, B.; Hayashi, S.; Gokon, H.; Mas, E.; Koshimura, S. Understanding the extreme tsunami inundation in Onagawa town by the 2011 Tohoku earthquake, its effects in urban structures and coastal facilities. Coast. Eng. J. 2016, 58. [Google Scholar] [CrossRef]
- Latcharote, P.; Suppasri, A.; Yamashita, A.; Adriano, B.; Koshimura, S.; Kai, Y.; Imamura, F. Possible failure mechanism of buildings overturned during the 2011 Great East Japan Tsunami in the Town of Onagawa. Front. Built Environ. 2017, 3, 1–18. [Google Scholar] [CrossRef]
- Imamura, F.; Suppasri, A.; Sato, S.; Yamashita, K. The role of tsunami engineering in building resilient communities and issues be improved after the GEJE. In The 2011 Japan Earthquake and Tsunami: Reconstruction and Restoration; Springer: New York, USA, 2018; pp. 435–448. [Google Scholar]
- Tsudaka, R.; Shigihara, Y.; Fujima, K. Verification of tsunami inundation simulation on basic experiments. J. Jpn. Soc. Civ. Eng. Ser. B1 (Hydraul. Eng.) 2012, 68, I_1537–I_1542, (In Japanese with English abstract). [Google Scholar] [CrossRef]
- Kotani, M.; Imamura, F.; Shuto, N. Tsunami run-up simulation and damage estimation by using geographical information system. Proc. Coast. Eng. JSCE 1998, 45, 356–360. (In Japanese) [Google Scholar]
- Aburaya, T.; Imamura, F. Proposal of a tsunami run-up simulation using combined equivalent roughness. Proc. Coast. Eng. JSCE 2002, 49, 276–280. (In Japanese) [Google Scholar]
- Imai, K.; Imamura, F.; Iwama, S. Advanced tsunami computation for urban regions. J. Jpn. Soc. Civ. Eng. Ser. B2 (Coast. Eng.) 2013, 69, I_311–I_315, (In Japanese with English abstract). [Google Scholar] [CrossRef]
- Baba, T.; Takahashi, N.; Kaneda, Y.; Inazawa, Y.; Kikkojin, M. Tsunami inundation modeling of the 2011 Tohoku Earthquake using three-dimensional building data for Sendai, Miyagi Prefecture, Japan. Tsunami Events and Lessons Learned. Adv. Nat. Technol. Hazards Res. 2014, 35, 89–98. [Google Scholar]
- Matsutomi, H.; Onuma, K.; Imai, K. Basic equations for a flow in a vegetated area and a similarity law for a trunk. Proc. Coast. Eng. JSCE 2004, 51, 301–305. (In Japanese) [Google Scholar]
- Guinot, V.; Soares-Frazão, S. Flux and source term discretization in two dimensional shallow water models with porosity on unstructured grids. Int. J. Numer. Methods Fluids 2006, 50, 309–345. [Google Scholar] [CrossRef]
- Sanders, B.F.; Schubert, J.E.; Gallegos, H.A. Integral formulation of shallow water equations with anisotropic porosity for urban flood modeling. J. Hydrol. 2008, 362, 19–38. [Google Scholar] [CrossRef]
- Miura, S.; Kawamura, I.; Kimura, I.; Miura, A. Study on inundation flow analysis method in densely populated urban area on alluvial fan. J. Jpn. Soc. Civ. Eng. Ser. B1 (Hydraul. Eng.) 2011, 67, I_979–I_984, (In Japanese with English abstract). [Google Scholar] [CrossRef]
- Ministry of Land, Infrastructure, Transport and Tourism, 2015. Available online: https://www.mlit.go.jp/river/shishin_guideline/pdf/manual_kouzuishinsui_1507.pdf (accessed on 4 February 2016). (In Japanese)
- Kim, B.; Sanders, B.F.; Schubert, J.E.; Famiglietti, J.S. Mesh type tradeoffs in 2D hydrodynamic modeling of flooding with a Godunov-based flow solver. Adv. Water Resour. 2014, 68, 42–61. [Google Scholar] [CrossRef]
- Kim, B.; Sanders, B.F.; Famiglietti, J.S.; Guinot, V. Urban flood modeling with porous shallow-water equations: A case study of model errors in the presence of anisotropic porosity. J. Hydrol. 2015, 523, 680–692. [Google Scholar] [CrossRef]
- Sha, W.T.; Domanus, H.M.; Schmitt, R.C.; Oras, J.J.; Lin, E.I.H. COMMIX-1: A Three Dimensional Transient Single-Phase Component Computer Program for Thermal-Hydraulic Analysis; NUREG/CR-0785, ANL-77-96; Argonne National Laboratory: Lemont, IL, USA, 1978. [Google Scholar]
- Sakakiyama, T.; Kajima, R. Numerical simulation of nonlinear wave interacting with permeable breakwater. In Proceedings of the 23rd International Conference on Coastal Engineering, Venice, Italy, 4–9 October 1992; pp. 1517–1530. [Google Scholar]
- The 2011 Tohoku Earthquake Tsunami Joint Survey Group. Nationwide field survey of the 2011 off the Pacific coast of Tohoku earthquake tsunami. J. Jpn. Soc. Civ. Eng. Ser. B2 (Coast. Eng.) 2011, 67, 63–66. [Google Scholar]
- Mori, N.; Takahashi, T.; Takahashi, T. The 2011 Tohoku Earthquake Tsunami Joint Survey Group. Nationwide post event survey and analysis of the 2011 Tohoku earthquake tsunami. Coast. Eng. J. 2012, 54. [Google Scholar] [CrossRef]
- Mikami, T.; Shibayama, T.; Esteban, M. Field survey of the 2011 Tohoku earthquake and tsunami in Miyagi and Fukushima prefectures. Coast. Eng. J. 2012, 54, 54. [Google Scholar] [CrossRef]
- Suppasri, A.; Koshimura, S.; Imai, K.; Mas, E.; Gokon, H.; Muhari, A.; Imamura, F. Damage characteristic and field survey of the 2011 Great East Japan tsunami in Miyagi prefecture. Coast. Eng. J. 2012, 54. [Google Scholar] [CrossRef]
- Yagi, H.; Suginami, K.; Nakayama, A.; Nishi, T.; Okuno, M.; Koike, T.; Hayashi, K.; Igarashi, Y. A study of damage mechanism on port facilities at Onagawa Fishery port due to Tohoku Earthquake Tsunami. J. Jpn. Soc. Civ. Eng. Ser. B2 (Coast. Eng.) 2012, 68, I_1346–I_1350, (In Japanese with English abstract). [Google Scholar] [CrossRef]
- Koshimura, S.; Hayashi, S.; Gokon, H. The impact of the 2011 Tohoku earthquake tsunami disaster and implications to the reconstruction. Soils Found. 2014, 54, 560–572. [Google Scholar] [CrossRef]
- Hayashi, S.; Adriano, B.; Mas, E.; Koshimura, S. Improving tsunami numerical simulation with the time-dependent building destruction model. J. Jpn. Soc. Civ. Eng. Ser. B2 (Coast. Eng.) 2014, 70, I_346–I_350, (In Japanese with English abstract). [Google Scholar] [CrossRef]
- Kozono, Y.; Takahashi, T.; Sakuraba, M.; Nojima, K. Application of tsunami numerical model considering collapsed buildings and disaster debris for the Nankai Trough. J. Jpn. Soc. Civ. Eng. Ser. B2 (Coast. Eng.) 2017, 73, I_403–I_408, (In Japanese with English abstract). [Google Scholar] [CrossRef]
- Tajima, Y.; Kirigaya, N.; Sakurazawa, T. Impact of fluid-debris interactions on nearshore inundation characteristics. J. Jpn. Soc. Civ. Eng. Ser. B3 (Ocean Eng.) 2016, 72, I_205–I_210, (In Japanese with English abstract). [Google Scholar] [CrossRef]
- Sakurazawa, T.; Tajima, Y. Experimental study on horizontal movement of numerous wreckage under the inundating flow. J. Jpn. Soc. Civ. Eng. Ser. B2 (Coast. Eng.) 2016, 72, I_1153–I_1158, (In Japanese with English abstract). [Google Scholar] [CrossRef]
- Sugawara, D.; Yamashita, K.; Takahashi, T.; Imamura, F. Role of sediment transport model to improve the tsunami numerical simulation. In Proceedings of the AGU 2015 Fall Meeting, San Francisco, CA, USA, 14–18 December 2015. [Google Scholar]
- Yamashita, K.; Sugawara, D.; Takahashi, T.; Imamura, F.; Saito, Y.; Imato, Y.; Kai, T.; Uehara, H.; Kato, T.; Nakata, K.; et al. Numerical simulations of large-scale sediment transport caused by the 2011 Tohoku Earthquake Tsunami in Hirota Bay, Southern Sanriku Coast. Coast. Eng. J. 2016, 58. [Google Scholar] [CrossRef]
- Yamashita, K.; Shigihara, Y.; Sugawara, D.; Arikawa, T.; Takahashi, T.; Imamura, F. Effect of sediment transport on tsunami hazard and building damage—An integrated simulation of tsunami inudation, sediment transport and drifting vessels in Kesennuma City, Miyagi Prefecture during the Great East Japan Earthquake. J. Jpn. Soc. Civ. Eng. Ser. B2 (Coast. Eng.) 2017, 73, I_355–I_360, (In Japanese with English abstract). [Google Scholar] [CrossRef]
- Yamashita, K.; Imamura, F.; Iwama, S.; Sugawara, D.; Takahashi, T. Effect of tsunami-indeced sediment transport and offshore tsunami waveform on enlargement of return flow. J. Jpn. Soc. Civ. Eng. Ser. B2 (Coast. Eng.) 2017, 73, I_361–I_366, (In Japanese with English abstract). [Google Scholar]
- Bear, J. Dynamics of Fluids in Porous Media; Elsevier: New York, NY, USA, 1972. [Google Scholar]
- Suga, Y.; Koshimura, S.; Kobayashi, E. Risk evaluation of drifting ship by tsunami. J. Disaster Res. 2013, 8, 573–583. [Google Scholar] [CrossRef]
- Satake, K.; Fujii, Y.; Harada, T.; Namegaya, Y. Time and space distribution of coseismic slip of the 2011 Tohoku earthquake as inferred from tsunami waveform data. Bull. Seismol. Soc. Am. 2013, 103, 1473–1492. [Google Scholar] [CrossRef]
- Haraguchi, T.; Iwamatsu, A. Detailed Maps of the Impacts of the 2011 Japan Tsunami. Aomori, Iwate and Miyagi prefectures, 1; Kokon-Shoin Publishers: Tokyo, Japan, 2011. (In Japanese) [Google Scholar]
- Takagawa, T.; Tomita, T. Tsunami source inversion with time evolution and real-time estimation of permanent deformation at observation point. J. Jpn. Soc. Civ. Eng. Ser. B2 (Coast. Eng.) 2012, 68, I_311–I_315, (In Japanese with English abstract). [Google Scholar] [CrossRef]
- Cabinet Office, Government of Japan. Massive Earthquake Model Review Meeting of the Nankai Trough, 2012. Available online: http://www.bousai.go.jp/jishin/nankai/model/12/index.html (accessed on 21 July 2017).
© 2018 by the authors. Licensee MDPI, Basel, Switzerland. This article is an open access article distributed under the terms and conditions of the Creative Commons Attribution (CC BY) license (http://creativecommons.org/licenses/by/4.0/).