Article

Oxygen-Dependent Morphogenesis of Modern Clumped Photosynthetic Mats and Implications for the Archean Stromatolite Record

1
Department of Earth, Atmospheric and Planetary Sciences, Massachusetts Institute of Technology, Cambridge, MA 02139, USA
2
Institute of Earth Sciences, Academia Sinica, Nangang, Taipei 11129, Taiwan
3
Center for Studies in Physics and Biology, The Rockefeller University, New York, NY 10065, USA
4
Applied Molecular Photomedicine Laboratory, The Forsyth Institute, Cambridge, MA 02142, USA
5
Department of Biological Sciences, Wellesley College, Wellesley, MA 02481, USA
6
Australian Centre for Astrobiology, School of Biotechnology and Biomolecular Sciences, The University of New South Wales, Sydney, NSW 2052, Australia
*
Author to whom correspondence should be addressed.
Geosciences 2012, 2(4), 235-259; https://doi.org/10.3390/geosciences2040235
Submission received: 2 August 2012 / Accepted: 25 September 2012 / Published: 11 October 2012
(This article belongs to the Special Issue Paleontology and Geo/Biological Evolution)

Abstract

:
Some modern filamentous oxygenic photosynthetic bacteria (cyanobacteria) form macroscopic tufts, laminated cones and ridges that are very similar to some Archean and Proterozoic stromatolites. However, it remains unclear whether microbes that constructed Archean clumps, tufts, cones and ridges also produced oxygen. Here, we address this question by examining the physiology of cyanobacterial clumps, aggregates ~0.5 mm in diameter that initiate the growth of modern mm- and cm-scale cones. Clumps contain more particulate organic carbon in the form of denser, bowed and bent cyanobacterial filaments, abandoned sheaths and non-cyanobacterial cells relative to the surrounding areas. Increasing concentrations of oxygen in the solution enhance the bending of filaments and the persistence of clumps by reducing the lateral migration of filaments away from clumps. Clumped mats in oxic media also release less glycolate, a soluble photorespiration product, and retain a larger pool of carbon in the mat. Clumping thus benefits filamentous mat builders whose incorporation of inorganic carbon is sensitive to oxygen. The morphogenetic sequence of mm-scale clumps, reticulate ridges and conical stromatolites from the 2.7 Ga Tumbiana Formation likely records similar O2-dependent behaviors, preserving currently the oldest morphological signature of oxygenated environments on Early Earth.

1. Introduction

The modern biosphere exhales and inhales oxygen on a planetary scale, and uses this gaseous metabolite in many biosynthetic pathways (e.g., [1]). Multiple indicators document the first rise of atmospheric oxygen, also known as the Great Oxidation Event (GOE), at around 2.48–2.3 billion years ago (Ga, e.g., [2,3]). Locally oxygenated environments existing under an anoxic atmosphere also may have left geochemical signatures in some older, Neoarchean successions (see Farquhar et al. [4] for a recent review). Cautionary notes accompany interpretations of these geochemical indicators. Not only is the authenticity questioned [5,6] of lipid indicators of oxygenated environments as old as 2.7 Ga (e.g., [7]), but alternative explanations for the observed trends in Neoarchean sulfur isotopes and concentrations of transition elements also may be possible [4].
The question remains of how long an oxygen-dependent biosphere existed before the rise of atmospheric oxygen. Recent analyses of modern genes and proteins suggest a major expansion of microbial respiratory activity and the birth of some oxygen-binding proteins 0.3–0.8 billion years before the GOE [8,9]. Currently, these molecular inferences are backed up by little solid morphological or geochemical evidence of oxygen-evolving or consuming metabolisms in the rather sparse 3.3–2.8 Ga old sedimentary rocks. However, stromatolites and tubular microbialites from the younger and more abundant 2.7–2.5 Ga strata inspired more [10,11,12] or less explicit cyanobacterial interpretations (e.g., [13,14,15]). For example, Buick [11] reported tufted mm-scale textures in 2.7 Ga stromatolites from the Tumbiana Formation, and interpreted them as fossil evidence for oxygenic photosynthesis. This interpretation relied primarily on the local absence of sulfate or iron minerals, i.e., some waste products of iron and sulfur-based anoxygenic photosynthesis. In a similar vein, Flannery and Walter [13] described the morphology of small conical, tufted and ridged stromatolites from the Tumbiana Formation (2.7 Ga). These authors underscored morphological similarities between the small Archean cones, tufts and ridges and modern cyanobacterial mats in various shallow-water environments [13], but any specific relationships between oxygen and the shapes of these mats remained unconstrained. An even more direct record of oxygenic photosynthesis may occur as 0.1–1 mm scale fenestrate textures at the tips or within the laminae of regularly laminated stromatolites and tubular microbialites. Briefly noted as “lenticular fenestrae” in modern stromatolites from Yellowstone National Park (YNP; [16]), these textures were recently described in much more detail, discussed as biosignatures of oxygenic photosynthesis and contrasted to the more common fabric-destroying fenestrae produced during extensive organic decay [17,18,19]. With possible exceptions [10,16,20], analogous fenestrate textures are yet to be identified or confirmed in Archean stromatolites.
Recognition of oxygenic photosynthesis in Archean stromatolites requires further field studies and experiments. Field studies can improve the rather sparse record of Archean stromatolites (reviewed by [15,21,22]), while experiments lead to the recognition of oxygen-related fabrics and shapes. A more extensive knowledge of processes that shape microbial mats in the absence of cyanobacteria is particularly important in the light of recent studies, which report tufted mats [10] and cones [23] constructed by anoxygenic photosynthetic communities.
Here we propose that the morphogenesis of oxygenic mm- and cm-scale coniform mats and stromatolites involves a distinct oxygen-dependent and preservable early step: clumps 0.1–1 mm in diameter and spaced by ~2 mm (Figure 1A,B and Figure 2A–C; [24]).
Figure 1. Morphogenesis of modern cone-forming cyanobacterial mats. (a) Photograph of mm-scale clumps that nucleate cones in Yellowstone National Park. The bottom scale on the ruler is numbered in cm; (b) Epifluorescence micrograph of a laboratory-grown mat showing clumps surrounded by flat areas and bundles of aligned filaments bridging the clumps; (c) Confocal epifluorescence micrograph of a clump. Red areas in (c) and (d) show Chl a autofluorescence. Green fluorescence tracks the presence of DNA stained by Sytox® Green (Invitrogen, Carlsbad, CA, USA); (d) Epifluorescence micrograph showing vertical and three-dimensionally bent filaments at the tip of a small cone. This cone nucleated from a clump; (e) Cone that grew in the laboratory from a small clump. The clump was placed on agar illuminated from below and the culture vessel was shielded from the light on all other sides. Some filaments migrated into the agar toward the light source, but most aggregated into the dense small cone. This experiment shows that the vertical aggregation of cone-forming cyanobacteria does not require migration toward light; (f) Internally laminated cyanobacterial cones with tufted tips and darker, clumped regions. Both the porous laminae of small cones and the clumped regions contain bent and bowed filaments.
Geosciences 02 00235 g001
Figure 2. Growth of clumped mats. (a) In the initially anaerobic media, flat and ridged mats develop before the onset of clumping (photograph); (b) Thicker, clumped mats develop from the flat mats shown in (a) (photograph); (c) Clumps on tops of silica sand grains (0.5 mm diameter). This mat grew in a solution initially equilibrated with air; (d) Oxygen concentration in the growth medium during the transition from flat to clumped and, ultimately, coniform mats. The onset of clumping coincides with a decrease in the accumulation of oxygen. Oxygen concentration in the solution above the mat does not change during the continued growth of small cones, such as those shown in Figure 1F. The system was opento gas exchange, so a constant oxygen concentration doesnot indicate that the culture is not net photosynthetic. Instead, theoxygen production is in equilibrium with the diffusion ofoxygen out of the medium. This trend is representative of measurements in eight cultures.
Geosciences 02 00235 g002
An early study [24] credits clumps to the random gliding and tangling of filamentous cyanobacteria. Numerous studies, however, indicate that the motility and macroscopic organization of filamentous microbes in various environments are not random, but depend on an array of environmental stimuli including redox conditions and oxygen concentrations. For example, light, temperature, sulfidic conditions and the presence of some organic compounds organize filamentous cyanobacteria in some sulfidic hot springs [25,26]. There, cyanobacteria aggregate into cm-scale horizontal clumps of aligned filaments [25,27], but do not form cones. Other thin filamentous non-heterocystous cyanobacteria (Subsection III; [28]) move toward O2, CO2 and HCO3 on solid horizontal surfaces [29]. Oxygen also impacts the horizontal gliding direction, the reversal frequency and the three-dimensional bending of large, submerged filamentous sulfide oxidizing bacteria [30]. Finally, expanding from the movement on horizontal surfaces to the movement in three dimensions, Gerdes [31] and Browne et al. [32] accredit the morphology of modern pinnacled and ridged mats to chemotaxis toward unspecified chemicals, but do not test this hypothesis by experiments.
Weller et al. [33] focused on redox conditions in modern cyanobacterial tufts and cones and attributed the formation of these structures in YNP to the cyanobacterial requirement for very low oxygen concentrations (microaerophilia). These authors measured a larger uptake of inorganic carbon in intact than mechanically dispersed cm-scale cyanobacterial tufts and cones, an enhanced uptake of inorganic carbon by dispersed aggregates in the presence of sulfide, and detected sulfide in some natural aggregates in YNP [33]. Walter [15] assumed that the requirement for microaerophilia [33] applied to smaller cyanobacterial clumps as well as cones and attempted to look for fossil clumps in the laminae of various Archean conical stromatolites. This early attempt called both for a better understanding of processes that lead to the formation of modern clumps, and an expansion of the limited database of Archean stromatolites [15]. However, the proposed requirement for microaerophilia is inconsistent with the recent measurements of oxygen in YNP cones and laboratory-grown cones [17,34]. In both settings, actively photosynthesizing structures contain more oxygen than the ambient water and their interiors are oxic during the photosynthetic period [17,34]. Moreover, the role of O2 both in the initial shaping and the persistence of cyanobacterial clumps remains to be demonstrated.
To this end, this study describes the organization, motility and density of cyanobacteria and exopolymeric substances in clumps and flat mats, evaluates the persistence of clumps as a function of changing O2 and dissolved inorganic carbon (DIC) concentrations, and identifies conditions when clumping may be beneficial. Implications of these experimental insights for the recognition of cyanobacterial textures and stromatolites are discussed and used to interpret the morphogenesis of some recently recognized Archean conical stromatolites [13].

2. Results and Discussion

2.1. Results

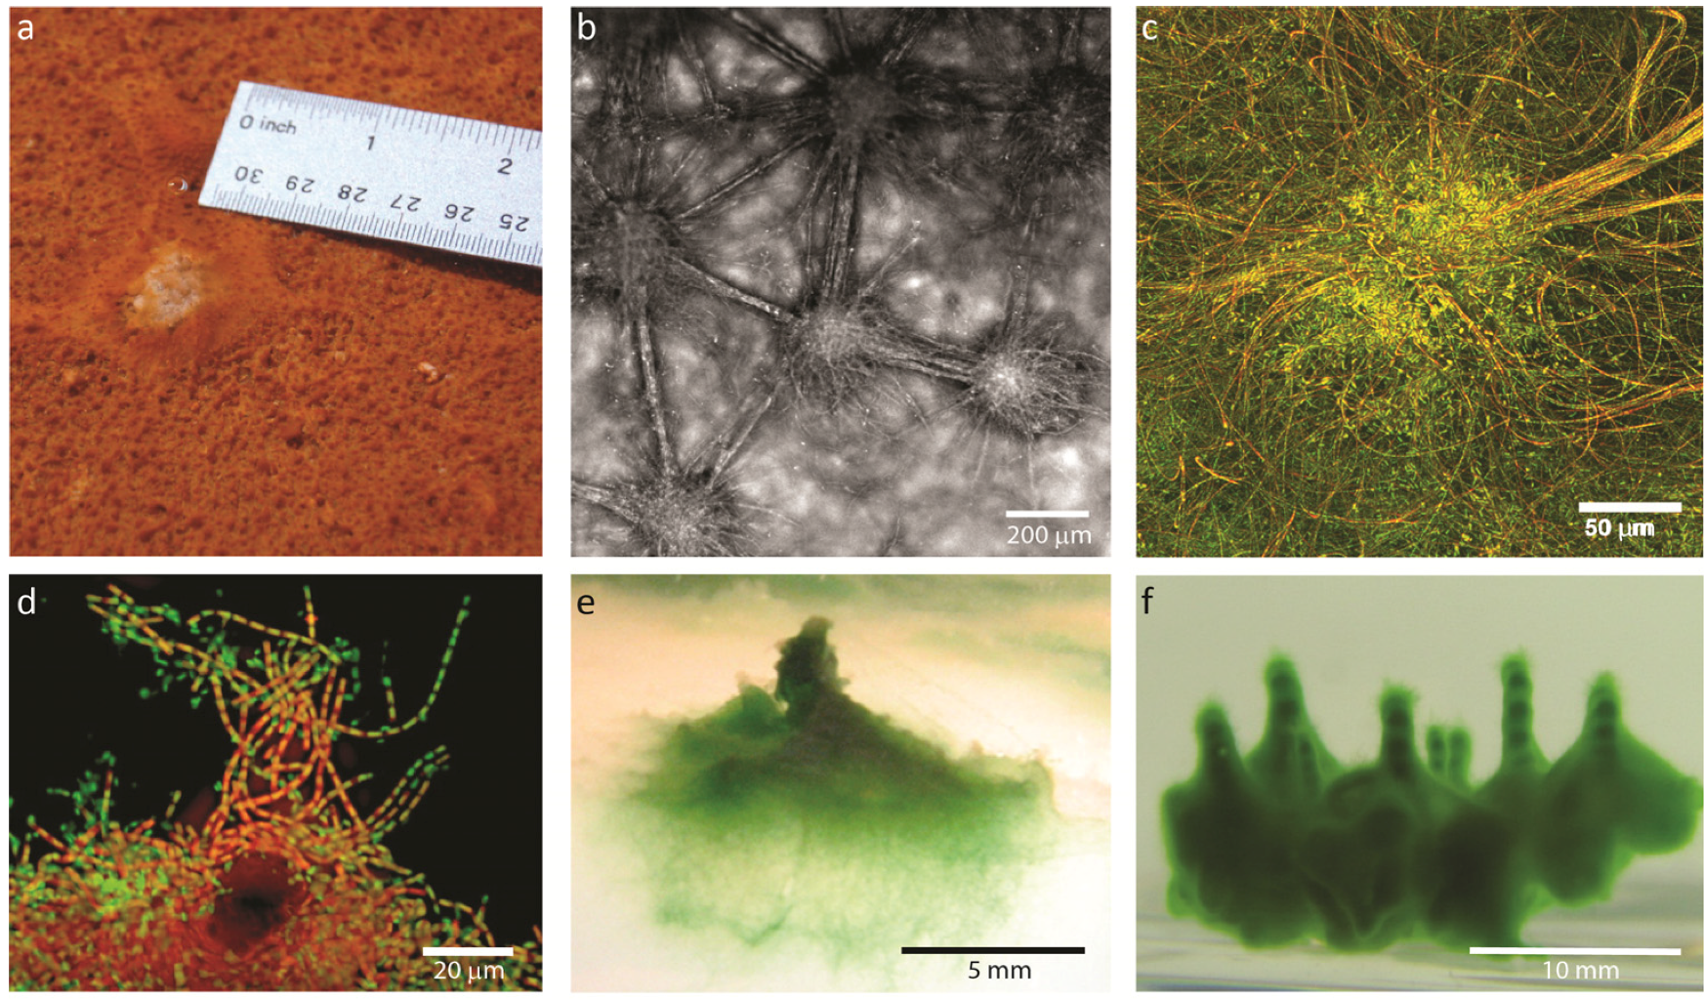
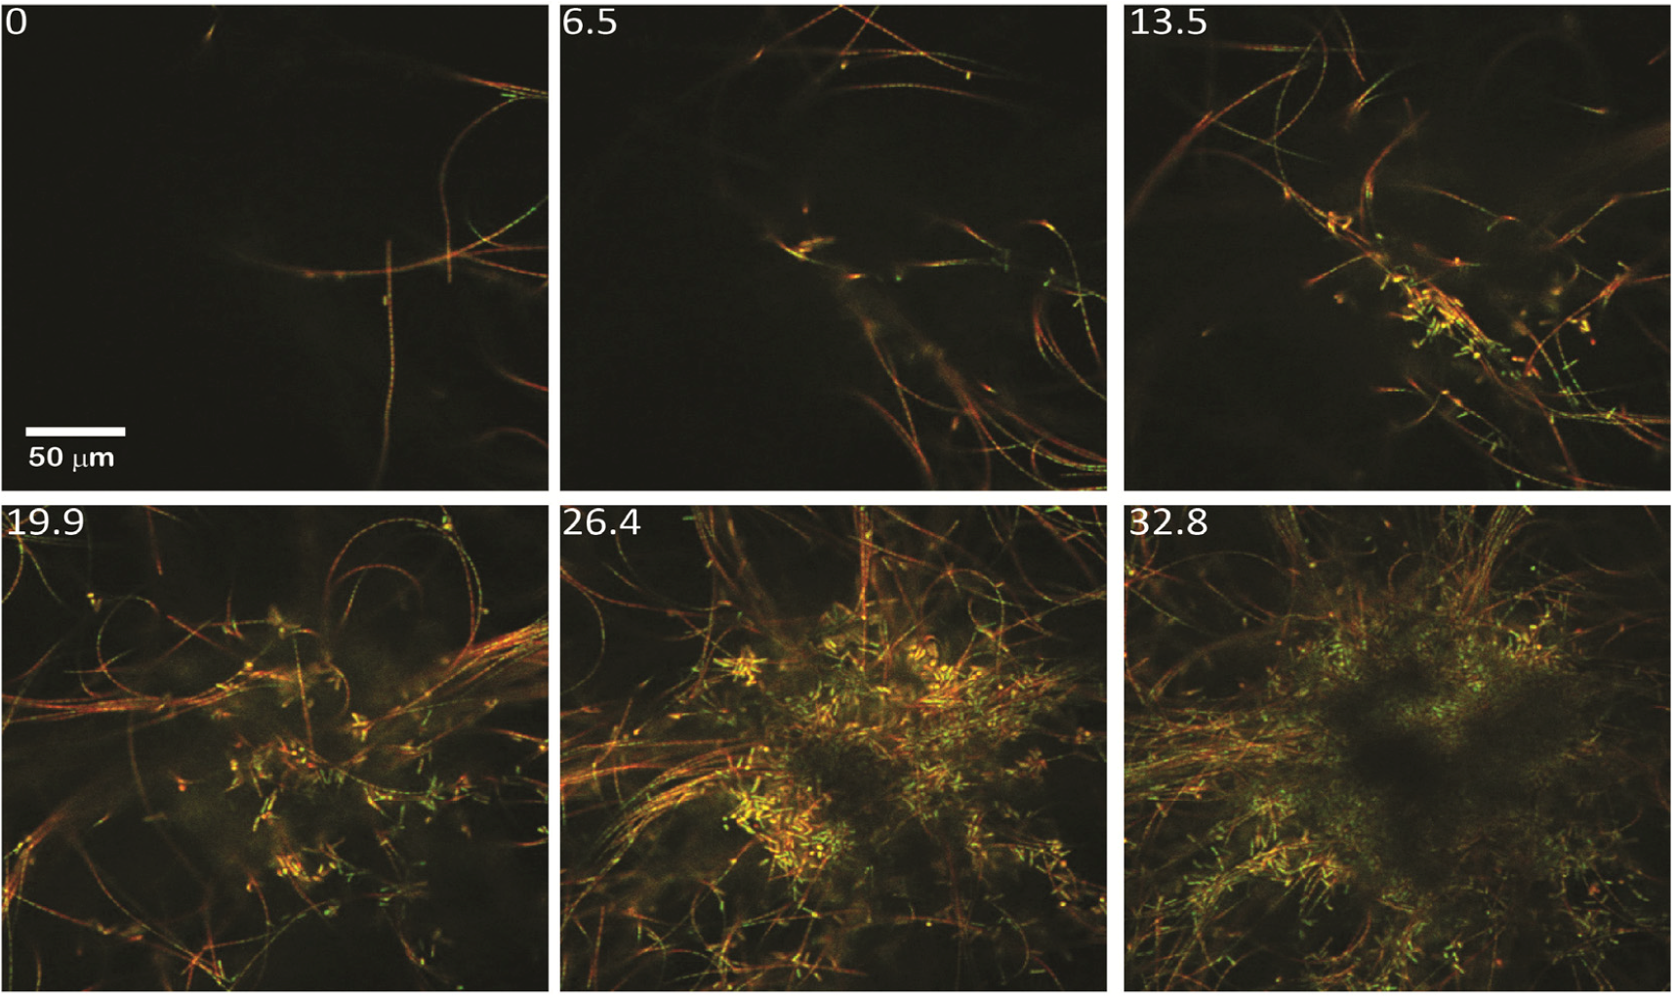
2.1.1. Morphological Stages in the Growth of Cone-forming Microbial Mats

Enrichment cultures consisting of motile, filamentous cone-forming cyanobacteria and other microbes (Electronic Supplement, [34]) were enriched by serial harvesting and culturing of cones in a modified Castenholz medium D [17], as well as by the selection of the fastest-gliding phototactic filamentous cyanobacteria [34]. These organisms were identified as cyanobacteria using 16S rRNA sequences and chlorophyll a (Chl a) autofluorescence (described in more detail in [34] and Electronic Supplement). Cyanobacterial clumping in our laboratory enrichment cultures occurred in morphologically and chemically distinct stages and depended on culturing conditions. When growing on flat surfaces and in initially anaerobic solutions equilibrated with 5% CO2, the mats first spread laterally (Figure 2A), then formed regularly spaced clumps (Figure 2B), and finally produced topographically distinct pinnacles and cones (Figure 1D–F). In contrast, when aerobic enrichment cultures were initially equilibrated with air, mats were visible only as clumps and cones, and only later spread laterally (Figure 2C). During the lateral spreading and thickening of flat mats in the initially anaerobic enrichment cultures, the concentration of oxygen increased, but the appearance of regularly spaced clumps coincided with a decrease in net oxygen production (Figure 2D). At a given light intensity, clumps always appeared at similar oxygen concentrations, emerging one week earlier and exhibiting a larger spacing (2.21 ± 0.81 mm, average ± standard deviation for all the remaining results, N = 71) at 160 μE/m2/s than at 10 μE/m2/s (0.82 ± 0.16 mm, N = 114, p < 0.01). Clumping in anaerobic laboratory cultures occurred in the presence of 5 mM nitrate and 28 mM DIC. Because these concentrations were much greater than the Km for nitrate (several tens of μM, [35]) and the Km for CO2 and HCO3 (in the μM range, [36]), clumping under our experimental conditions could not be interpreted as a direct response to low concentrations of nitrate and inorganic carbon.
To the naked eye, clumps appeared as circular features darker than the adjacent flat mats (Figure 2B). Confocal microscopy showed that the newly discernible clumps were not elevated by more than 19 ± 8 μm (N = 6) above the mat, but contained 1.83 ± 0.44 (N = 6) times denser cyanobacterial cells than the surrounding mats (p < 0.01). Cyanobacterial filaments in clumps were randomly oriented, bowed vertically and entangled (Figure 3). In contrast, those around clumps were gently curved, loosely intertwined, predominantly horizontal (Figure 1C, Figure 2 and Figure 3), and often aligned into dense bundles that bridged adjacent clumps (Figure 1B). The randomly oriented, three-dimensionally bent filaments in clumps (Figure 3) were surrounded by abundant, presumably heterotrophic, small cells that did not exhibit Chl a autofluorescence (Figure 3). Analyses of molecular diversity of laboratory enrichment cultures confirmed the presence of various non-photosynthetic bacteria (Electronic Supplement). Clumps also contained 17 ± 9 (N = 4) times denser cyanobacterial sheaths stainable by Calcofluor White than the surrounding areas (Figure 4, p < 0.01). Most sheaths within the clumps were abandoned, i.e., they had a filamentous form, but did not contain detectable Chl a or cells. At the same time, stainable sheaths were rare where cyanobacterial filaments were well-aligned and horizontal (Figure 4). These observations confirmed that clumps did not form as small blisters around gas bubbles, although bubbles lift up some cyanobacterial mats into cm-scale towers [37,38]. The presence of abandoned sheaths in the centers of clumps also demonstrated the continuing motility of three-dimensionally bent filaments within clumps (Figure 4 and Figure 5, Electronic Supplement).
Figure 3. Top-down views of cyanobacteria and other microbes in a clump. Numbers in each epifluorescence confocal micrograph denote depths in μm, with 0 μm denoting the top and 32.8 μm denoting the bottom. Red areas show Chl a autofluorescence. Green fluorescence tracks the presence of DNA stained by Sytox® Green (Invitrogen, Carlsbad, CA, USA).
Geosciences 02 00235 g003
Figure 4. Epifluorescence photomicrographs of clumps and cyanobacterial sheaths. Red and blue, respectively, show Chl a autofluorescence and extracellular polymeric material (EPS) stained by Calcofluor White, respectively. (a) Clumped mat; (b) Clump; (c) Epifluorescence confocal micrograph of cyanobacterial filaments in a clump; (d) EPS in the same field of view as in (c); (e) Epifluorescence confocal micrographs of cyanobacteria in a flat mat; (f) EPS in the same field of view as in (e). Note that sheaths stainable by Calcofluor White rarely occur within bundles of well-aligned filaments, e.g., lower right in (e).
Geosciences 02 00235 g004

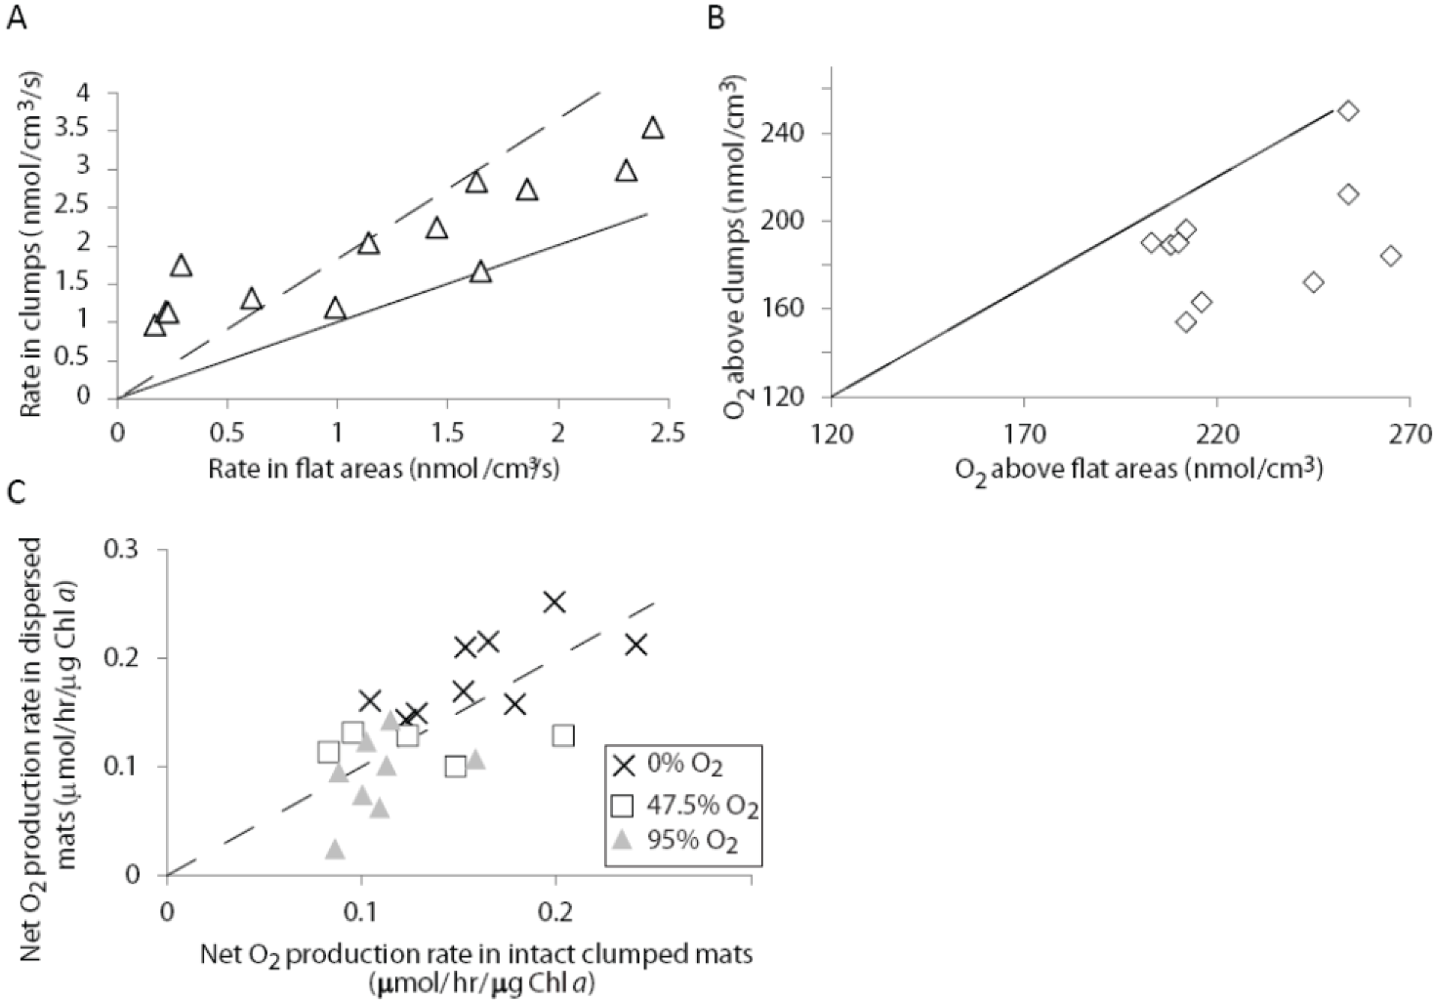
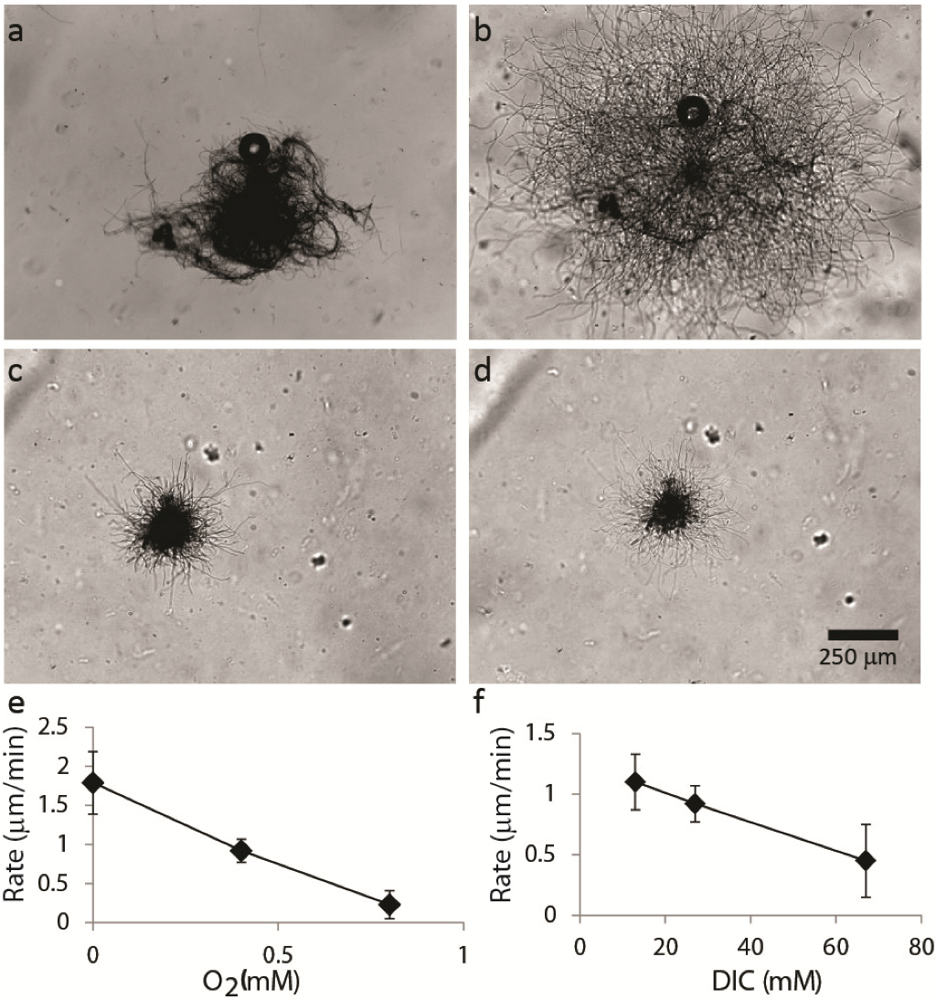
2.1.2. Dispersal of Clumps as a Function of O2 and DIC

Mats first appeared as clumps in cultures that were initially equilibrated with air (Figure 2C). In contrast, those in initially anaerobic cultures developed clumps only after the concentration of oxygen stopped increasing (Figure 2D). The concentration of O2 in the initially anaerobic medium increased from 0 to more than 200 μM, the concentration of DIC in the same medium decreased from 29 to 28 mM, and the concentration of nitrate remained in the mM range. These observations suggested a link between the formation and persistence of clumps and the changing amounts of O2, a major photosynthetic product. To determine the influences of O2 and DIC, respectively, we measured cyanobacterial horizontal gliding rates away from clumps in media containing different amounts of O2 or DIC, respectively (Figure 5, Experimental Section 3.3). At low oxygen concentrations, filaments migrated away from clumps fast, but hardly at all at 95% O2 (Figure 5). The rates of clump dispersal also decreased with the increasing concentrations of DIC in the medium (Figure 5), but clumps dispersed over the entire range of experimentally examined DIC concentrations when oxygen was absent (Figure 5, Experimental Section 3.3).
Figure 5. Migration of filaments away from clumps as a function of O2 and dissolved inorganic carbon (DIC) in the solution. All photomicrographs are shown on the same scale. (a) Three-dimensional clump containing bent filaments before incubation in 0 mM O2 and 27 mM DIC; (b) The same clump after the 2-h incubation in 0 mM O2 and 27 mM DIC. Note that many filaments became horizontal and glided away from the clump; (c) Photomicrograph of a clump before incubation in 0.8 mM O2 and 27 mM DIC; (d) The same clump after the 2-h incubation in 0.8 mM O2 and 27 mM DIC; (e) Horizontal migration rates of filaments away from clumps as a function of O2 concentration in the solution; (f) Horizontal migration rates away from clumps as a function of DIC concentration in the solution.
Geosciences 02 00235 g005

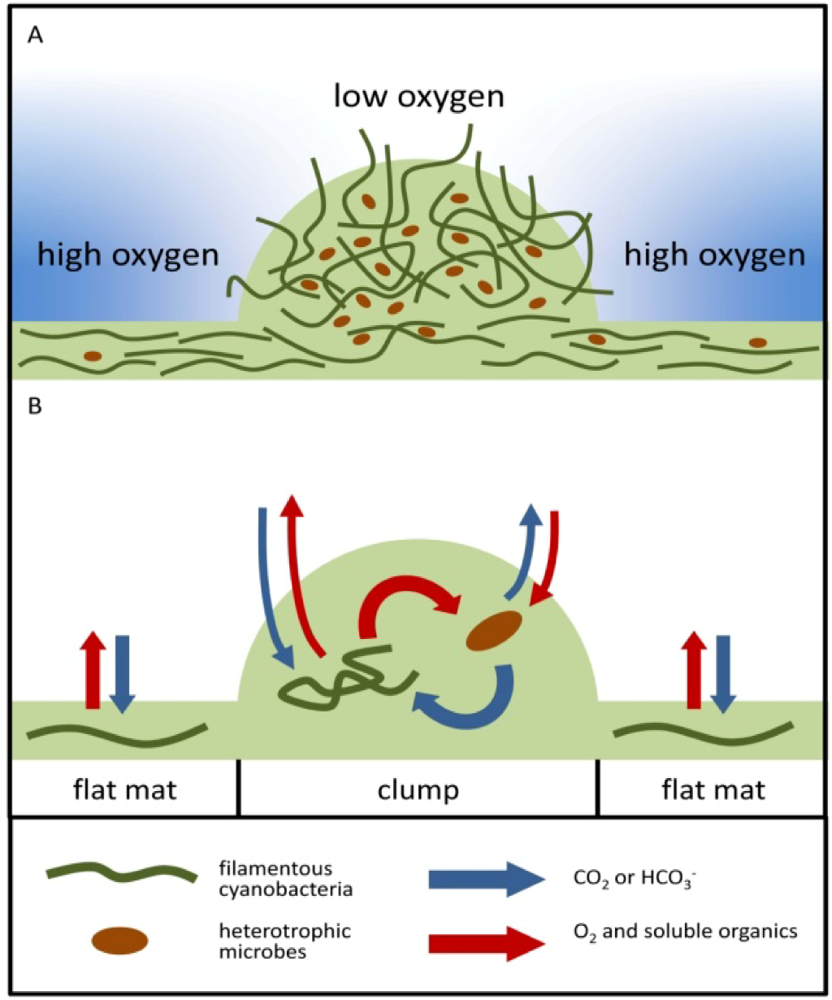
2.1.3. Oxygen Cycling in Clumps and Mats

The notable influence of oxygen on the persistence of clumps (Figure 5) suggested that the cycling of carbon, oxygen and nutrients within clumped mats also may depend on the concentration of oxygen. To test this, we examined the cycling of carbon and oxygen in clumps and adjacent areas, and between clumped and mechanically dispersed, formerly clumped mats (Figure 6, Experimental Section 3.4). The gross photosynthetic rates were always higher in clumps, scaling with the higher filaments density in clumps (Figure 6A). These measurements indicated that filaments in clumps and flat areas had comparable gross photosynthetic rates. More surprisingly, oxygen concentrations at the surfaces of clumps were lower than those at the surfaces of mats (Figure 6B, Experimental Section 3.4), although clumps grew upward faster than the surrounding areas (Figure 1).
Figure 6. Photosynthetic rates and oxygen concentrations in intact, clumped mats and dispersed mats. (a) Volumetric gross photosynthetic rates in clumps and flat areas. Each triangle represents 10measurements from one mat. Different triangles represent mats grown in independent culture experiments. Solid line marks points where these rates are equal in clumps and flat areas. Dotted line is the 1.83:1 line that describes the predicted relationship between rates in clumps and mats, if the rates per cell are equal and increase with the cyanobacterial density, which is 1.83 ± 0.44 times greater in clumps. The gross photosynthetic rates of cells in clumps and surrounding areas are, thus, similar; (b) Oxygen concentration in flat biofilms and clumps. Each rectangle represents average values of 10 clumps and flat areas. Different data points represent clumped mats from different cultures that were grown at different times. Solid line marks the trend that would be expected if the oxygen concentration were the same in clumps and mats; (c) Net oxygen production rates as a function of oxygen concentration in the solution. Crosses are data points measured in the initially anaerobic medium (0% O2), rectangles are data points measured in media equilibrated with 47.5% O2 and grey triangles are data points measured in media equilibrated with 95% O2. Dashed line marks the expected trend for equal net photosynthetic rates in dispersed and intact mats. Net photosynthetic activity is higher in dispersed samples in the initially anaerobic medium (p < 0.05), but the net rates do not differ between dispersed and clumped mats at higher oxygen concentrations (p > 0.1).
Geosciences 02 00235 g006
To learn more about the cycling of carbon and oxygen in clumped mats, we measured the gross and the net photosynthetic rates in clumped and dispersed mats at different concentrations of O2 in the medium (Experimental Section 3.4). Net oxygen production reflects the amount of fixed inorganic carbon that is not remineralized in the mat, while the difference between the gross and the net photosynthetic rate depends on the intensity of oxygen-removing processes, photorespiration and aerobic respiration (Equation 1). Photorespiration occurs in organisms which incorporate inorganic carbon using ribulose-1,5-bisphosphate carboxylase/oxygenase (RuBisCo), an enzyme that can act both as a carboxylase and an oxygenase. During photorespiration, the oxygenation of RuBisCo is accompanied by the excretion of soluble organic carbon (e.g., [39,40]), reducing the incorporation of inorganic carbon into cellular biomass. Increasing O2 concentrations can thus lead to higher rates of oxygen removal and lower net photosynthetic rates (Equation 1).
Geosciences 02 00235 i001
The gross photosynthetic rates of dispersed mats, measured in the presence of 154, 446 and 577 μM O2 (Experimental Section 3.4), did not depend on the concentration of O2 (p > 0.2, N = 10 measurements per condition). Therefore, high O2 concentrations did not measurably impact the production of oxygen by cyanobacterial cells. In turn, net photosynthetic rates decreased with the increasing O2 concentration in both intact and dispersed samples (Figure 6C). This indicated an increase in the combined respiratory activity at increasing O2 concentrations (Equation 1). A similar trend between net photosynthetic rates and O2 concentrations was reported previously in microbial mats dominated by cyanobacteria which do not form clumps and cones [41]. In anaerobic solutions, mechanically dispersed mats had higher net photosynthetic rates than clumped mats (Figure 6C, p < 0.05, N = 9). These rates did not differ between dispersed and clumped mats at higher oxygen concentrations (p > 0.1, N = 13, Figure 6C). Because cyanobacteria in clumped and dispersed mats exhibited similar gross photosynthetic rates (Figure 6A), and these mats had similar net photosynthetic rates in oxic media (standardized by total Chl a or cyanobacterial density, Experimental Section 3.4), Equation 1 shows that clumping did not impact the sum of photorespiration and aerobic respiration in oxic media. Furthermore, the observed accumulation of particulate organic carbon in clumps (Figure 3, Figure 4 and Figure 6B) was not consistent with the observed lower oxygen concentrations above the clumps (Figure 6B). Therefore, we hypothesized that more soluble organic carbon may be respired aerobically within clumps.
To determine whether more dissolved organic compounds leaked from the dispersed mats, we measured the production of glycolate, a soluble product of photorespiration. Net glycolate production in the medium is described by:
Geosciences 02 00235 i002
where F describes the fraction of total aerobic respiration that uses glycolate as a substrate. After a 1-h incubation in the oxic media, dispersed mats produced 69 ± 7 nmoles of glycolate per μg Chl a, whereas clumped mat released less glycolate, 43 ± 3 nmoles per μg Chl a (N = 4, p < 0.01). The lower net leakage of soluble organic carbon from clumped mat could lead to the accumulation of more particulate organic carbon there, even though both clumped and dispersed mats produced similar amount of oxygen in oxic media. Three mechanisms can account for this observation. First, clumping reduces photorespiration and enhances the aerobic respiration. These two processes are not independent, because aerobic respiration lowers the O2/CO2 ratio, which, in turn, can reduce photorespiration. Second, clumping might increase F in Equation 2, if clumped mats contain more heterotrophic bacteria that prefer glycolate to other organic compounds. This scenario is unlikely under our experimental conditions, because clumped and dispersed mats preserved the ratios of non-photosynthetic cells, cyanobacteria and particulate material larger than ~1 μm (Experimental Section 3.4). We thus expect F (Equation 2) to be the same in clumped and dispersed mats. Third, the diffusion coefficients for the diffusion of small molecules and ions in clumps may be lower than those of the surrounding areas. This mechanism augments the first one by increasing the availability of glycolate and oxygen for aerobic respiration within the clumped mats.

2.2. Discussion

2.2.1. Initiation of Clumping

The characteristic pattern in clumped cyanobacterial mats (Figure 1B and Figure 2B) arises from the ability of filamentous non-heterocystous cyanobacteria to bow, bend and reverse gliding directions. These processes initially distribute filaments in clumps, ridges and less dense surrounding areas and continue to influence the orientation of filaments during later growth (Figure 5, Electronic Supplement). The persistence of newly formed clumped mats strongly depends on the concentration of O2 (Figure 5), because high O2 concentrations in the medium around clumps reduce the dispersal of clumps (Figure 7A). At this point, it remains unclear whether high oxygen concentrations promote clumping directly, or indirectly, by influencing the production of other diffusible metabolites and signaling molecules, which are then sensed by cyanobacteria. In any case, horizontally gliding filaments are more likely to reverse their gliding direction when oxygen is present in the medium outside of clumps (Electronic Supplement), whereas the already bent and bowed filaments are less likely to leave the clump (Figure 5 and Figure 7A). The bent and bowed filaments in clumps also are more likely to span diffusive boundary layers (e.g., [30,42,43]), compared to the predominantly horizontal filaments in the surrounding areas.
Cyanobacterial filaments also align into ridges that bridge clumps (Figure 1B), and into thin laminae on the sides of larger cones (Figure 8). Currently, the formation of ridges is attributed to undirected gliding motility [44], but this model explains neither the denser concentration and alignment of cells in ridges, nor the thickness and the regular spacing of the ridges. The organization and accumulation of cyanobacterial filaments in these areas may depend on cell-to-cell contact and pilus-mediated gliding motility in a similar fashion to the alignment and persistence of aligned regions of much smaller and non-filamentous myxobacteria [45].
Figure 7. Proposed model of microbial distribution, spatial organization, carbon and O2 cycling in clumps and adjacent areas. (a) Clumps contain denser cyanobacterial filaments and heterotrophic microbes (Figure 1C, Figure 3 and Figure 4B). The initial differences in density depend on cyanobacterial motility and can be established over short timescales (<2 h, Figure 5, Electronic Supplement). Darker blue color outside of the clump indicates higher oxygen concentrations in areas adjacent to clumps (Figure 6B). Oxic media increase the reversal frequencies of any filaments that begin to leave the clumps (see the movies in the Electronic Supplement), thereby reducing the net migration away from the clump (Figure 5). This enables the persistence of the initial clumps over short timescales; (b) Spatial coupling between photosynthesis and respiration in clumps. Oxygen produced by cyanobacteria diffuses into the overlying medium or is used for aerobicrespiration. DIC diffuses into the clump from the overlying medium and is also produced within the clump by respiration. In oxic solutions, high O2 concentrations reduce the efficiency of CO2 fixation and result in the excretion of glycolate. Under these conditions, clumping can be beneficial to cyanobacteria if it stimulates the retention of carbon and the assimilation of inorganic carbon by cyanobacteria within clumps. This effect appears to promote the accumulation of particulate organic carbon (cells, sheaths and heterotrophic organisms) in clumps (Section 2.1.3, Figure 3 and Figure 4).
Geosciences 02 00235 g007
Figure 8. Clumps in a cyanobacterial cone from Yellowstone National Park. (a) Mosaic light micrographs of the vertical thin section through the cone. The black and white rectangles, respectively, outline areas with clumped filaments in the tip of the cone which are magnified in (b) and (c), respectively.
Geosciences 02 00235 g008
In quiet, stratified solutions, the flow of nutrients into the mat and the flow of waste products out of the mat depend on the microbial organization within the mat [30,42,43,46]. Assuming that the initial transition from the “flat” mats (Figure 2A) to the clumped ones is a behavioral adaptation that allows a better use of resources, one can develop a simplified model of clump spacing. In this geometric model, a flat mat becomes clumped when the surface area to volume ratio of the clumps is higher than that of a flat mat. Consider a volume of bacteria V distributed over an area A. The bacteria can either be distributed as a flat sheet of thickness δ or organized into hemispherical clumps of radius r. In flat mats, the surface area to volume ratio is 1/δ. In clumped ones, the surface area to volume ratio is 3/r. Consequently, if r/δ> 3, nutrients and waste products flow more easily into and out of a flat mat, but the biofilm becomes more efficient by forming clumps if r/δ< 3. Thus, the biofilm should form clumps when
Geosciences 02 00235 i003
At the very transition from flat to clumped mats, the thickness of biomass from clumps, if spread over the entire area occupied by a clumped mat, is equal to the thickness of the flat mat spread over the same area. If the clumps are arranged on a hexagonal lattice (spaced by λ; Figure 1B and Figure 2B), then the area per clump is:
Geosciences 02 00235 i004
If each clump were redistributed uniformly over this area a, the thickness Δ of the resulting mat would be:
Geosciences 02 00235 i005
Clumping occurs when Δ > 3/r. This requirement and the rearranged Equations 4 and 5 give the distance between newly formed clumps:
Geosciences 02 00235 i006
Note that the ratio described by Equation 6 will be greater if the clump height is smaller than the clump diameter, or if clumps contain denser filaments than mats. The value predicted by Equation 6 is generally consistent with the observed ratios of clump spacings and diameters in newly clumped mats (Figure 1B and Figure 2B). A more precise prediction would require a more detailed model of how nutrients and waste products flow through flat mats and within clumps. In general, regularly spaced clumps are more likely to develop on flat mats than in the presence of three-dimensional photosynthetically active structures (e.g., preexisting cones), because these structures create more complex chemical gradients in the solution (e.g., [47]).
An additional constraint is required to understand the magnitude of clump diameters. A simple and plausible possibility is that the size of a bent filament constrains the minimum size of structurally stable clumps. In this case, the size of nascent clumps is determined by the material properties of the bacteria. This, in combination with the surface area argument, determines λ. Alternatively, the spacing may be constrained by the flow of nutrients around aggregates [41].

2.2.2. Cycling of Carbon and Oxygen

Once the clumped pattern is established (Figure 1), clumps continue to grow upward. This growth pattern relies on the growth of new cyanobacterial and non-photosynthetic cells, the accumulation of cyanobacterial sheaths (Figure 3 and Figure 4), and the presence of upright or bent filaments in clumps (Figure 1 and Figure 3). Similar processes may build laminae composed of clumped or randomly oriented filaments in mature cones [34] and form small clumps on the sides and tips of mature cones ([24], Figure 8). The photosynthetic activity and cyanobacterial density in larger clumps and cones does not remain constant, but declines below a ~0.2 mm thick surface layer [34].
In oxic solutions, clumping reduces net photorespiration, measured as the excretion of soluble organic carbon above the mat, and the loss of organic carbon from the mat (Figure 2 and Figure 6). The secretion of glycolate in our cultures shows that clump-forming cyanobacteria cannot completely abolish the photorespiration pathway, even though cone-forming cyanobacteria are able to concentrate carbon [34], and clumped mats grow in the presence of 25 mM DIC. The requirement for photorespiration appears to be a general property of cyanobacterial CCMs (e.g., [40]). The close spatial proximity of cyanobacteria and other microbes (Figure 3 and Figure 7B), the availability of sheaths as attachment surfaces for aerobic heterotrophic microbes and the retention of nutrients and photosynthates within the dense exopolymeric matrix [48] may lower the O2/CO2 ratios in clumps more than those in the surrounding areas, promoting the accumulation of organic carbon in clumps (Figure 7B). It remains to be seen whether cyanobacteria continue to form clumps in the absence of heterotrophic microbes. To date, our attempts to obtain pure cultures in which to test this have remained unsuccessful.
At first glance, the continued growth of clumps is at odds with the lower O2 concentrations above clumps (Figure 6B). Namely, less O2 leaving the clumps may suggest a more extensive organic degradation rather than a faster accumulation of particulate organic carbon. Due to the small size of clumps and surrounding areas, we were unable to compare the net photosynthetic rates of clumps and the surrounding areas, or compare the release of glycolate by clumps and the surrounding areas. However, if clumps release less glycolate out of the microbial mat than the surrounding areas, and this intense recycling leads to the production of more particulate carbon, this may account for the lower oxygen concentrations above clumps. This hypothesis can be further explored by using enzyme-based microsensors specific to glycolate (e.g., [49]).
Clumping occurs only at certain stages of biofilm growth, and only in limited areas. At low oxygen concentrations, or in the presence of sulfide [33], heterotrophic respiratory activities can be limited both by the availability of O2 and by the supply of organic substrates. Under these conditions, each cyanobacterial filament would maximize the availability of nutrients in the growth medium, forming a “flat” mat. Indeed, when incubated in the initially anoxic solutions, dispersed mats release more oxygen into the medium per unit time than clumped mats (Figure 6C). This suggests that the benefit of clumping is smaller in the absence of oxygen, but promotes the growth of clumps in oxic media (Figure 7B).

2.2.3. Interpretations of the Stromatolite Record

Overall, our data underscore the role of oxygen in the organization, growth and persistence of clumped mats and point to benefits of clumping that may be unique to oxic systems. Clumping, as an oxygen-dependent behavior which reduces the loss of soluble organic carbon from the mat and promotes the accumulation of particulate carbon in clumps, should be specific to mats constructed by RuBisCo-containing primary producers such as photosynthetic cyanobacteria, some anoxygenic photosynthetic bacteria, or chemolithotrophs such as Beggiatoa sp. [50]. Because sub-mm clumps spaced by ~1–2 mm are present in oxic but aphotic mats (e.g., [30]) and in oxygenic photosynthetic mats in YNP (Figure 1A in this paper and [24]), additional observations are needed to recognize photosynthetic structures. Specifically, small clumps spaced by ~1 mm can be viewed as a biosignature of oxygenic photosynthesis only if accompanied by small conical stromatolites and/or reticulate ridges. To the best of our ability, we are not aware of alternative models that could account for the entire morphogenetic sequence from clumps to cones or reticulate ridges, but would not require oxygen.
Unlike the formation of clumps, the ability of filamentous organisms to glide, clump, align, form ropy bundles or bend may have little to do with the presence of oxygen. Anoxygenic photosynthetic filaments (e.g., Chloroflexus and Roseiflexus sp.) glide [51] and form alternating thin-dense and thick, porous laminae in the presence of non-filamentous cyanobacterium Synechococcus [52]. Neither cyanobacteria nor oxygen are required for the formation of clumps by the filamentous green sulfur bacterium Chloroherpeton [53], or for cAMP-dependent aggregation of the thin, gliding, filamentous photosynthetic bacterium Chloroflexus aggregans [54,55]. Dense filament bundles of unknown organisms embedded in calcite also occur in aphotic microbialites described from cold seeps [56], whereas aligned and randomly oriented filaments of gliding, sulfate-reducing Desulfonema sp. are reported from some sulfidic marine sediments [57]. Tufted and string-like macroscopic aggregates that contain aligned filaments are also present in the laboratory enrichment cultures fueled by anoxygenic photosynthesis in the presence of low sulfate and sulfide concentrations [10]. Therefore, we advise caution when interpreting tufted textures in stromatolites because it is unclear how to distinguish cyanobacterial tufts from those formed by various gliding anaerobes.
Tufted and conical microbial mats are rather common in modern intertidal and other shallow water environments [13,58,59], but their preservation potential is very low [60] and requires early lithification. The need for early lithification may account for the relative paucity of these features in the geological record, particularly that of the Phanerozoic. A rare example of the entire morphogenetic sequence starting with small clumps and ending in cones is reported from the Early Mesoproterozoic Satka Formation [61,62]. Clumps also appear to have initiated the formation of small, laterally-linked conical stromatolites from the 1.8 Ga Mistassini Formation [63], but there, clumps are not well preserved due to recrystallization and dolomitization.
Evidence for cyanobacteria in the Mesoproterozoic and Paleoproterozoic is reassuring, but not particularly surprising. A much older morphogenetic sequence from clumps to conical and ridged stromatolites was recently reported in the 2.72 Ga Tumbiana Formation [13], i.e., 0.2–0.4 billion years before the GOE. In the Tumbiana Formation, mm-scale clumps grade vertically into centimeter-scale conical stromatolites, which are linked by regularly occurring inter-connecting laminae (Figure 9). The rarity of unambiguous detrital grains in these stromatolites indicates the laminae were likely precipitated in situ, or as fine grains in the water column directly above the stromatolites. Early lithification in this environment preserved fine-scale features such as an axial zone, mm-scale clumps, tufts and reticulates (Figure 9A). This morphological sequence argues for the presence of microbes that moved, metabolized and aggregated in the presence of oxygen in shallow water environments at 2.7 Ga. The record of Archean stromatolites at 2.7 Ga, thus, independently corroborates other proposed indicators of oxygenic photosynthesis and locally oxygenated systems 0.2–0.4 billion years before the rise of atmospheric oxygen.
Figure 9. Morphogenetic sequence from clumps to cones preserved in an Archean conical stromatolite from the Tumbiana Formation [11]. (a) Vertical cross-section through cones; (b) Clumps in the magnified area shown by the white rectangle in (a); (c) Small, cm-scale cones and mm-scale clumps crop out on elsewhere reticulate plan-view surfaces; (d) Clumps in top view of the area shown by the white rectangle in (c).
Geosciences 02 00235 g009

3. Experimental Section

3.1. Sampling and Culturing Conditions

Samples of cone-forming microbial mats were collected in 2008 in ponds fed by springs in Sentinel Meadows in Yellowstone National Park (permit #YELL-2008-SCI-5758 from the U.S. National Park Service). The samples designated for later culturing experiments were excised by a sterile surgical blade, placed in a 50 mL plastic tube containing water from the sampled pond, and stored in the dark at ambient temperature during transport. Separate samples of field cones were designated for microscopic examination, fixed with with 2.5% glutaraldehyde in 0.1 M sodium cacodylate buffer (pH 7.4) for 2 h and prepared for microscopy as previously described [17,18,34,46].
Motile, filamentous cone-forming cyanobacteria were enriched by serial harvesting and culturing of cones in a modified Castenholz medium D [17], as well as by the selection of the fastest-gliding filaments [34]. These organisms were identified as cyanobacteria using 16S rRNA sequences and Chl a autofluorescence (described in more detail in [34] and Electronic Supplement). The medium was equilibrated with an anaerobic atmosphere (90% N2, 5% CO2 and 5% H2) or atmospheric air, respectively. The anaerobic medium received an additional 2.2 g NaHCO3 per liter, and all media were titrated with NaOH or HCl to an initial pH of 7.5. Enrichment cultures were grown at 45 °C in an aerobic incubator or in an anaerobic glove box (Coy Manufacturing Co., Ann Arbor, MI, USA) on solid surfaces consisting of silica sand, aragonite sand or agar. The glass culture containers were sealed using paraffin film to prevent evaporation and allow gas exchange. Containers were placed at different distances from the cool white fluorescent light source (26 W with a 12h light: 12 h dark cycle) at 10, 50 and 160 μE/m2/s to characterize the spacing between clumps at different photosynthetic rates and light intensities. All experiments characterizing the cycling of carbon and oxygen were performed using mats grown at 160 μE/m2/s. Most experiments used cells from enrichment cultures grown under an anaerobic atmosphere, unless otherwise stated. The concentration of DIC in the medium was determined from the measurements of the pH and the alkalinity of the solution. The concentration of nitrate was measured by a colorimetric assay (#23479, Sigma-Aldrich, St. Louis, MO, USA).

3.2. Staining of Exopolymeric Substances (EPS)

The distribution of EPS within and outside of clumps was visualized by Calcofluor White (Sigma-Aldrich, St. Louis, MO, USA). This dye binds selectively to β-linked polysaccharides, such as cellulose and chitin [64] and stains cyanobacterial sheaths. The staining solution was prepared by mixing equal volumes of potassium hydroxide (10 g KOH and 10 mL glycerin in 90 mL distilled water) and Calcofluor White (0.1 g Calcofluor White in 100 mL distilled water; [65]). Samples of microbial mats with prominent clumps (5 mm × 5 mm area) were cut by a sterile surgical blade, placed onto a 0.2 μm pore size membrane filter (Whatman #110656) and stained. Stained samples were examined using a Carl Zeiss Axio Imager M1 epifluorescence microscope (Carl Zeiss, Thornwood, NY, USA) and a Perkin Elmer spinning disc confocal microscope (Perkin Elmer, Waltham, MA, USA) at the Keck Biological Imaging Facility at the Whitehead Institute using the excitation at 405/40 nm, and the emission at 455 nm, respectively. Red chlorophyll a autofluorescence was imaged using the excitation at 505 nm and the emission at 615 nm. To estimate the relative abundances of EPS and cyanobacteria in the 20 to 35 μm thick biofilms, the confocal images were scaled to 256 gray levels and the sum of pixels was determined for pixels above the threshold values of 7 for EPS and 10 for Chl a, respectively. Clumps on a glass slide also were imaged using a multi-photon LSM710 confocal microscope with quasar spectral detection (Carl Zeiss, Thornwood, NY, USA) to detect Chl a autofluorescence (excitation at 543 nm and emission at 568 nm) and SYTOX® Green fluorescence (excitation at 488 nm and emission at 527 nm).

3.3. Measurements of Clump Spacing and Dispersal

Spacing among clumps in photographs and photomicrographs was determined as described in [42]. To examine cyanobacterial dispersal at different oxygen concentrations, liquid medium (Castenholz D) containing 1.2% agar was purged either with an anaerobic (90% N2, 5% CO2 and 5% H2) or an aerobic gas mixture (95% O2, and 5% CO2), respectively. The pH was subsequently adjusted to 7.5. The media containing 0 and 95% O2 were mixed to obtain a medium with an intermediate oxygen concentration (47.5% O2). Aliquots of all three media (1 mL) were added to the separate wells of 24-well Falcon plates (Becton Dickinson, Franklin Lakes, NJ, USA) and left to solidify. Samples of microbial mats were harvested less than two days after the appearance of clumps and dispersed by passing through a 3-mL syringe and an 18-gauge-needle. Clumps, identified by both the density and the orientation of filaments, were separated from the surrounding mat, placed on solidified agar, and then rapidly covered by 1 mL of identical medium. The overlying agar was cooled to 45 °C, and the samples were imaged under the microscope. The motility of filaments was quantified before and after the 2-hr incubation by measuring the distance from the center to the edge of each sample at 0, 45, 90, 135, 180, 225, 270 and 315° with respect to the center of the clump. The samples were incubated at 45 °C at 160 μE/m2s in a gas tight container containing an atmosphere of O2, 5% CO2 and the balance to 100% of N2. The atmosphere matched the O2 concentration of the sample (0%, 47.5%, and 95% O2). The effect of dissolved inorganic carbon (DIC) on the motility and clump dispersal was determined in a medium prepared under pure N2 gas, a medium prepared under 80% N2 and 20% CO2 and titrated by NaOH to pH 7.5 and media obtained by mixing of these two end-member media to contain 2.5%, 5%, and 12.5% CO2. All clump dispersal experiments investigated between 5 and 20 clumps per each condition and took place over 2 h. Given that this is shorter than the typical doubling times of clump-forming cyanobacteria in our laboratory enrichment cultures (~1 day), the observed motile responses could not be attributed to an increase in the number of filaments during the incubation. Because coniform mats in our cultures did not grow well in cultures limited by nitrate, we did not perform clumping and motility experiments in media lacking nitrate.

3.4. Measurements of Oxygen, Photosynthetic Activity and Glycolate

The concentration of oxygen in solid and liquid media was determined by a Clark-type oxygen microsensor with a 25 to 50 μm diameter tip and a low stirring sensitivity of <2% (OX-25 and OX-50, Unisense, Aarhus, Denmark) with a guard cathode [66]. Microsensors were connected to a picoampere meter (PA2000, Unisense, Aarhus, Denmark) and an A/D converter (Unisense, Aarhus, Denmark). Digitalized signals were transferred to a computer (SensorTrace BASIC). Microsensors were calibrated linearly according to manufacturer’s instructions, using air-saturated media and anoxic media purged by N2 and reduced by 0.1 M ascorbic acid.
Oxygen concentration in the liquid medium (e.g., Figure 2D) was measured at 1.5 cm above the diffusive boundary layer above the mat. Gross photosynthetic rates were measured using oxygen microelectrodes and the light-dark shift method [67]. The theory of this method is outlined briefly. After a prolonged illumination, the bacterial colony will attain a steady state oxygen concentration, when photosynthetic oxygen production balances the loss of oxygen to respiration and diffusion.
Geosciences 02 00235 i007
When the light is turned off, photosynthesis stops instantaneously, whereas diffusion and respiration are initially unchanged. Thus, the gross photosynthetic rate can be estimated from the decrease of oxygen concentration in the dark:
Geosciences 02 00235 i008
Measurements of the gross photosynthetic rate take into account oxygen production that is lost through photorespiration, but not the Mehler reaction [68]. These assumptions should be valid as long as the decrease in oxygen concentration is linear with time [69]. We measured the gross photosynthetic rate within ~5 s after the onset of dark conditions. Surfaces of clumps and mats were identified visually as points immediately above the surface of clumps and mats and quantitatively, as the lower boundary of the diffusive boundary layer where the oxygen concentration declined immediately when the light was shut down.
The effect of oxygen on gross photosynthetic activity was estimated in dispersed cell preparations (N = 10) and not in clumps, because the volumetric gross photosynthetic rate, as measured by use of oxygen microelectrode, strongly depends on the cell density at the tip of the electrode. Clumped mats were dispersed using a 3-mL syringe and 23-gauge-needle, the cells were spread onto a thick 1.5 μm glass microfiber filter (cat # 28297-978, VWR, West Chester, PA, USA). Gross oxygen production by dispersed samples was determined by the light-dark-shift method in liquid media that contained 154, 446, and 577 nmole/cm3 O2.
Net production of oxygen was quantified in 5 mm × 5 mm sections of a microbial mat with regularly spaced clumps. The sections were incubated in 7 mL serum bottles that were completely filled with media (N ≥5 bottles at each O2 concentration in the medium). Oxygen concentration in the liquid was measured immediately after inoculation and after a 1-h incubation at 45 °C at 160 μE/m2s. After the first 1-h incubation, each section was dispersed, spread onto a 1.5 μm glass microfiber filter and incubated for an additional 1 h. The dispersion and filtration processes did not measurably disrupt cells and release measurable quantities of Chl a. Net oxygen production by the dispersed samples was determined after 1 h and standardized by the Chl a content of each sample. Chlorophyll a was extracted by incubating samples in 7 mL of 90% acetone at 4 °C for one hour [70] and the absorbance of the extract was measured spectrophotometrically at 440 nm [71] using a Synergy 2 microplate reader (Biotek, Winooski, VT, USA). The accumulation of glycolate in the medium that contained 47.5% O2 was assayed after a 2-h incubation of intact and dispersed samples by a colorimetric method [72].

3.5. Statistical Treatments

Where the results are stated plus/minus some number, this number is the standard deviation. When comparing the outcomes of two different experimental conditions, we used one-sample T-test to determine the probability that the two outcomes are equal. These probabilities are stated as p < x. For example, p < 0.01 indicates that the probability of two samples being equal is smaller than 1%.

4. Conclusions

Environmental factors, including oxygen concentrations, influence the motile response of cyanobacteria in clumps and cones. Clumps contain more filaments and abandoned filament sheaths per unit surface area than the surrounding areas and clumped mats release less glycolate into the overlying solution. Fewer abandoned filament sheaths and bowed filaments are present in the areas around clumps. There, filaments are predominantly horizontal and align into dense bundles that bridge adjacent clumps and form ridges. Filaments in clumps are bent in three dimensions and motile, but can extend horizontally and abandon clumps under prolonged anaerobic conditions and in solutions that contain little dissolved inorganic carbon. When the concentration of O2 in the solution is ~200 nmole/cm3 or higher, most filaments bend and remain in clumps. Clumps can be spaced by ~mm and organized into hexagonal lattices over extensive horizontal areas, but are less regularly spaced in the presence of larger topographic features such as cones. The regular spacing is likely governed by the diffusion of chemicals produced by photosynthetically active areas. The tightly coupled oxygen and carbon cycles in clumps are beneficial to filamentous mat builders whose incorporation of inorganic carbon is sensitive to oxygen because clumped mats retain more soluble organic products of photorespiration. These observations inspire the use of mats that contain clumps, cones and ridges as records of photosynthesis by filamentous mat builders in the presence of oxygen. Millimeter-scale clumps preserved in some Archean and Proterozoic conical stromatolites, suggest that filamentous cyanobacteria exhibited similar behaviors for 2.7 billion years of Earth history.

Acknowledgments

We thank J. Dougherty of Geological Survey of Canada, J. Thompson, A. Maheras, J. Chen, D. Rothman, R. Summons, N. Beukes and members of the Bosak lab. T. B. was supported by NSF EAR-0843358, A.P.P. was supported by NASA Astrobiology Institute NNA08CN84A. Comments by K. Konhauser and three anonymous reviewers improved the manuscript.

References

  1. Raymond, J.; Segré, D. The effect of oxygen on biochemical networks and the evolution of complex life. Science 2006, 311, 1764–1767. [Google Scholar] [CrossRef]
  2. Bekker, A.; Holland, H.D.; Wang, P.L.; Rumble, D.; Stein, H.J.; Hannah, J.L.; Coetzee, L.L.; Beukes, N.J. Dating the rise of atmospheric oxygen. Nature 2004, 427, 117–120. [Google Scholar] [CrossRef]
  3. Konhauser, K.; Lalonde, S.; Planavsky, N.; Pecoits, E.; Lyons, T.; Mojzsis, S.; Rouxel, O.; Fralick, P.; Barley, M.; Kump, L.; et al. Aerobic bacterial pyrite oxidation and acid rock drainage during the Great Oxidation Event. Nature 2011, 478, 369–373. [Google Scholar] [CrossRef]
  4. Farquhar, J.; Zerkle, A.; Bekker, A. Gological constraints on the origin of oxygenic photosynthesis. Photosynth. Res. 2011, 107, 11–36. [Google Scholar] [CrossRef]
  5. Kopp, R.E.; Kirschvink, J.L.; Hilburn, I.A.; Nash, C.Z. The Paleoproterozoic snowball Earth: A climate disaster triggered by the evolution of oxygenic photosynthesis. Proc. Natl. Acad. Sci. USA 2005, 102, 11131–11136. [Google Scholar]
  6. Rasmussen, B.; Fletcher, I.R.; Brocks, J.J.; Kilburn, M.R. Reassessing the first appearance of eukaryotes and cyanobacteria. Nature 2008, 455, 1101–1104. [Google Scholar] [CrossRef]
  7. Eigenbrode, J.L.; Freeman, K.H. Late Archean rise of aerobic microbial ecosystems. Proc. Natl. Acad. Sci. USA 2006, 103, 15759–15764. [Google Scholar] [CrossRef]
  8. David, L.A.; Alm, E.J. Rapid evolutionary innovation during an Archean genetic expansion. Nature 2011, 469, 93–96. [Google Scholar] [CrossRef]
  9. Wang, M.; Jiang, Y.-Y.; Kim, K.M.; Qu, G.; Ji, H.F.; Mittenthal, J.E.; Zhang, H.-Y.; Caetano-Anollés, G. A universal molecular clock of protein folds and its power in tracing the early history of aerobic metabolism and planet oxygenation. Mol. Biol. Evol. 2011, 28, 567–582. [Google Scholar] [CrossRef]
  10. Bosak, T.; Knoll, A.H.; Petroff, A.P. The meaning of stromatolites. Annu. Rev. Earth Planet. Sci. 2012. in submission. [Google Scholar]
  11. Buick, R. The antiquity of oxygenic photosynthesis: Evidence from stromatolites in sulphate-deficient Archaean lakes. Science 1992, 255, 74–77. [Google Scholar]
  12. DesMarais, D.J. When did photosynthesis emerge on Earth? Science 2000, 289, 1703–1705. [Google Scholar]
  13. Flannery, D.T.; Walter, M.R. Archean tufted microbial mats and the Great Oxidation Event: New insights into an ancient problem. Austral. J. Earth Sci. 2012, 59, 1–11. [Google Scholar] [CrossRef]
  14. Tice, M.; Thornton, D.C.O.; Pope, M.C.; Olszewski, T.D.; Gong, Y. Early microbial communities. Annu. Rev. Earth Planet. Sci. 2011, 39, 297–319. [Google Scholar] [CrossRef]
  15. Walter, M.R. Archean Stromatolites–Evidence of the Earth’s Earliest Benthos. In Earth’s Earliest Biosphere: Its Origins and Evolution; Schopf, W.J., Ed.; Princeton University Press: Princeton, NJ, USA, 1983; pp. 187–213. [Google Scholar]
  16. Walter, M.R.; Bauld, J.; Brock, T.D. Siliceous algal and bacterial stromatolites in hot spring and geyser effluents of Yellowstone national park. Science 1972, 27, 402–405. [Google Scholar]
  17. Bosak, T.; Liang, B.; Sim, M.S.; Petroff, A.P. Morphological record of oxygenic photosynthesis in conical stromatolites. Proc. Natl. Acad. Sci. USA 2009, 106, 10939–10943. [Google Scholar]
  18. Bosak, T.; Bush, J.; Flynn, M; Liang, B.; Ono, S.; Petroff, A.P.; Sim, M.S. Formation and stability of oxygen-rich bubbles that shape photosynthetic mats. Geobiology 2010, 8, 45–55. [Google Scholar] [CrossRef]
  19. Mata, S.A.; Harwood, C.L.; Corsetti, F.A.; Stork, N.J.; Eilers, K.; Berelson, W.M.; Spear, J.R. Influence of gas production and filament orientation on stromatolite microfabric. Palaios 2012, 27, 206–219. [Google Scholar] [CrossRef]
  20. Murphy, M.A.; Sumner, D.Y. Tube structures of probable microbial origin in the Neoarchean Carrawine Dolomite, Hammersley Basin, Western Australia. Geobiology 2008, 6, 83–93. [Google Scholar]
  21. Hofmann, H.J. Archean Stromatolites as Microbial Archives. In Microbial Sediments; Riding, R.E., Awramik, S.M., Eds.; Springer-Verlag: Berlin, Germany, 2000; pp. 315–327. [Google Scholar]
  22. Schopf, J.W. Fossil evidence of Archaean life. Philos. Trans. R. Soc. B 2006, 361, 869–885. [Google Scholar] [CrossRef]
  23. Macalady, J.; McCauley, R.L.; Kakuk, B.; Schaperdoth, I. Extremely low-light adapted phototrophic biofilm community in a Bahamian blue hole. In Proceedings of Astrobiology Science Conference, Atlanta, GA, USA, 15–19 April 2012. Abstract Number 4043.
  24. Walter, M.R.; Bauld, J.; Brock, T.D. Microbiology and Morphogenesis of Columnar Stromatolites (Conophyton, Vacerrilla) from Hot Springs in Yellowstone National Park. In Developments in Sedimentology, Stromatolites; Walter, M.R., Ed.; Elsevier: Amsterdam, The Netherlands, 1976; pp. 273–310. [Google Scholar]
  25. Castenholz, R.W. The behavior of Oscillatoria terebriformis in hot springs. J. Phycol. 1968, 4, 132–139. [Google Scholar] [CrossRef]
  26. Richardson, L.L.; Castenholz, R. Chemokinetic motility responses of the cyanobacterium Osillatoria terebriformis. Appl. Environ. Microbiol. 1989, 55, 261–263. [Google Scholar]
  27. Castenholz, R.W.; Jorgensen, B.B.; D’Amelio, E.; Bauld, J. Photosynthetic and behavioral versatility of the cyanobacterium Oscillatoria boryana in a sulfide-rich microbial mat. FEMS Microbiol. Ecol. 1991, 86, 43–58. [Google Scholar] [CrossRef]
  28. Castenholz, R.W. Cyanobacteria. In Bergey’s Manual of Systematic Bacteriology, 2nd; Boone, D.R., Castenholz, R.W., Garrity, G.M., Eds.; Springer-Verlag: New York, NY, USA, 2001; Volume 1, pp. 473–599. [Google Scholar]
  29. Malin, G.; Walsby, A.E. Chemotaxis of a cyanobacterium on concentration gradient of carbon dioxide, bicarbonate, and oxygen. J. Gen. Microbiol. 1985, 131, 2643–2652. [Google Scholar]
  30. Mǿller, M.M.; Nielsen, L.P.; Jǿrgensen, B.B. Oxygen responses and mat formation by Beggiatoa spp. Appl. Environ. Microbiol. 1985, 50, 373–382. [Google Scholar]
  31. Gerdes, G. Structures left by Modern Microbial Mats in their Host Sediments. In Atlas of Microbial Mat Features Preserved within the Siliciclastic Rock Record; Schieber, J., Bose, P.K., Eriksson, P.G., Banerjee, S., Sarkar, S., Altermann, W., Catuneanu, O., Eds.; Elsevier: Amsterdam, The Netherlands, 2007; pp. 5–38. [Google Scholar]
  32. Browne, K.M.; Golubic, S.; Seong-Joo, L. Shallow Marine Microbial Carbonate Deposits. In Microbial Sediments; Riding, R.E., Awramik, S.M., Eds.; Springer-Verlag: Berlin, Germany, 2000; pp. 233–249. [Google Scholar]
  33. Weller, D.; Doemel, W.; Brock, T.D. Requirement of low oxidation-reduction potential for photosynthesis in a blue-green alga (Phormidium sp.). Arch. Microbiol. 1975, 104, 7–13. [Google Scholar] [CrossRef]
  34. Bosak, T.; Liang, B.; Wu, T.-D.; Templer, S.; Evans, A.; Vali, H.; Guerquin-Kern, J.-L.; Klepac-Ceraj, V.; Sim, M.S.; Mui, J. Cyanobacterial composition and activity in modern conical microbialites. Geobiology 2012. [Google Scholar]
  35. Zevenboom, W.; de Groot, G.J.; Mur, L.R. Effect of light on nitrate-limited Oscillatoria agardhii in chemostat cultures. Arch. Microbiol. 1980, 125, 59–65. [Google Scholar] [CrossRef]
  36. Van de Wall, D.B.; Verspagen, J.M.H.; Finke, J.F.; Vournazou, V.; Immers, A.K.; Kardinaal, W.E.A.; Tonk, L.; Becker, S; van Donk, E.; Visser, P.M.; et al. Reversal in competitive dominance of a toxic versus non-toxic cyanobacterium in response to rising CO2. ISME J. 2011, 5, 1438–1450. [Google Scholar] [CrossRef]
  37. McGregor, G.B.; Rasmussen, J.P. Cyanobacterial composition of microbial mats from an Australian thermal spring: A polyphasic evaluation. FEMS Microbiol. Ecol. 2007, 63, 23–35. [Google Scholar] [CrossRef]
  38. Schultze-Lam, S.; Ferris, F.G.; Sherwood-Lollar, B.; Gerits, J.P. Ultrastructure and seasonal growth patterns of microbial mats in a temperate climate saline-alkaline lake: Goodenough Lake, British Columbia, Canada. Can. J. Microbiol. 1996, 42, 147–161. [Google Scholar] [CrossRef]
  39. Kaplan, A.; Tarazi-Ronen, M.; Zer, H.; Schwarz, R.; Tchernov, D.; Bonfil, D.J.; Schatz, D.; Vardi, A.; Hassidim, M.; Reinhold, L. The inorganic carbon-concentrating mechanism in cyanobacteria: Induction and ecological significance. Can. J. Bot. 1998, 76, 917–924. [Google Scholar]
  40. Eisenhut, M.; Ruth, W.; Haimowich, M.; Bauwe, H.; Kaplan, A.; Hagemann, M. The photorespiratory glycolate metabolism is essential for cyanobacteria and might have been conveyed endosymbiontically to plants. Proc. Natl. Acad. Sci. USA 2008, 105, 17199–17204. [Google Scholar]
  41. Glud, R.N.; Ramsing, N.B.; Revsbech, N.P. Photosynthesis and photosynthesis-coupled respiration in natural biofilms quantified with oxygen microsensors. J. Phycol. 1992, 28, 51–60. [Google Scholar]
  42. Petroff, A.P.; Sim, M.S.; Maslov, A.; Krupenin, M.; Rothman, D.H.; Bosak, T. Biophysical basis for the geometry of conical stromatolites. Proc. Natl. Acad. Sci. USA 2010, 107, 9956–9961. [Google Scholar]
  43. Schulz, H.N.; Jǿrgensen, B.B. Big bacteria. Annu. Rev. Microbiol. 2001, 55, 105–137. [Google Scholar] [CrossRef]
  44. Shepard, R.N.; Sumner, D.Y. Undirected motility of cyanobacteria produces reticulate mats. Geobiology 2010, 8, 179–190. [Google Scholar] [CrossRef]
  45. Wall, D.; Kaiser, D. Alignment enhances the cell-to-cell transfer of the pilus phenotype. Proc. Natl. Acad. Sci. USA 1998, 95, 3054–3058. [Google Scholar] [CrossRef]
  46. Petroff, A.P.; Wu, T.-D.; Liang, B.; Mui, J.; Guerkin-Kern, J.-L.; Vali, H.; Rothman, D.H.; Bosak, T. Reaction-diffusion model of nutrient uptake in a biofilm: Theory and experiment. J. Theor. Biol. 2011, 289, 90–95. [Google Scholar] [CrossRef]
  47. Jǿrgensen, B.B.; DesMarais, D.J. The diffusive boundary layer of sediments: Oxygen microgradients over a microbial mat. Limnol. Oceanogr. 1990, 35, 1343–1355. [Google Scholar] [CrossRef]
  48. Villanueva, L.; del Campo, J.; Guerrero, R. Diversity and physiology of polyhydroxyalkanoate-producing and degrading strains in microbial mats. FEMS Microbiol. Ecol. 2010, 74, 42–54. [Google Scholar] [CrossRef] [Green Version]
  49. Dicks, J.M.; Aston, W.J.; Davis, D.; Turner, A.P.F. Mediated amperometric biosensor for D-galactose, glycolate, and L-amino acids based on ferrocene-modified carbon paste electrode. Anal. Chim. Acta 1986, 182, 103–112. [Google Scholar] [CrossRef]
  50. Nelson, D.C.; Jannasch, H.W. Chemoautotrophic growth of a marine Beggiatoa in sulfide gradient cultures. Arch. Microbiol. 1983, 136, 262–269. [Google Scholar] [CrossRef]
  51. Pierson, B.K.; Castenholz, R.W. A phototrophic gliding filamentous bacterium of hot springs, Chloroflexus aurantiacus, gen. and sp. nov. Arch. Microbiol. 1974, 100, 5–24. [Google Scholar] [CrossRef]
  52. Doemel, W.N.; Brock, T.D. Bacterial stromatolites: Origins of laminations. Science 1977, 184, 1083–1086. [Google Scholar]
  53. Gibson, J.; Pfennig, N.; Waterbury, J.B. Chloroherpeton thalassium gen. nov. et spec. nov., a non-filamentous, flexing and gliding green sulfur bacterium. Arch. Microbiol. 1984, 138, 96–101. [Google Scholar] [CrossRef]
  54. Hanada, S.; Hiraishi, A.; Shimada, K.; Matsuura, K. Chloroflexus aggregans sp. nov., a filamentous phototrophic bacterium which forms dense cell aggregates by active gliding movement. Int. J. Syst. Bacteriol. 1995, 145, 676–681. [Google Scholar]
  55. Hanada, S.; Shimada, K.; Matsuura, K. Active and energy-dependent rapid formation of cell aggregates in the thermophilic photosynthetic bacterium Chloroflexus aggregans. FEMS Microbiol. Lett. 2002, 208, 275–279. [Google Scholar] [CrossRef]
  56. Barbieri, R.; Cavalazzi, B. Microbial fabrics from Neogene cold seep carbonates, Northern Apennine, Italy. Palaeogeogr. Palaeoclim. Palaeoecol. 2005, 227, 143–155. [Google Scholar] [CrossRef]
  57. Fukui, M.; Teske, A.; Aßmus, B.; Muyzer, G.; Widdel, F. Physiology, phylogenetic relationships, and ecology of filamentous sulfate-reducing bacteria (genus Desulfonema). Arch. Microbiol. 1999, 172, 193–203. [Google Scholar] [CrossRef]
  58. Gerdes, G.; Klenke, T.; Noffke, N. Microbial signatures in peritidal siliciclastic sediments: A catalogue. Sedimentology 2000, 47, 279–308. [Google Scholar]
  59. Horodyski, R.J. Lyngbya mats at Laguna Mormona, Baja California, Mexico; comparison with Proterozoic stromatolites. J. Sed. Res. 1977, 47, 1305–1320. [Google Scholar]
  60. Park, R.K. The preservation potential of some recent stromatolites. Sedimentology 1977, 24, 485–506. [Google Scholar] [CrossRef]
  61. Vlasov, F.Y. Anatomy and Morphology of Stromatolites of the Early and Middle Proterozoic of the Southern Urals. In Materialy po Paleontologii Urala; UFIGiG AN SSSR: Sverdlovsk, Russia, 1970; pp. 152–175. [Google Scholar]
  62. Vlasov, F.Y. Precambrian Stromatolites from the Satka Formation of Southern Urals (in Russian). In Materialy po paleontologii Srednego Paleozoya Urala I, Sibiri; UrO AN SSSR: Sverdlovsk, Russia, 1977; pp. 101–124. [Google Scholar]
  63. Hofmann, H.J. New stromatolites from the Aphebian Mistassini Group, Quebec. Can. J. Earth Sci. 1978, 15, 571–585. [Google Scholar] [CrossRef]
  64. Maeda, H.; Ishida, N. Specificity of binding of hexopyranosyl polysaccharides with fluorescent brightener. J. Biochem. 1967, 62, 276–278. [Google Scholar]
  65. Hageage, G.J.; Harrington, B.J. Use of Calcofluor White in clinical mycology. Lab. Med. 1984, 15, 109–112. [Google Scholar]
  66. Revsbech, N.P. An oxygen microelectrode with a guard cathode. Limnol. Oceanogr. 1989, 34, 474–478. [Google Scholar] [CrossRef]
  67. Revsbech, N.P.; Jorgensen, B.B. Photosynthesis of benthic microflora measured with high spatial resolution by the oxygen microprofile method: Capabilities and limitations of the method. Limnol. Oceanogr. 1983, 28, 749–756. [Google Scholar] [CrossRef]
  68. Glud, R.N.; Ramsing, N.B.; Revsbech, N.P. Photosynthesis and photosynthesis-coupled respiration in natural biofilm quantified with oxygen microsensors. J. Phycol. 1992, 28, 51–60. [Google Scholar]
  69. Revsbech, N.P.; Jorgensen, B.B.; Brix, O. Primary production of microalgae in sediments measured by oxygen microprofile, H14CO3 fixation, and oxygen exchange methods. Limnol. Oceanogr. 1981, 26, 717–730. [Google Scholar] [CrossRef]
  70. Holm-Hansen, O.; Riemann, B. Chlorophyll a determination: Improvements in methodology. OIKOS 1978, 30, 438–447. [Google Scholar] [CrossRef]
  71. Waffenschmidt, S.; Knittler, M.; Jaenicke, L. Characterization of a sperm lysine of Volvox carteri. Sex. Plant Rep. 1990, 3, 1–6. [Google Scholar]
  72. Calkins, V. Microdetermination of glycolic and oxalic acids. Ind. Eng. Chem. Anal. Ed. 1943, 15, 762–763. [Google Scholar] [CrossRef]

