Review

Elemental Geochemistry, Paleoproductivity Variations and Their Controlling Factors of Lower Cambrian Organic-Rich Strata in the Tarim Basin


by
Mingxiao Sun
1,2,*,
Talgat Yensepbayev
1,
Ainura Zhanserkeyeva
1 and
Assylkhan Abylay
1
1
Geology and Oil-Gas Business Institute Named After K. Turyssov, Satbayev University, Almaty 050013, Kazakhstan
2
School of Energy and Architectural Engineering, Shandong Huayu University of Technology, Dezhou 253000, China
*
Author to whom correspondence should be addressed.
Geosciences 2026, 16(7), 258; https://doi.org/10.3390/geosciences16070258
Submission received: 5 May 2026 / Revised: 24 June 2026 / Accepted: 25 June 2026 / Published: 30 June 2026
(This article belongs to the Section Geochemistry)

Abstract

Marine source rocks in the Tarim Basin are generally highly mature to overmature, and conventional organic geochemical parameters may not fully reflect their original organic matter accumulation under such conditions. In this study, a comprehensive dataset including major elements, trace elements, and rare earth elements was used to systematically evaluate paleoproductivity variations, spatial distribution patterns, and geochemical controls of the Lower Cambrian (Є1) source rocks in the Tarim Basin. The results show that paleoproductivity in the Lower Cambrian source rocks exhibits clear stratigraphic and regional differentiation. Vertically, the lower intervals are characterized by relatively higher paleoproductivity, whereas the overlying intervals show a gradual decrease in productivity-related signals. Spatially, paleoproductivity in northwestern Tarim was generally higher and more variable than that in eastern Tarim, reflecting differences in depositional environments and material supply among different parts of the basin. These variations were jointly controlled by basin paleogeography, redox conditions, hydrothermal input, and terrigenous supply. Further analysis indicates that inorganic elements can provide complementary information on nutrient supply, export productivity, and organic matter preservation. Among these proxies, P and Ba and their excess indicators record enhanced nutrient availability and increased organic matter export, respectively; however, their variations may be decoupled from TOC because they are strongly influenced by redox conditions and post-depositional processes. In contrast, Ni, Cu, and Zn show relatively weaker enrichment but may better reflect the preserved organic matter component under reducing conditions. This study emphasizes that the application of inorganic geochemical proxies to highly mature marine source rocks requires integrated consideration of lithological heterogeneity, redox conditions, hydrothermal influence, terrigenous input, and diagenetic modification. This work represents a quantitative, data-based review and statistical reanalysis of published geochemical datasets.

1. Introduction

Lower Cambrian marine source rocks are widely developed worldwide and record an important stage in the redox evolution of early oceans [1,2]. Their unique paleobiological background and high organic matter enrichment make them important archives for studying paleoceanographic evolution and the genetic mechanisms of source rocks [3,4]. Because primary productivity and redox conditions in ancient oceans cannot be measured directly, they are commonly reconstructed indirectly using geochemical proxies [5,6].
A variety of geochemical proxies have been developed to reconstruct paleoproductivity, including organic geochemical methods such as biomarkers [7], total organic carbon (TOC) [8], compound-specific carbon and sulfur isotope analyses [9], and fluid inclusion analyses [10], as well as inorganic productivity-related proxies based on trace elements such as P, Ba, Ni, Cu, and Zn. Among these proxies, TOC is widely regarded as the most direct indicator of organic matter abundance because it reflects the amount of organic carbon preserved in present-day sediments. However, TOC is not necessarily equivalent to original primary productivity [11,12,13]. This limitation is particularly important for marine source rocks, which commonly experienced high thermal maturity. During thermal evolution, hydrocarbon generation, expulsion, and thermal cracking may reduce the original organic carbon content to varying degrees [14]. In addition, thermal maturation can selectively destroy or modify diagnostic biomarker compounds [15], thereby complicating their interpretation.
In recent years, inorganic geochemical proxies have been increasingly used as important complementary tools for evaluating paleoproductivity and organic matter enrichment in marine or highly mature source rocks, because they are generally less sensitive to thermal maturity [5,6,16] and are less easily altered under high-maturity or biodegraded conditions [17,18,19,20]. It should be noted that these elements can be used as productivity-related proxies because they participate in, or record, marine biological production and organic matter export. Phosphorus is an essential nutrient for biological growth, and its enrichment may indicate enhanced nutrient supply and potentially higher primary productivity [21]. Barium mainly records export productivity through the formation of biogenic barite during the sinking and decomposition of organic matter [22,23]. Ni, Cu, and Zn are trace metals required for the metabolism of marine microorganisms and algae, and they can also be incorporated into sediments during organic matter settling, complexation, and preservation [24]. Therefore, TOC and inorganic proxies are both related to organic matter enrichment and productivity processes, but they record different aspects of the system: TOC reflects the final preserved organic carbon, whereas P, Ba, Ni, Cu, and Zn record nutrient supply, export productivity, and element fixation processes. Two major potential source-rock intervals have been identified in the Tarim Basin, northwestern China: the Cambrian–Lower Ordovician (Є–O1) and the Middle–Upper Ordovician (O2–3) successions [25]. These source rocks are generally highly mature [26]. Among them, the Lower Cambrian Yuertusi Formation represents one of the most high-quality marine source rocks discovered in China, with TOC values reaching up to 29.8% [27]. These characteristics provide an ideal setting for applying inorganic geochemical proxies to paleoproductivity evaluation, because traditional organic geochemical signals in the basin are commonly altered or overprinted [28].
A large number of studies have used inorganic geochemical approaches to reconstruct the paleoceanographic conditions of the Lower Cambrian source rocks in the Tarim Basin [29,30]. For example, many studies have applied proxies such as V/Cr, Ni/Co, U/Th, and Mo–U covariation to suggest that the Yuertusi Formation was generally deposited under anoxic conditions and was characterized by relatively high paleoproductivity [31,32]. In addition, some studies have emphasized that hydrothermal activity and terrigenous input played important roles in elemental enrichment and further influenced organic matter accumulation [33,34]. However, previous studies have mostly focused on individual sections or local areas, and systematic comparisons of the applicability of different proxies in highly mature marine source rocks remain limited. Moreover, inconsistencies in normalization methods have led to variable interpretations.
Therefore, this study compiles geochemical data from multiple regions and stratigraphic intervals of the Lower Cambrian in the Tarim Basin to (1) characterize the distributions of productivity-related trace elements and their enrichment patterns; (2) evaluate the applicability and limitations of commonly used inorganic paleoproductivity proxies in highly mature marine source rocks; (3) reconstruct spatial and temporal variations in paleoproductivity; and (4) investigate the roles of basin configuration, redox conditions, hydrothermal activity, and terrigenous input in controlling paleoproductivity and organic matter enrichment.

2. Geological Setting and Data Source

2.1. Geological Setting

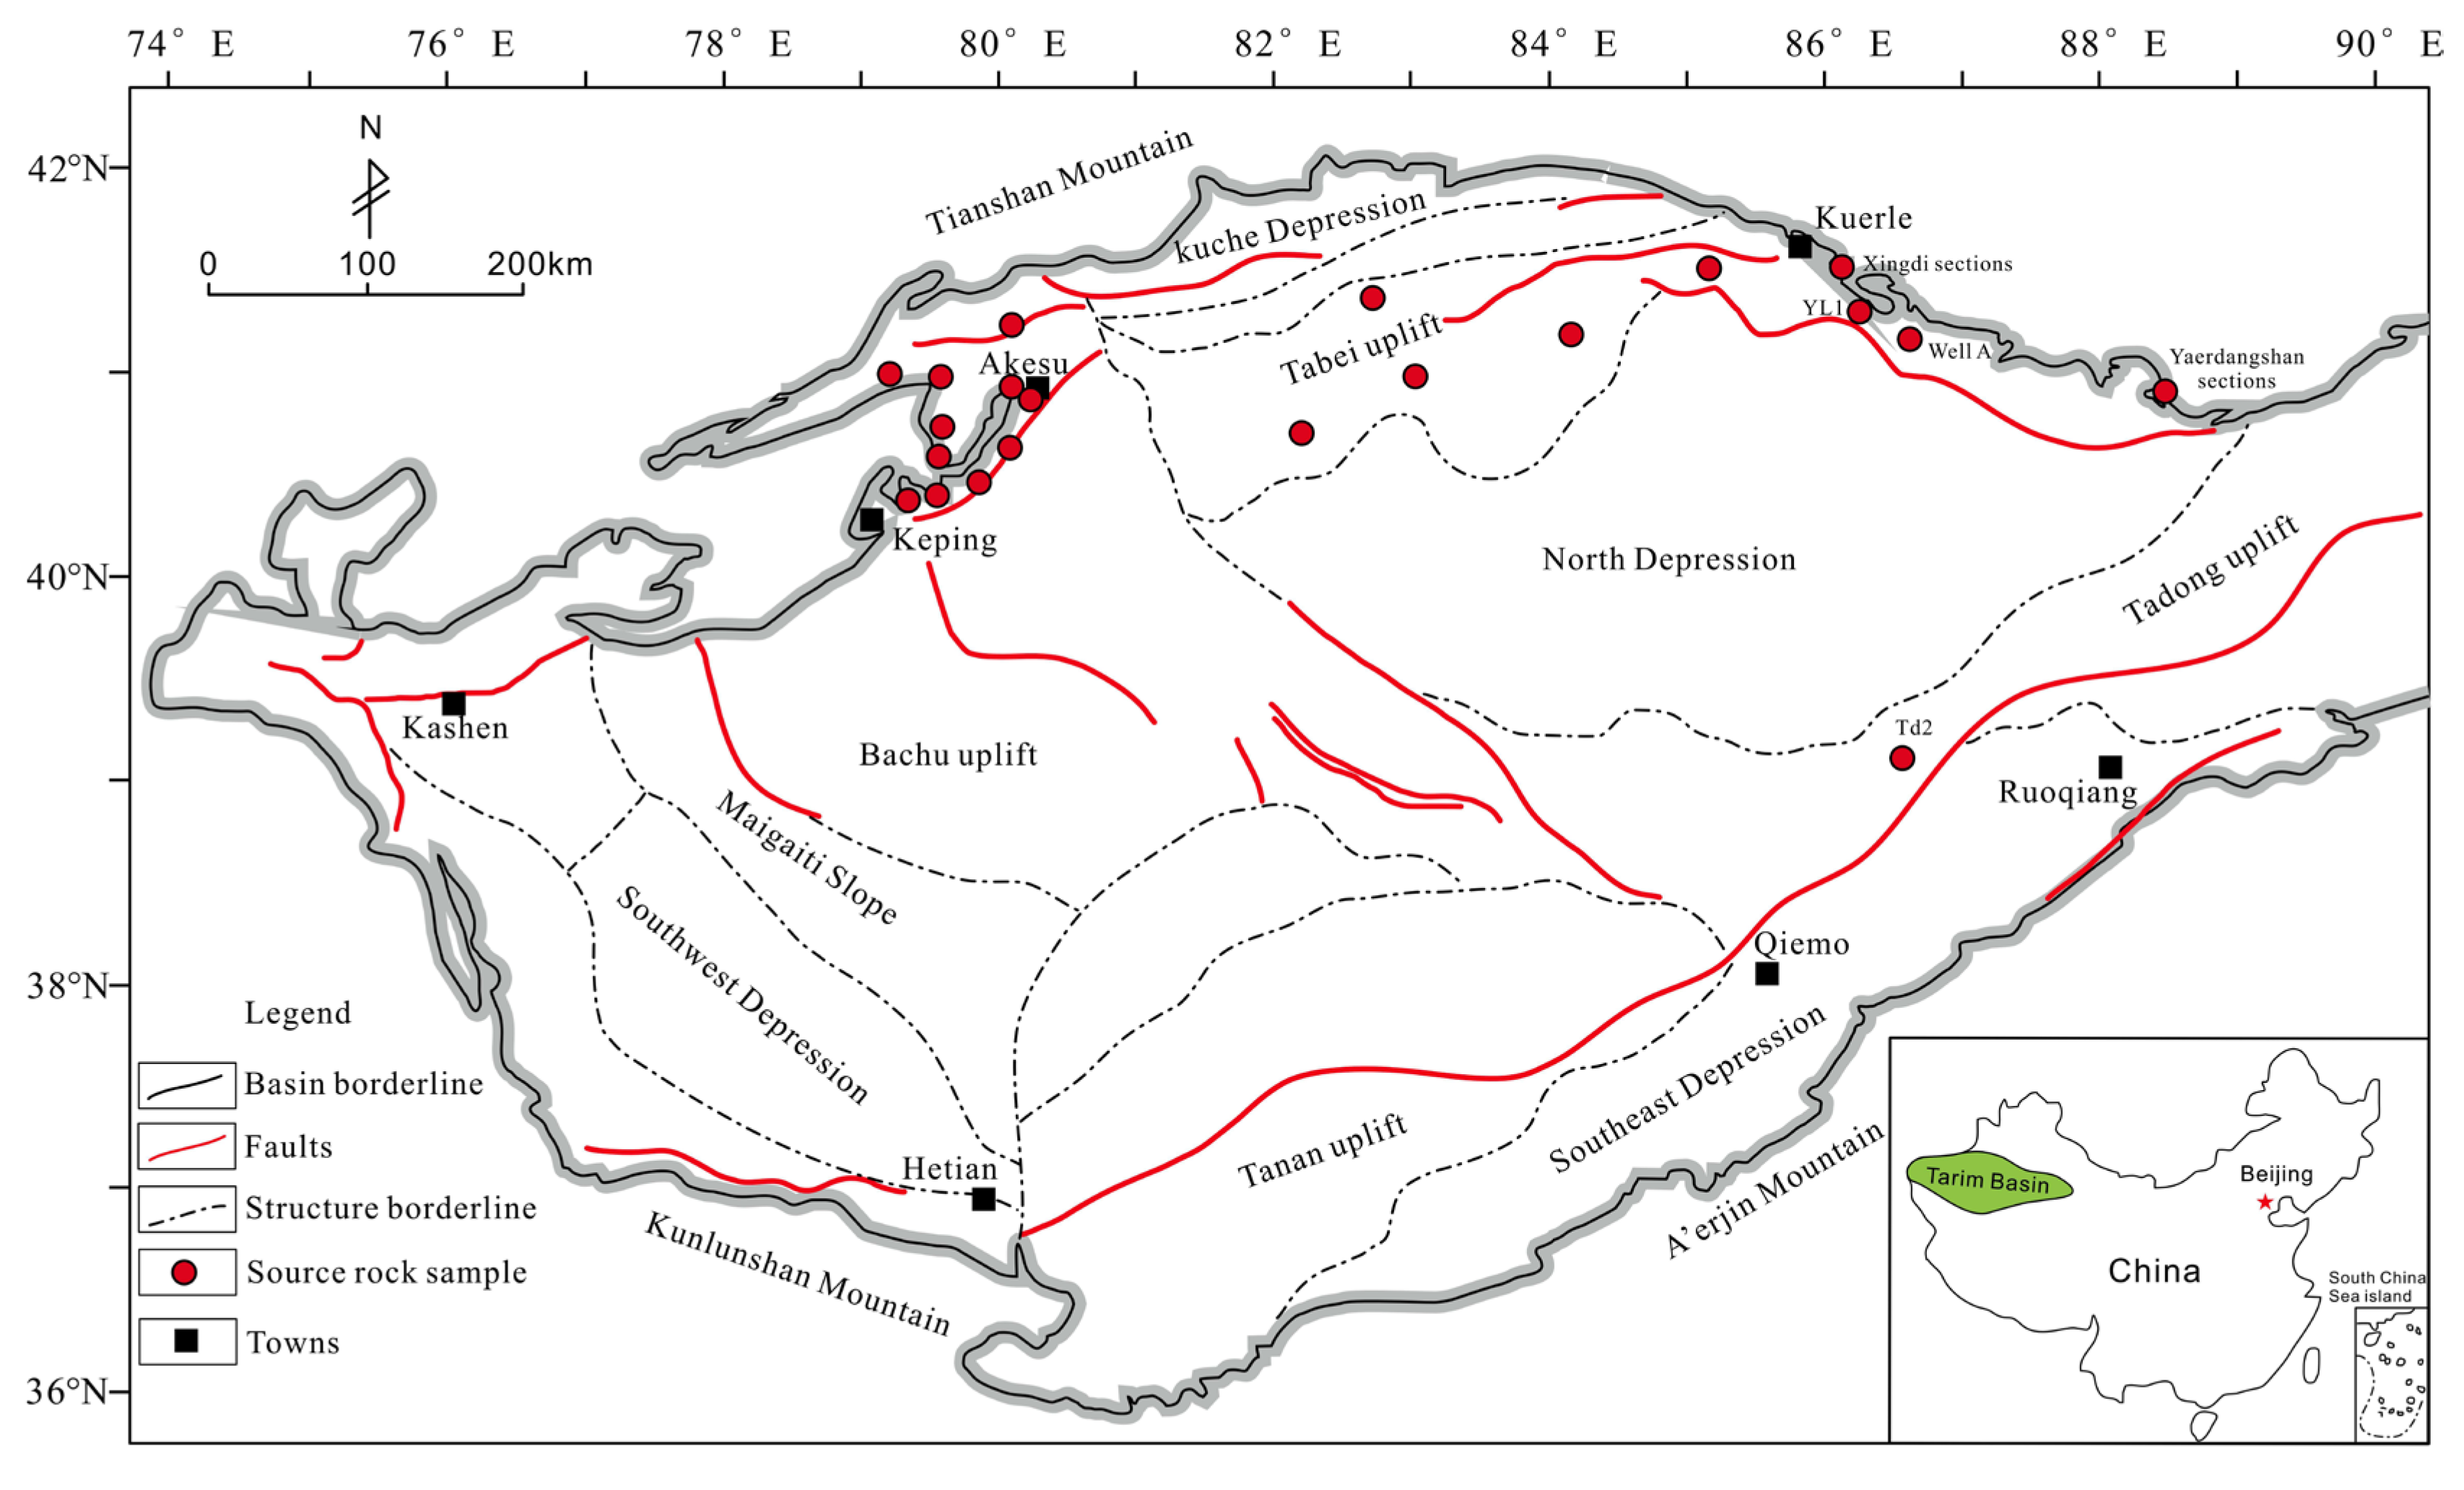
The Tarim Basin is formed by the superposition of the Paleozoic craton basin and the Mesozoic and Cenozoic foreland basin [35]. It is an important oil and gas basin in northwest China, with an area of approximately 560,000 km2 (Figure 1). Its tectonic evolution has gone through three main stages: the cratonization of the Precambrian, the development of passive continental margins in the Paleozoic, and the formation of foreland basins in the Mesocenozoic, resulting in the current tectonic pattern characterized by multiple uplifts and depressions [36,37]. The Paleozoic Craton Basin was mainly composed of Sinian-Permian Marine sediments. The thickness of the Sinian–Ordovician Marine carbonate rock sequence in sedimentary centers such as the Mangar Depression exceeded 7 km [38]. During the Neoproterozoic era, the splitting of the Rodinia supercontinent and the confluence of Gondwana triggered frequent hydrothermal activities [39], resulting in extensive anoxic-sulfide environments and fluctuations in Marine chemistry [40]. This environment, combined with the Cambrian explosion, promoted the massive accumulation of organic matter [41], creating highly favorable conditions for the deposition of the crucial marine source rocks in Tarim Basin [42,43].
The main stratigraphic units of the Lower Cambrian (Є1) source rocks in the Tarim Basin are listed in Table 1. These source rocks are mainly composed of dark gray to black siliceous shale, siliceous mudstone, calcareous shale, and carbonate rocks. Among them, the Yuertusi Formation (Є1y) represents the core interval of this source-rock system [27]. Depositional facies vary from a deep-water slope–basin setting in eastern Tarim to a carbonate platform setting in northern Tarim, resulting in pronounced lithological heterogeneity [29,44]. Thick deep-water siliceous rocks and mudstones were deposited in the deep-water slope–basin setting of eastern Tarim, whereas the northern Tarim area is characterized by ramp and carbonate platform environments, with medium- to thick-bedded dolostones, calcareous mudstones, and mudstones being widely developed [45]. At present, these source rocks have generally reached a high- to overmature stage, with vitrinite reflectance (Ro%) exceeding 2.0 [46].

2.2. Data Sources and Methods

A total of 529 sample records containing trace-element datasets of Lower Cambrian source rocks were compiled from previous studies and classified according to geographic location and stratigraphic unit (Table 2). The dataset was compiled from published studies using comparable analytical techniques, mainly ICP-MS. Only samples with clear stratigraphic attribution and reliable geochemical data were included, whereas obvious outliers and data with large analytical uncertainties were excluded. Because not all published studies reported the same set of geochemical parameters, the number of samples available for different proxies varies. All calculations and statistical analyses were therefore performed using the maximum number of samples available for each proxy.
The compiled dataset (provided in Table S1 in the Supplementary Materials) includes organic-rich shale, siliceous shale, siliceous rock, carbonaceous shale, and dolostone. Such lithological heterogeneity may affect the absolute concentrations of trace elements. Therefore, productivity interpretations were based on the combined evaluation of bulk elemental concentrations, normalized proxies, TOC, and lithological information.
Al and Ti are commonly used as detrital proxies because of their low seawater concentrations and dominant association with terrigenous clastic minerals [57]. In this study, Ti was selected as the main detrital correction element because it is generally conservative during weathering, transport, diagenesis, and thermal maturation [17]. The authigenic or excess fraction of element X was calculated as follows:
Xxs = Xtotal − Ti × (X/Ti)PAAS
where Xxs represents the excess fraction of element X, Xtotal is the measured concentration of element X, Ti is the measured Ti concentration of the sample and (X/Ti)PAAS is the corresponding element-to-Ti ratio in PAAS.
REE parameters were mainly used to constrain depositional environmental characteristics and potential redox conditions [58]. The PAAS-normalized concentration of element X was calculated as follows:
(LREE/HREE)N ratio = [(La + Ce + Pr + Nd + Sm + Eu)/(Gd + Tb + Dy + Ho + Er + Tm + Yb + Lu)]sample/[(La + Ce + Pr + Nd + Sm + Eu)/(Gd + Tb + Dy + Ho + Er + Tm + Yb + Lu)]PAAS,
Eu anomaly:
Eu/Eu * = [Eusample/EuPAAS]/[(Smsample/SmPAAS) × (Gdsample/GdPAAS)]0.5,
Ce anomaly:
Ce/Ce * = [Cesample/CePAAS]/[(Lasample/LaPAAS) × (Prsample/PrPAAS)]0.5,
enrichment factors (EFs) [59] were used to evaluate the degree of elemental enrichment relative to detrital background. They were calculated using the following equation:
XEF = [(X/Al) sample/(X/Al)PAAS],
where X (ppm) and Al (wt.%) represent their weight contents, respectively.

3. Paleoproductivity Variations in the Lower Cambrian Source Rocks

The bulk geochemical characteristics of the compiled Lower Cambrian source-rock dataset are summarized in Table 3. The statistical results of enrichment factors and excess fractions for productivity-related elements are summarized in Table 4. The results indicate pronounced spatial heterogeneity among northwestern, northern, and eastern Tarim, together with clear stratigraphic variations between different Lower Cambrian formations.

3.1. Stratigraphic Variations

TOC and productivity-related proxies of the Lower Cambrian source rocks in the Tarim Basin show clear vertical variations in all three regions, with higher values in the lower intervals than in the overlying intervals. Meanwhile, the elemental enrichment patterns between the lower and upper intervals within the same region are generally consistent, and the differences are mainly reflected by decreased enrichment intensity and reduced data dispersion.
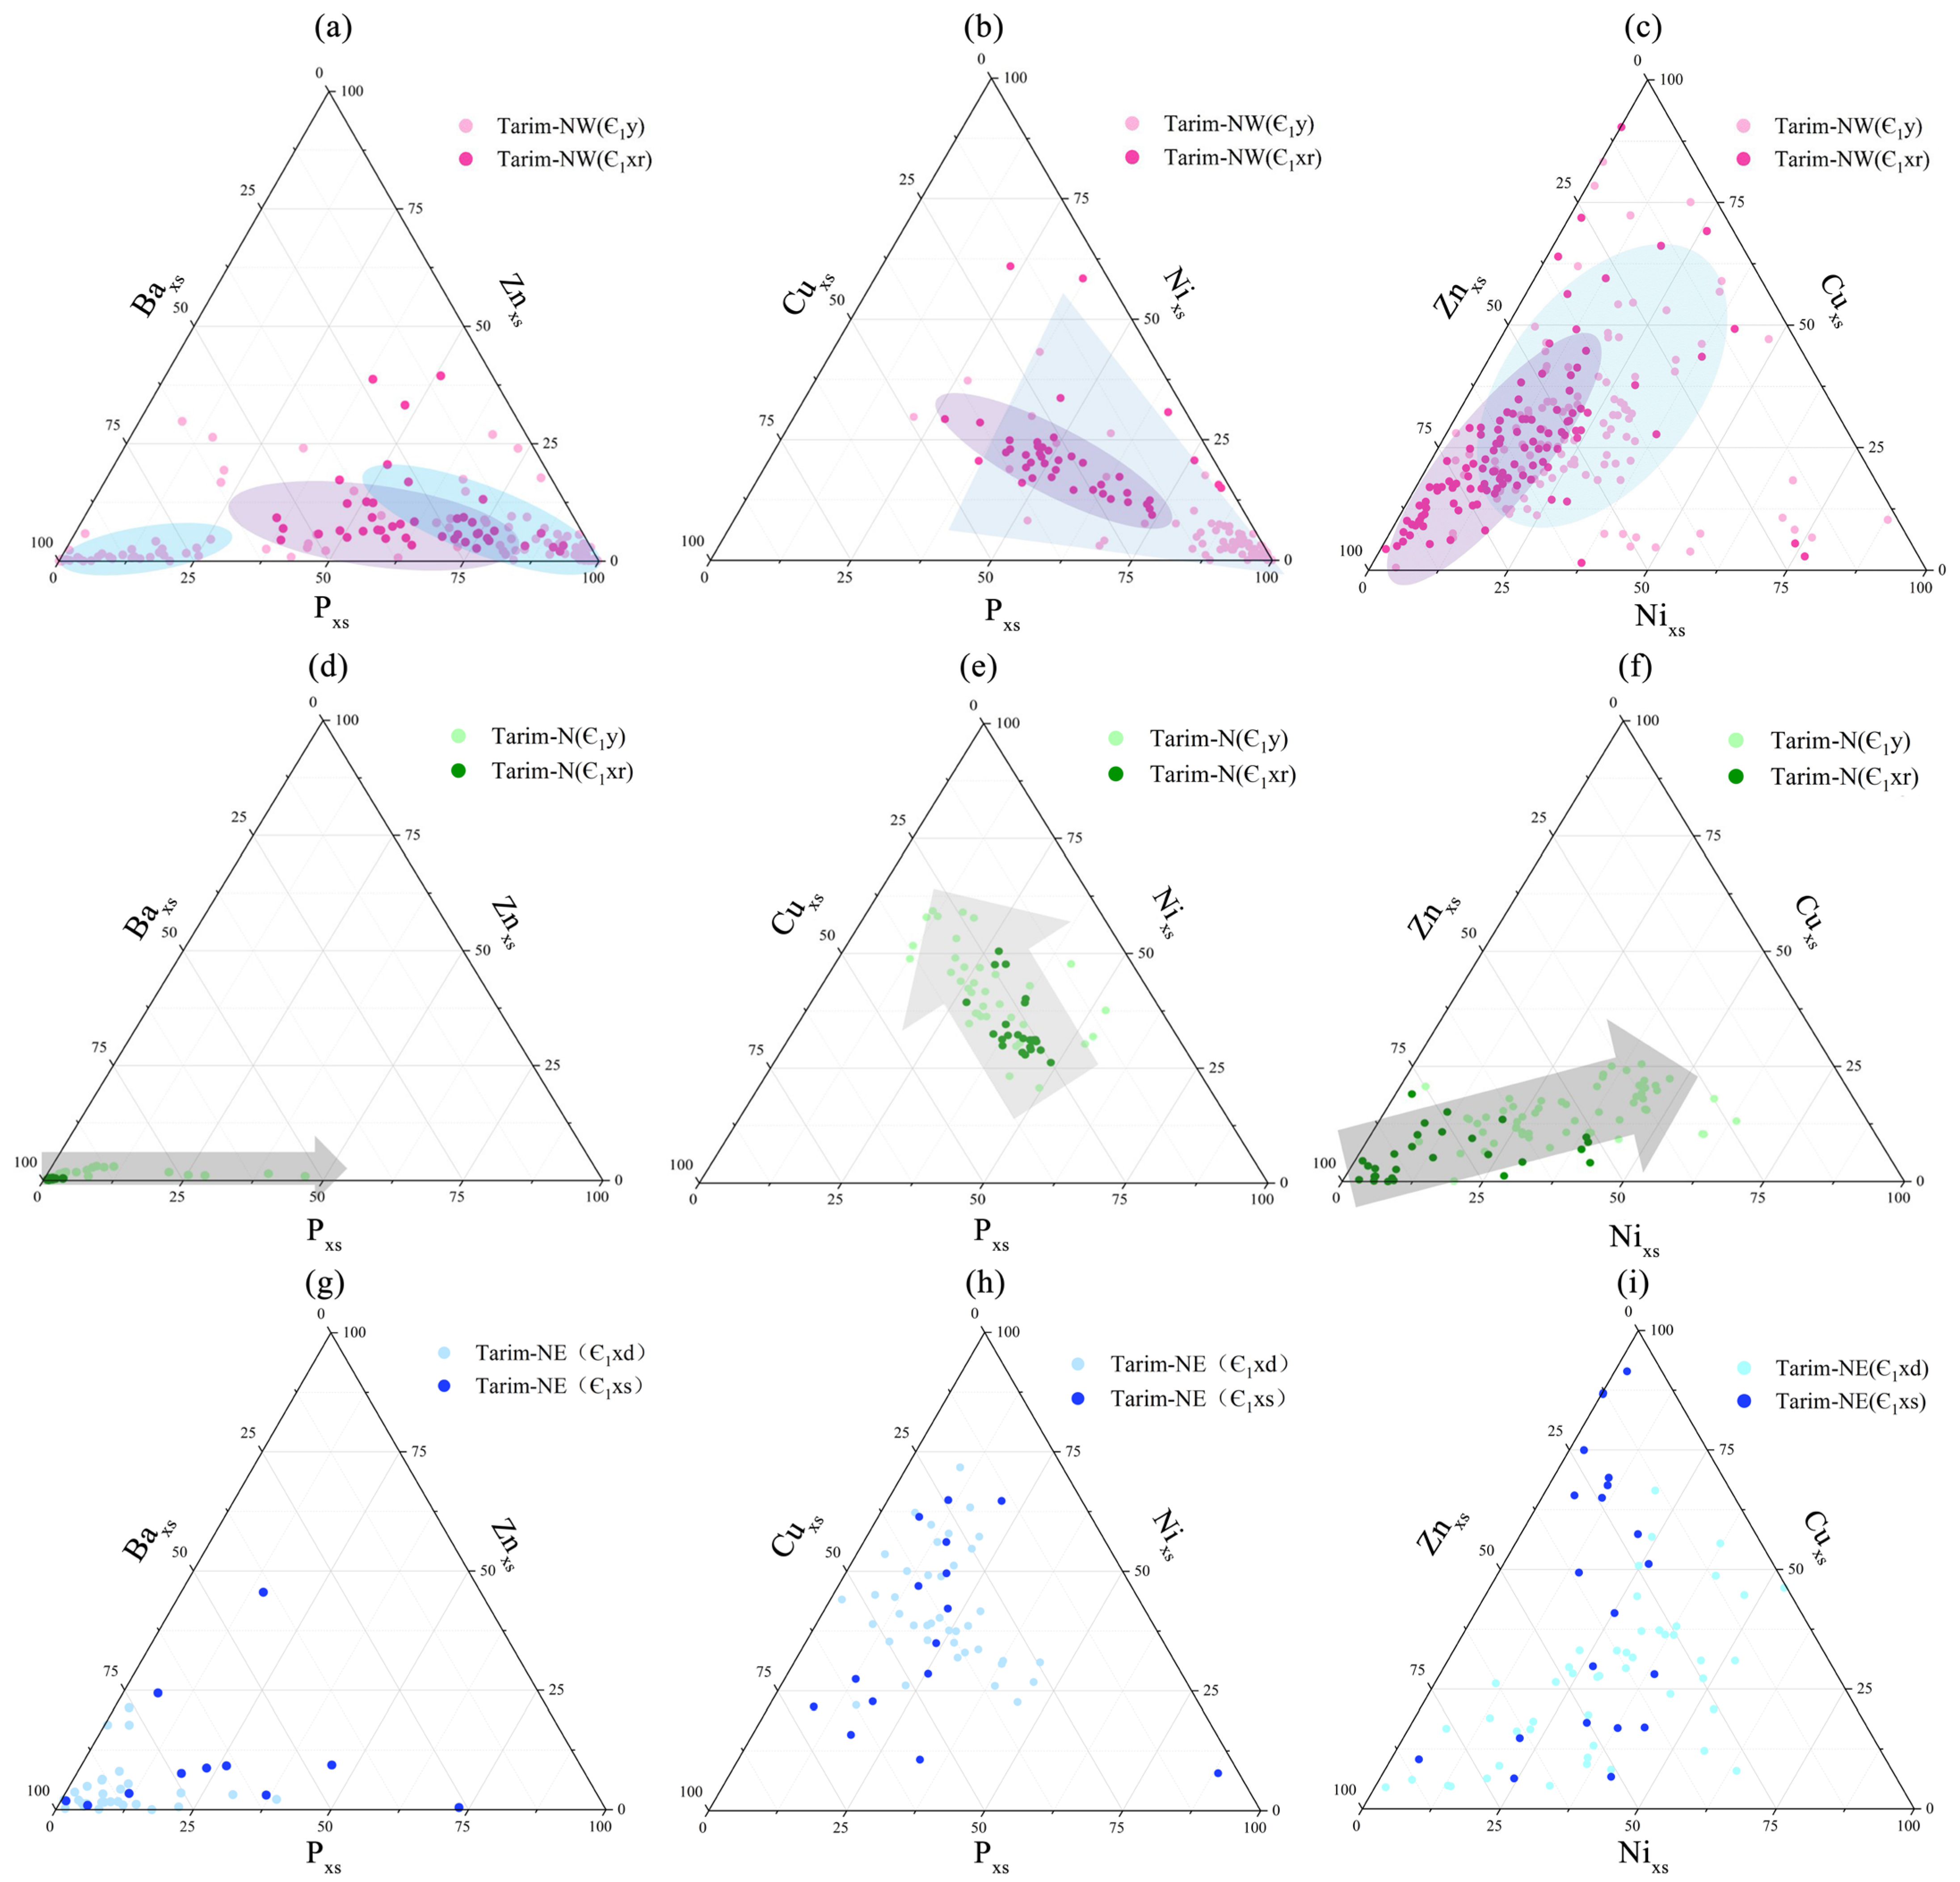
In Tarim-NW, the TOC content of the Yuertusi Formation ranges from 0.03% to 22.6%, with an average of 4.19%, whereas the overlying Xiaoerbulake Formation shows lower TOC values of 0.01–5.24%, with an average of 0.91%. In addition, multiple paleoproductivity proxies, including Pxs, Nixs, Cuxs, Znxs, and Baxs, are generally higher in the Yuertusi Formation than in the Xiaoerbulake Formation, and they also show greater dispersion and more frequent extremely high values. The ternary diagrams for northwestern Tarim (Figure 2a–c) show that the Yuertusi Formation data points are highly scattered and strongly approach the Pxs and Baxs end-members, indicating a high-P and high-Ba enrichment pattern. The relative proportions of Znxs, Cuxs, and Nixs also fluctuate strongly. In contrast, the Xiaoerbulake Formation shows a clearly more convergent data distribution. In the P–Ni–Cu and P–Ba–Zn ternary diagrams, the Xiaoerbulake Formation generally shifts away from the extremely high Pxs and Baxs fields, indicating weakened enrichment intensity and a relative shift in the enrichment trend toward the trace metals Cu and Zn.
It should be noted that the enrichment factors (EFs) of the Xiaoerbulake Formation in northwestern Tarim are generally higher than those of the Yuertusi Formation. However, this pattern is mainly caused by the abnormally low Al contents of the Xiaoerbulake Formation, which amplify element/Al ratios. In contrast, excess fractions (xs) can more effectively reduce the influence of detrital input and are therefore more reliable for cross-stratigraphic comparisons.
Northern Tarim also shows a clear upward decreasing trend. The TOC content of the Yuertusi Formation ranges from 0.27% to 9.84%, with an average of 2.97%, which is markedly higher than that of the overlying Xiaoerbulake Formation, ranging from 0.22% to 0.58% with an average of 0.40%. The two formations also show a certain continuity in enrichment patterns (Figure 2d–f). The Yuertusi Formation samples are strongly shifted toward the Baxs end-member and display a broad lateral distribution along the base of the ternary diagrams, with an additional shift toward the Pxs end-member. In contrast, the Xiaoerbulake Formation samples are mainly concentrated toward the Baxs end-member, with very low Pxs contents.
In the Cuxs–Pxs–Nixs ternary diagram, the Yuertusi Formation shows a wider and more scattered distribution than the Xiaoerbulake Formation. In the Znxs–Nixs–Cuxs ternary diagram, the Xiaoerbulake Formation samples are tightly clustered near the Znxs end-member, indicating a highly uniform enrichment pattern. By contrast, the Yuertusi Formation samples extend from the Znxs end-member along the base of the diagram toward the Nixs end-member, forming a broad belt-like distribution.
In Tarim-E, the Xishanbulake Formation has TOC values of 0.08–10.21% with an average of 2.03%, higher than those of the Xidashan Formation, which range from 0.06% to 2.12% with an average of 1.01%. The Xishanbulake Formation shows higher values than the overlying Xidashan Formation for all excess-fraction proxies, accompanied by more frequent extreme anomalies. In eastern Tarim, the EF and xs proxies of the Xishanbulake and Xidashan formations are generally consistent, indicating that the problem does not lie in the failure of the EF method itself, but rather in its sensitivity to the background concentration of the reference element. When Al contents are abnormally low, EF values can be systematically amplified; therefore, their paleoproductivity significance should be interpreted with caution.
The enrichment patterns of the two formations in eastern Tarim are more consistent than those in northwestern Tarim (Figure 2g–i). Both formations are characterized by Ba-dominated enrichment. However, unlike the northwestern Tarim samples, the eastern Tarim samples generally show a mixed and scattered distribution in the ternary diagrams. Median and average values also indicate that the difference in enrichment intensity between the two formations is relatively small.

3.2. Regional Variations

To reveal regional differences in paleoproductivity among the Lower Cambrian source rocks in the Tarim Basin, the Yuertusi Formation in northwestern Tarim and the Xishanbulake Formation in eastern Tarim were selected as representative lower intervals, whereas the Xiaoerbulake Formation in northwestern Tarim and the Xidashan Formation in eastern Tarim were selected as representative upper intervals for comparison.
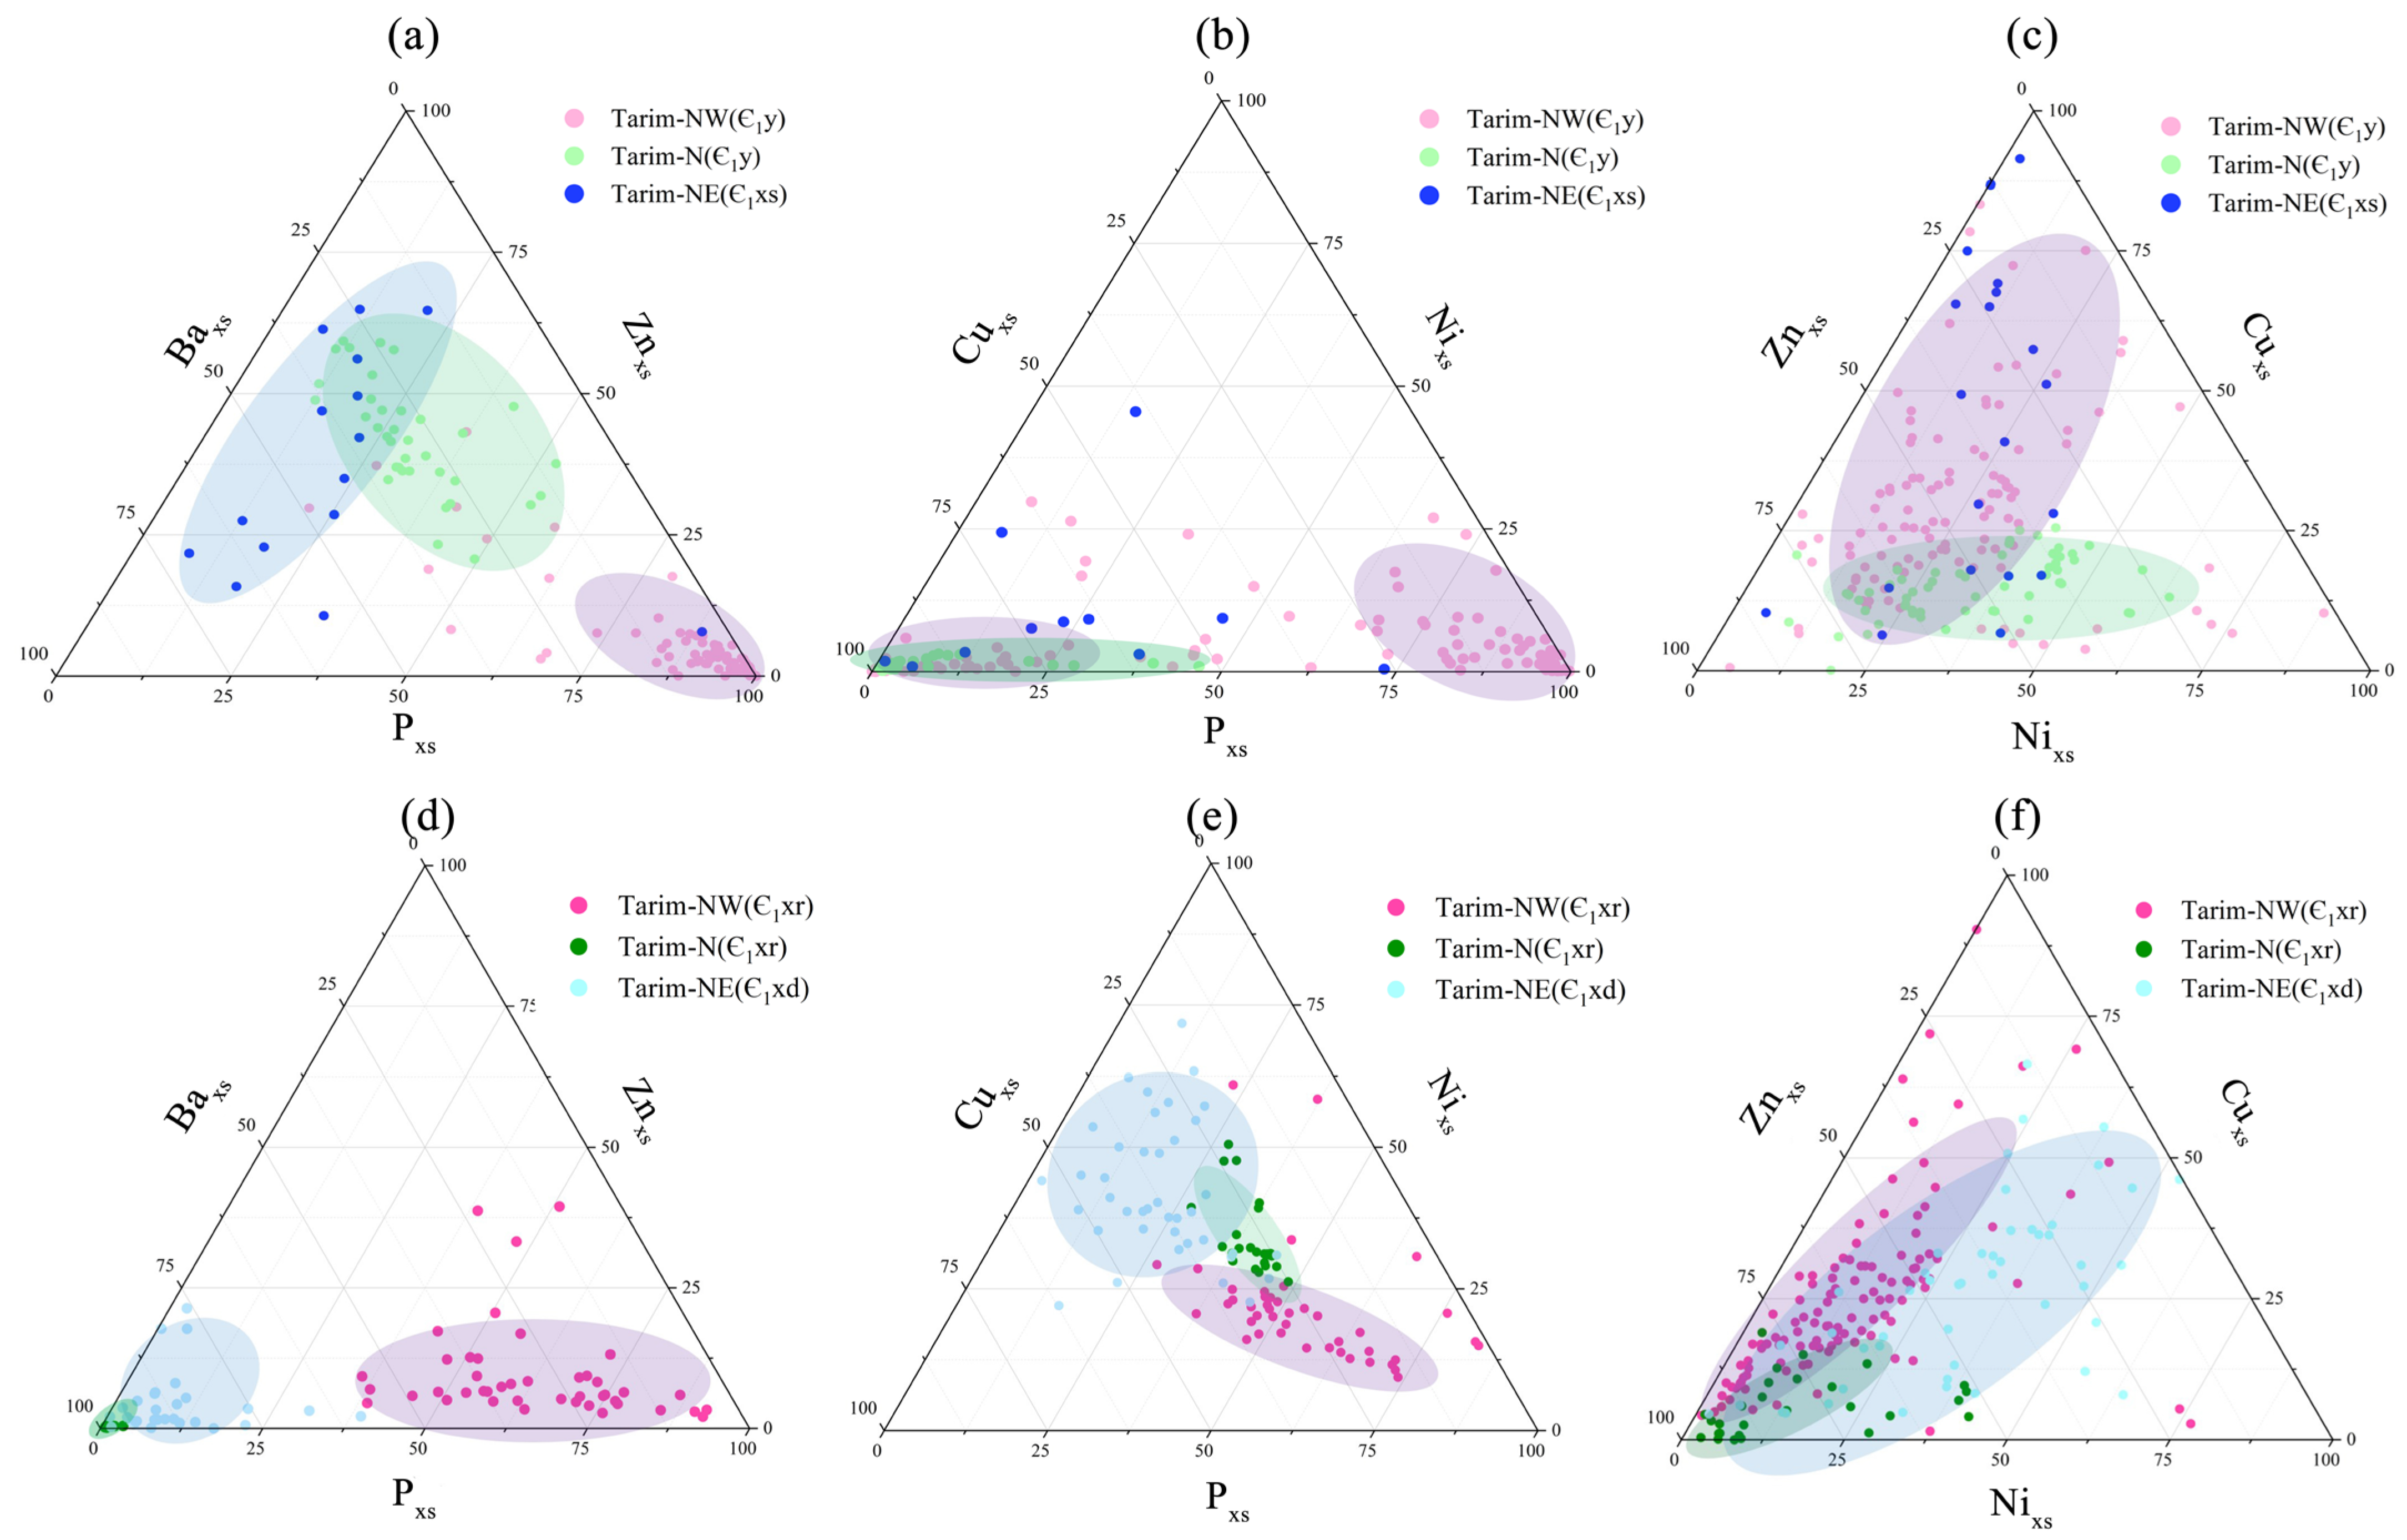
As shown in Table 4 and Figure 3, productivity-related proxies in the Lower Cambrian source rocks of the Tarim Basin exhibit clear regional differences, but these differences cannot be simply described as “higher in the west and lower in the east.” In the lower intervals, the average TOC content of the Yuertusi Formation in northwestern Tarim is 4.19%, markedly higher than that of the Xishanbulake Formation in eastern Tarim (2.03%). The average and median values of Pxs are also higher in the Yuertusi Formation than in the Xishanbulake Formation. In contrast, Ba-related proxies show a different pattern. Although the Yuertusi Formation has a higher average Baxs value, its median value is only 121.86 ppm, which is lower than that of the Xishanbulake Formation (836.00 ppm). Meanwhile, both the average and median values of Nixs and Cuxs are higher in the Xishanbulake Formation than in the Yuertusi Formation. Figure 3 shows that the Yuertusi Formation is mainly characterized by Pxs enrichment and a few extremely high Baxs values, whereas the Xishanbulake Formation is characterized by relatively high Baxs values, together with moderate enrichment of Cuxs and Nixs. Overall, the regional differences in the lower intervals are mainly expressed as higher TOC and Pxs in northwestern Tarim, but higher Baxs and some trace-metal proxies in eastern Tarim.
In the upper intervals, the Xiaoerbulake Formation in northwestern Tarim and the Xidashan Formation in eastern Tarim have similar average TOC contents, at 0.91% and 1.01%, respectively, and their Pxs values are also relatively close. However, Nixs, Cuxs, Znxs, and Baxs are all higher in the Xidashan Formation than in the Xiaoerbulake Formation. In particular, the median Baxs value increases from 12.50 ppm in the Xiaoerbulake Formation to 804.96 ppm in the Xidashan Formation. Figure 3 shows that the Xiaoerbulake Formation generally has weak enrichment, with some samples showing Znxs and Cuxs enrichment, whereas the Xidashan Formation is characterized by combined enrichment of Baxs, Cuxs, and Znxs. Overall, in the upper intervals, eastern Tarim shows higher enrichment in Ba and some trace-metal proxies.
From the lower to the overlying intervals, the magnitude of stratigraphic change differs markedly between northwestern and eastern Tarim. In northwestern Tarim, the transition from the Yuertusi Formation to the Xiaoerbulake Formation is accompanied by a sharp decrease in most productivity-related proxies. The average TOC content decreases by approximately 78.3%, while the median values of Pxs, Nixs, Cuxs, Znxs, and Baxs decrease by approximately 96.4%, 91.1%, 89.3%, 85.7%, and 89.7%, respectively. This overall and relatively synchronous decrease suggests that northwestern Tarim experienced a pronounced environmental transition during Lower Cambrian deposition, from a high-productivity and strongly enriched system to a low-productivity and weakly enriched background.
In contrast, the transition from the Xishanbulake Formation to the Xidashan Formation in eastern Tarim shows much smaller changes. The average TOC content decreases by approximately 50.7%, while the median values of Pxs, Nixs, Cuxs, and Znxs decrease by approximately 39.6%, 45.5%, 67.7%, and 54.5%, respectively. The median Baxs value decreases by only about 3.7%. This indicates that although paleoproductivity-related signals also decrease upward in eastern Tarim, the overall change is less abrupt, suggesting a more gradual environmental evolution. This difference is also supported by the ternary diagrams. The lower and upper intervals in northwestern Tarim are more clearly separated, with a distinct shift in clustering centers, whereas those in eastern Tarim show greater overlap and transitional distributions, making the stratigraphic boundary less distinct in terms of elemental enrichment patterns.

3.3. Relationships Between TOC and Productivity-Related Elements

TOC is the most direct indicator for evaluating organic matter abundance in source rocks. However, thermal maturation and hydrocarbon generation and expulsion may modify present-day TOC and some organic matter signals, thereby affecting the relationship between TOC and inorganic productivity-related proxies. In contrast, inorganic elements such as P, Ba, Cu, Ni, and Zn can provide complementary information on nutrient supply, organic matter export, trace-metal fixation, and preservation conditions. Therefore, analyzing the correlations between TOC and productivity-related elements helps to evaluate the coupling between different inorganic proxies and organic matter enrichment, and further identify the geochemical processes recorded by different proxies.
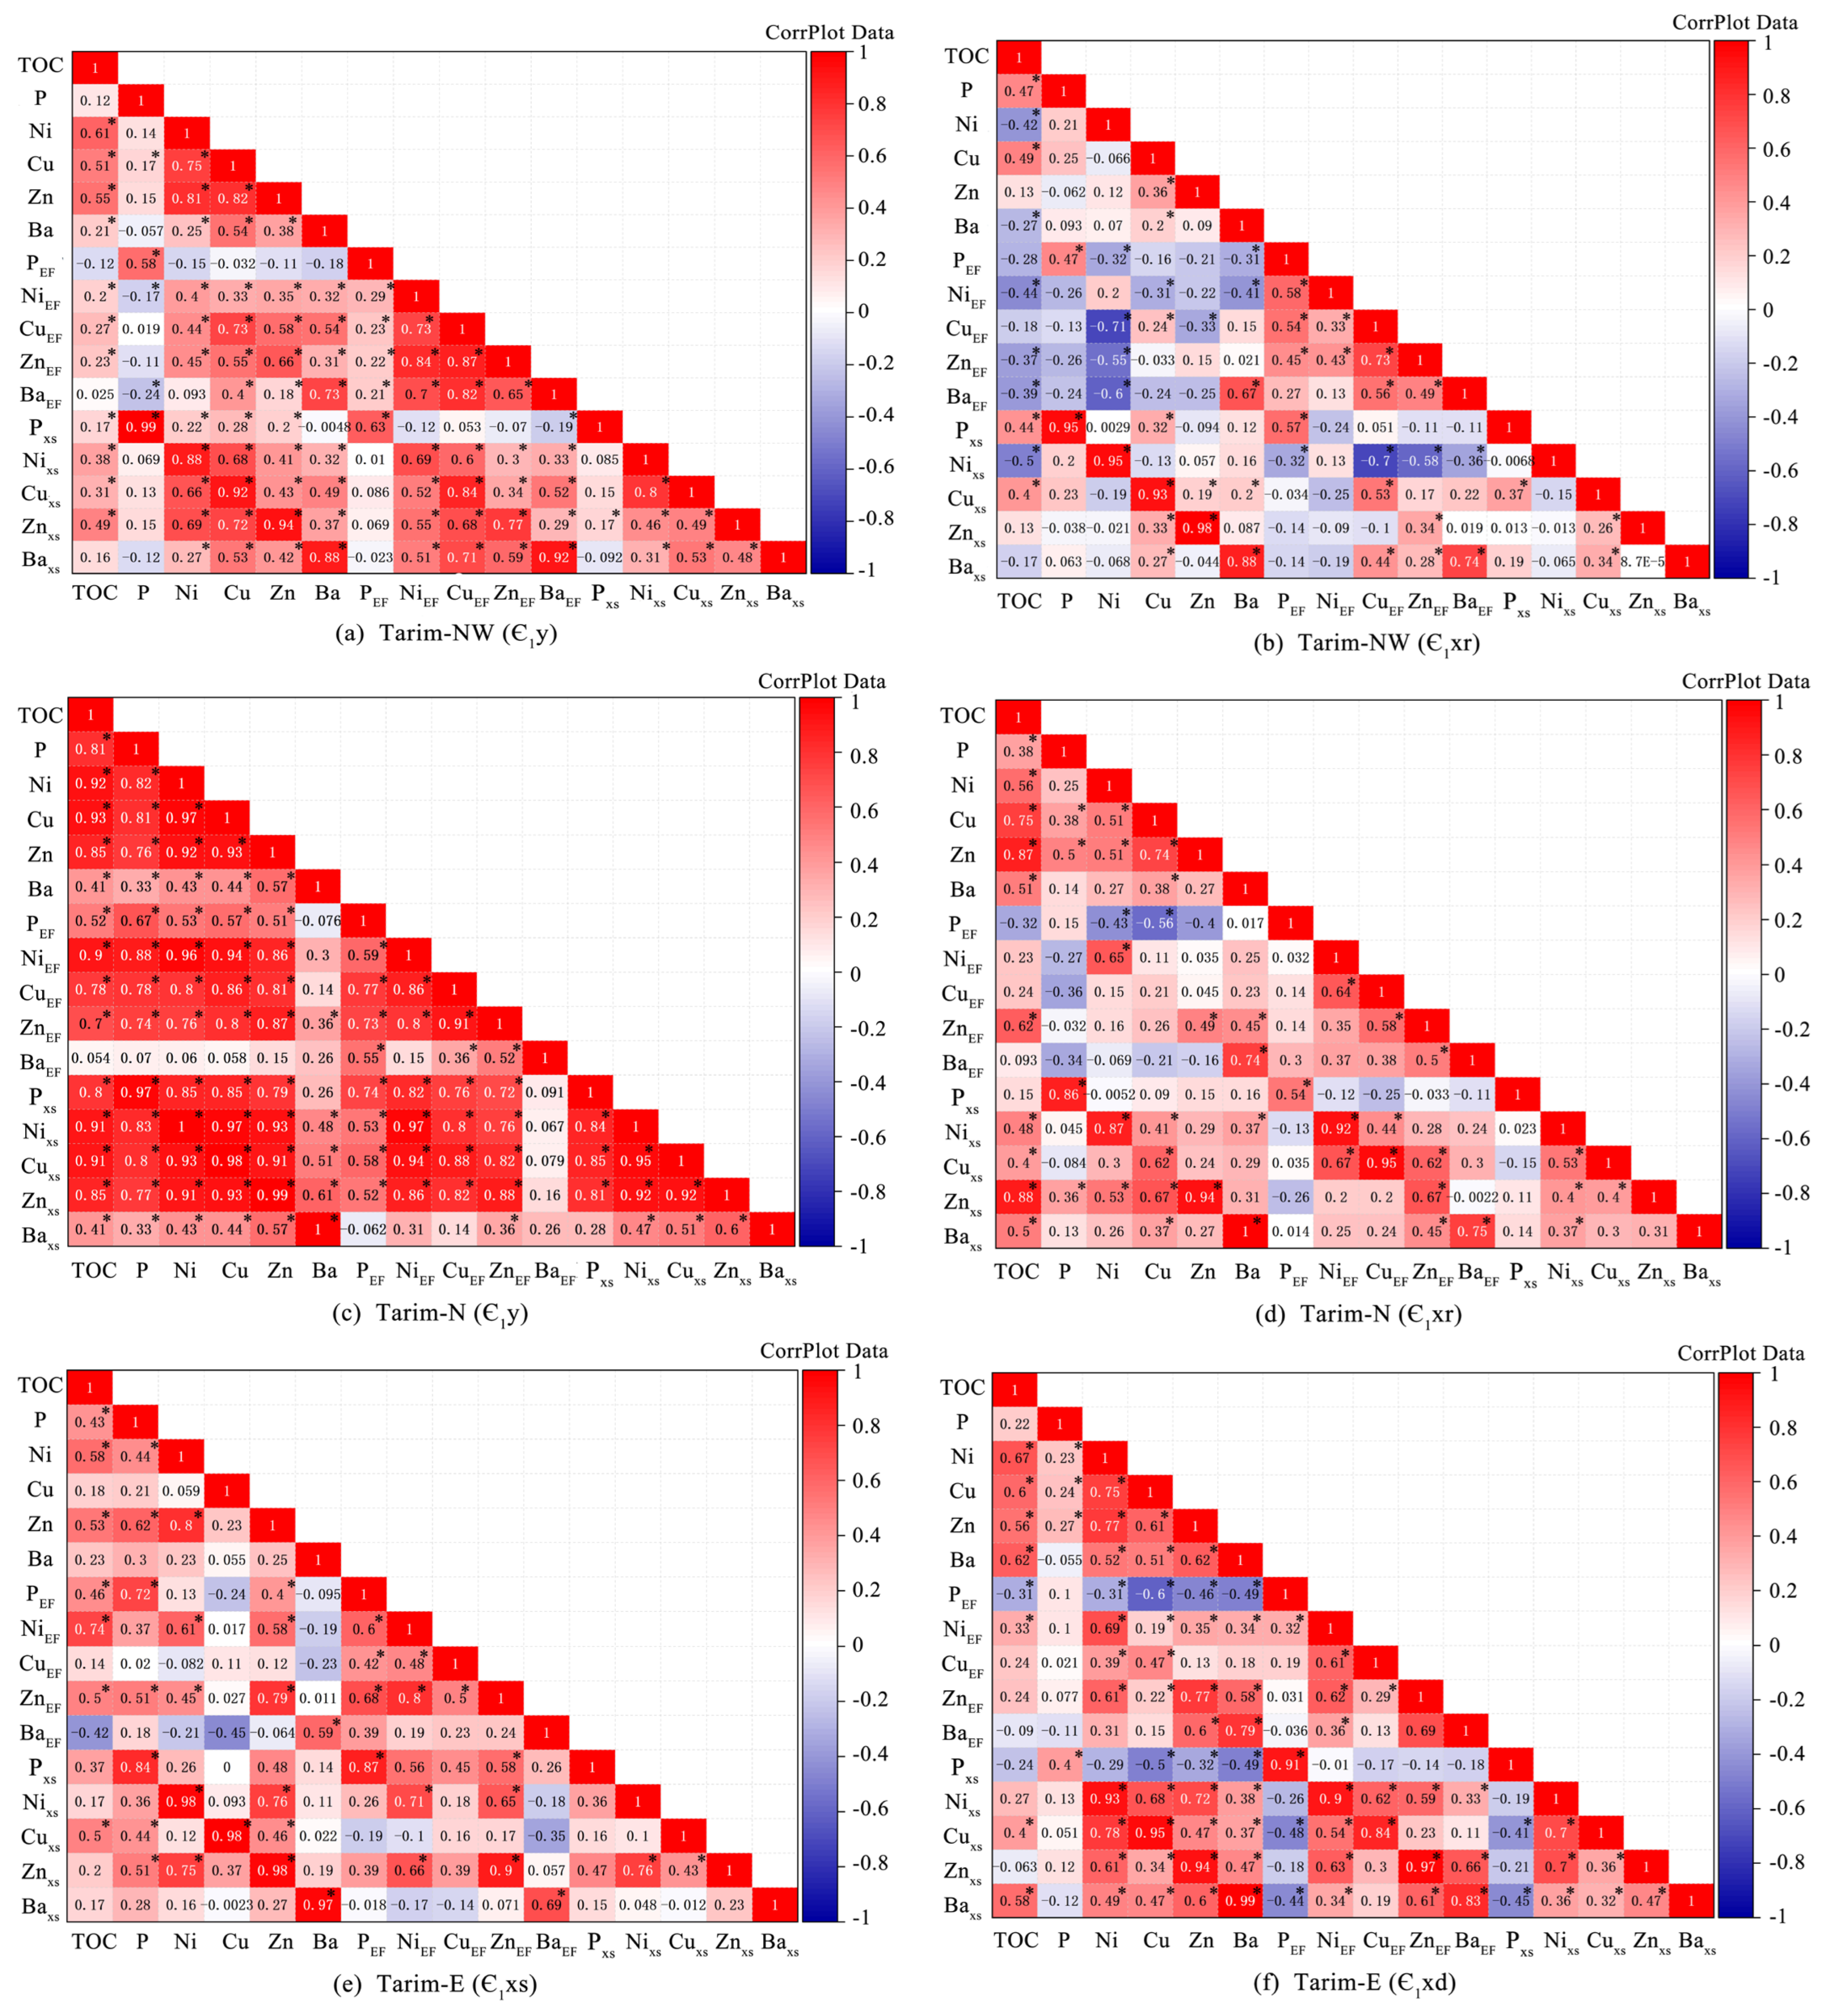
Correlation analysis shows that the relationship between TOC and productivity-related elements exhibits clear stratigraphic and regional differences (Figure 4). Figure 4c shows that TOC is significantly positively correlated with most productivity-related elements in the Yuertusi Formation of northern Tarim. In particular, the correlation coefficients between TOC and Ni, Cu, and Zn reach 0.92, 0.93, and 0.85, respectively. TOC also shows strong positive correlations with P, Pxs, Nixs, Cuxs, and Znxs, indicating good synchronicity between organic matter enrichment and trace-metal variations.
Figure 4a shows that TOC has moderate positive correlations with Ni, Cu, and Zn in the Yuertusi Formation of northwestern Tarim, with correlation coefficients of 0.61, 0.51, and 0.55, respectively. TOC also shows certain positive correlations with some excess-fraction proxies, although the overall correlations are weaker than those in northern Tarim. Figure 4e shows that TOC in the Xishanbulake Formation of eastern Tarim is positively correlated to some extent with Ni, Zn, and several EF and xs proxies, whereas its correlations with other proxies are relatively weak. This indicates that organic matter enrichment and different productivity proxies show variable degrees of coupling.
In contrast, the relationship between TOC and productivity-related elements is more complex in the upper intervals. Figure 4b shows that, in the Xiaoerbulake Formation of northwestern Tarim, TOC has only weak to moderate positive correlations with P, Pxs, Cu, and Cuxs, but shows negative correlations with Ni, Nixs, and some EF proxies. This indicates a lack of stable covariation between TOC and most inorganic proxies. Figure 4d shows that, in the Xiaoerbulake Formation of northern Tarim, TOC has strong positive correlations with Zn and Znxs, and also shows certain positive correlations with Cu, Ni, Ba, and Baxs, whereas its correlation with Pxs is weak. This suggests that different productivity proxies respond differently to organic matter enrichment. Figure 4f shows that, in the Xidashan Formation of eastern Tarim, TOC has moderate positive correlations with Ni, Cu, Zn, Ba, and Baxs, but a negative correlation with Pxs, indicating that the information recorded by some proxies is not fully consistent with organic matter enrichment.
Certain regularities are also observed among different elemental proxies. Ni, Cu, and Zn show strong positive correlations in most intervals, especially in the Yuertusi and Xishanbulake formations, suggesting relatively consistent geochemical behavior and variation trends among these trace metals. P and Pxs, as well as Ba and Baxs, commonly show strong correlations, indicating that the excess-fraction calculations generally preserve the original elemental variation patterns. However, the correlations of Pxs and Baxs with TOC vary considerably among different intervals, and weak or even negative correlations occur in some intervals. This indicates that the information recorded by P and Ba may be influenced by depositional environment, preservation conditions, or later geochemical processes.
In summary, different inorganic productivity-related proxies show variable enrichment intensities, variation trends, and degrees of coupling with TOC in the Lower Cambrian source rocks of the Tarim Basin. Pxs and Baxs show the most pronounced enrichment in some intervals, but their variations are not always synchronous with TOC or other trace-metal excess fractions. In contrast, Nixs, Cuxs, and Znxs show relatively weaker enrichment, but some of these proxies exhibit better consistency with TOC in certain intervals. The correlation results also indicate that TOC shows relatively stable relationships with Ni, Cu, and Zn, whereas P- and Ba-related proxies display more pronounced stratigraphic and regional variations. In addition, certain differences between EF and Xxs occur in low-Al intervals, suggesting that different calculation methods respond differently to detrital background and reference-element concentrations. Therefore, the paleoproductivity significance of these proxies cannot be interpreted using a single proxy or a single calculation method alone, but should be further evaluated in the following discussion by integrating TOC, lithology, redox conditions, material sources, and diagenetic effects.

4. Controls on Paleoproductivity Differentiation in Lower Cambrian Source Rocks

The development of source rocks is commonly controlled by multiple factors. Traditionally, anoxic conditions have been regarded as a key factor for organic matter enrichment [13,60]. However, recent studies have shown that high productivity may also play a critical role in source-rock formation, particularly under upwelling or even oxygenated conditions, by enhancing organic matter flux to the sediment [54,61]. In addition, previous studies have suggested that hydrothermal activity [42] and terrigenous input [34,62] can significantly influence paleoproductivity by regulating nutrient supply and sedimentation rate. Therefore, the differentiation of paleoproductivity in Lower Cambrian source rocks should be evaluated comprehensively from three perspectives: basin setting, redox conditions, and material input mechanisms.

4.1. Basin-Scale Controls

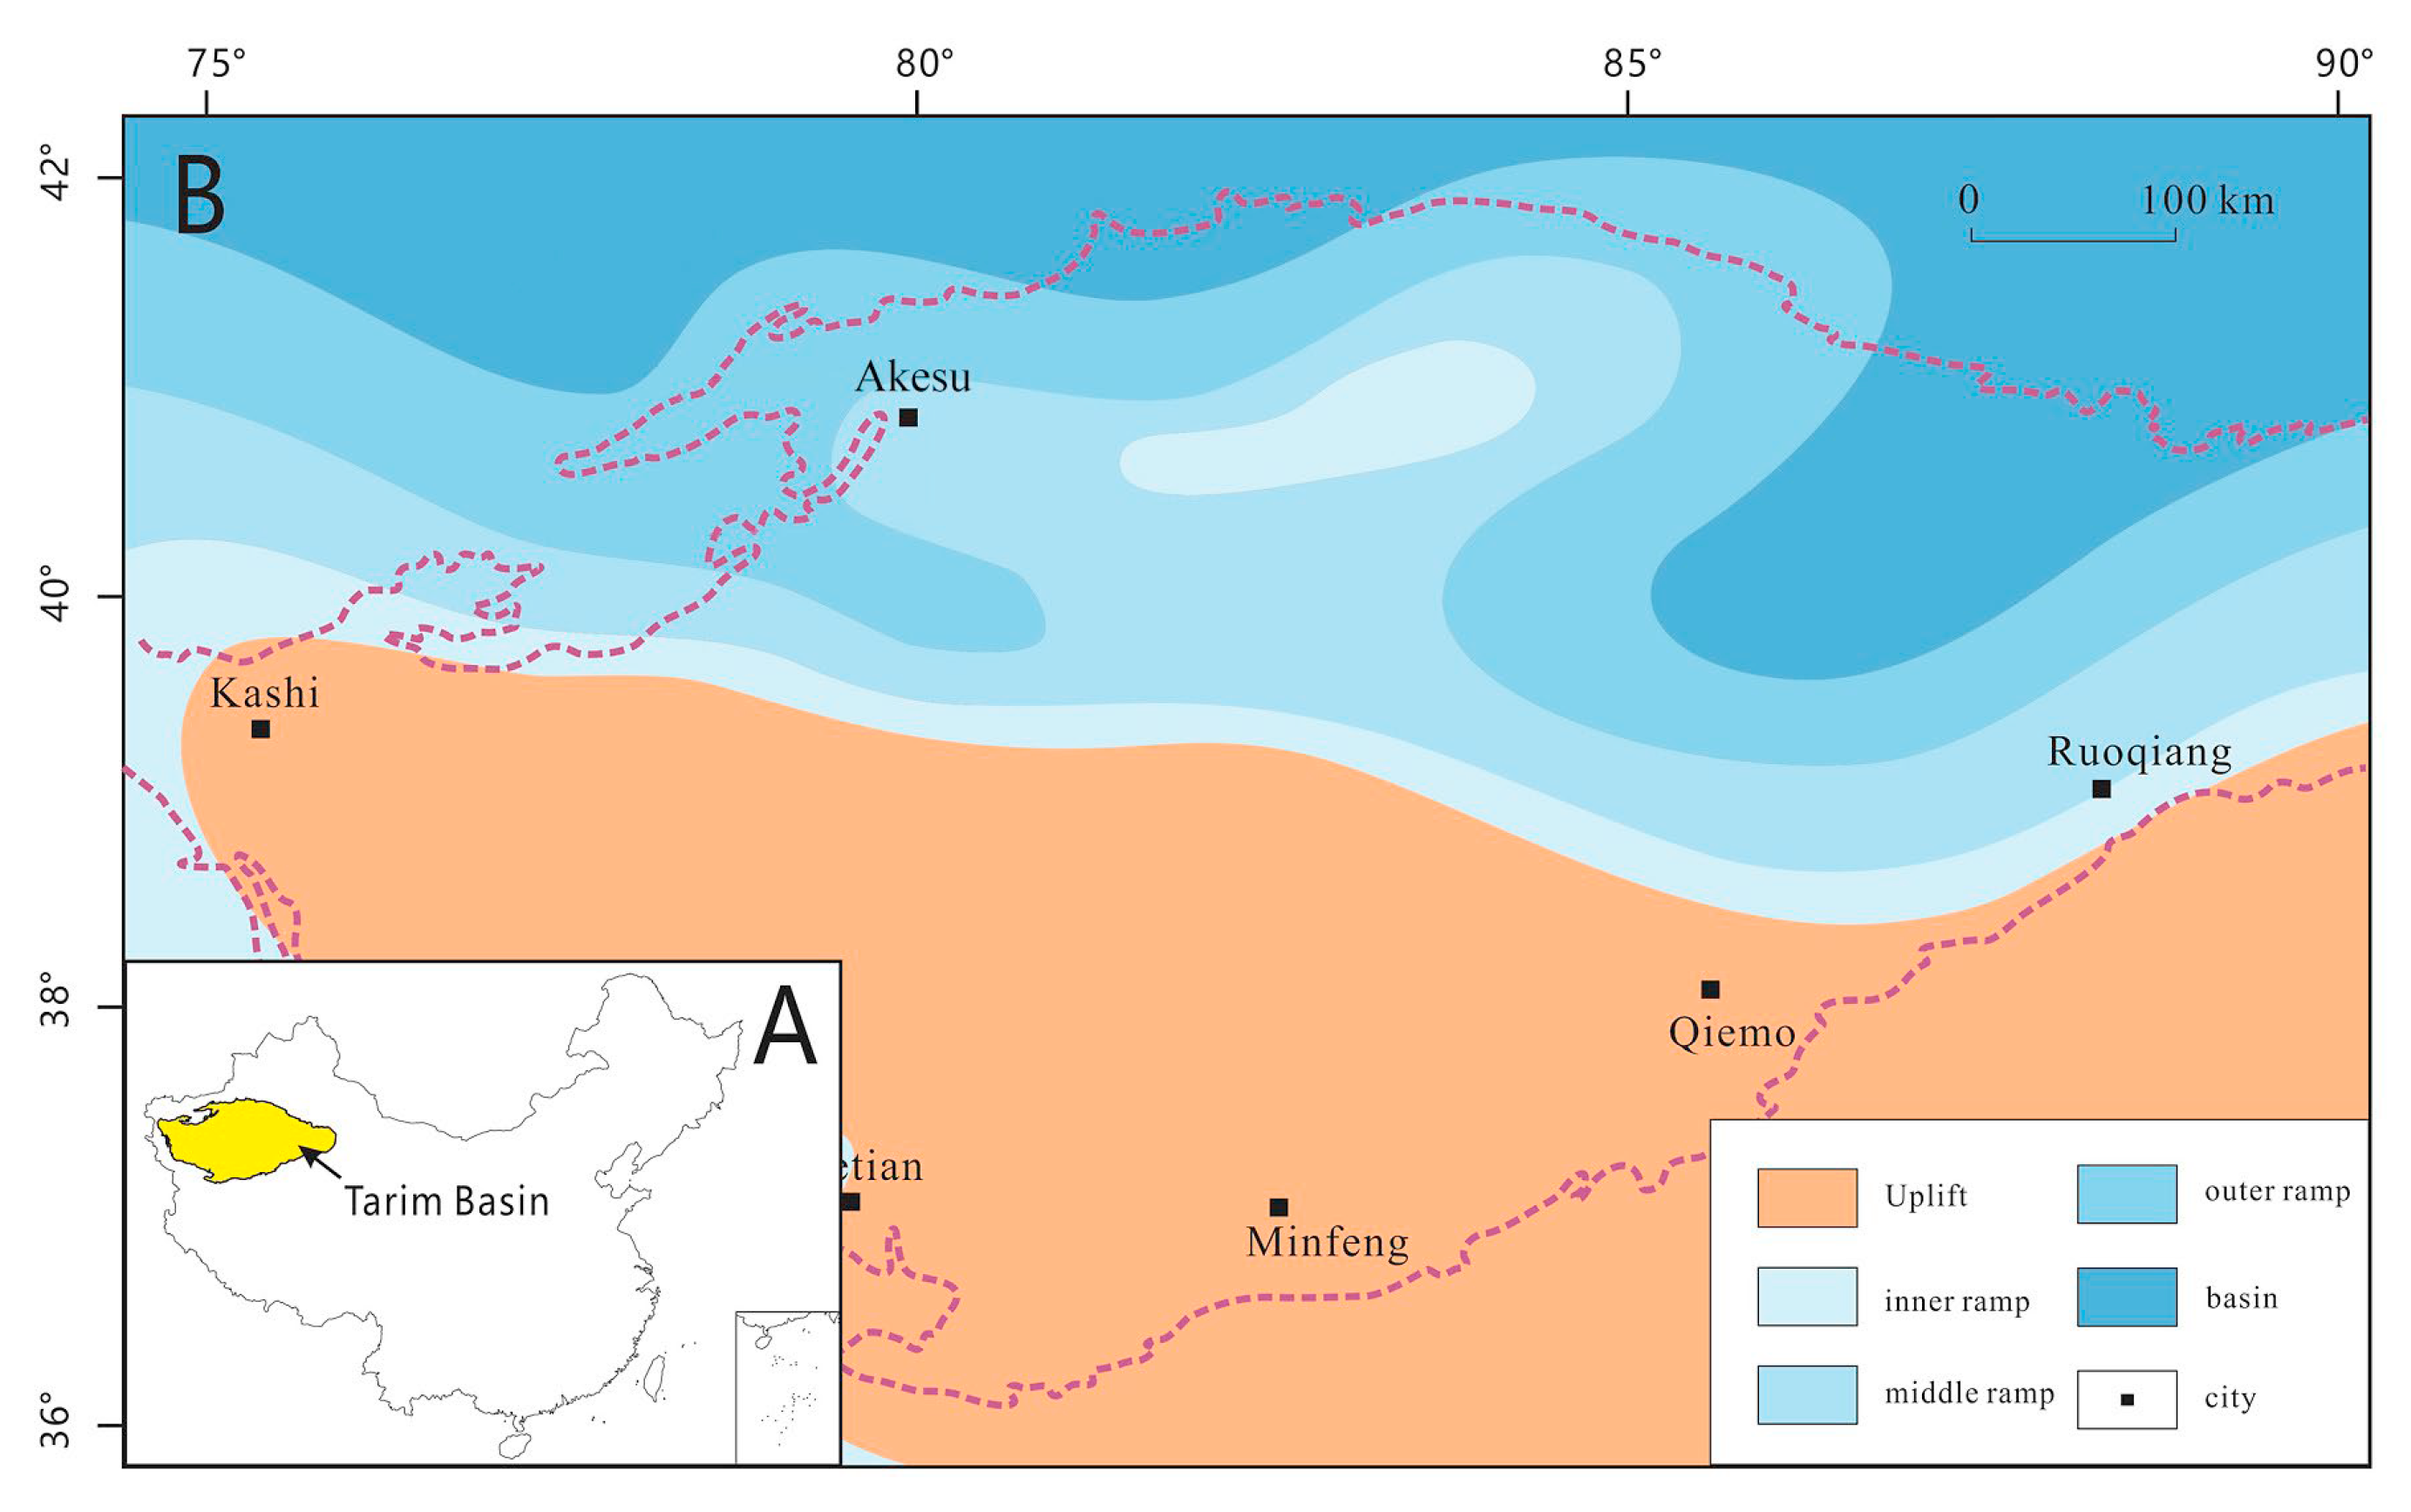
During the Early Cambrian, the Tarim Basin was characterized by a broad paleogeographic framework consisting of a western platform, an eastern basin, and a central paleo-uplift (Figure 5) [63,64]. This basin configuration fundamentally controlled paleowater depth, marine connectivity, sedimentary facies distribution, and material input pathways in different regions, and therefore represents a key factor for explaining regional differences in productivity-related signals in the Lower Cambrian source rocks [29,32,65].
The western and northern parts of the basin were mainly characterized by platform-margin ramp settings, which favored water-mass exchange and nutrient input, thereby promoting stronger productivity-related signals. In contrast, eastern Tarim was located in an underfilled deep-water basin with relatively restricted depositional conditions and continuous fine-grained sediment input [34]. Such a setting was favorable for the development of anoxic preservation conditions; however, enhanced fine-grained sedimentation and detrital input may also have diluted organic matter and some authigenic elements, resulting in an overall lower paleoproductivity signal than that of the Yuertusi Formation in northwestern Tarim.
Vertically, the marked decrease in TOC and productivity-related proxies from the Yuertusi Formation to the Xiaoerbulake Formation in northwestern Tarim may be related to the stronger influence of transgression–regression processes in the platform-margin ramp setting. Sea-level fluctuations could have modified water-column structure and nutrient supply, thereby affecting productivity and organic matter enrichment. By contrast, the deep-water basin setting in eastern Tarim allowed relatively stable depositional conditions and sustained anoxic preservation, resulting in smaller upward decreases in productivity-related proxies. Thus, basin paleogeomorphology not only controlled the east–west differences in productivity-related signals, but also influenced the magnitude of vertical variation in different regions.

4.2. Redox Conditions

Water-column redox conditions are important factors controlling organic matter preservation and the fixation of productivity-related elements [66]. Redox-sensitive elements such as Mo, U, V, Ni, Co, and Th are sensitive to changes in depositional redox conditions (Table 5). These elements commonly remain relatively mobile under oxic water-column conditions, whereas they tend to become enriched under anoxic to euxinic conditions. Therefore, proxies such as V/Cr, Ni/Co, V/(V + Ni), U/Th, and MoEF-UEF covariation patterns are widely used to evaluate the redox state and restriction degree of depositional water masses [67,68,69].
Statistical results indicate that the Lower Cambrian source rocks in the Tarim Basin were generally deposited under dysoxic to anoxic conditions, but the degree, persistence, and restriction of reducing conditions vary significantly among different regions and stratigraphic intervals (Table 6).
The Yuertusi Formation in northwestern and northern Tarim generally shows strong reducing conditions, indicating an overall anoxic water-column setting and favorable preservation conditions. In comparison, the Xishanbulake Formation in eastern Tarim exhibits even stronger reducing conditions. Its average V/Cr, Ni/Co, and U/Th values are 10.59, 16.98, and 1.78, respectively, all indicating obvious anoxia. The average MoEF and UEF values reach 348.51 and 73.15, respectively, suggesting that anoxic water masses were relatively persistent during deposition of this interval. These intervals generally correspond to relatively high paleoproductivity signals, indicating that favorable anoxic preservation conditions were an important prerequisite for the preservation of high paleoproductivity records.
In contrast, the upper intervals generally show weakened reducing conditions or lower redox stability. This pattern is most evident in northern Tarim, where redox proxies are significantly lower than those of the Yuertusi Formation, indicating weakened bottom-water reducing conditions, reduced enrichment of redox-sensitive elements, and less favorable organic matter preservation. Although some samples from the Xiaoerbulake Formation in northwestern Tarim still show relatively strong reducing signals, with average V/Cr and Ni/Co values of 3.38 and 13.55, respectively, the average V/(V + Ni) value is only 0.51, and MoEF and UEF show wide variations. These features indicate fluctuating redox conditions, with overall stability and persistence weaker than those of the Yuertusi Formation, making it difficult to preserve paleoproductivity records comparable to those of the lower interval. In eastern Tarim, the Xidashan Formation still maintains an anoxic depositional background, with average V/Cr, Ni/Co, V/(V + Ni), and U/Th values of 8.11, 8.11, 0.83, and 1.38, respectively. These values indicate that bottom waters remained relatively reducing, although less strongly than during deposition of the Xishanbulake Formation. No abrupt redox shift occurred between the two eastern intervals, which helps explain the relatively small upward decrease in productivity-related proxies in eastern Tarim.
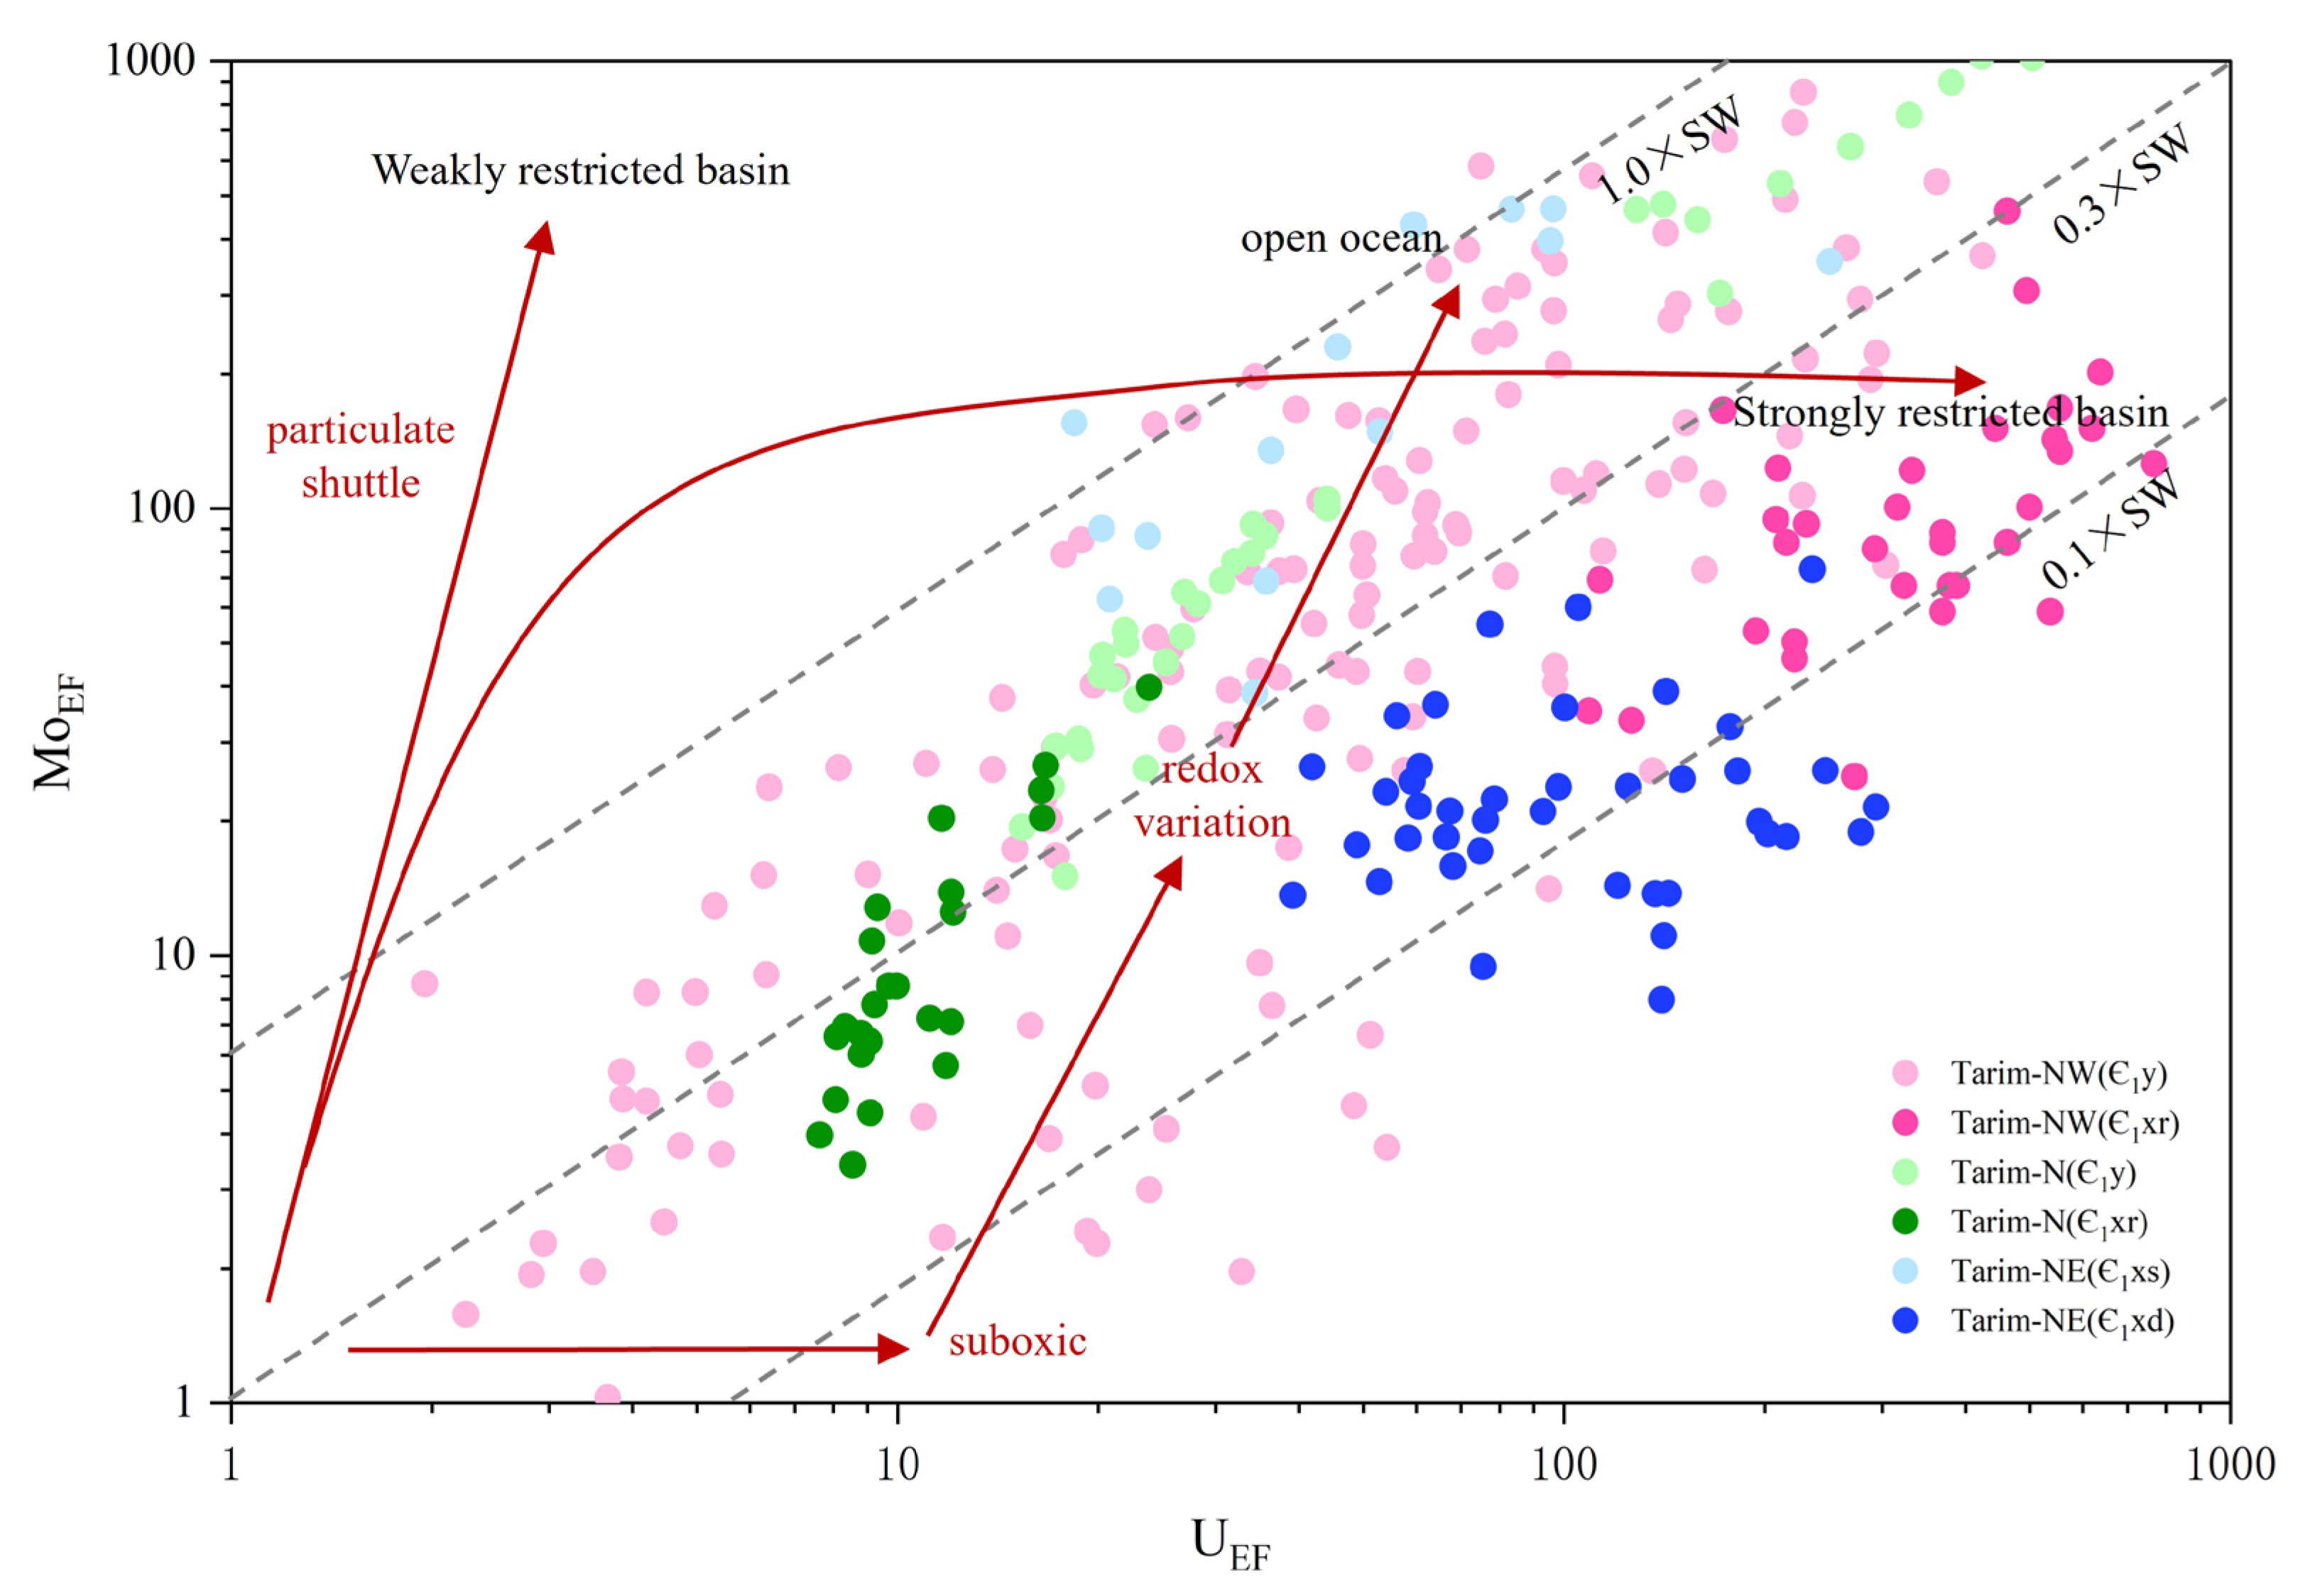
In addition to redox conditions, the restriction and residence time of water masses can also affect nutrient recycling efficiency, thereby exerting a feedback effect on paleoproductivity. The covariation between MoEF and UEF is commonly used to evaluate marine openness and the stability of anoxic water masses (Figure 6) [59].
The MoEF–UEF covariation pattern further reveals differences in marine openness and the stability of anoxic water masses among different stratigraphic intervals. Overall, most samples plot between 0.1 × (Mo/U)SW and 1.0 × (Mo/U)SW, indicating that the Lower Cambrian source rocks in the study area were generally deposited under anoxic conditions with varying degrees of basin restriction. The Yuertusi Formation in northwestern Tarim shows the widest distribution, extending from low MoEF–UEF values to areas close to or exceeding 1.0 × (Mo/U)SW. This pattern reflects strong fluctuations in water–mass connectivity, Mo supply, and redox conditions, corresponding to variations in productivity–related signals. Samples from the Yuertusi Formation in northern Tarim and the Xishanbulake Formation in eastern Tarim mainly plot between 0.3 × (Mo/U)SW and 1.0 × (Mo/U)SW, with some samples close to the seawater Mo/U line. This suggests that these intervals were deposited in relatively open or weakly restricted anoxic to euxinic environments, where anoxic water masses were relatively stable and favorable for the preservation of productivity-related signals.
In contrast, the Xiaoerbulake Formation in northern Tarim generally shows low absolute MoEF and UEF values, indicating that the reducing degree and duration of bottom–water anoxia were weaker than those during deposition of the Yuertusi Formation. This interval more likely represents intermittent anoxic to dysoxic conditions, implying a decrease in the stability of anoxic water masses and a weaker preservation effect on productivity–related signals. Many samples from the Xiaoerbulake Formation in northwestern Tarim and the Xidashan Formation in eastern Tarim mainly plot between 0.1 × (Mo/U)SW and 0.3 × (Mo/U)SW. However, their distributions within this interval are still different. The former shows generally higher MoEF and UEF values, whereas the latter is relatively lower. Considering the paleogeographic differences between these two areas, the relatively low Mo enrichment in the Xidashan Formation should not be simply interpreted as evidence for oxic conditions or poor preservation. Instead, it more likely reflects limited Mo supply in a restricted deep-water basin.
This redox variability helps explain the inconsistency among TOC, Pxs, Baxs, and trace–metal proxies. Ba mainly records organic matter export through biogenic barite or excess Ba, but its preservation is not completely controlled by the final amount of buried organic carbon. Under persistently anoxic and restricted conditions, barite may undergo dissolution, remobilization, or reprecipitation, leading to weak or even negative correlations between Ba records and preserved TOC. The Xishanbulake and Xidashan formations in eastern Tarim both maintained relatively stable anoxic backgrounds; therefore, the Ba preservation environment changed only slightly between the two intervals. This may explain why Baxs responds more weakly to stratigraphic changes than TOC, Pxs, Cuxs, and Znxs. The behavior of P is also strongly affected by redox cycling and diagenetic redistribution. P is an essential nutrient for biological growth and is commonly enriched under high–productivity conditions. However, under anoxic conditions, Fe–bound P can be released, promoting internal nutrient recycling while also causing migration and redistribution of P within sediments. Therefore, Pxs may record enhanced nutrient supply and productivity, but it may also be influenced by phosphate mineral formation, adsorption, and diagenetic modification. This explains why Pxs is strongly enriched in high–TOC intervals such as the Yuertusi Formation, but does not necessarily vary synchronously with TOC or Baxs in some persistently anoxic or restricted intervals.
Ni, Cu, and Zn are essential trace elements for biological growth and can also be incorporated into sediments during organic matter settling, complexation, and preservation. Their relatively good correlations with TOC may reflect the combined effects of organic matter enrichment, reducing preservation conditions, and trace–metal fixation, rather than a direct increase in primary productivity alone. This may also explain why Ni, Cu, and Zn show relatively consistent covariation with TOC in eastern Tarim.
Overall, the strongly anoxic background of the lower Yuertusi and Xishanbulake formations favored the preservation of high TOC and enriched productivity–related elements. Although productivity–related signals generally weakened in the upper intervals, the persistent anoxic background in eastern Tarim resulted in relatively small changes in Baxs. Redox conditions mainly influence the preservation strength of productivity–related signals by controlling organic matter preservation efficiency, P recycling, Ba preservation, and the fixation of trace metals such as Cu, Ni, and Zn.

4.3. Comparison with Lower Cambrian Source Rocks in the South China Yangtze Block

Both the Tarim Basin and the South China Yangtze Block are important regions for the development of Lower Cambrian marine source rocks in China [72], and studies of the Lower Cambrian successions in the Yangtze Block provide an important reference for understanding the Tarim Basin [73]. Previous studies on the Shuijingtuo Formation, Niutitang Formation, and their equivalent intervals in the Yangtze Block have shown that organic matter enrichment in the Lower Cambrian is commonly associated with intraplatform basin or slope–basin settings, anoxic to euxinic preservation conditions, relatively high productivity, hydrothermal/upwelling activity, and variations in terrigenous input [74]. This understanding is broadly consistent with the results of this study, which show stronger productivity-related signals in the lower intervals and weaker signals in the upper intervals of the Lower Cambrian source rocks in the Tarim Basin. In addition, studies of the Shuijingtuo Formation emphasizing the significant influence of terrigenous input on organic matter accumulation also support our interpretation of eastern Tarim: terrigenous input may not only supply nutrients, but also reduce TOC contents and the enrichment of some authigenic elements through detrital dilution and changes in sedimentation rate [75].

5. Limitations and Prospects

Although this study systematically evaluated paleoproductivity variations and their controlling factors in the Lower Cambrian source rocks of the Tarim Basin based on published datasets, several limitations remain. First, this study mainly relies on compiled data from previous publications. Differences in sample types, analytical parameters, and analytical methods among different studies result in variable sample numbers available for different geochemical proxies. Second, the studied samples include shale, siliceous rock, mudstone, carbonate rock, and dolostone. Such lithological heterogeneity, carbonate dilution, silica enrichment, and terrigenous detrital input may influence elemental concentrations and normalization results. Therefore, interpretations of inorganic productivity-related proxies should be integrated with lithological background and depositional setting.
The host phases of productivity-related trace elements were not investigated in this study. Future work integrating mineralogical and sulfur geochemical analyses is required.

6. Conclusions

The Lower Cambrian source rocks in the Tarim Basin have generally experienced high to overmature thermal evolution, and thermal maturation and possible hydrocarbon generation and expulsion may affect present–day TOC and some organic matter signals. Therefore, thermal evolution should be considered as a potential factor in paleoproductivity reconstruction, together with lithology, redox conditions, hydrothermal activity, terrigenous input, and diagenetic modification.
The Lower Cambrian source rocks in the Tarim Basin show clear differentiation in paleoproductivity. Vertically, they exhibit an overall “stronger lower interval and weaker upper interval” trend, while spatially, paleoproductivity is generally higher and more variable in western Tarim than in eastern Tarim.
The differentiation of paleoproductivity was jointly controlled by basin configuration, redox conditions, and material input. The basin setting determined nutrient supply pathways, redox conditions controlled organic matter preservation efficiency.
Productivity-related elements can reflect paleoproductivity, but different proxies have different geochemical meanings. P and Pxs mainly indicate nutrient supply, whereas Ba and Baxs reflect organic matter export flux. These proxies are also influenced by productivity, redox conditions, and organic matter/sulfide fixation. Ni, Cu, and Zn show better consistency with TOC variations and can therefore serve as supplementary indicators of organic matter enrichment.

Supplementary Materials

The following supporting information can be downloaded at: https://www.mdpi.com/article/10.3390/geosciences16070258/s1, Table S1: Complete geochemical dataset compiled from previously published studies and analyzed in this review.

Author Contributions

Conceptualization, M.S. and T.Y.; methodology, M.S. and A.Z.; validation, M.S.,T.Y., A.Z., and A.A.; formal analysis, M.S.; investigation, M.S., T.Y., A.Z., and A.A.; resources, T.Y.; data curation, M.S.; writing—original draft preparation, M.S.; writing—review and editing, M.S., T.Y., A.Z., and A.A.; visualization, M.S.; supervision, T.Y. All authors have read and agreed to the published version of the manuscript.

Funding

This research received no external funding.

Data Availability Statement

No new analytical data were generated in this study. The data analyzed in this review were compiled from previously published studies, all of which are cited in the manuscript. The complete compiled dataset supporting the findings of this study is provided in Table S1 in the Supplementary Materials.

Acknowledgments

The authors acknowledge the Satbayev University, and Shandong Huayu University of Technology for their institutional support. The authors also sincerely thank the Academic Editor and the anonymous reviewers for their constructive comments and valuable suggestions, which greatly improved the quality of this manuscript.

Conflicts of Interest

The authors declare no conflicts of interest.

References

  1. Lyons, T.W.; Reinhard, C.T.; Planavsky, N.J. The Rise of Oxygen in Earth’s Early Ocean and Atmosphere. Nature 2014, 506, 307–315. [Google Scholar] [CrossRef] [Scilit] [PubMed]
  2. Li, C.; Shi, W.; Cheng, M.; Jin, C.; Algeo, T.J. The Redox Structure of Ediacaran and Early Cambrian Oceans and Its Controls. Sci. Bull. 2020, 65, 2141–2149. [Google Scholar] [CrossRef] [Scilit] [PubMed]
  3. Khan, I.; Zhong, N.; Luo, Q.; Ai, J.; Yao, L.; Luo, P. Maceral Composition and Origin of Organic Matter Input in Neoproterozoic–Lower Cambrian Organic-Rich Shales of Salt Range Formation, Upper Indus Basin, Pakistan. Int. J. Coal Geol. 2020, 217, 103319. [Google Scholar]
  4. Zhao, J.; Jin, Z.; Hu, Q.; Liu, K.; Liu, G.; Gao, B.; Liu, Z.; Zhang, Y.; Wang, R. Geological Controls on the Accumulation of Shale Gas: A Case Study of the Early Cambrian Shale in the Upper Yangtze Area. Mar. Pet. Geol. 2019, 107, 423–437. [Google Scholar] [CrossRef] [Scilit]
  5. Tribovillard, N.; Algeo, T.J.; Lyons, T.; Riboulleau, A. Trace metals as paleoredox and paleoproductivity proxies: An update. Chem. Geol. 2006, 232, 12–32. [Google Scholar] [CrossRef] [Scilit]
  6. Tribovillard, N. Re-Assessing Copper and Nickel Enrichments as Paleo-Productivity Proxies. BSGF-Earth Sci. Bull. 2021, 192, 54. [Google Scholar] [CrossRef] [Scilit]
  7. Prahl, F.G.; Collier, R.B.; Dymond, J.; Lyle, M.; Sparrow, M.A. A Biomarker Perspective on Prymnesiophyte Productivity in the Northeast Pacific Ocean. Deep Sea Res. Part I Oceanogr. Res. Pap. 1993, 40, 2061–2076. [Google Scholar] [CrossRef] [Scilit]
  8. Schoepfer, S.D.; Shen, J.; Wei, H.; Tyson, R.V.; Ingall, E.; Algeo, T.J. Total Organic Carbon, Organic Phosphorus, and Biogenic Barium Fluxes as Proxies for Paleomarine Productivity. Earth Sci. Rev. 2015, 149, 23–52. [Google Scholar] [CrossRef] [Scilit]
  9. Lur’e, M.A.; Shmidt, F.K. Carbon and Sulfur Isotopes as Geochemical Keys to the Origin of Petroleum. Chem. Technol. Fuels Oils 2009, 45, 189–192. [Google Scholar] [CrossRef] [Scilit]
  10. Ratnayake, A.S. An Overview of Organic Geochemical Indices to Evaluate Conventional Petroleum Source Rocks: A Summary of Examples from the Indian Subcontinent. Pet. Sci. Technol. 2024, 42, 749–767. [Google Scholar] [CrossRef] [Scilit]
  11. Algeo, T.J.; Henderson, C.M.; Tong, J.; Feng, Q.; Yin, H.; Tyson, R.V. Plankton and Productivity during the Permian–Triassic Boundary Crisis: An Analysis of Organic Carbon Fluxes. Glob. Planet. Change 2013, 105, 52–67. [Google Scholar] [CrossRef] [Scilit]
  12. Felix, M. A Comparison of Equations Commonly Used to Calculate Organic Carbon Content and Marine Palaeoproductivity from Sediment Data. Mar. Geol. 2014, 347, 1–11. [Google Scholar] [CrossRef] [Scilit]
  13. Pedersen, T.F.; Calvert, S.E. Anoxia vs. Productivity: What Controls the Formation of Organic-Carbon-Rich Sediments and Sedimentary Rocks? AAPG Bull. 1990, 74, 454–466. [Google Scholar] [CrossRef] [Scilit]
  14. Daly, A.R. Loss of Organic Carbon from Source Rocks During Thermal Maturation, #60055; AAPG Databases Inc.: Tulsa, OK, USA, 2019; pp. 1–14. [Google Scholar]
  15. Liang, D.; Chen, J. Oil-Source Correlations for High and over Matured Marine Source Rocks in South China. Pet. Explor. Dev. 2005, 32, 8–14. [Google Scholar]
  16. Horner, T.J.; Little, S.H.; Conway, T.M.; Farmer, J.R.; Hertzberg, J.E.; Janssen, D.J.; Lough, A.J.M.; McKay, J.L.; Tessin, A.; Galer, S.J.G.; et al. Bioactive Trace Metals and Their Isotopes as Paleoproductivity Proxies: An Assessment Using GEOTRACES-Era Data. Glob. Biogeochem. Cycles 2021, 35, e2020GB006814. [Google Scholar] [CrossRef] [Scilit]
  17. Calvert, S.E.; Pedersen, T.F. Chapter Fourteen Elemental Proxies for Palaeoclimatic and Palaeoceanographic Variability in Marine Sediments: Interpretation and Application. Dev. Mar. Geol. 2007, 1, 567–644. [Google Scholar] [CrossRef] [Scilit]
  18. Han, S.; Zhang, Y.; Huang, J.; Rui, Y.; Tang, Z. Elemental Geochemical Characterization of Sedimentary Conditions and Organic Matter Enrichment for Lower Cambrian Shale Formations in Northern Guizhou, South China. Minerals 2020, 10, 793. [Google Scholar] [CrossRef] [Scilit]
  19. Madukwe, H.Y.; Adegoke, A.K.; Adeleye, M.A.; Aturamu, A.O. Paleo-Productivity and Petroleum Source Evaluation of the Nkporo and Awgu Shales, Lower Benue Trough, Nigeria: Insight from Inorganic Geochemistry. Energy Geosci. 2023, 4, 100161. [Google Scholar] [CrossRef] [Scilit]
  20. Ojo, O.J.; Adepoju, S.A.; Awe, A.; Adeoye, M.O.; Olumayede, E.G.; Ndukwe, O.S.; Abdulraman, S.O.; Haruna, A.K.; Jimoh, Y.A. Uncovering the Late Cretaceous Paleoenvironment and Paleoclimate of the Agbaja Plateau, Bida Basin, Nigeria: An Inorganic Geochemical Analysis of Shales and Implications for Organic Matter Enrichment. Geosyst. Geoenviron. 2026, 5, 100452. [Google Scholar] [CrossRef] [Scilit]
  21. Ingall, E.; Kolowith, L.; Lyons, T.; Hurtgen, M. Sediment Carbon, Nitrogen and Phosphorus Cycling in an Anoxic Fjord, Effingham Inlet, British Columbia. Am. J. Sci. 2005, 305, 240–258. [Google Scholar] [CrossRef] [Scilit]
  22. Dymond, J.; Suess, E.; Lyle, M. Barium in Deep-sea Sediment: A Geochemical Proxy for Paleoproductivity. Paleoceanography 1992, 7, 163–181. [Google Scholar] [CrossRef] [Scilit]
  23. Ganeshram, R.S.; François, R.; Commeau, J.; Brown-Leger, S.L. An Experimental Investigation of Barite Formation in Seawater. Geochim. Cosmochim. Acta 2003, 67, 2599–2605. [Google Scholar] [CrossRef] [Scilit]
  24. Conway, T.M.; Middag, R. Controls and Distributions of Trace Elements in the Ocean. In Treatise on Geochemistry; Elsevier: Amsterdam, The Netherlands, 2025. [Google Scholar] [CrossRef] [Scilit]
  25. Bao, J.; Zhu, C.; Wang, Z. Typical End-Member Oil Derived from Cambrian-Lower Ordovician Source Rocks in the Tarim Basin, NW China. Pet. Explor. Dev. 2018, 45, 1177–1188. [Google Scholar] [CrossRef] [Scilit]
  26. Qiu, N.; Chang, J.; Zuo, Y.; Wang, J.; Li, H. Thermal Evolution and Maturation of Lower Paleozoic Source Rocks in the Tarim Basin, Northwest China. AAPG Bull. 2012, 96, 789–821. [Google Scholar] [CrossRef] [Scilit]
  27. Zhu, G.; Chen, F.; Chen, Z.; Zhang, Y.; Xing, X.; Tao, X.; Ma, D. Discovery and Basic Characteristics of High-Quality Source Rocks Found in the Yuertusi Formation of the Cambrian in Tarim Basin, China. J. Nat. Gas. Geosci. 2016, 1, 21–33. [Google Scholar] [CrossRef] [Scilit]
  28. Cai, C.; Li, K.; Anlai, M.; Zhang, C.; Xu, Z.; Worden, R.H.; Wu, G.; Zhang, B.; Chen, L. Distinguishing Cambrian from Upper Ordovician Source Rocks: Evidence from Sulfur Isotopes and Biomarkers in the Tarim Basin. Org. Geochem. 2009, 40, 755–768. [Google Scholar] [CrossRef] [Scilit]
  29. Wang, Y.; Chen, J.; Shen, W.; Li, M. Mechanism of Organic Matter Accumulation in Black Shales of the Yuertusi Formation in the Tarim Basin: Insights from Paleoenvironmental Variation during the Early Cambrian. Front. Earth Sci. 2022, 10, 879658. [Google Scholar] [CrossRef] [Scilit]
  30. Li, T.; Zhang, Y.; Zhu, G.; Chen, Z.; Li, X. Environmental Controls on Organic Matter Enrichment of the Lower Cambrian Source Rocks in the Tarim Basin, Northwest China. Mar. Pet. Geol. 2023, 158, 106539. [Google Scholar] [CrossRef] [Scilit]
  31. Zhao, G.; Deng, Q.; Zhang, H.; Wang, H.; Cheng, B.; Liao, Z. Trace Elements and Stable Isotopic Geochemistry of Two Sedimentary Sections in the Lower Cambrian Strata from the Tarim Basin, Northwest China: Implications for Silicification and Biological Evolution. Mar. Pet. Geol. 2023, 147, 105991. [Google Scholar] [CrossRef] [Scilit]
  32. Wei, M.; Bao, Z.; Munnecke, A.; Liu, W.; Harrison, G.; Zhang, H.; Zhang, D.; Li, Z.; Xu, X.; Lu, K.; et al. Paleoenvironment of the Lower–Middle Cambrian Evaporite Series in the Tarim Basin and Its Impact on the Organic Matter Enrichment of Shallow Water Source Rocks. Minerals 2021, 11, 659. [Google Scholar] [CrossRef] [Scilit]
  33. Miao, M.; Sun, Z.; Xue, Z.; Miao, M.; Jiang, K.; Zhang, X.; Bai, Z.; Lyu, X.; Zhou, X.; Gao, Y.; et al. The Lower Cambrian Xiaoerbulake Formation in the Tarim Basin as a Potential Carbonate Source Rock. Energy Geosci. 2024, 5, 100238. [Google Scholar] [CrossRef] [Scilit]
  34. Deng, Q.; Wang, H.; Wei, Z.; Li, S.; Zhang, H.; Liu, H.; Lekan Faboya, O.; Cheng, B.; Liao, Z. Different Accumulation Mechanisms of Organic Matter in Cambrian Sedimentary Successions in the Western and Northeastern Margins of the Tarim Basin, NW China. J. Asian Earth Sci. 2021, 207, 104660. [Google Scholar] [CrossRef] [Scilit]
  35. Changlin, G.; Deliao, Y. Petroleum Geology of the Tarim Basin, NW China: Recent Advances. J. Pet. Geol. 1997, 20, 239–244. [Google Scholar] [CrossRef] [Scilit]
  36. Lin, C.; Yang, H.; Liu, J.; Rui, Z.; Cai, Z.; Li, S.; Yu, B. Sequence Architecture and Depositional Evolution of the Ordovician Carbonate Platform Margins in the Tarim Basin and Its Response to Tectonism and Sea-Level Change. Basin Res. 2012, 24, 559–582. [Google Scholar] [CrossRef] [Scilit]
  37. Zhang, S.; Wang, H.; Su, J.; Wang, X.; He, K.; Liu, Y. Control of Earth System Evolution on the Formation and Enrichment of Marine Ultra-Deep Petroleum in China. Pet. Explor. Dev. 2024, 51, 871–885. [Google Scholar] [CrossRef] [Scilit]
  38. Hu, Z.; Gao, Z.; Liu, Z.; Jiang, W.; Wei, D.; Li, Y. Characteristics of Cambrian Tectonic-Lithofacies Paleogeography in China and the Controls on Hydrocarbons. J. Pet. Sci. Eng. 2022, 214, 110473. [Google Scholar] [CrossRef] [Scilit]
  39. Zhou, X.; Chen, D.; Qing, H.; Qian, Y.; Wang, D. Submarine Silica-Rich Hydrothermal Activity during the Earliest Cambrian in the Tarim Basin, Northwest China. Int. Geol. Rev. 2014, 56, 1906–1918. [Google Scholar] [CrossRef] [Scilit]
  40. Zhang, Z.; Zhu, G.; Chen, W.; Wu, L.; Ren, R.; Zhang, C. Cryogenian–Cambrian Tectono-Sedimentary Evolution, Paleoclimate and Environment Effects, and Formation of Petroleum Resources in the Tarim Block. Earth Sci. Rev. 2024, 248, 104632. [Google Scholar] [CrossRef] [Scilit]
  41. Yang, S.; Wu, G.; Zhu, Y.; Zhang, Y.; Zhao, X.; Lu, Z.; Zhang, B. Key Oil Accumulation Periods of Ultra-Deep Fault-Controlled Oil Reservoir in Northern Tarim Basin, NW China. Pet. Explor. Dev. 2022, 49, 285–299. [Google Scholar] [CrossRef] [Scilit]
  42. He, T.; Lu, S.; Li, W.; Sun, D.; Pan, W.; Zhang, B.; Tan, Z.; Ying, J. Paleoweathering, Hydrothermal Activity and Organic Matter Enrichment during the Formation of Earliest Cambrian Black Strata in the Northwest Tarim Basin, China. J. Pet. Sci. Eng. 2020, 189, 106987. [Google Scholar] [CrossRef] [Scilit]
  43. Yuan, H.; Chen, S.; Dai, K.; Guo, X.; Kong, L.; Feng, N.; Zhao, H.; Yang, W. Distribution of Cambrian Source Rock Controlled by the Inherited Paleotopography on the Precambrian Basement in the Tarim Basin, NW China. Front. Earth Sci. 2022, 10, 864082. [Google Scholar] [CrossRef] [Scilit]
  44. Cheng, W.; Wang, R.; He, T.; Sun, C.; Tian, H.; Zhao, J.; Zhao, Y.; He, J.; Zeng, Q.; Liu, J.; et al. Geochemical Evidence of Organic Matter Enrichment and Depositional Dynamics in the Lower Cambrian Yurtus Formation, NW Tarim Basin: Insights into Hydrothermal Influence and Paleoproductivity Mechanisms. Minerals 2025, 15, 288. [Google Scholar] [CrossRef] [Scilit]
  45. Zeng, Q.; He, T.; Zhao, Y.; Zhang, K.; Wen, Z.; Xu, Y.; He, J.; Tian, W.; Lu, S.; Cheng, W.; et al. Geochemical Characteristic of Different-Lithofacies Source Rocks and Its Implications for Ultradeep Hydrocarbon Exploration in the Lower Cambrian Yuertus Formation, Tarim Basin. Sci. Rep. 2025, 15, 24071. [Google Scholar] [CrossRef] [Scilit] [PubMed]
  46. Xianming, X.; Wilkins, R.W.T.; Dehan, L.; Zufa, L.; Jiamu, F. Investigation of Thermal Maturity of Lower Palaeozoic Hydrocarbon Source Rocks by Means of Vitrinite-like Maceral reflectance—A Tarim Basin Case Study. Org. Geochem. 2000, 31, 1041–1052. [Google Scholar]
  47. Yu, B.; Dong, H.; Widom, E.; Chen, J.; Lin, C. Geochemistry of Basal Cambrian Black Shales and Cherts from the Northern Tarim Basin, Northwest China: Implications for Depositional Setting and Tectonic History. J. Asian Earth Sci. 2008, 34, 418–436. [Google Scholar] [CrossRef] [Scilit]
  48. Zhang, C.; Guan, S.; Wu, L.; Ren, R.; Wang, L.; Wu, X. Depositional Environments of Early Cambrian Marine Shale, Northwestern Tarim Basin, China: Implications for Organic Matter Accumulation. J. Pet. Sci. Eng. 2020, 194, 107497. [Google Scholar] [CrossRef] [Scilit]
  49. Fan, Q.; Lu, S.; Li, W.; Pan, W.Q.; Zhang, B.S.; Zhang, Y.Y.; Tan, Z.Z. Geochemical Characteristics and Geological Significance for Petroleum of the Middle-Lower Cambrian Marine Strata: A Case Study of Keping Area in the Tarim Basin. J. China Univ. Min. Technol. 2019, 48, 377–394. [Google Scholar]
  50. Ouyang, S.Q.; Lyu, X.X.; Xue, N.; Li, F.; Wang, R. Paleoenvironmental Characteristics and Source Rock Development Model of the Early-Middle Cambrian: A Case of the Keping-Bachu Area in the Tarim Basin. J. China Univ. Min. Technol. 2022, 51, 293–310. [Google Scholar]
  51. Bai, Z.; Li, X.; Miao, H.; Xiuxiang, L.; Zhichao, S.; Qingyao, L.; Youxing, Y.; Jinhu, Z. Paleoproductivity Conditions of Lower Member of Cambrian Xiaoerbulak Formation in Kalpin Thrust Belt, Tarim Basin. Geol. China. 2018, 45, 227–236. [Google Scholar]
  52. Zheng, J.; Zhu, Y.; Huang, L.; Yang, G.; Hu, F. Geochemical Characteristics and Their Geological Significance of Lower Cambrian Xiaoerblak Formation in Northwestern Tarim Basin, China. Minerals 2022, 12, 781. [Google Scholar] [CrossRef] [Scilit]
  53. Ying, J. Precambrian–Cambrian Paleoceanographic Environment in the Tarim Basin and Its Control on Source-Rock Development. Master’s Thesis, China University of Petroleum (East China), Qingdao, China, 2022. [Google Scholar]
  54. Deng, Q.; Zhang, H.; Wang, H.; Wei, Z.; Cheng, B.; Li, S.; Wang, Y.; Faboya, O.L.; Liao, Z. Organic Matter Accumulation Mechanism in the Lower Cambrian Strata from Well Luntan 1 in the Tarim Basin, NW China. Geofluids 2021, 2021, 6668707. [Google Scholar] [CrossRef] [Scilit]
  55. Shang, K.; Tian, J.; Lv, H.; Zhang, X.; Li, J.; Zhang, Y. Geochemical Characteristics and the Sedimentary Environment of Lower Cambrian Argillaceous Rocks on the Kongquehe Slope, Tarim Basin, China. Energies 2022, 15, 5400. [Google Scholar] [CrossRef] [Scilit]
  56. Guo, T.; Zhu, B.; Yang, T.; Chen, Y. Evolution of Sedimentary Environment of the Lower Cambrian Xishanbulake-Xidashan Formations in the Tarim Basin. Exp. Pet. Geol. 2023, 45, 252–265. [Google Scholar]
  57. Taylor, S.R.; McLennan, S.M. The Continental Crust: Its Composition and Evolution; Blackwell Scientific Publications: Oxford, UK, 1985; pp. 1–333. [Google Scholar]
  58. Shields, G.; Stille, P. Diagenetic Constraints on the Use of Cerium Anomalies as Palaeoseawater Redox Proxies: An Isotopic and REE Study of Cambrian Phosphorites. Chem. Geol. 2001, 175, 29–48. [Google Scholar] [CrossRef] [Scilit]
  59. Algeo, T.J.; Tribovillard, N. Environmental Analysis of Paleoceanographic Systems Based on Molybdenum–Uranium Covariation. Chem. Geol. 2009, 268, 211–225. [Google Scholar] [CrossRef] [Scilit]
  60. Arthur, M.A.; Dean, W.E. Organic-Matter Production and Preservation and Evolution of Anoxia in the Holocene Black Sea. Paleoceanography 1998, 13, 395–411. [Google Scholar] [CrossRef] [Scilit]
  61. Sageman, B.B.; Murphy, A.E.; Werne, J.P.; Ver Straeten, C.A.; Hollander, D.J.; Lyons, T.W. A Tale of Shales: The Relative Roles of Production, Decomposition, and Dilution in the Accumulation of Organic-Rich Strata, Middle–Upper Devonian, Appalachian Basin. Chem. Geol. 2003, 195, 229–273. [Google Scholar] [CrossRef] [Scilit]
  62. Nesbitt, H.W.; Young, G.M.; McLennan, S.M.; Keays, R.R. Effects of Chemical Weathering and Sorting on the Petrogenesis of Siliciclastic Sediments, with Implications for Provenance Studies. J. Geol. 1996, 104, 525–542. [Google Scholar] [CrossRef] [Scilit]
  63. Lin, C.; Yang, H.; Liu, J.; Rui, Z.; Cai, Z.; Zhu, Y. Distribution and Erosion of the Paleozoic Tectonic Unconformities in the Tarim Basin, Northwest China: Significance for the Evolution of Paleo-Uplifts and Tectonic Geography during Deformation. J. Asian Earth Sci. 2012, 46, 1–19. [Google Scholar] [CrossRef] [Scilit]
  64. Zhong, Z.; Xia, J.; Huang, S.; Luo, C.; Chang, H.; Li, X.; Wei, L.; Zhang, H. Reconstruction of Proto-Type Basin and Tectono-Paleogeography of Tarim Block in Early Paleozoic. Front. Earth Sci. 2023, 11, 1101360. [Google Scholar] [CrossRef] [Scilit]
  65. Tian, L.; Cui, H.F.; Liu, J.; Zhang, N.C.; Shi, X.Q. Early-Middle Cambrian Paleogeography and Depositional Evolution of Tarim Basin. Oil Gas. Geol. 2018, 39, 1011–1021. [Google Scholar]
  66. Shi, L.; Feng, Q.; Shen, J.; Ito, T.; Chen, Z.-Q. Proliferation of Shallow-Water Radiolarians Coinciding with Enhanced Oceanic Productivity in Reducing Conditions during the Middle Permian, South China: Evidence from the Gufeng Formation of Western Hubei Province. Palaeogeogr. Palaeoclimatol. Palaeoecol. 2016, 444, 1–14. [Google Scholar] [CrossRef] [Scilit]
  67. Jones, B.; Manning, D.A. Comparison of Geochemical Indices Used for the Interpretation of Palaeoredox Conditions in Ancient Mudstones. Chem. Geol. 1994, 111, 111–129. [Google Scholar] [CrossRef] [Scilit]
  68. Mansour, A.; Wagreich, M.; Gentzis, T.; Ocubalidet, S.; Tahoun, S.S.; Elewa, A.M.T. Depositional and Organic Carbon-Controlled Regimes during the Coniacian-Santonian Event: First Results from the Southern Tethys (Egypt). Mar. Pet. Geol. 2020, 115, 104285. [Google Scholar] [CrossRef] [Scilit]
  69. Algeo, T.J.; Maynard, J.B. Trace-Element Behavior and Redox Facies in Core Shales of Upper Pennsylvanian Kansas-Type Cyclothems. Chem. Geol. 2004, 206, 289–318. [Google Scholar] [CrossRef] [Scilit]
  70. Wignall, P.B.; Hallam, A. Anoxia as a Cause of the Permian/Triassic Mass Extinction: Facies Evidence from Northern Italy and the Western United States. Palaeogeogr. Palaeoclimatol. Palaeoecol. 1992, 93, 21–46. [Google Scholar] [CrossRef] [Scilit]
  71. Hatch, J.R.; Leventhal, J.S. Relationship between Inferred Redox Potential of the Depositional Environment and Geochemistry of the Upper Pennsylvanian (Missourian) Stark Shale Member of the Dennis Limestone, Wabaunsee County, Kansas, USA. Chem. Geol. 1992, 99, 65–82. [Google Scholar] [CrossRef] [Scilit]
  72. Xiao, W.; Cao, J.; Wang, X.; Xiao, D.; Shi, C.; Zhang, S. Marine Chemical Structure during the Cambrian Explosion. Earth Sci. Rev. 2024, 251, 104716. [Google Scholar] [CrossRef] [Scilit]
  73. Liu, W.; Gao, P.; Lash, G.G.; Xiao, X. Co-Evolution of Life and Environment during the Early Cambrian of South China: Implications for Organic Matter Enrichment. Earth Sci. Rev. 2025, 271, 105294. [Google Scholar] [CrossRef] [Scilit]
  74. Gao, P.; Li, S.; Lash, G.G.; Yan, D.; Zhou, Q.; Xiao, X. Stratigraphic Framework, Redox History, and Organic Matter Accumulation of an Early Cambrian Intraplatfrom Basin on the Yangtze Platform, South China. Mar. Pet. Geol. 2021, 130, 105095. [Google Scholar] [CrossRef] [Scilit]
  75. Liu, H.; Wu, Y.; Liu, S.; Wang, X.; Tian, H. Significant Influence of Terrestrial Input on Organic Matter Accumulation in the Lower Cambrian Shuijingtuo Formation of South China. Palaeogeogr. Palaeoclimatol. Palaeoecol. 2026, 681, 113419. [Google Scholar] [CrossRef] [Scilit]
Figure 1. Tectonic sketch map and sample location of the Tarim Basin. (Modified from [34]).
Geosciences 16 00258 g001
Figure 2. Ternary diagrams of the excess components (Xxs) of paleoproductivity proxies in Lower Cambrian source rocks of the Tarim Basin. (ac): Northwestern Tarim (Є1y and Є1xr); (df): northern Tarim (Є1y and Є1xr); (gi): eastern Tarim (Є1xs and Є1xd).
Geosciences 16 00258 g002
Figure 3. Ternary diagrams showing regional variations in the excess components (Xxs) of paleoproductivity proxies in Lower Cambrian source rocks of the Tarim Basin. (ac) Lower Cambrian units (Є1y and Є1xs); (df) upper Lower Cambrian units (Є1xr and Є1xd).
Geosciences 16 00258 g003
Figure 4. Correlation matrices of TOC and productivity-related geochemical proxies in different Lower Cambrian formations of the Tarim Basin. (Color scale indicates correlation coefficients (−1 to 1), with red representing positive correlations and blue representing negative correlations. * indicates significance at the 0.05 level).
Geosciences 16 00258 g004
Figure 5. Early Cambrian paleogeographic and depositional framework of the Tarim Basin [48].
Geosciences 16 00258 g005
Figure 6. MoEF–UEF covariation and inferred depositional redox conditions of Lower Cambrian source rocks in the Tarim Basin.
Geosciences 16 00258 g006
Table 1. The Lower Cambrian stratigraphic correlation in the Tarim Basin [26,31].
ChronostratigraphyNumerical
Age (Ma)
Lithostratigraphy
InternationalChinaTarim North-NorthwestTarim Eastern
PaleozoicCambrianSecond DivisionLower
Cambrian
514WusonggeerXidashan
521Xiaoerbulake
Newfoundland Xishanbulake
541Yuertusi
Table 2. Summary of the studied formations, sampling locations, and data sources.
AreaFormationLithologyNumberReference
Tarim-NWYuertusiblack shale; carbonate rocks;
Siliceous shale; Silicate mudstone
171[30,34,47,48,49]
Tarim-NWXiaoerbulakegray-black mudstone; dolomite141[33,34,49,50,51,52]
Tarim-NYuertusiblack shale;Muddy limestone60[53,54]
Tarim-NXiaoerbulakelimestone36[53,54]
Tarim-EXishanbulakeSilicified mudstone and mud shale interbedded with thin layers of silicified rock35[34,53,55,56]
Tarim-EXidashanSilicate mudstone;The mud shale is interspersed with thin layers of siliceous rock and mudstone; dolomite86[34,53,55,56]
Table 3. Statistical summary of TOC major- and trace-element contents and REE concentrations in the Lower Cambrian source-rock samples *.
ElementTarim-NWTarim-NTarim-E
YuertusiXiaoerbulakeYuertusiXiaoerbulakeXishanbulakeXidashan
TOC/%0.03–22.6 (4.19)0.01–5.24 (0.91)0.27–9.84 (2.97)0.22–0.58 (0.4)0.08–10.21 (2.03)0.06–2.12 (1)
Al/%0.06–10.32 (2.97)0.01–0.91 (0.06)0.44–2.68 (1.62)0.62–1.3 (1.03)0.4–7.35 (2.64)0.80–5.07 (2.28)
Fe/%0.03–5.22 (1.47)0.02–1.57 (0.12)0.38–1.64 (1.14)0.41–0.83 (0.68)0.27–2.31 (1.24)0.41–25.37 (1.99)
P/ppm21.82–46,563.88 (3878.92)20–180 (75.55)80–4981.53 (722.34)80–151.46 (120.97)82.96–30,584.63 (1621.92)87.28–4567.04 (317.58)
Ba/ppm10.32–412,800 (8707.66)1.36–760.17 (30.08)566.44–13,757.09 (5095.64)1806.35–6725.12 (3902.44)179.7–10,000 (2050.02)279–8165.49 (1520.55)
Ni/ppm0.51–473 (56.47)0.48–22.37 (4.41)3.3–231.01 (76.07)4.09–18.6 (8.4)2.94–410.53 (83.80)4.12–221 (51.38)
Cu/ppm0.24–1170 (108.76)0.38–924.03 (9.35)2.90–143.07 (36.08) 4.3–9.6 (6.14)9.75–1796.17 (151.3)6.23–245 (35.67)
Zn(ppm)0.32–2506.87 (173.33)0.47–97.26 (11.31)11–305.05 (83.96)14–28 (21.78)9.0–2070 (201.95)8–949 (78.51)
V (ppm)4–12,207 (1255.55)0.03–31.53 (5.17)8–717 (220.62)11–38 (20.09)112.58–21,971.57 (1658.28)18.19–2919.66 (396.87)
Cr/ppm8.58–2510 (326.95)0.02–35.17 (5.69)12.03–249.69 (68.37)21.4–53.27 (32.96)14.9–2330.41 (223.65)15.0–160.16 (47.27)
Mo/ppm0.04–283 (22.38)0.01–10.9 (0.57)0.79–162.03 (44.13)0.39–5.93 (1.36)4.94–300 (65.51)0.83–141 (30.46)
U/ppm0.46–235 (34.2)0.38–4.56 (0.89)0.75–76.65 (16.55)0.86–3.23 (1.24)5.58–201 (44.47)2.41–39.34 (13.26)
Co/ppm0.7–75 (5.88)0.004–4 (0.72)1.4–8.7 (5.3)1.9–3 (2.5)0.6–15.4 (5.97)1.8–18.3 (7.07)
Sc/ppm0.15–16.15 (5.03)0.41–12.5 (4.52)1.63–9.34 (5.4)
REE/ppm3.03–478.93 (117.54)0.6–38.97
(6.94)
17.52–88.01 (53.34)13.14–537.78 (110.89)22.68–185.44 (73.8)
* Values are reported as min–max (average); “–” indicates no available data.
Table 4. Statistical characteristics of XEF and Xxs components of paleoproductivity proxies in northwestern and eastern Tarim.
AreaFm.ProxyAverageMdQ1Q3IQRMinMaxNumber of
Extreme Outliers
Tarim-NWYuertusiPEF41.8612.196.2836.5330.240.07510.0812
NiEF7.793.281.576.775.200.1391.0012
CuEF13.113.950.7610.409.640.09163.8313
ZnEF14.374.851.1914.7213.530.05143.6710
BaEF154.174.531.3643.1241.76 0.145642.5418
Pxs3988.77 1686.396 529.70 4189.61 3659.91 −457.2346,363.69 8
Nixs30.98 19.05 1.89 46.66 44.77 −37.14242.662
Cuxs74.01 20.55 −0.75 60.16 60.91 −33.771161.5111
Znxs144.61 53.113.44 153.73 150.28 −51.932469.086
Baxs7234.43 121.86 −29.22 1299.57 1328.79 −427.50412,423.3829
XiaoerbulakePEF65.3751.8434.8685.8050.941.93185.900
NiEF38.7325.48 15.62 43.67 28.05 3.76 169.81 3
CuEF24.0623.0210.33 38.16 27.84 1.1360.060
ZnEF54.0642.24 21.89 58.88 36.99 1.77365.072
BaEF22.3018.84 7.49 31.72 24.23 0.48 118.731
Pxs70.6060.0040.00107.5067.5020.00180.000
Nixs3.16 1.70 1.002.78 1.77 0.33 21.2715
Cuxs9.68 2.20 0.77 2.66 1.89 −0.62 923.833
Znxs9.71 7.61 4.32 11.627.30 −0.4096.922
Baxs28.07 12.50 4.23 28.49 24.27 −17.98745.733
Tarim-EXishanbulakePEF20.73 1.80 1.30 5.03 3.73 0.50312.99 3
NiEF7.84 6.00 3.68 10.82 7.14 0.5119.230
CuEF5.22 3.36 2.85 4.55 1.70 2.26 33.901
ZnEF14.12 6.45 2.71 12.96 10.25 0.55158.781
BaEF17.2212.995.0719.6314.562.1158.780
Pxs398.32114.3276.15436.68360.53−77.623164.791
Nixs43.5432.269.9661.4651.50−21.34182.010
Cuxs183.0859.2228.1892.1463.968.251786.392
Znxs169.0334.3019.5578.0458.49−28.212056.413
Baxs1925.22836.00424.522555.622131.10154.389849.422
XidashanPEF1.74 1.66 1.11 2.22 1.11 0.413.89 0
NiEF4.69 3.67 2.27 5.88 3.61 1.0634.381
CuEF3.39 2.76 2.12 3.41 1.29 1.13 41.921
ZnEF4.11 2.29 1.75 3.22 1.47 0.3335.367
BaEF9.968.775.4614.158.693.4519.670
Pxs66.2769.0835.06104.0869.02−353.78397.811
Nixs36.5317.599.4344.8735.44−15.06213.311
Cuxs27.1219.107.6427.7120.07−12.56238.013
Znxs74.4715.607.8664.6856.82−41.23906.544
Baxs1346.89804.96535.951979.231443.28211.837705.791
Table 5. Paleoredox evaluation index.
IndexV/CrNi/CoV/(V + Ni)U/Th
Anoxia>4.25>7.0>0.6>1.25
Oxygen-Depleted2.0~4.255.0~7.00.45–0.60.75~1.25
Oxygen-Enriched<2.0<5.0<0.45<0.75
reference[70][67][71][67]
Table 6. Distribution of trace element, REE contents and parameters of the source rock samples.*
ProxyTarim-NWTarim-NTarim-E
YuertusiXiaoerbulakeYuertusiXiaoerbulakeXishanbulakeXidashan
VEF0.57–218.82 (31.88)0–42 (11.61)1.07–37.1 (9.12)0.81–1.82 (1.13)3.06–88.4 (20.58)1.15–50.49 (9.26)
CrEF0.87–793.22 (42.23)0.79–20.27 (8.97)1.7–21.64 (4.96)1.75–4.56 (2.76)1.08–7.69 (3.06)1.12–5.85 (1.78)
MoEF0.72–1580 (133.23)0–462 (103.98)15.08–1387 (292.14)3.41–39.85 (11.46)38.63–1955.98 (348.51)27.39–701.8 (147.05)
UEF1.95–1986.62 (85.44)0–793.85 (381.39)15.38–503.74 (107.6)7.64–23.85 (11.17)15.33–422.74 (73.15)2.82–73.2 (20.78)
V/(V + Ni)0.38–1 (0.9)0.01–0.95 (0.51)0.5–0.95 (0.75)0.55–0.79 (0.7)0.48–1 (0.88)0.52–0.98 (0.83)
U/Th0.85–141.4 (18.2)0.42–172.15 (14.18)0.66–16.95 (4.31)0.45–1.46 (0.63)0.9–2.63 (1.78)0.7–3.38 (1.38)
V/Cr0.06–17.4 (3.67)0.03–49.99 (3.38)0.21–8.11 (2.84)0.37–13.58 (3.14)0.91–28.88 (10.59)1.13–21.66 (8.11)
Ni/Co1.27–193.06 (19.36)0.40–282.73 (13.55)2.06–35.74 (11.13)2.39–16.46 (5.94)6.65–39.96 (16.98)2.89–55.53 (8.11)
Eu/Eu *0.61–61.6 (1.35)0.65–1.37 (0.91)0.69–5.13 (2.23)0.51–1.87 (0.97)0.66–1.71 (1.04)
Ce/Ce *0.17–1.03 (0.64)0.67–1.01 (0.89)0.79–2.34 (1.09)0.35–0.95 (0.69)0.65–0.94 (0.81)
(LREE/HREE)N0.1–3.23 (0.67)0.49–1.09 (0.8)0.29–0.89 (0.65)0.53–25.82 (9)0.45–15.82 (2.96)
* min–max (average).
Disclaimer/Publisher’s Note: The statements, opinions and data contained in all publications are solely those of the individual author(s) and contributor(s) and not of MDPI and/or the editor(s). MDPI and/or the editor(s) disclaim responsibility for any injury to people or property resulting from any ideas, methods, instructions or products referred to in the content.