Article

Cyclic Shear Responses of Saw-Tooth Artificial Rock Joints Under Constant Normal Load Conditions: Laboratory Investigation and Numerical Simulation

1
China Communications Construction Corporation-Guanghang Dredging Co., Ltd., Guangzhou 510290, China
2
China Communications Construction Corporation Guangzhou Dredging Co., Ltd., Guangzhou 510290, China
3
State Key Laboratory for Tunnel Engineering, School of Civil Engineering, Sun Yat-sen University, Zhuhai 519082, China
*
Author to whom correspondence should be addressed.
Geosciences 2026, 16(6), 207; https://doi.org/10.3390/geosciences16060207
Submission received: 2 March 2026 / Revised: 7 May 2026 / Accepted: 20 May 2026 / Published: 22 May 2026

Abstract

Understanding the movement behavior of upper blocks along rock joints or weak planes is crucial for the geological hazard forecast and prediction. This paper presents experimental and numerical investigations of a saw-tooth joint under shear and normal load conditions. Multi-stage direct shear tests under different normal load conditions were conducted using a direct shear box apparatus. The reverse dilation behavior of the upper specimen was observed by measuring the normal displacement at the four corners of the upper block. Laboratory test results show that, under lower normal loads, the normal displacement of the upper specimen on the applied shear force side initially decreases (settlement), while the settlement reverses to heave (dilation) when the shear displacement reaches a certain value. However, the settlement reverse behavior does not occur under large normal loads. Corresponding numerical simulation confirms that this settlement reversal is controlled by the specimen fracturing. The saw-tooth asperities are sheared off under a large normal load, while the upper specimen climbs along the slope of the bottom specimen under lower normal loads. Consequently, the changes in contact area, interface normal stress, interface shear stress, and normal displacement of the joint differ significantly between large and low normal load conditions. This research deepens our understanding of the shear-induced dilation and fracture behavior of saw-tooth joints, and the results can provide guidelines for evaluating the stability of geological rock mass.

1. Introduction

The stability and serviceability of civil and mining engineering projects are significantly influenced by the existence of joints and fractures in rocks and rock masses [1,2,3,4,5]. These joints and fractures reduce the strength and stiffness of rocks and rock masses [6,7], complicating the safety evaluation of rock engineering structures [8,9,10,11,12,13,14,15,16,17]. Rock joints are typically characterized by both surface roughness and matching degree; the shear behavior of joint surfaces is influenced by the coupling of multiple factors [10,11,12]. Although the traditional Barton JRC-JCS model is widely applied, it often overpredicts the shear strength of natural joints because it fails to adequately account for the Joint Matching Coefficient (JMC)—the geometric characteristics of joint contact significantly affect shear strength [8,9]. For the hydro-mechanical coupling behavior of fractured rock masses, numerical approaches like the Implicit Joint Continuum Model (IJCM) provide an effective framework for analyzing stress-induced anisotropy and shear-enhanced permeability [17]. Furthermore, under cyclic normal stress, frictional sliding along joints exhibits complex nonlinear dynamic features, such as the transition from stick-slip to chaotic sliding. This behavior typically requires in-depth analysis by integrating the Rate and State Friction Law with Spring-Block models [14,15,16]. A novel structural anisotropy classification method based on the Theoretical Rock Quality Designation (TRQD), incorporating the Joint Matching Coefficient (JMC) and an improved Anisotropy Index, effectively overcoming the limitations of conventional Rock Quality Designation (RQD) in characterizing rock masses with extremely dense or widely spaced joints [12]. This anisotropic behavior is particularly pronounced in columnar jointed rock masses (CJRM); the interaction between large-scale columnar joints and interlayer shear weak zones induces complex failure modes, including compression-shear failure along columnar joints and tensile-sliding failure along weak planes [13]. A deeper understanding of the shear behavior of joints is crucial for numerous engineering projects and for predicting engineering disasters [18,19,20]. Among various testing methods, direct shear tests under CNL boundary conditions have been widely adopted to characterize the shear strength, dilation, and damage evolution of rock joints in recent decades [18,19,20,21,22,23,24]. To simplify the complex morphology of natural joint surfaces, regular geometric profiles (e.g., sine-shaped and saw-tooth asperities) are commonly used in laboratory investigations [1,25,26,27,28,29,30].
Patton proposed a bilinear shear strength model for idealized saw-tooth joints and first classified joint asperities into first-order (waviness) and second-order (unevenness) categories based on their geometric scales and mechanical contributions [26]. Subsequent studies by Barton, Hoek, and Bray further demonstrated that second-order asperities control shear behavior under low normal loads, while first-order asperities dominate as normal loads increase and smaller asperities are sheared off [1,25]. Huang et al. performed laboratory investigations on artificial saw-tooth-shaped asperities of hydrostone under small sliding displacements, demonstrating that joint dilation, surface roughness damage, and cyclic sliding are governed by normal load levels [27]. Yang and Chiang investigated the progressive shear behavior of tooth-shaped joints using four types of artificial specimens (single-tooth joints with 30° and 15°; composite joints with 15° + 30°and 30° + 15°angles). For single-tooth joints, slide-up behavior occurs at low normal stresses, leading to a more ductile shear stress–displacement response. In contrast, a brittle post-peak stress drop is observed under high normal loads. For composite joints, the dilation curve exhibits a distinct two-stage characteristic, and the shear stress–displacement curve shows a pronounced twin-peak pattern at low normal stresses. At elevated stress levels, however, both the shear stress and dilation–displacement curves of composite joints become comparable to those of single-tooth joints [28]. Jiang et al. conducted direct shear tests coupled with real-time acoustic emission (AE) monitoring on 3D-engraved saw-tooth sandstone joint specimens under different numbers of wetting–drying cycles. They elucidated the degradation law of joint shear behavior induced by wetting–drying cycles, which manifests as reduced shear strength, a transition in failure mode from brittle fracture to progressive frictional wear, and a decreased proportion of high-energy brittle fracture AE events. Furthermore, a modified shear strength model accounting for the degradation effect of wetting–drying cycles was established based on Barton’s JRC-JCS criterion [31].
Despite extensive research, most previous studies have relied on average normal displacement measurements to evaluate joint dilation behavior, despite the ISRM-suggested method, recommending 3–4 LVDTs for accurate characterization [32,33,34,35]. However, multiple transducers complicate shear box devices. Therefore, average normal displacements are commonly used in previous studies [36,37,38,39,40,41]. For saw-tooth joints in particular, the non-uniform contact and deformation patterns remain poorly understood, leading to subjective interpretations of test results. Detailed analyses have confirmed non-uniform deformations and stresses in soil and planar joint tests [42,43,44], but analogous studies on saw-tooth joints are still lacking. Yin et al. studied the unloading-induced shear performance of 3D saw-tooth rock fractures, but their study focused on the overall shear strength and dilation law under unloading conditions, and did not carry out fine measurements of non-uniform normal displacement or reveal the reverse dilation behavior. This study focuses on the fine characterization of non-uniform displacement and the mechanism of dilation reverse behavior under constant normal load (CNL) conditions, which makes up for the deficiency of the latest research in the fine mechanical behavior of saw-tooth joints [29]; Zhang et al. and Tao et al. studied the shear behavior of rock joints under dynamic normal load and cyclic normal load, but their research objects are mostly planar joints or rough joints with irregular asperities, and there are few studies on the cyclic shear behavior of regular saw-tooth joints with fine displacement measurement [22,24].
In practice, researchers commonly evaluate shear strength using the average shear stress, yet interfacial stresses are inherently non-uniform across the joint surface. Both approaches, however, only allow for subjective interpretation of direct shear test results.
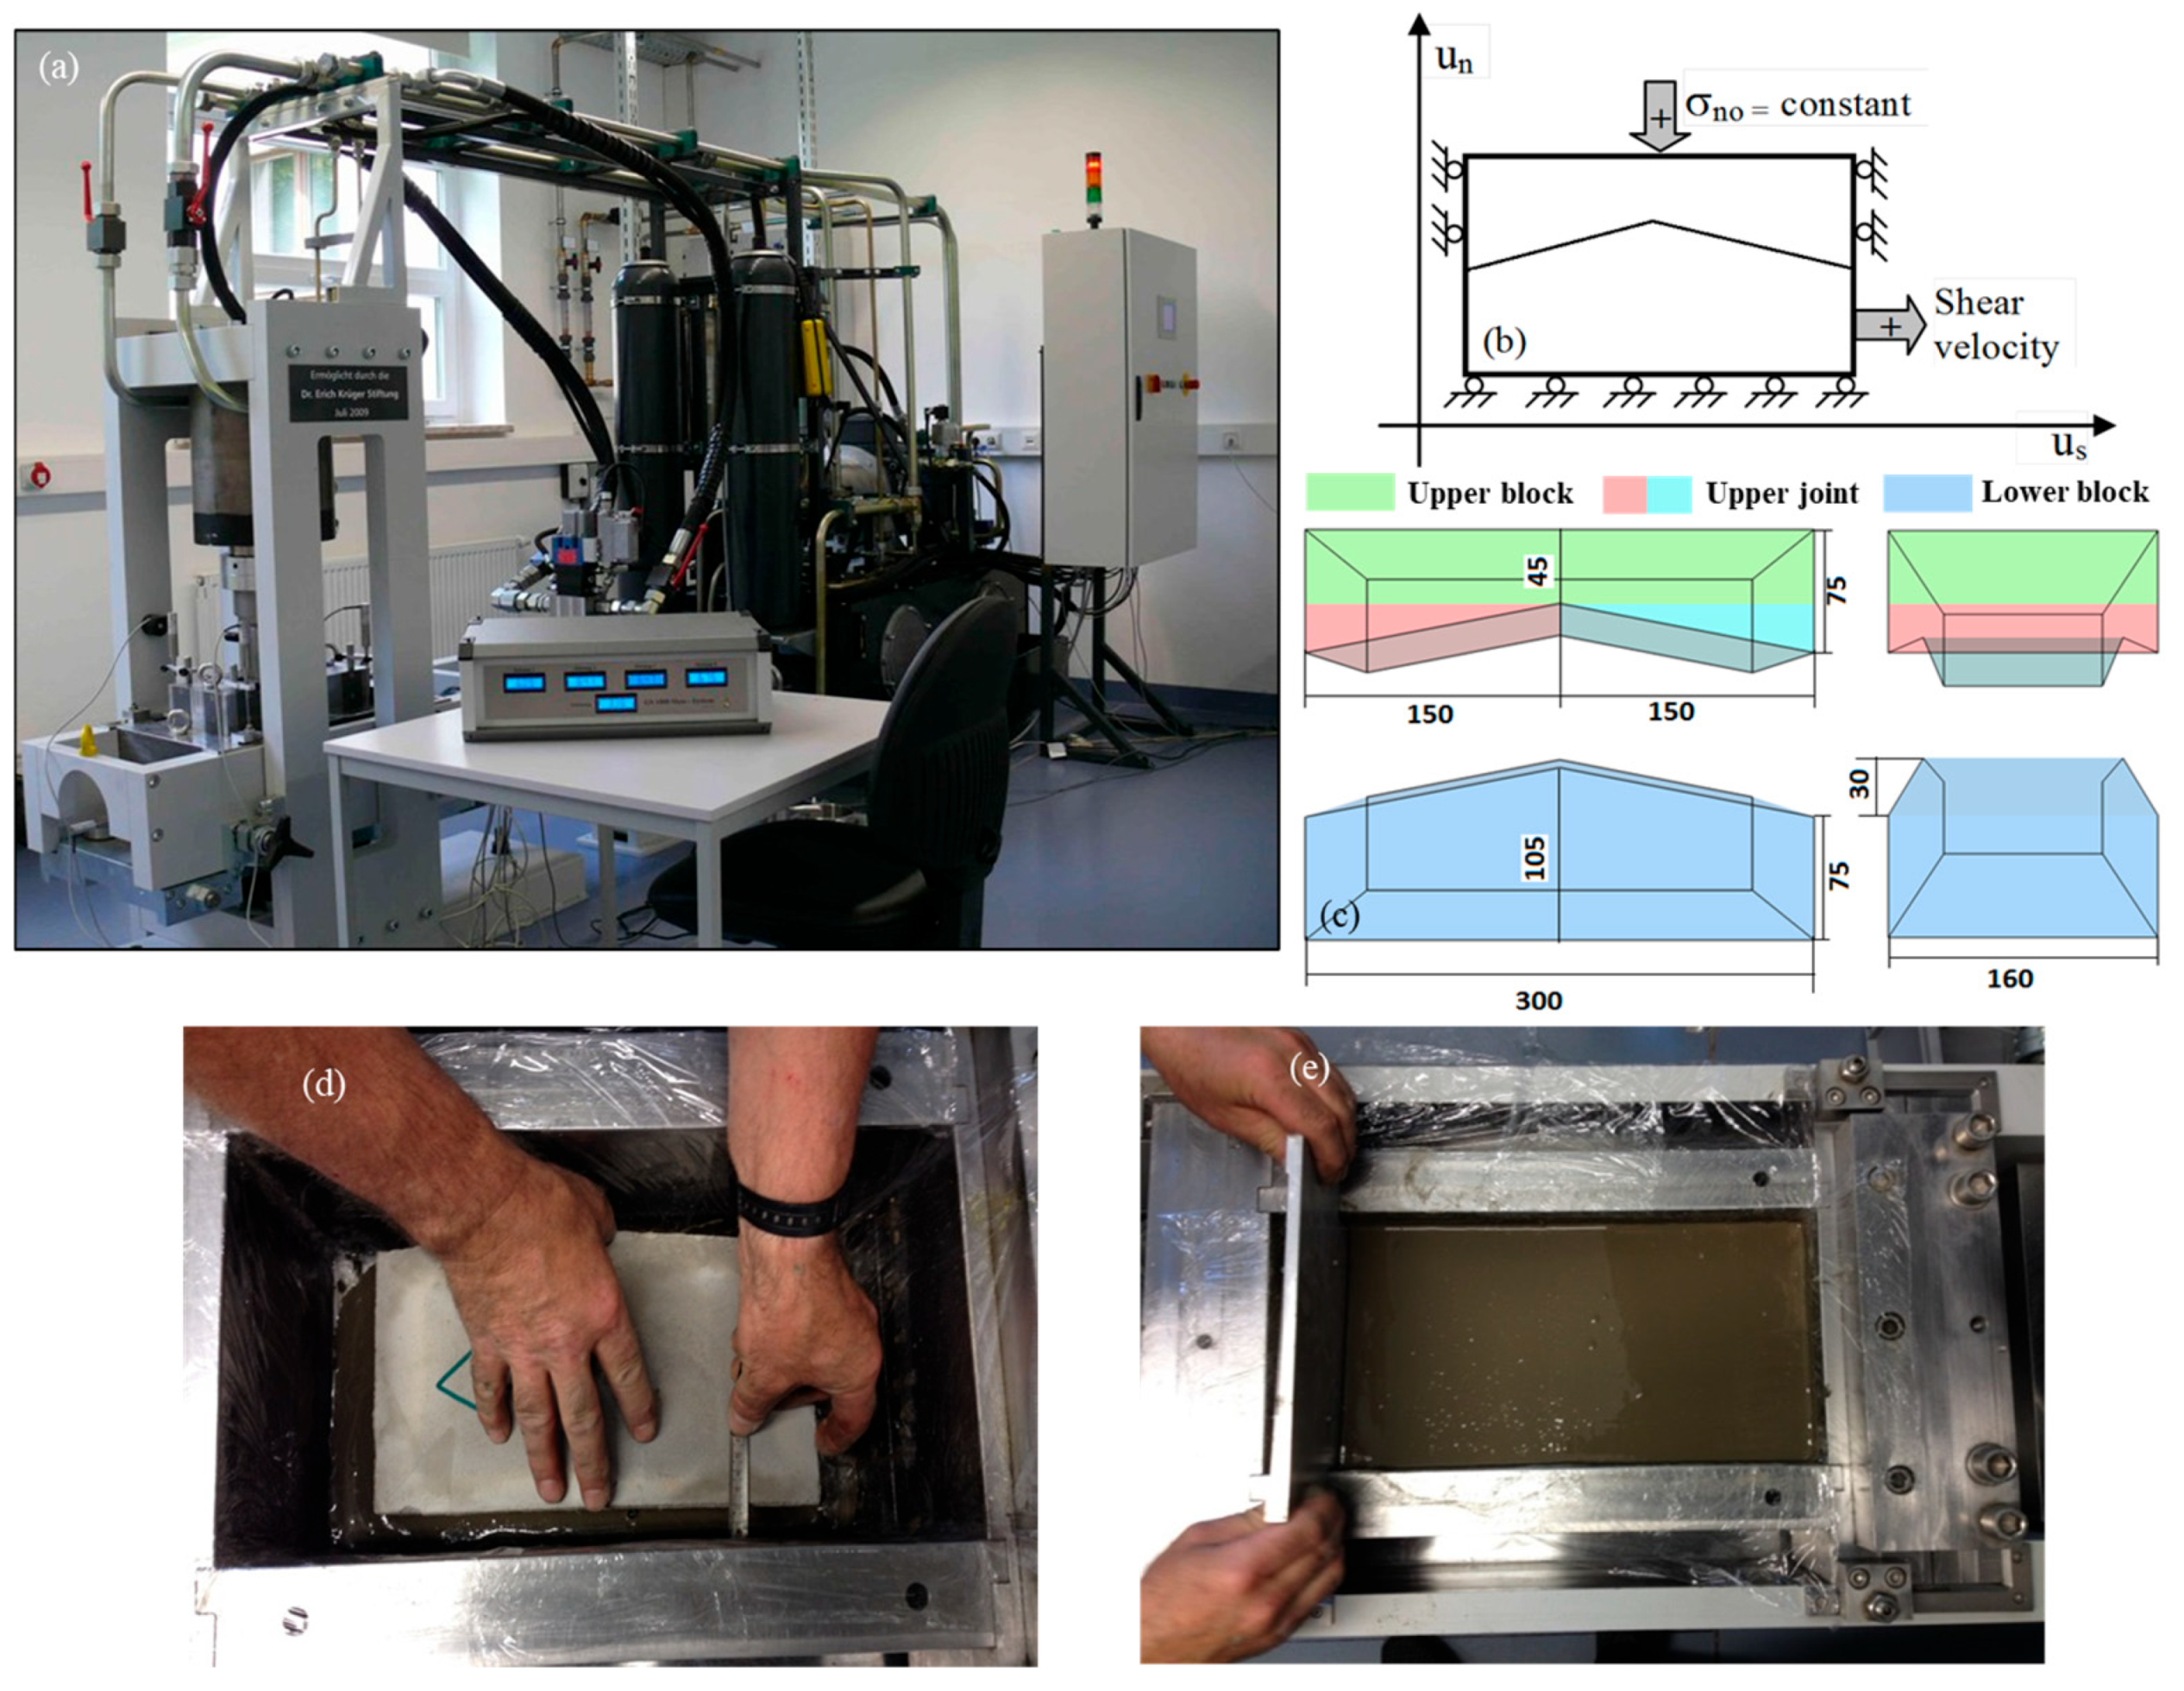
To address this gap, this study performed a series of CNL direct shear tests on single saw-tooth artificial rock joints using a large-scale GS-1000 shear box apparatus (Figure 1a). Normal displacements of the upper specimen were measured at the four corners using four high-accuracy LVDTs (± 0.001 mm). Furthermore, FLAC3D was used for calibrating the laboratory tests. Particular attention was paid to the evolution of contact area, interface stress distribution, and fracture modes under different normal load conditions (i.e., the joint surface).

2. Laboratory Tests

2.1. Specimen Preparation

Artificial rock-like specimens were fabricated using a mixture of CEM I 32.5 R cement, water, and Hohenpockaer glass sand, with a cement-to-glass sand mass ratio of 1:3. The mixture was cast into steel molds and cured at room temperature (20 ± 2 °C) for 28 days. The final specimen dimensions were 300 mm (length) × 160 mm (width) × 150 mm (height), with a single saw-tooth joint of 30 mm height (Figure 1c).
The mechanical properties of the cured material were determined through standard uniaxial compression and Brazilian tests: uniaxial compressive strength = 19.1 MPa, tensile strength = 2.5 MPa, Young’s modulus = 30 GPa, Poisson’s ratio = 0.2, density = 2.50 g/cm3, cohesion = 7.2 MPa, and dilation angle = 10°. The 10° inclination angle falls within the typical low-angle range (5–15°) commonly used in fundamental studies of joint dilation behavior. This choice ensures direct comparability of our results with the extensive existing literature, allowing us to clearly identify the novel settlement-to-dilation transition phenomenon that was not observed in previous studies.
The basic friction angle of the saw-tooth joint interface was determined through standard direct shear tests on planar joint specimens, in strict accordance with the ISRM-suggested method for laboratory determination of rock joint shear strength. The specimen was subjected to direct shear tests at a constant shear rate of 3.0 mm/min under three normal loads (90 kN, 180 kN, and 360 kN). The linear regression of the shear stress normal stress relationship showed that the basic friction angle of the specimen was 38°.
The adopted saw-tooth artificial rock joints were designed with regular triangular asperities with a fixed inclination angle. In order to obtain the connection between our samples and rocks with natural joint conditions. The JRC scale, proposed by Barton and Choubey [45], is the most widely used index for quantifying rock joint surface roughness. For idealized regular triangular saw-tooth joints, the equivalent JRC value can be reliably estimated using the empirical formula derived and verified by Barton and Bandis based on extensive laboratory tests [46]:
J R C 32.2   × tan φ
where φ is the inclination angle of the saw-tooth asperity in degrees.
For the saw-tooth joint adopted in this study, with an inclination angle of 10°. The geometric parameters of the tested saw-tooth joints correspond to a JRC range of approximately 5–8. According to the Barton standard profile classification system, this range represents the common moderately rough natural rock joints in engineering rock masses (e.g., sandstone, limestone, shale).

2.2. Test Procedure

All direct shear tests were conducted under CNL boundary conditions (shown in Figure 1b) using the GS-1000 servo-controlled shear box system. The shear box has internal dimensions of 350 mm (length) × 200 mm (width) × 200 mm (height), with a maximum normal loading capacity of 1000 kN and a maximum shear loading capacity of 1000 kN. The system is equipped with a full-digital servo closed-loop control module, supporting constant normal load (CNL), constant normal stiffness (CNS), and constant shear displacement/force control modes. Normal displacements were measured by four independent linear variable differential transformers (LVDTs) with an accuracy of ±0.001 mm and a measuring range of ±10 mm, which were vertically mounted at the four corners of the upper specimen to capture non-uniform deformation characteristics.
Two identical specimens (designated CNL-1 and CNL-2) were tested at a constant shear velocity of 3.0 mm/min, with a maximum shear displacement of 20 mm. The gaps between the specimens and shear box were filled with concrete to ensure uniform load transfer, and plastic foam was installed at the specimen edges to prevent edge damage (Figure 1d,e). Normal loads were applied 40 min after specimen installation, and shear tests were initiated after a 3-day stabilization period to eliminate creep effects.
For specimen CNL-1, sequential normal loads of 30 kN, 60 kN, 90 kN, 180 kN, and 360 kN were applied. For specimen CNL-2, normal loads of 48 kN, 96 kN, and 240 kN were used to verify the repeatability of results. During each shear cycle, horizontal shear displacement, shear force, and normal displacements at the four corners of the upper specimen were continuously recorded at a sampling frequency of 10 Hz.

3. Test Results

3.1. Shear Force-Shear Displacement Characteristics

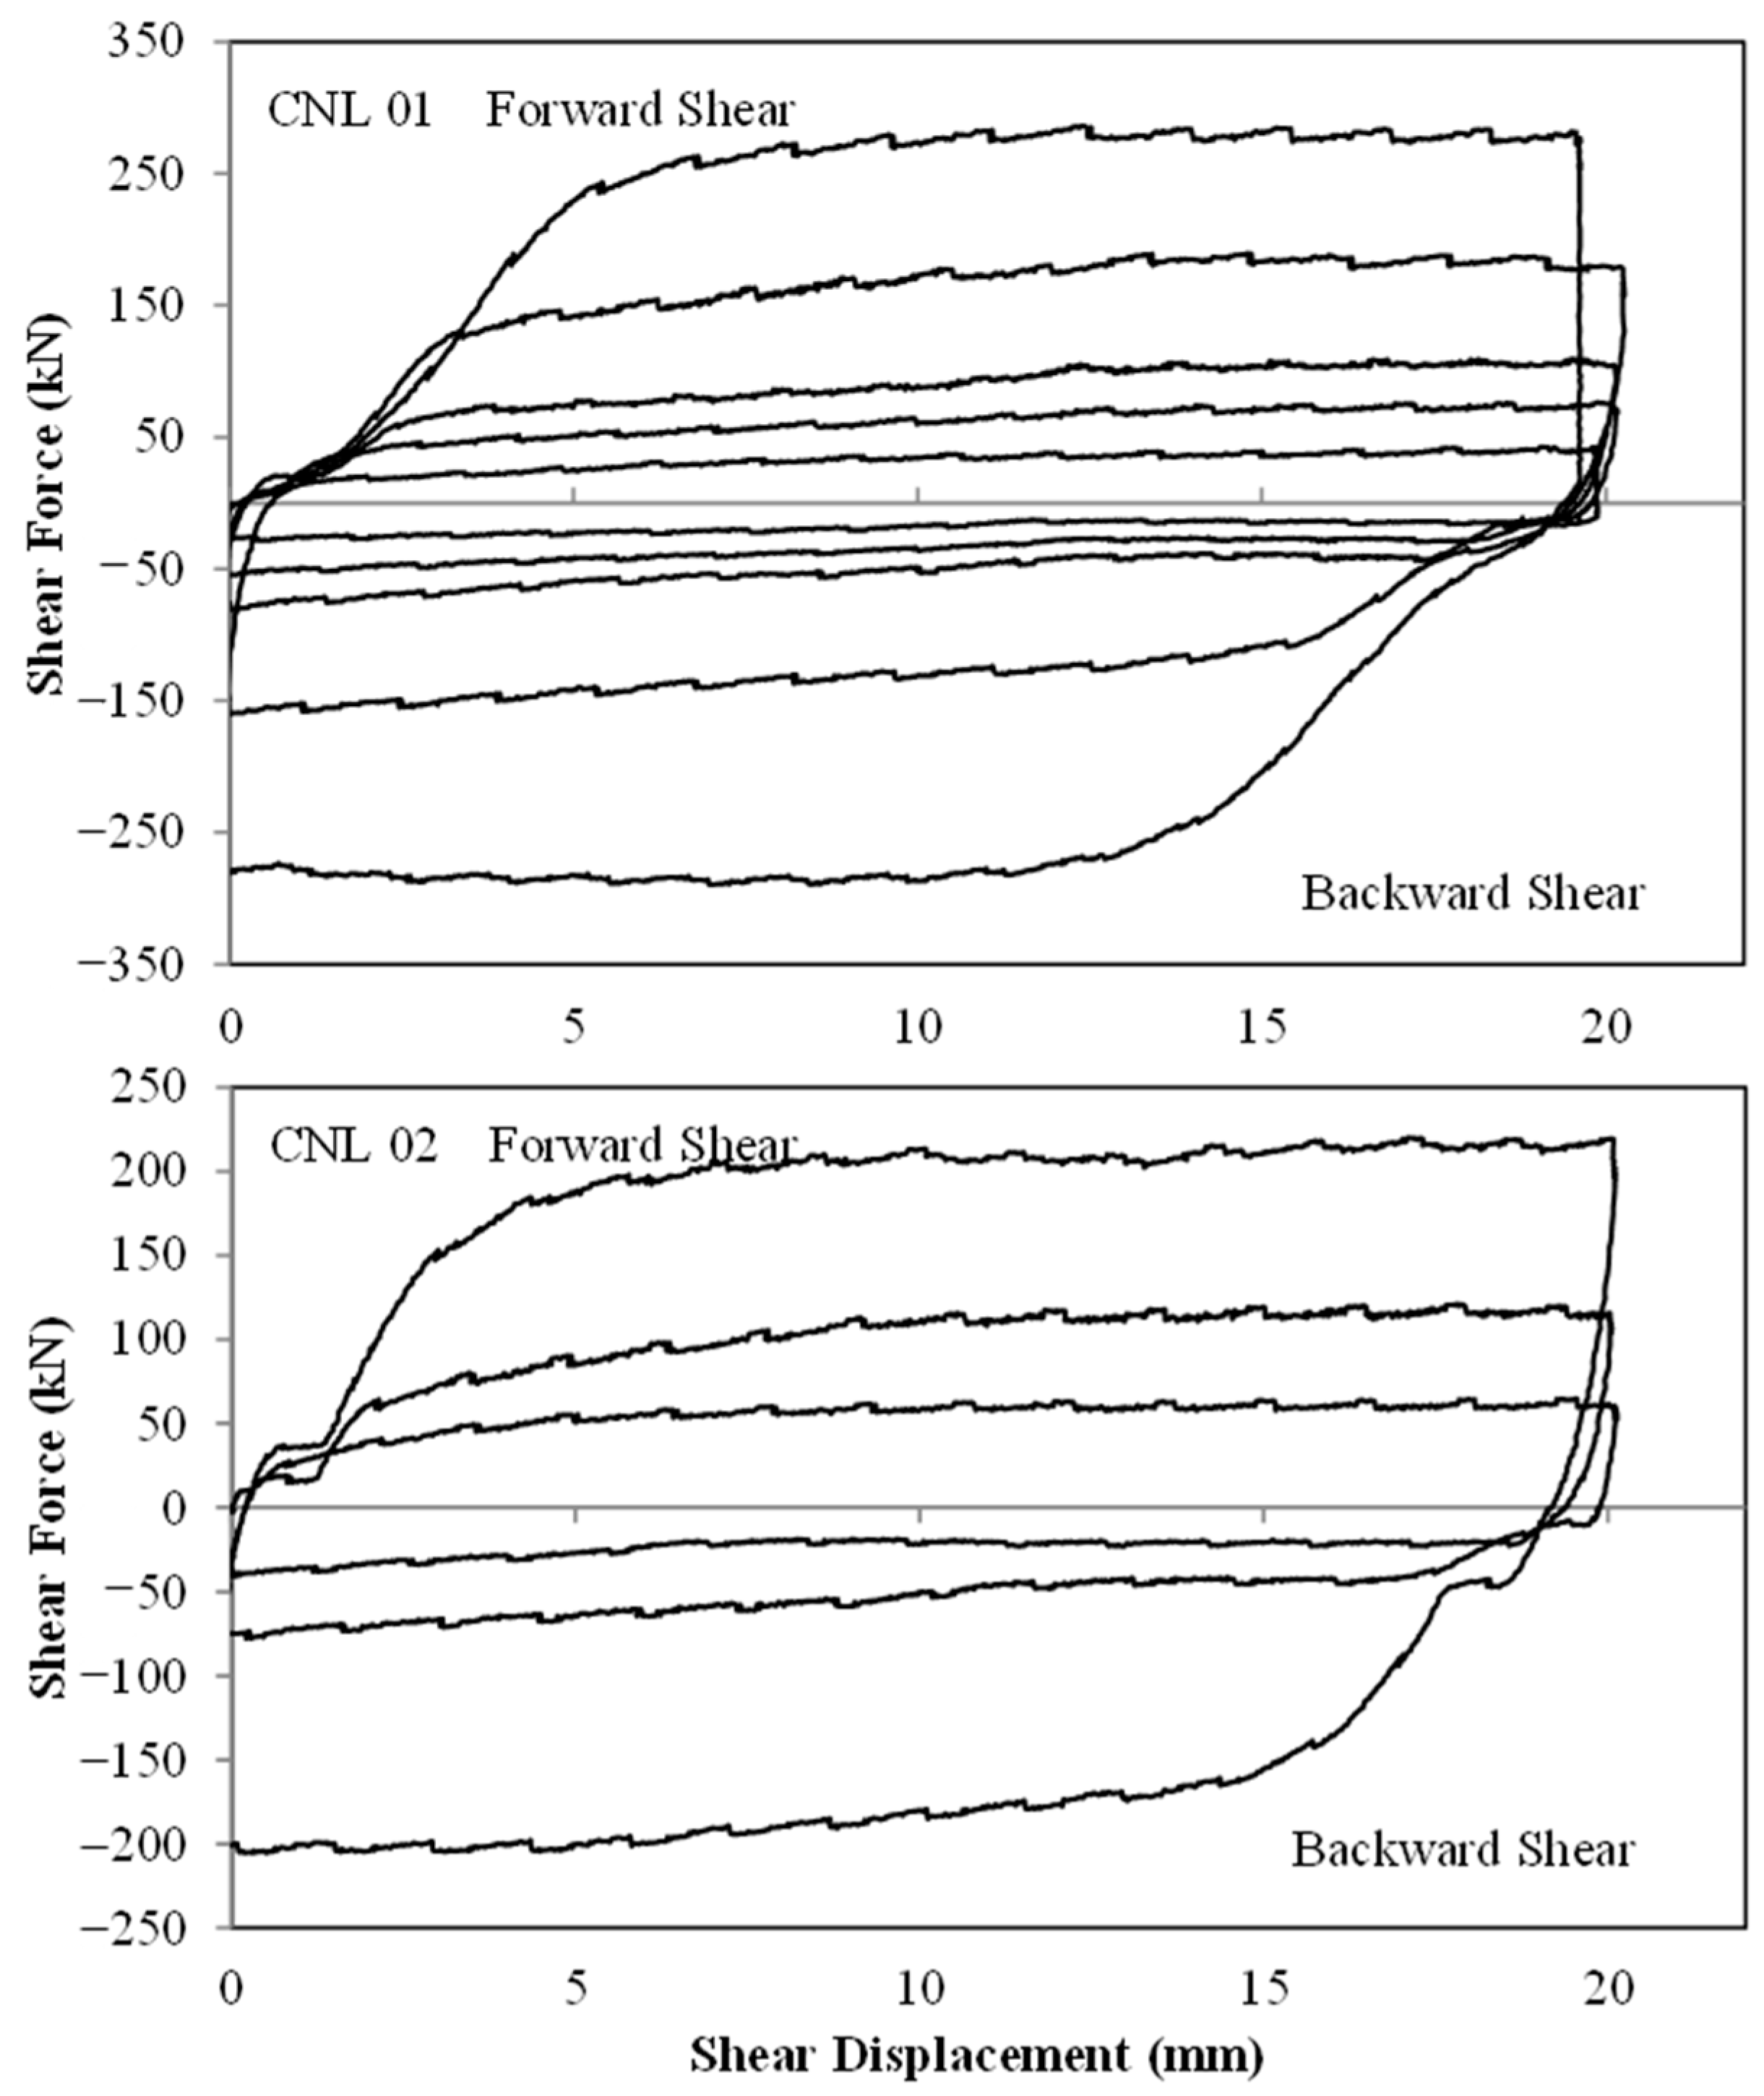
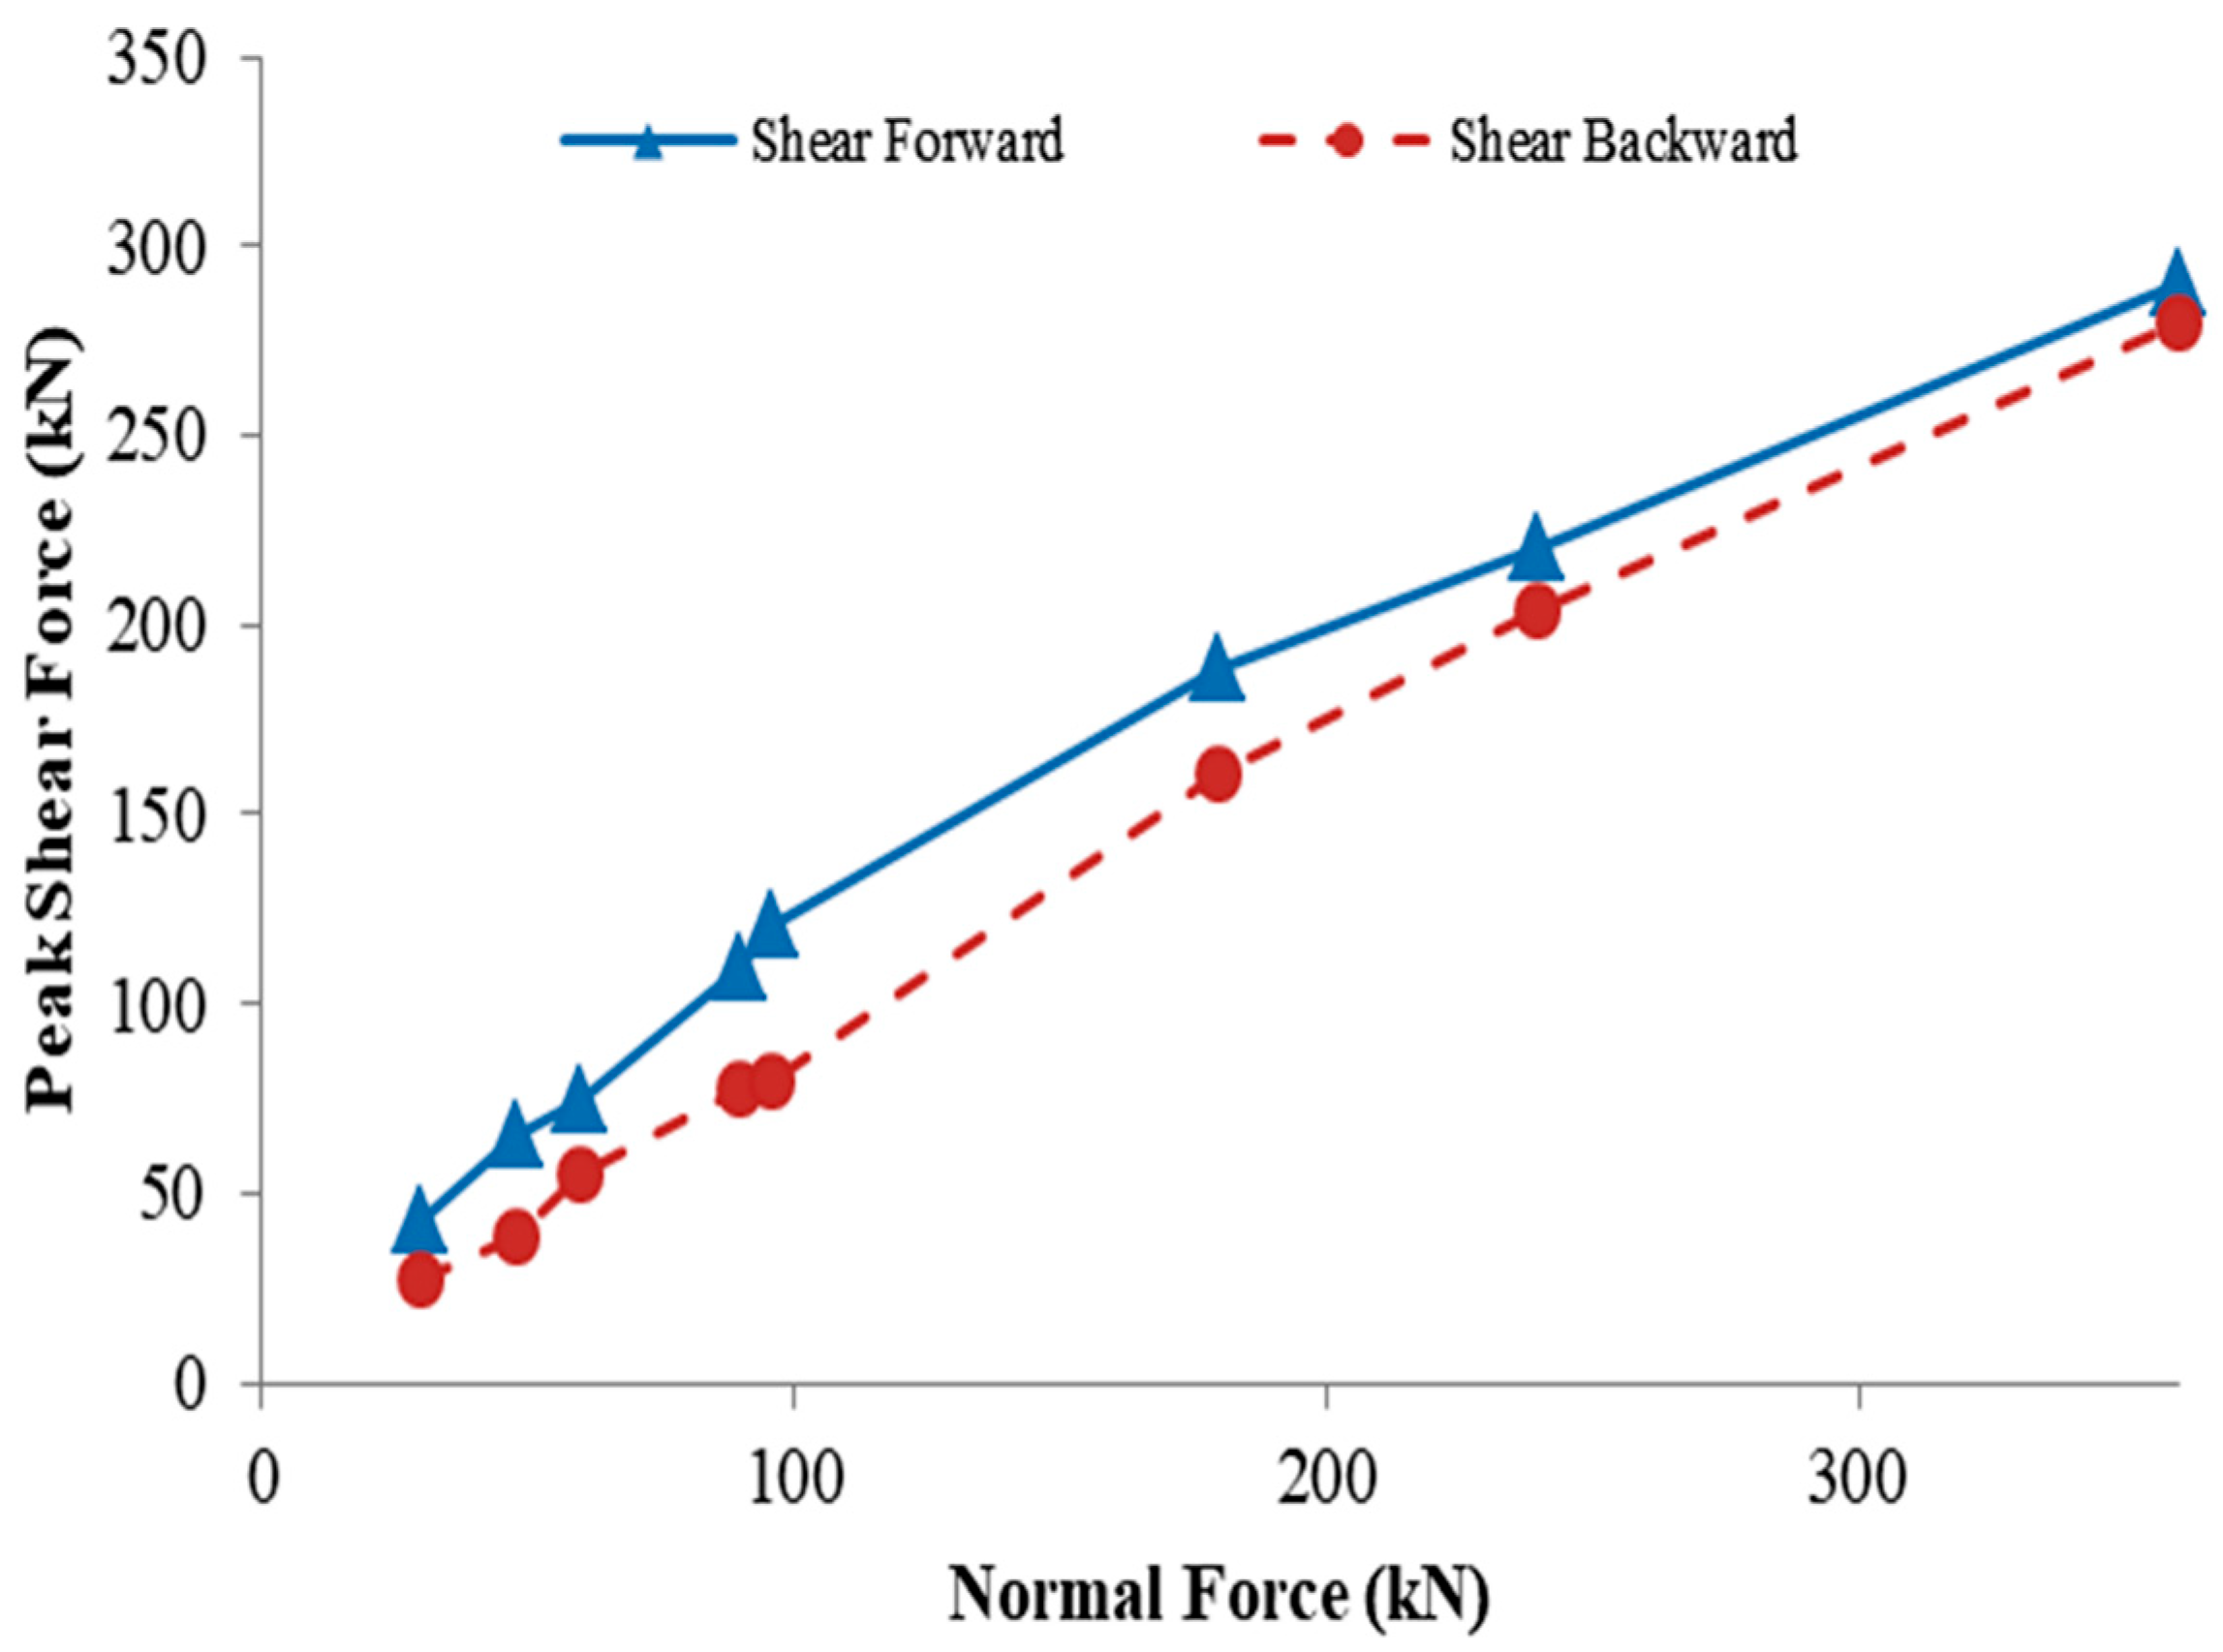
Figure 2 and Figure 3 show that peak shear forces increase with increasing normal forces, while residual shear forces are roughly equal to the peak shear forces. During each shearing stage, shear forces increase dramatically in a nearly linear manner with shear displacement until peak shear forces are reached in the early stage. Afterwards, the shearing process reaches the stabilization period (friction sliding stage), where shear force remains stable with slight fluctuations. The peak shear force in the backward shearing stage is smaller than that in the forward shearing stage, mainly caused by the damage of the contact surface during forward shearing.
As demonstrated in Figure 2, residual shear forces are roughly equal to peak shear forces. In general, the shear force-shear displacement curves of joints fall into two types [28]. The first type is characterized by shear stress rising to peak strength, followed by a rapid drop and gradual decay to a residual value. The second type exhibits nearly plastic behavior with little or no distinct peak. In reality, the shape of the shear stress–displacement curve is strongly governed by joint surface roughness, which is associated with the selective failure of asperities on opposing joint faces. While previous studies have consistently reported the first type of shear force–displacement curve for saw-tooth joints, our results show that the saw-tooth joints tested herein exhibit the second type. This finding indicates that the shear stress–displacement curve morphology depends not only on joint surface roughness but also on the spatial distribution of asperities. In this study, the spatial distribution of this specimen features a single saw-tooth asperity (rather than multiple asperities) with a specific height of 30 mm and an inclination angle of 10°. Correlation analyses have added an explanation that, unlike multi-asperity joints, which typically exhibit brittle “peak-drop” behavior due to sequential tooth breakage, our single-tooth geometry promotes a more ductile response. The stress is distributed over the entire tooth surface, leading to a “plastic-type” curve without a sharp peak. This specific spatial distribution delays the concentration of stress at a single point, resulting in the observed mechanical behavior.

3.2. Normal Displacement Evolution

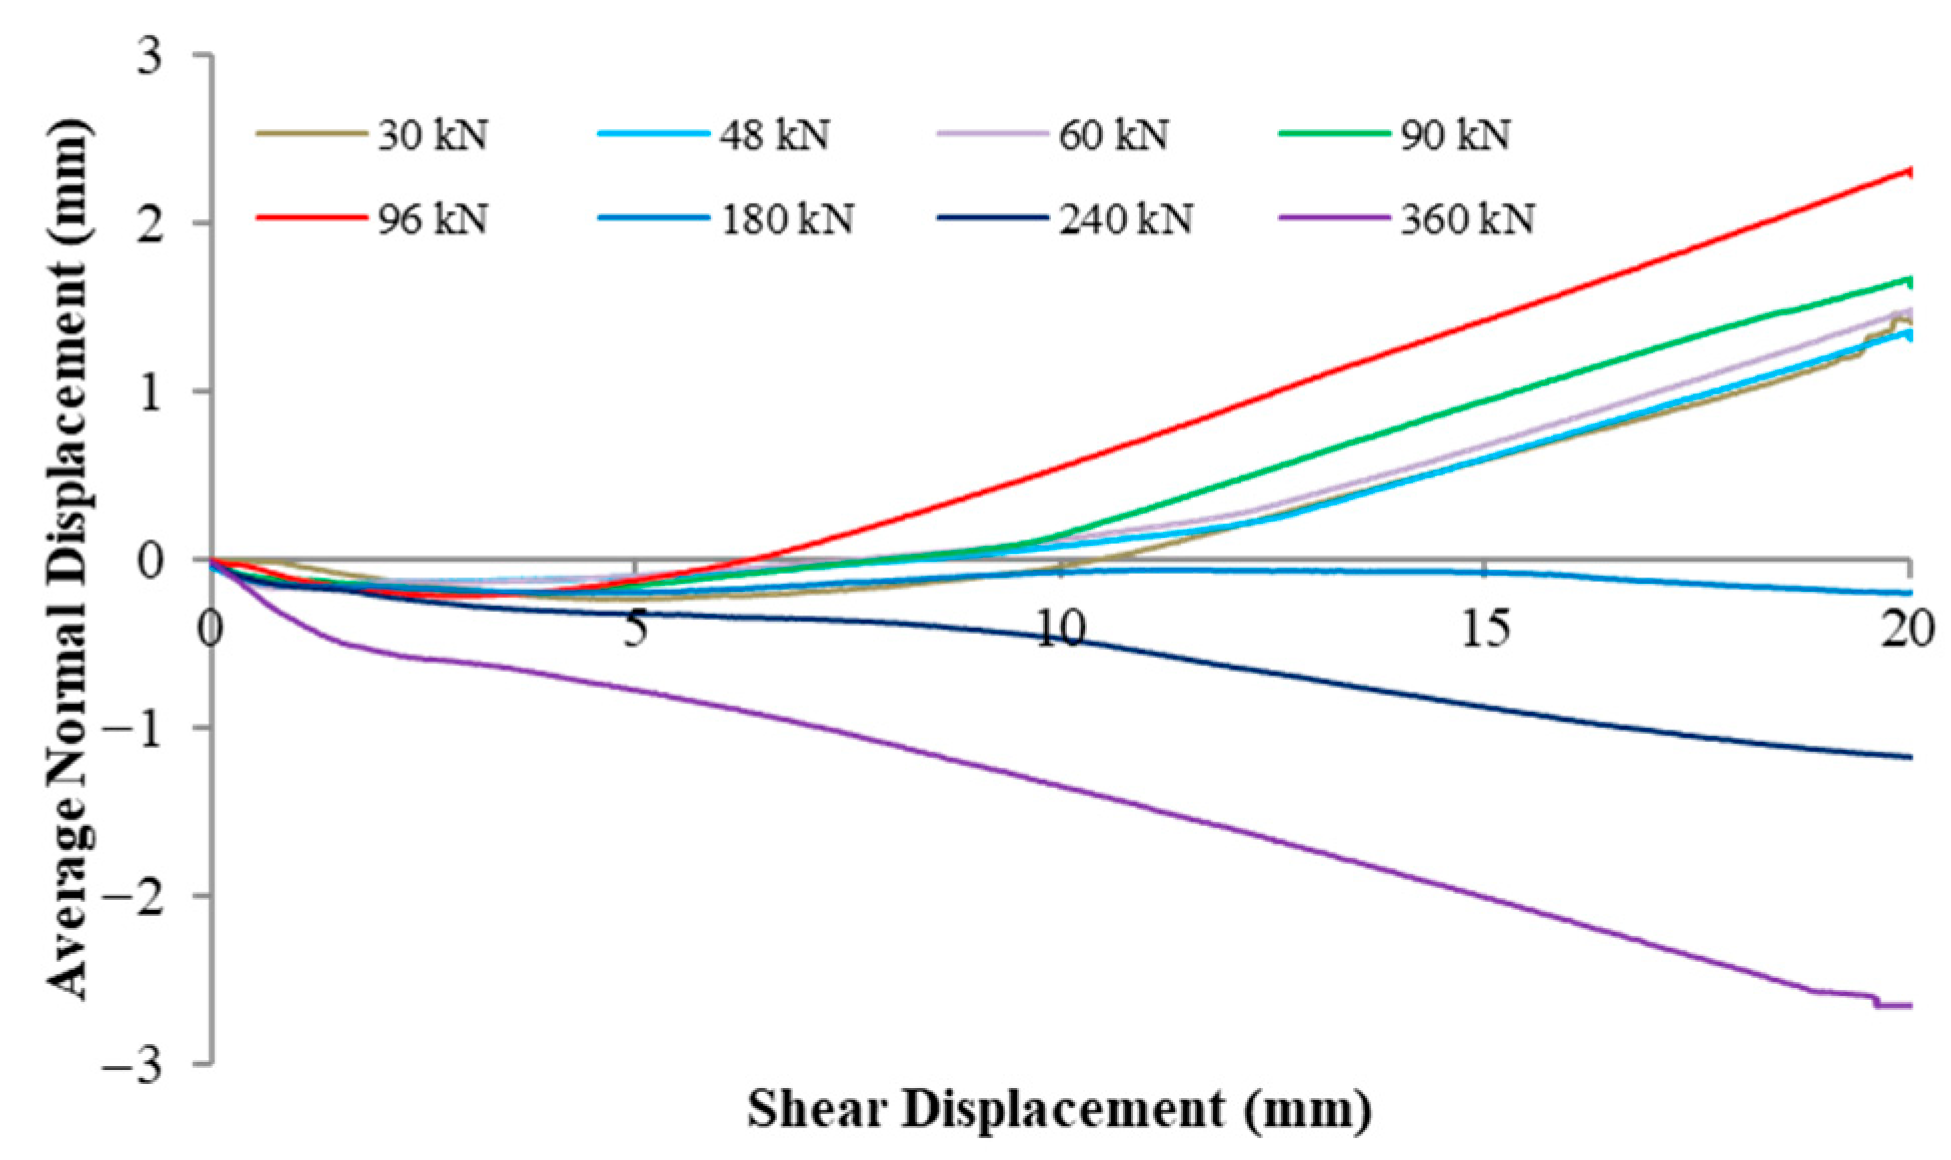
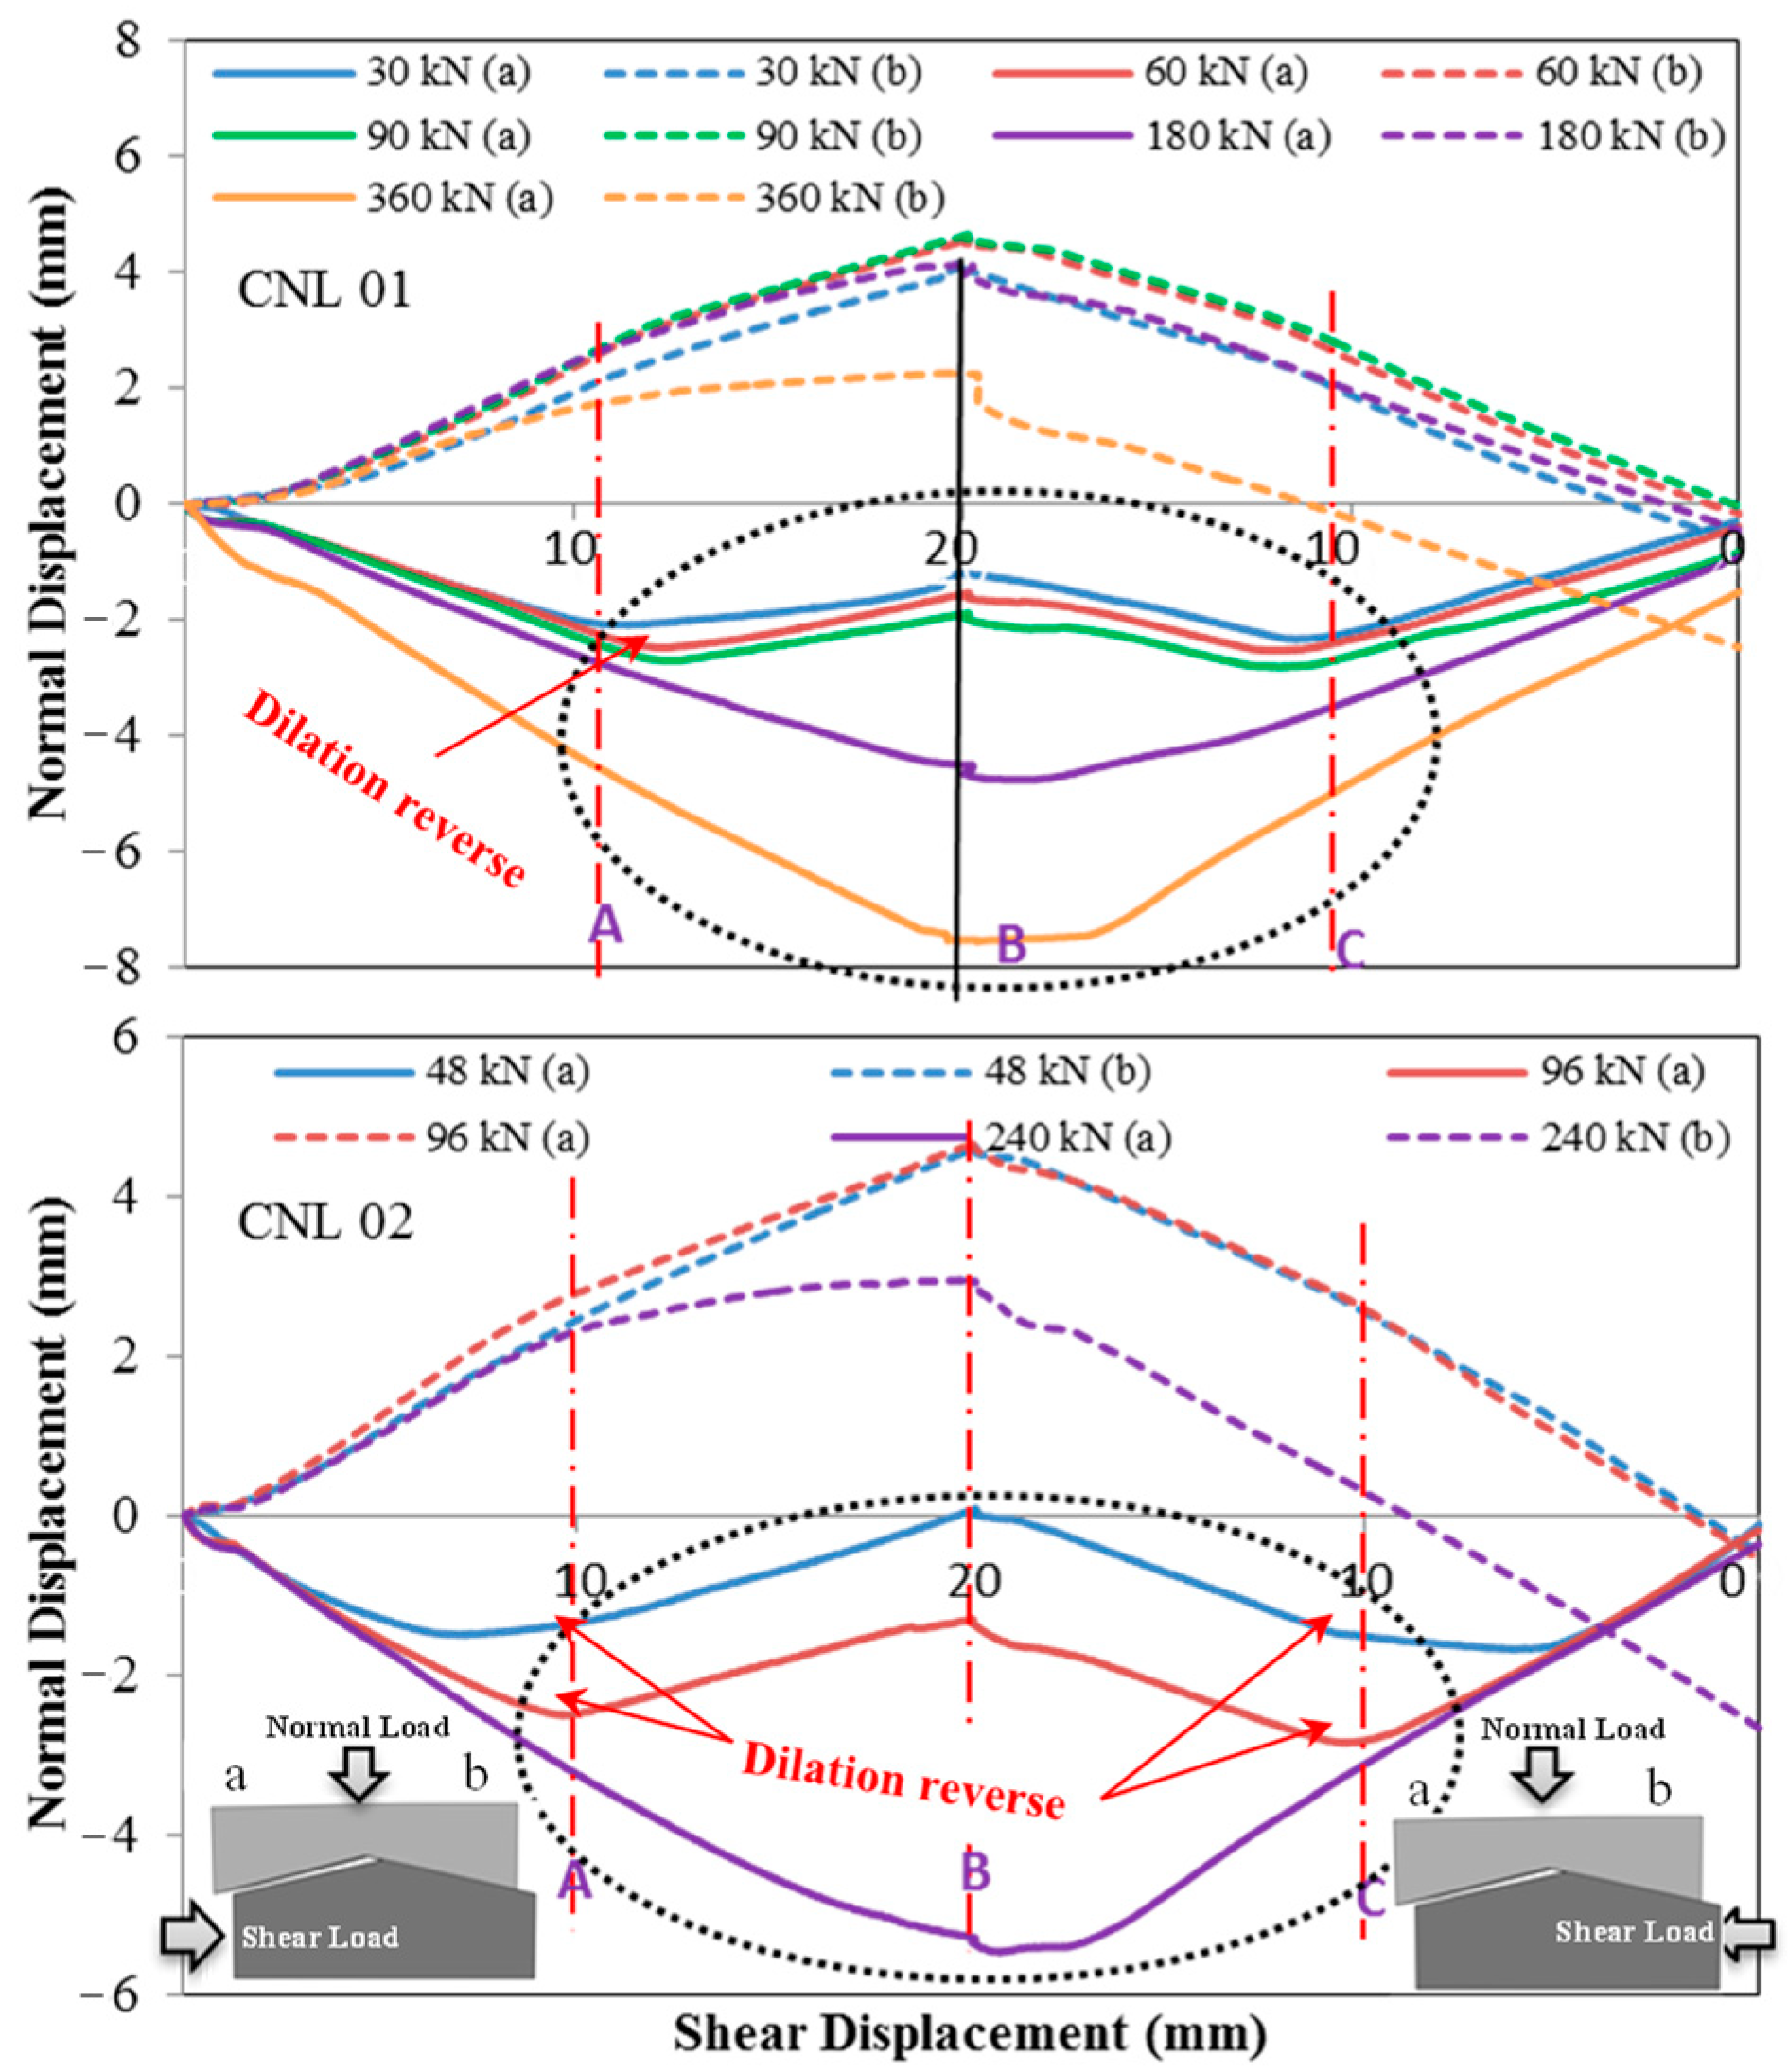
The relationship between average normal displacement and shear displacement is shown in Figure 4, which illustrates two changing patterns under different normal load conditions. When the normal loads are below 180 kN, average normal displacements are negative (settlement/compression) in the early stage; with the increase in shear displacement, average normal displacements become positive (heave/dilation). However, when normal loads exceed 180 kN (including 180 kN), average normal displacements remain negative throughout the test. In addition, the settlements increase with the increase in shear displacement. The above explanations omit significant details when considering normal displacements at different points of the upper specimen (shown in Figure 5).
It is clear to see that normal displacements exhibit different changing patterns at different measurement points under varying normal loads. An interesting dilation reverse behavior was observed on the left side of the upper specimen under lower normal loads. When normal loads are below 96 kN, heave on the right side and settlement on the left side increase with increasing shear displacement in the early stage (O to A), reaching peak values at point A. Afterwards, the settlement on the left side reverses to dilation with the increase in shear displacement. Heave on the right side continues to increase until shearing stops. This moving behavior changes under higher normal loads (over 180 kN). The left-side settlement increases continuously with the increase in shear displacement. The right-side heave reaches approximately 5.5 mm when shear displacement is 20 mm (point B) under lower normal loads, while heave decreases under larger normal loads. It might have been caused by the broken part inside the testing sample. Under low normal loads, damage was dominated by tensile fracture at the root of saw-tooth asperities. The damage was only minor wear at the tooth crests and no large-area crushing. Correspondingly, the upper specimen could climb freely along the intact inclined plane, showing continuous right-side dilation and left-side settlement-to-dilation transition behavior. Under high normal loads (>180 kN), damage was dominated by shear crushing at the tooth crests and shear failure at the specimen edges. The asperity tooth tips are sheared off, and a large number of fine crushed particles are generated on the joint surface. This crushing damage destroys the geometric integrity required for the “climbing” mechanism. Consequently, instead of dilation caused by uplift, the joint undergoes compaction of the crushed fragments. Correspondingly, the right-sided dilation was significantly inhibited.
At the end of the shear test, the right-side normal settlement is 2.7 mm (when there was no fracture in the specimen, the settlement should have been around 0 mm). To sum up, left-side settlement reverse behavior occurs under small normal loads, but disappears when normal loads are sufficiently large. This indicates that high normal forces inhibit the dilation characteristics of the upper specimen. The detailed measurement results above help explain the average normal displacement trends shown in Figure 4.

3.3. Shear Failure Characteristics

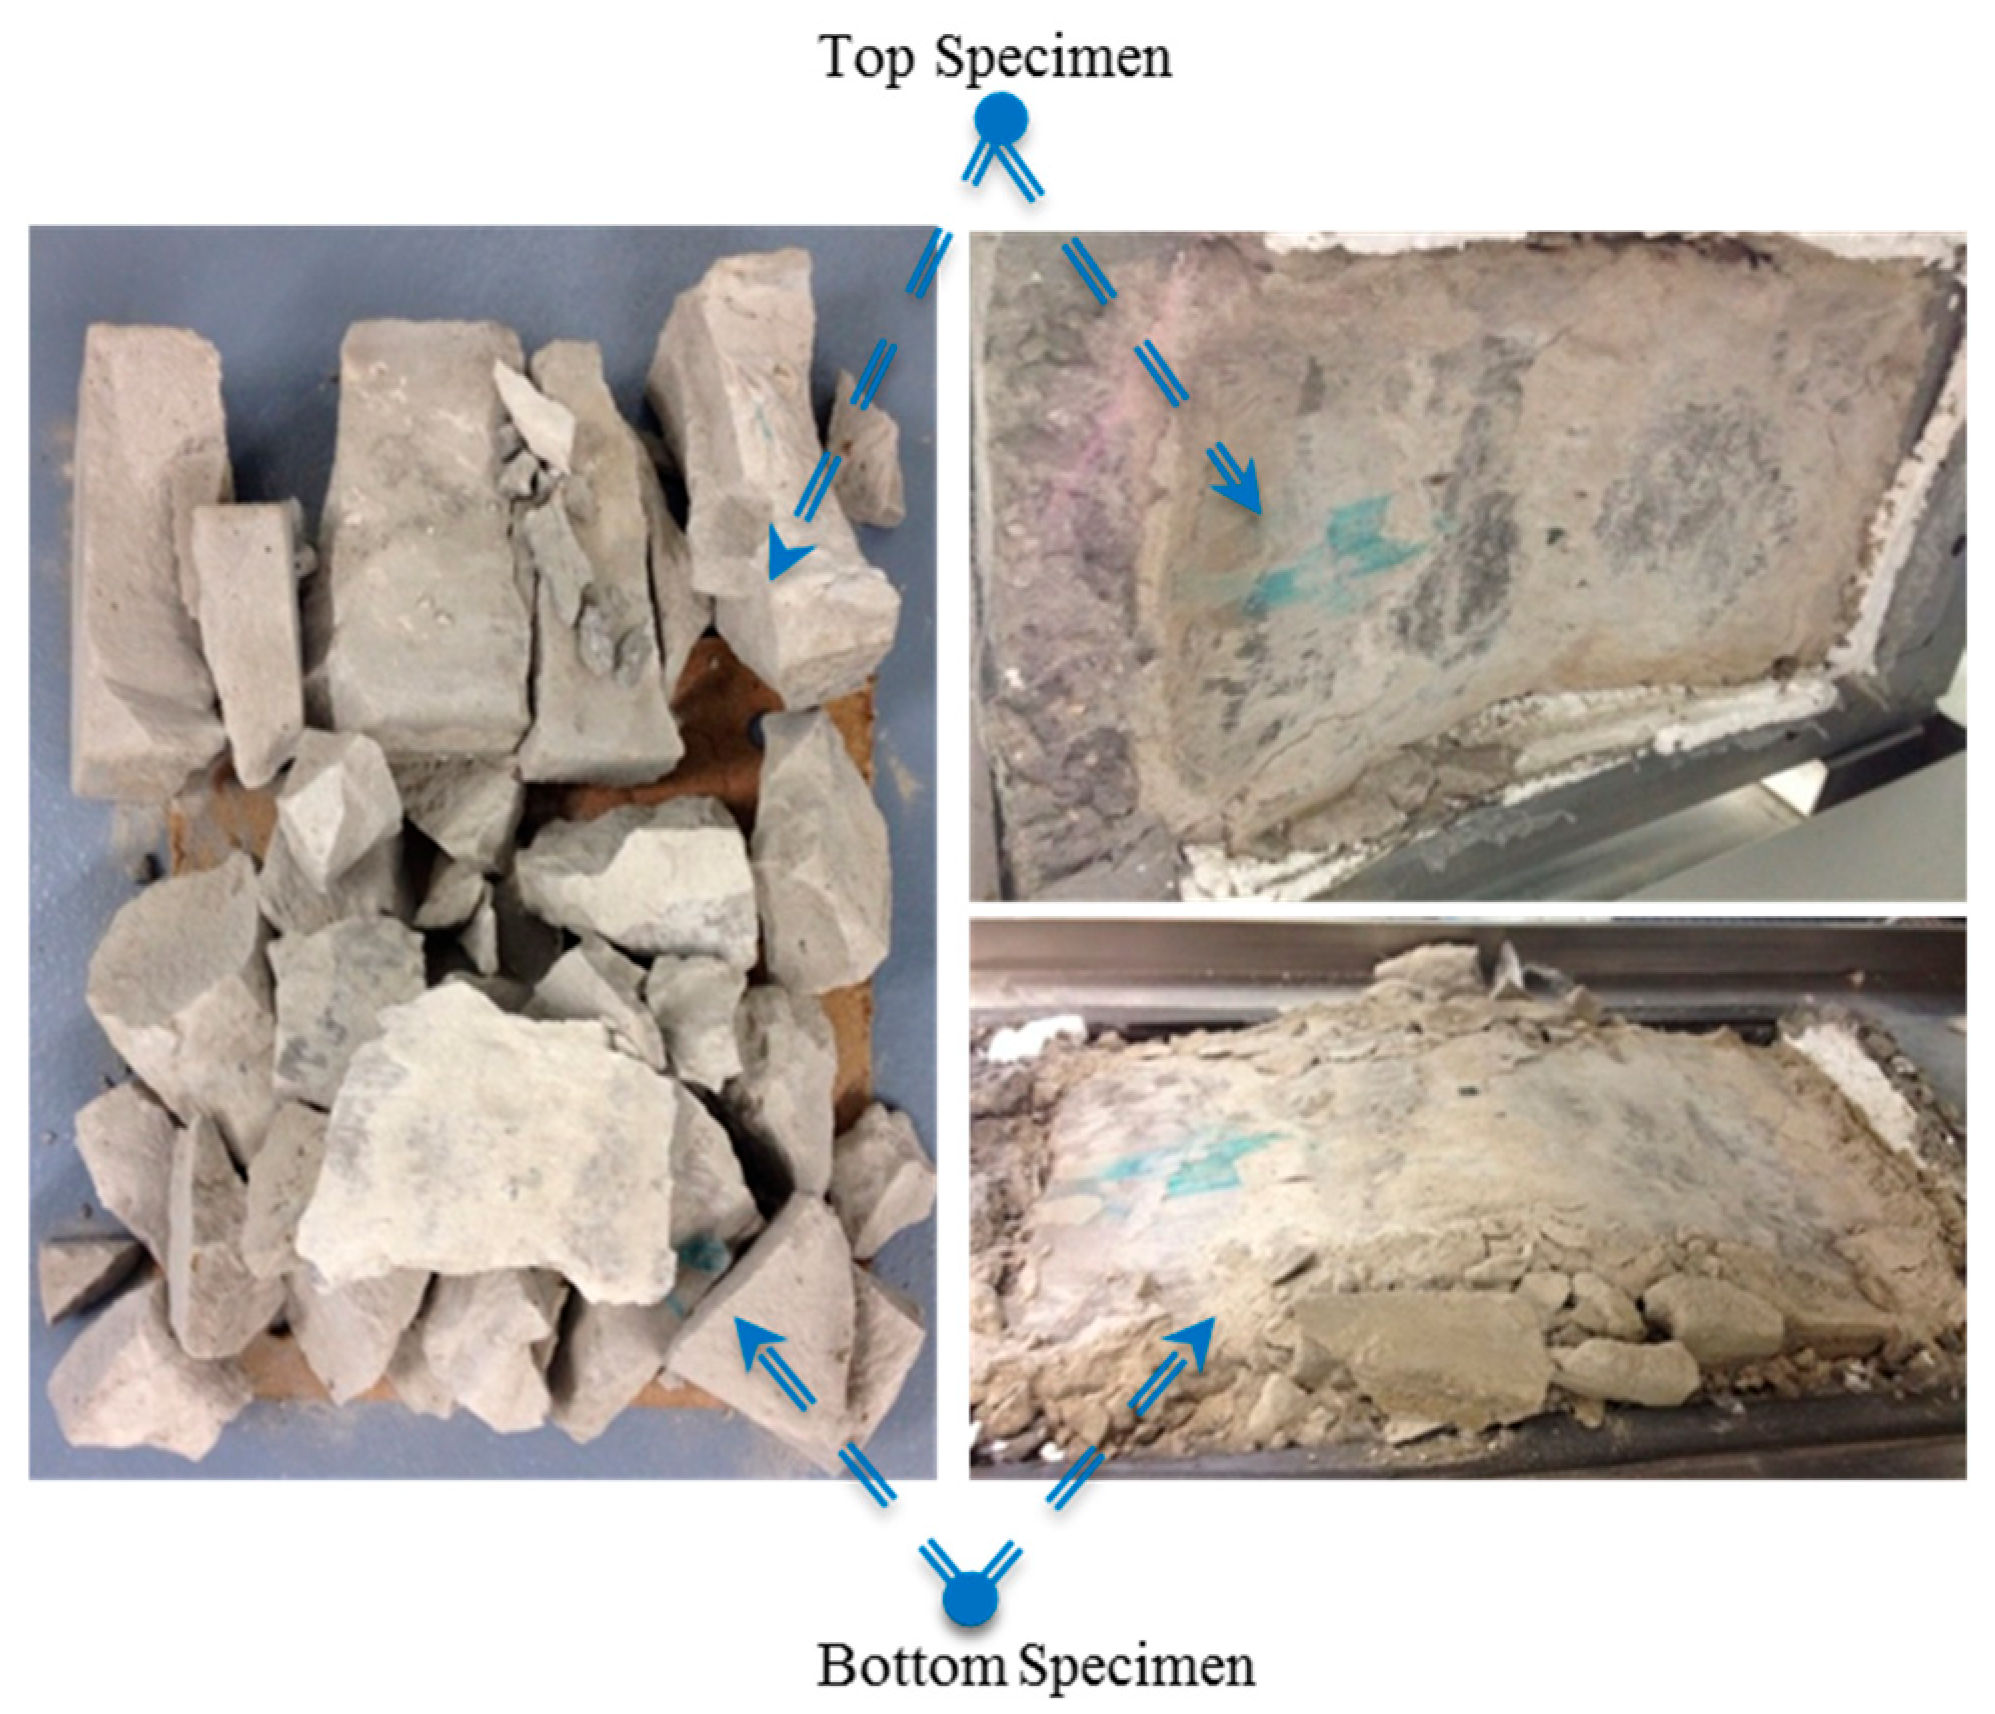
Post-test observations revealed that damage was primarily concentrated at the saw-tooth crests and specimen edges (Figure 6). The fractured blocks from the upper specimen exhibited rectangular strip shapes, consistent with the tensile failure mode observed under low normal loads. Under high normal loads, more extensive crushing and shearing damage were observed at the saw-tooth crests, leading to smoother joint surfaces.

4. Numerical Simulation

4.1. Numerical Model Set-Up

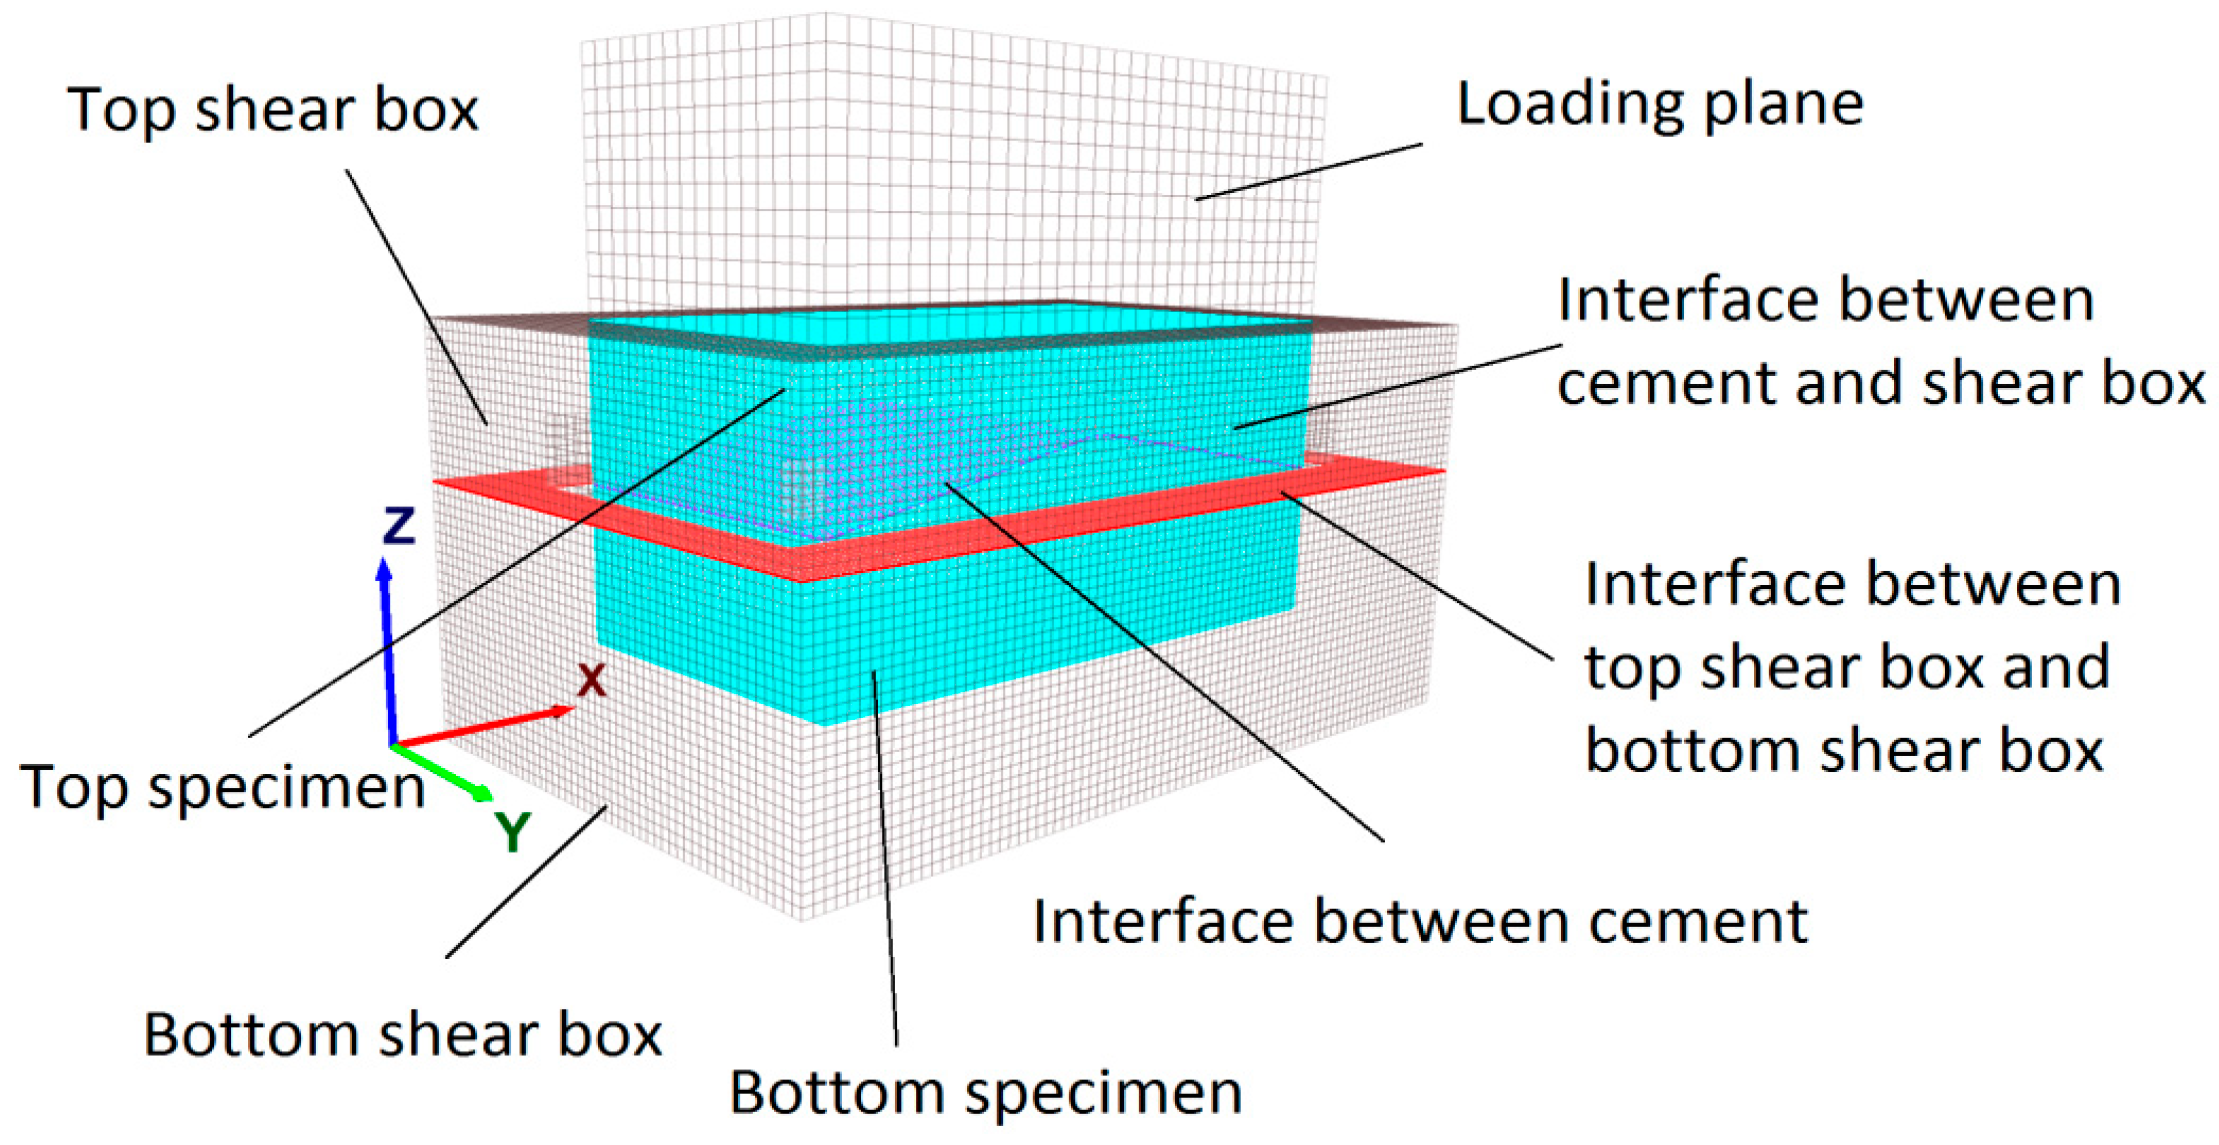
To reveal the shear behavior of the saw-tooth joints, FLAC3D was used to simulate the direct shear process. The numerical model consists of five parts (Figure 7): loading plane, bottom shear box, top shear box, bottom specimen, and top specimen. The model dimensions and material properties were identical to those used in the laboratory tests. Interface elements were employed to simulate the contact behavior between the specimens and shear boxes, as well as between the upper and lower joint surfaces. The final model contained 202,568 grid points, 179,184 zones, 16,222 interface nodes, and 27,776 interface elements.
The Mohr–Coulomb constitutive model was adopted for the rock-like material. Normal loads were applied to the top loading plate, the top shear box was fixed in the X and Y directions, and a constant shear velocity was applied to the bottom shear box. Two representative normal loads (48 kN for low load and 240 kN for high load) were selected for simulation to investigate the micromechanical mechanisms underlying the observed experimental phenomena. The key parameters of the FLAC3D numerical model are shown in Table 1.
The CNL boundary condition requires that the total normal force applied to the specimen remains constant throughout the shearing process. To achieve this objective, the applied normal force is controlled by a continuously updated vertical velocity. This is realized through the coupled control of FLAC 3D and FISH functions. In the servo control algorithm for constant normal force, the total reaction force acting on the bottom surface of the top loading plate is calculated by summing the contact forces at all interface nodes in each computational step. The difference between the calculated reaction force and the target normal force is then used to adjust the vertical velocity of the top loading plate according to the following formula, so as to maintain a constant normal force.

4.2. Simulation Results

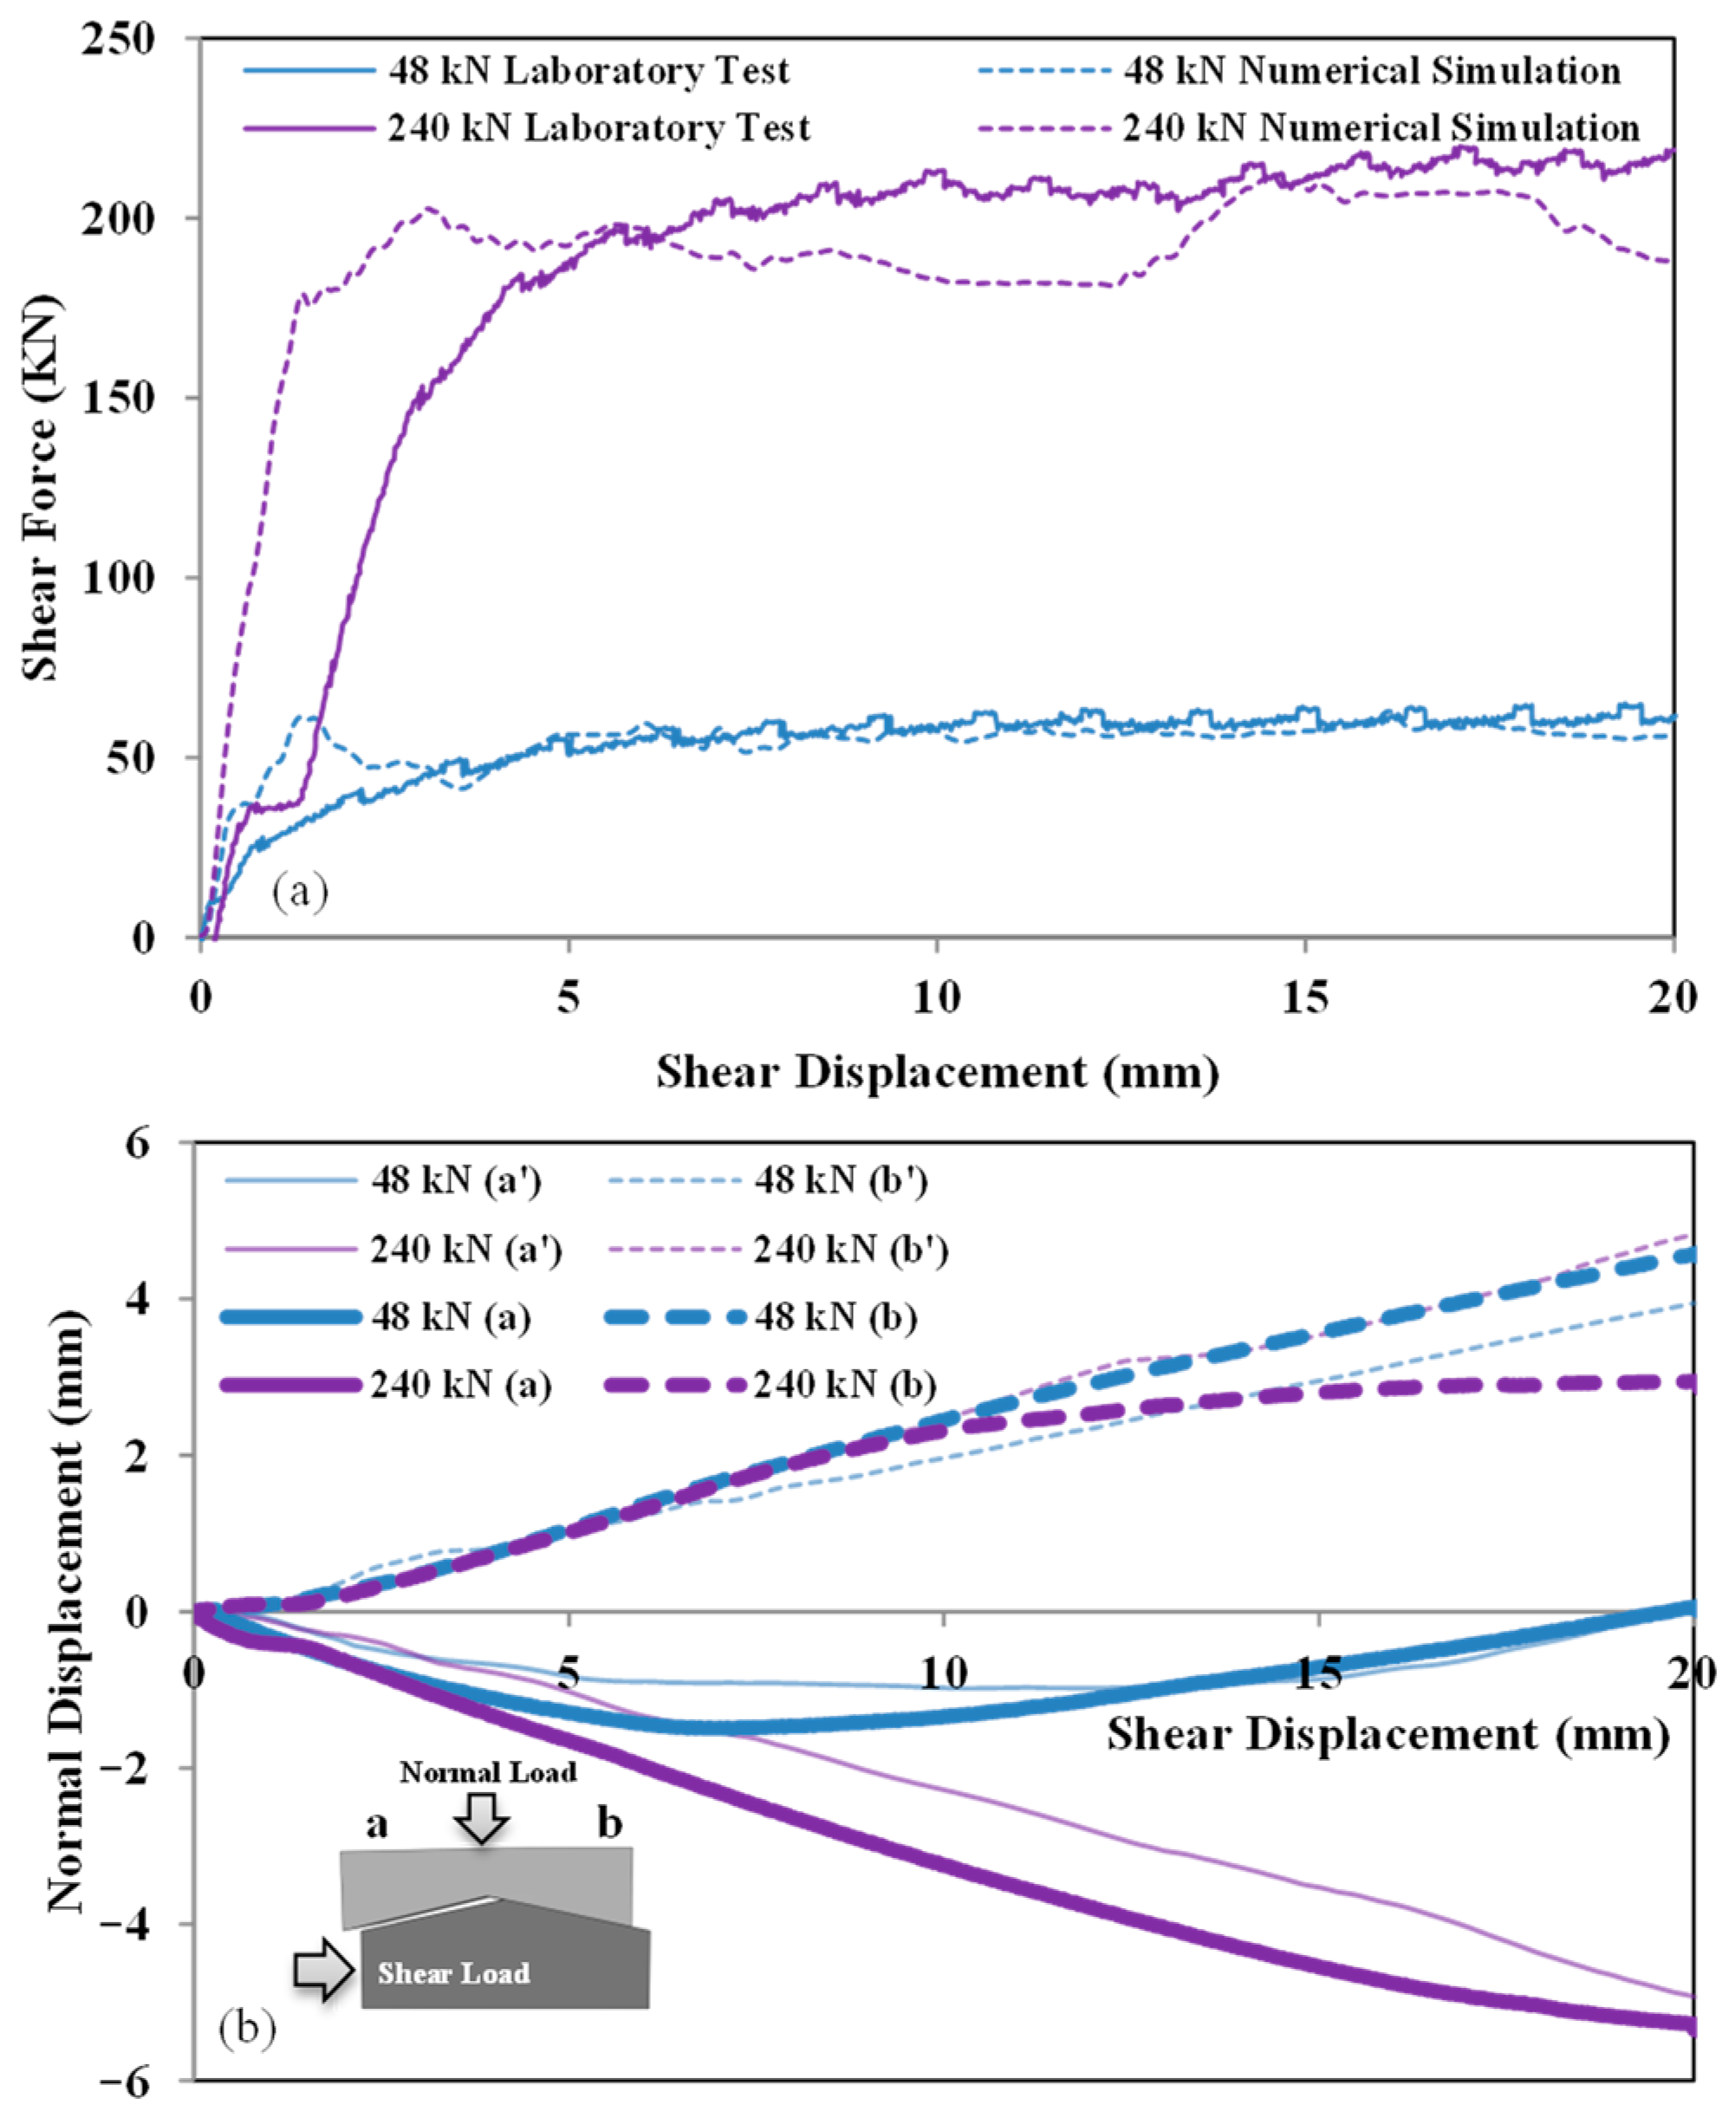
We first verified the accuracy of the numerical model. The material parameters used in the model were directly obtained from standard laboratory tests on the same rock-like material to ensure the authenticity of the model input parameters. The numerical simulation strictly reproduced the CNL boundary conditions, shear rate, and specimen dimensions of the laboratory tests. The simulated shear force–shear displacement curves and normal displacement curves agree well with the laboratory test results, and the relative errors of the peak shear force and maximum normal displacement are both less than 8%.
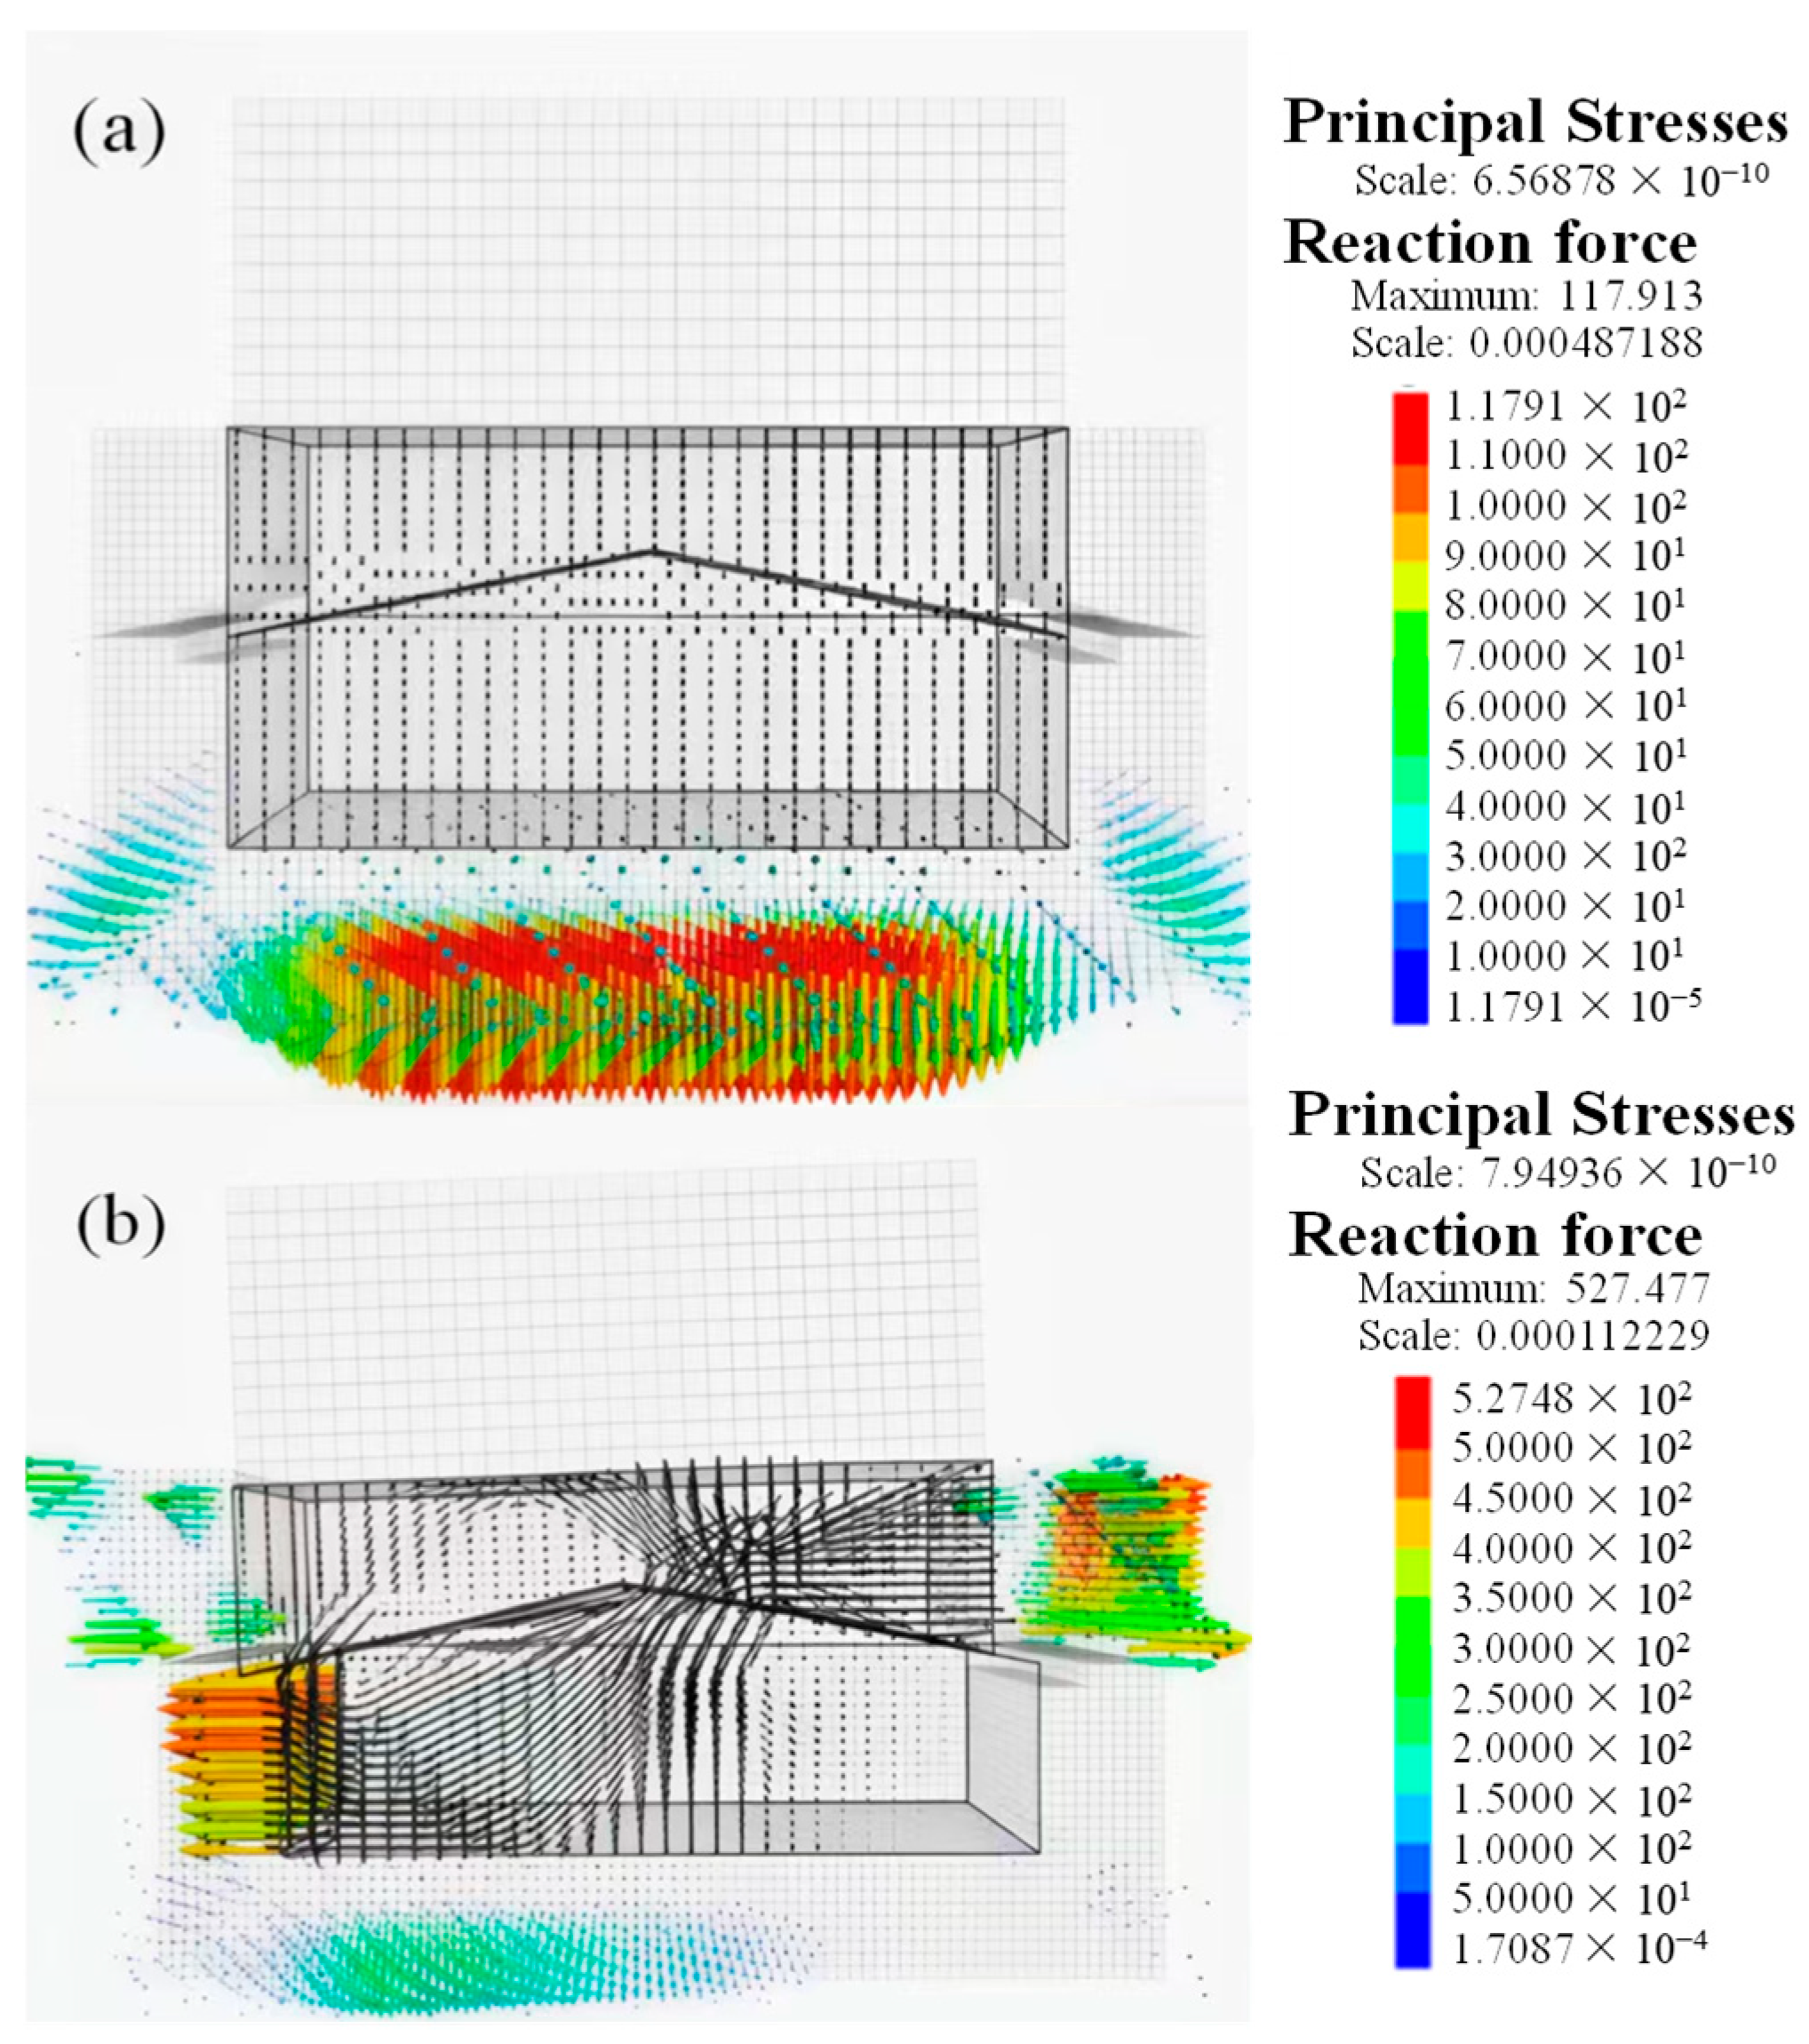
Figure 8 shows the principal stress and reaction force distributions before and after shearing under a 240 kN normal load. After shearing, force chains developed from the lower left to the upper right of the specimen, with maximum principal stress concentrated on the right half of the joint surface. Reaction forces were vertically concentrated on the left half of the shear box and horizontally concentrated on the right side of the top shear box and the left side of the bottom shear box. This non-uniform stress distribution directly leads to the non-uniform normal displacement observed in the experiments.
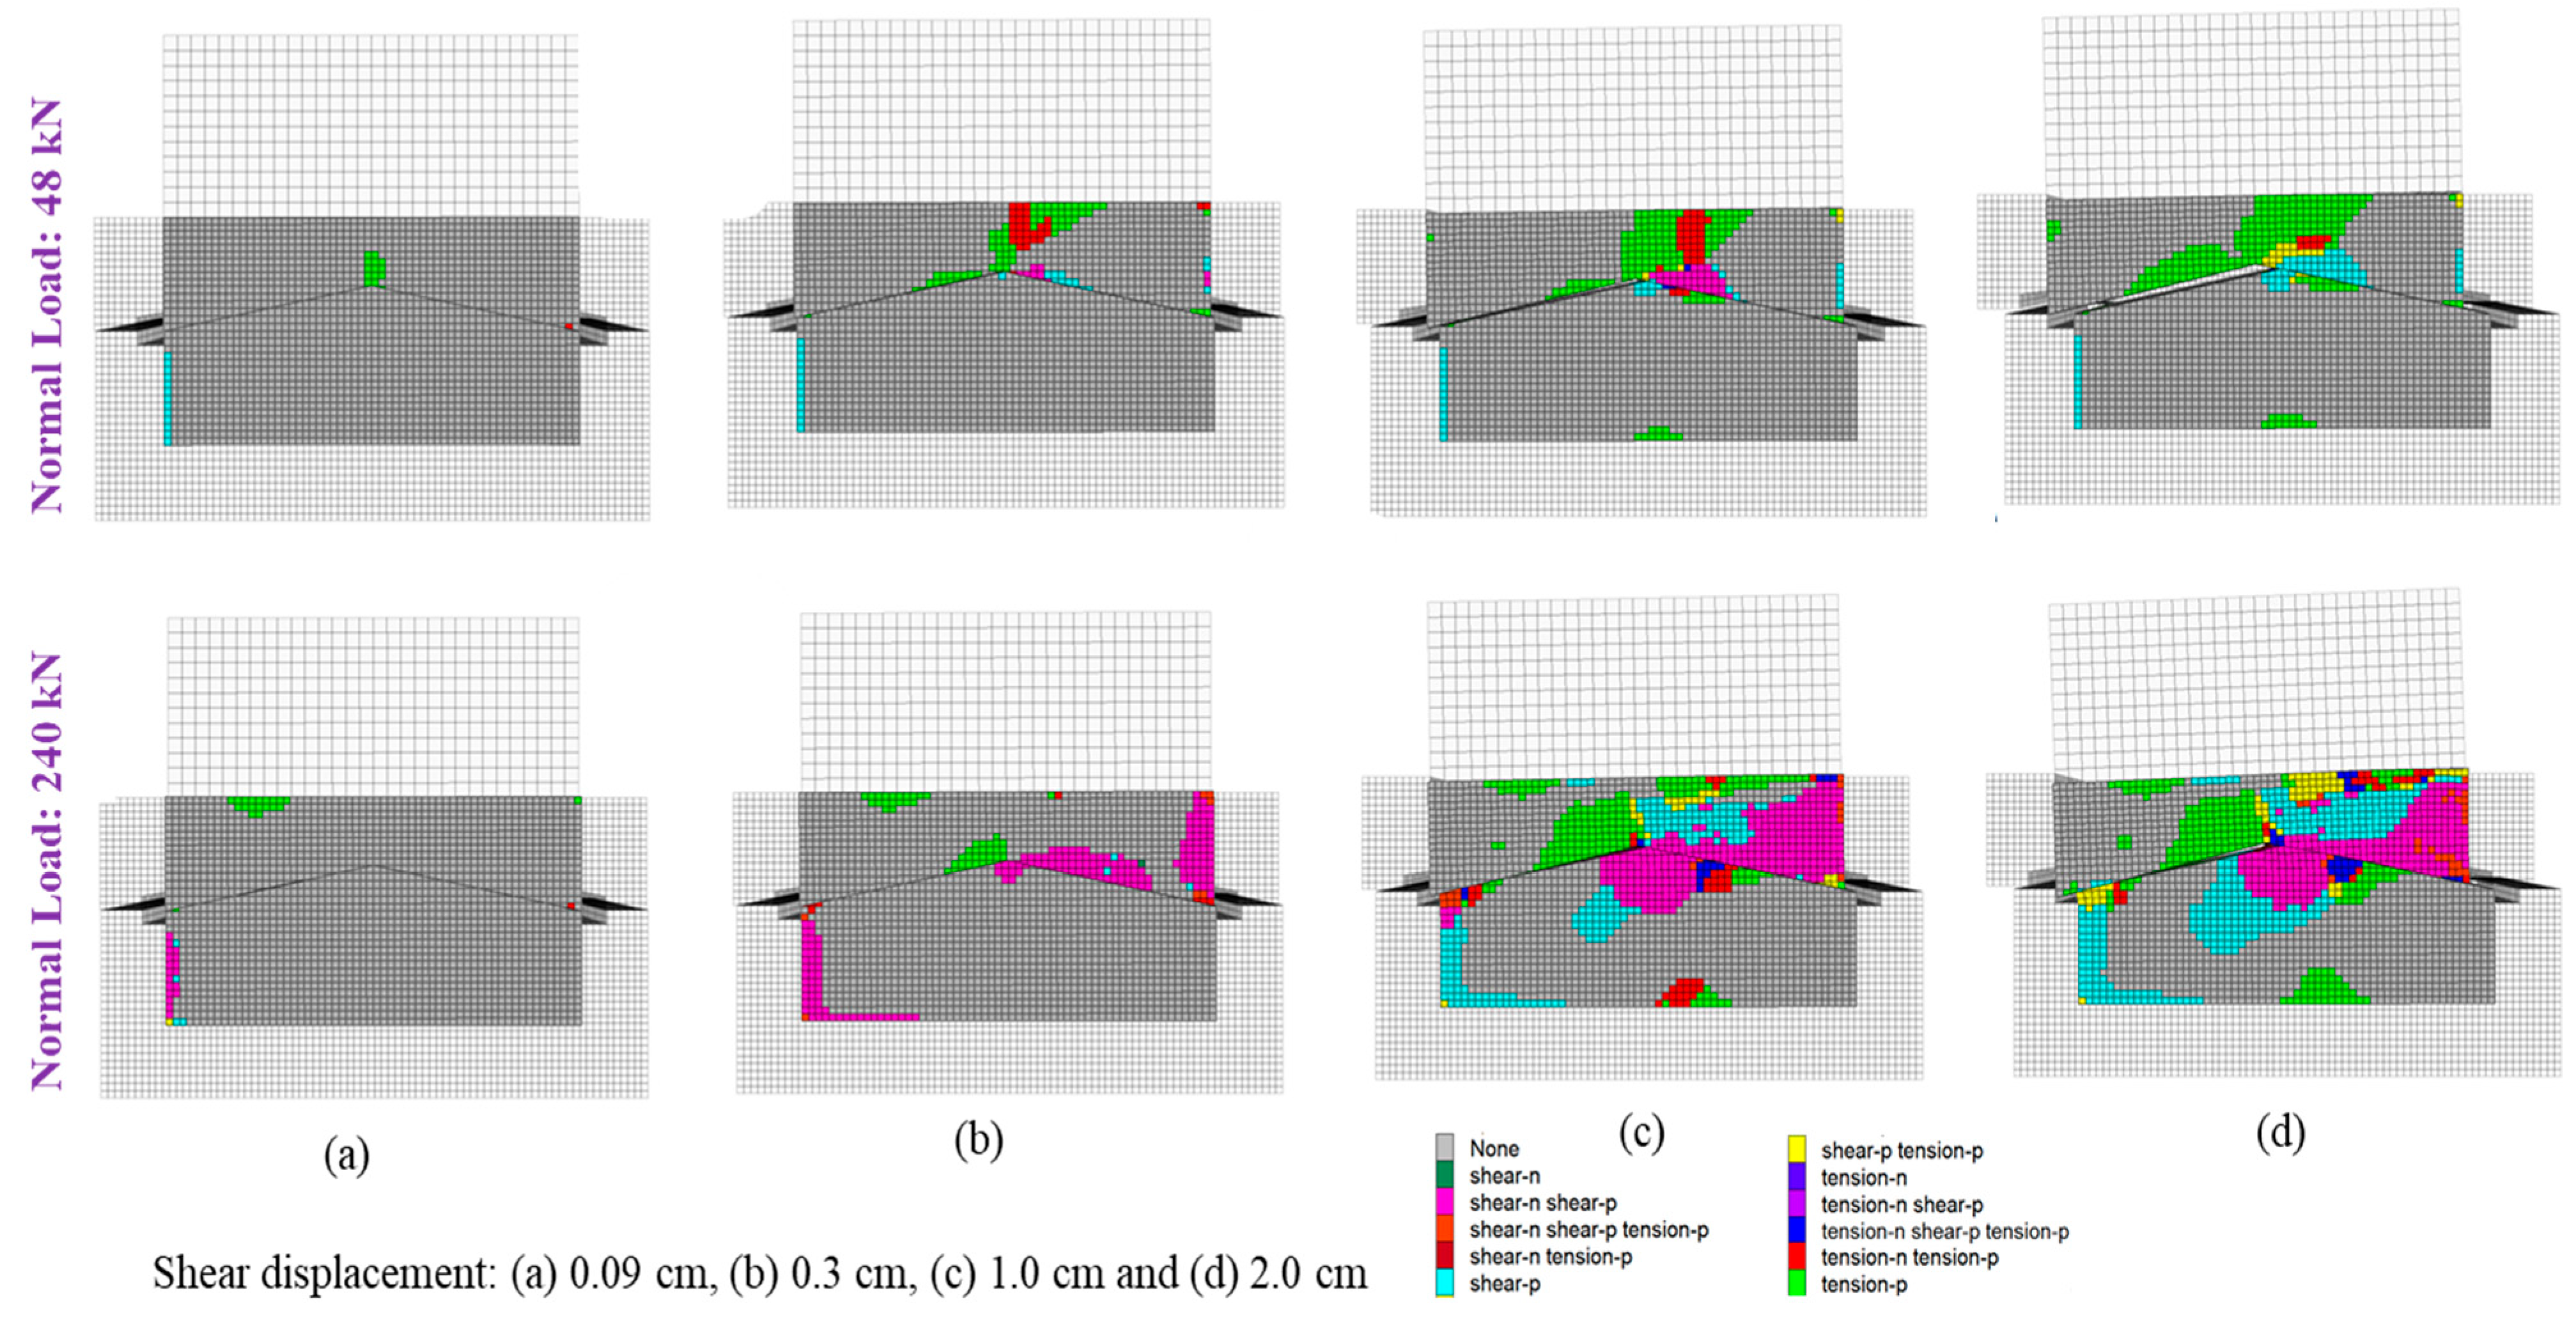
As shown in Figure 9, specimens exhibit different fracture patterns under different load conditions. Under low normal load (48 kN), shear failure initiates at the left bottom edge of the lower specimen (Figure 9a). Tension failure then appears at the notch of the upper specimen as shear displacement increases, eventually propagating through the upper block (Figure 9b). In addition, some shear failure appears near the tooth of the bottom specimen and at the right top edge of the upper specimen when the shear displacement exceeds 15 mm. Under a large normal load (240 kN), shear failure starts at the left bottom edge of the bottom specimen and the right vertical edge of the upper specimen (Figure 9a). Subsequently, shear failure appears at the notch of the upper specimen and at the tooth crest of the bottom specimen, while tension failure appears near the left side of the upper specimen’s notch and the left bottom surface of the upper specimen. Most damage under the normal force of 240 kN is due to shear failure, whereas damage under 48 kN is primarily caused by tension failure. These simulation results are consistent with the laboratory test results (Figure 6).
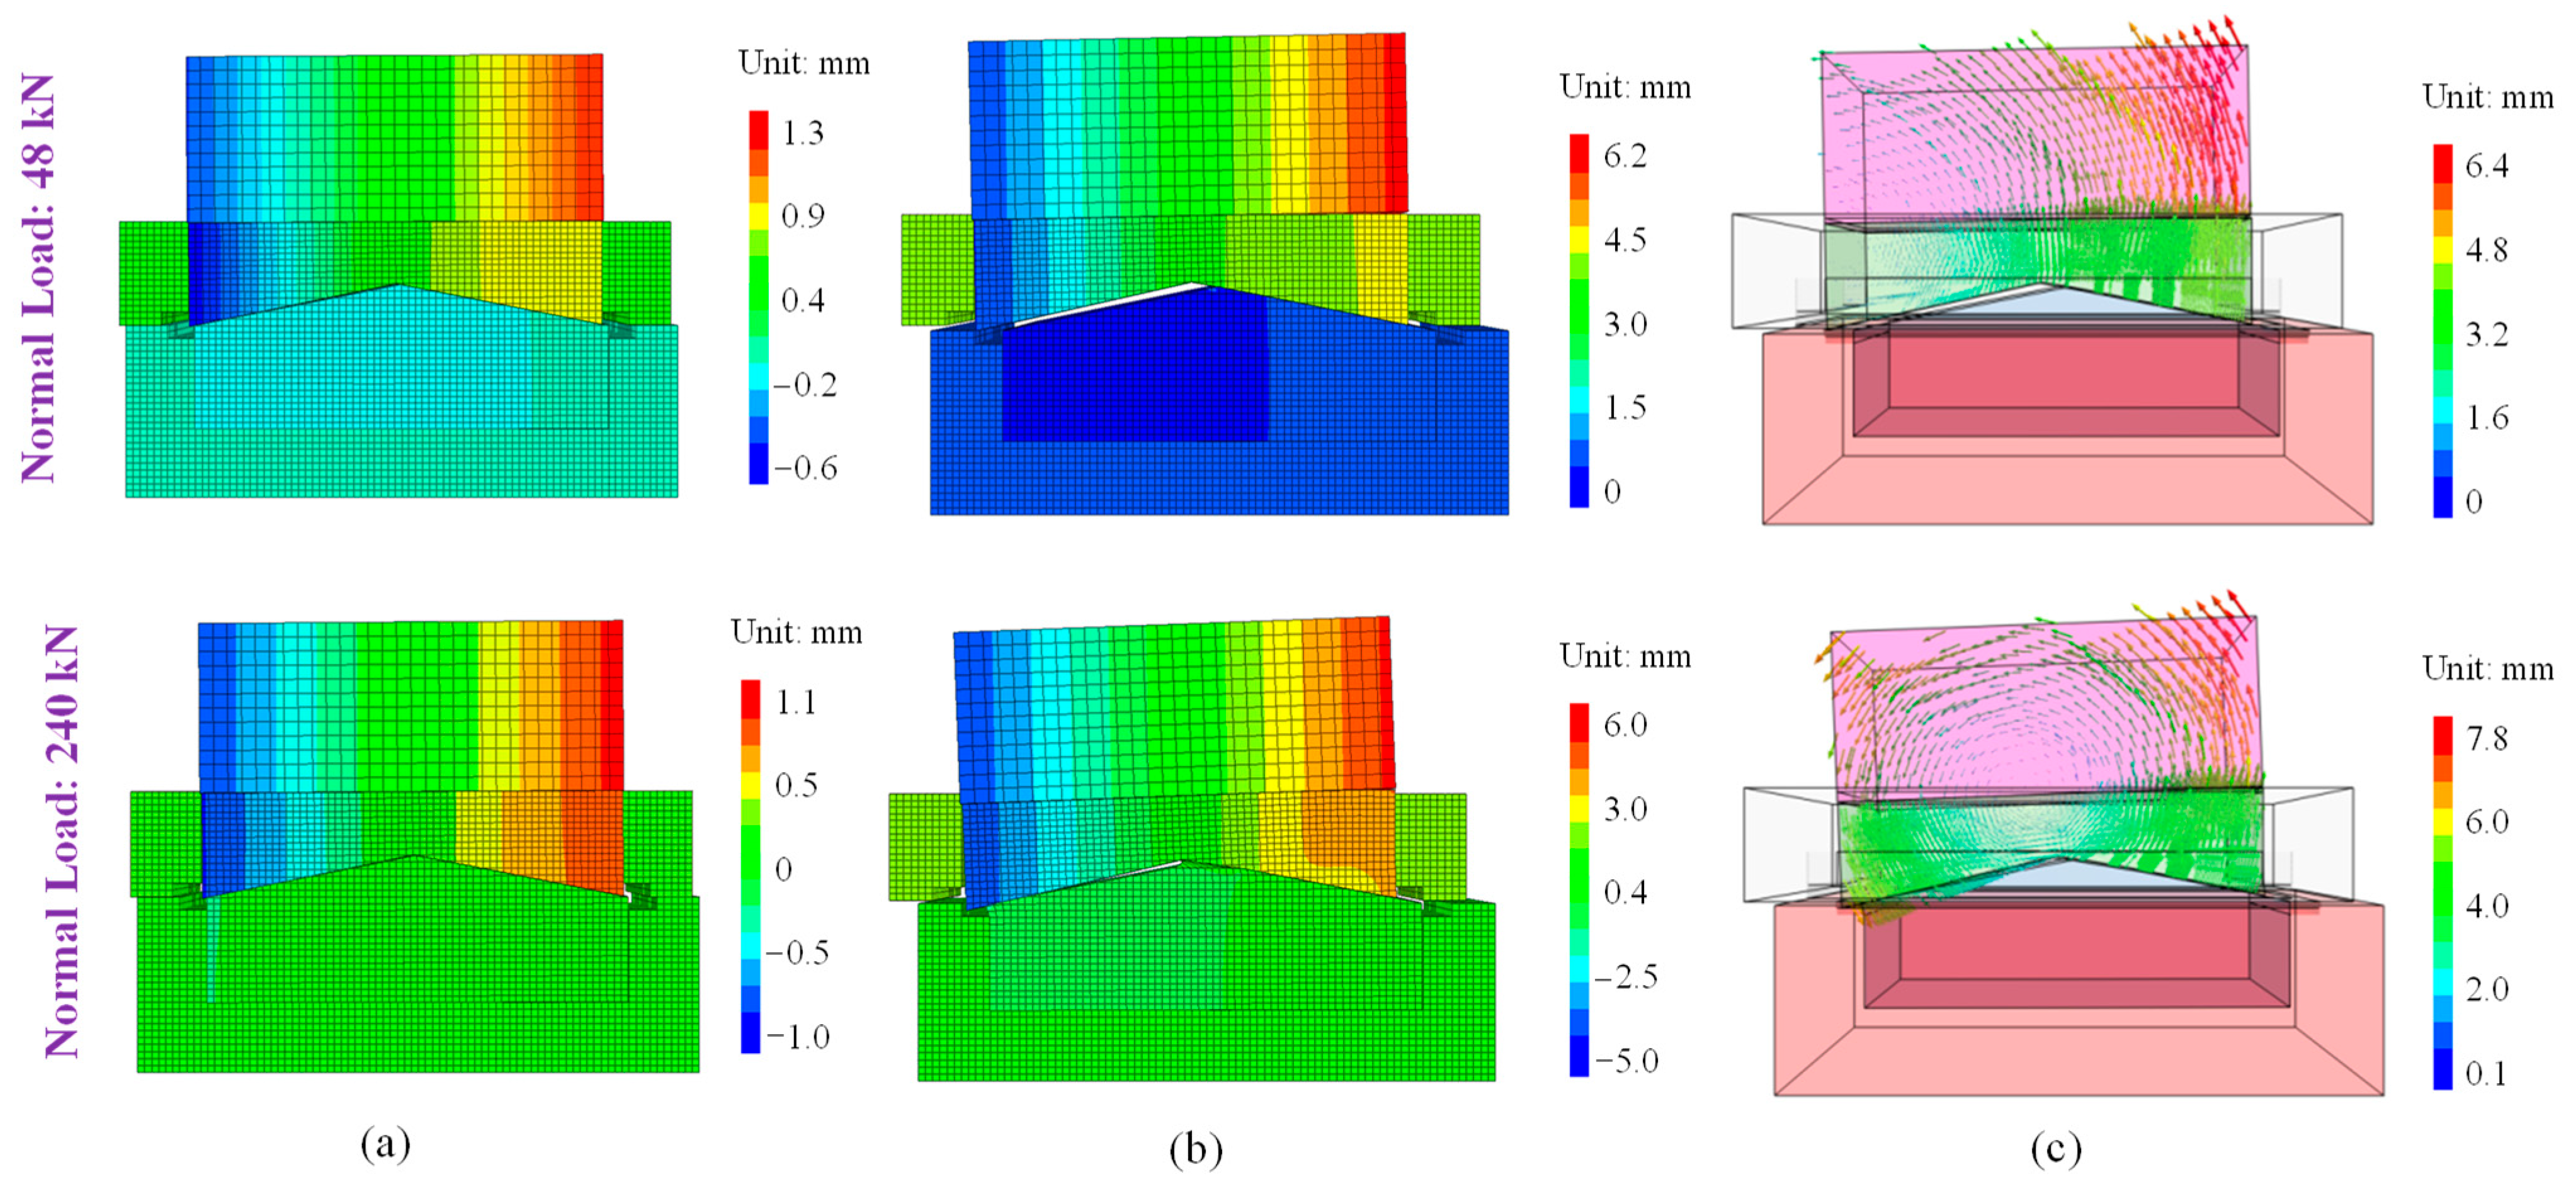
Figure 10 illustrates the specimen movement behavior during shearing. In the early stage, the left side exhibits negative dilation (downward displacement) and the right side positive dilation (upward displacement) due to slope effects. Under a 48 kN normal load, the right side rises continuously, with vertical displacement nearly equal to the slope height. However, after the left-side settlement reaches a peak value, it begins to rise at a rate similar to that of the right side. This confirms that positive dilation in the right side played the main role after the upper specimen reached the equilibrium state, helping explain the left-side settlement reverse behavior under low normal loads (Figure 5). Under a 240 kN normal load, the right side rises, and the left side descends continuously throughout shearing.
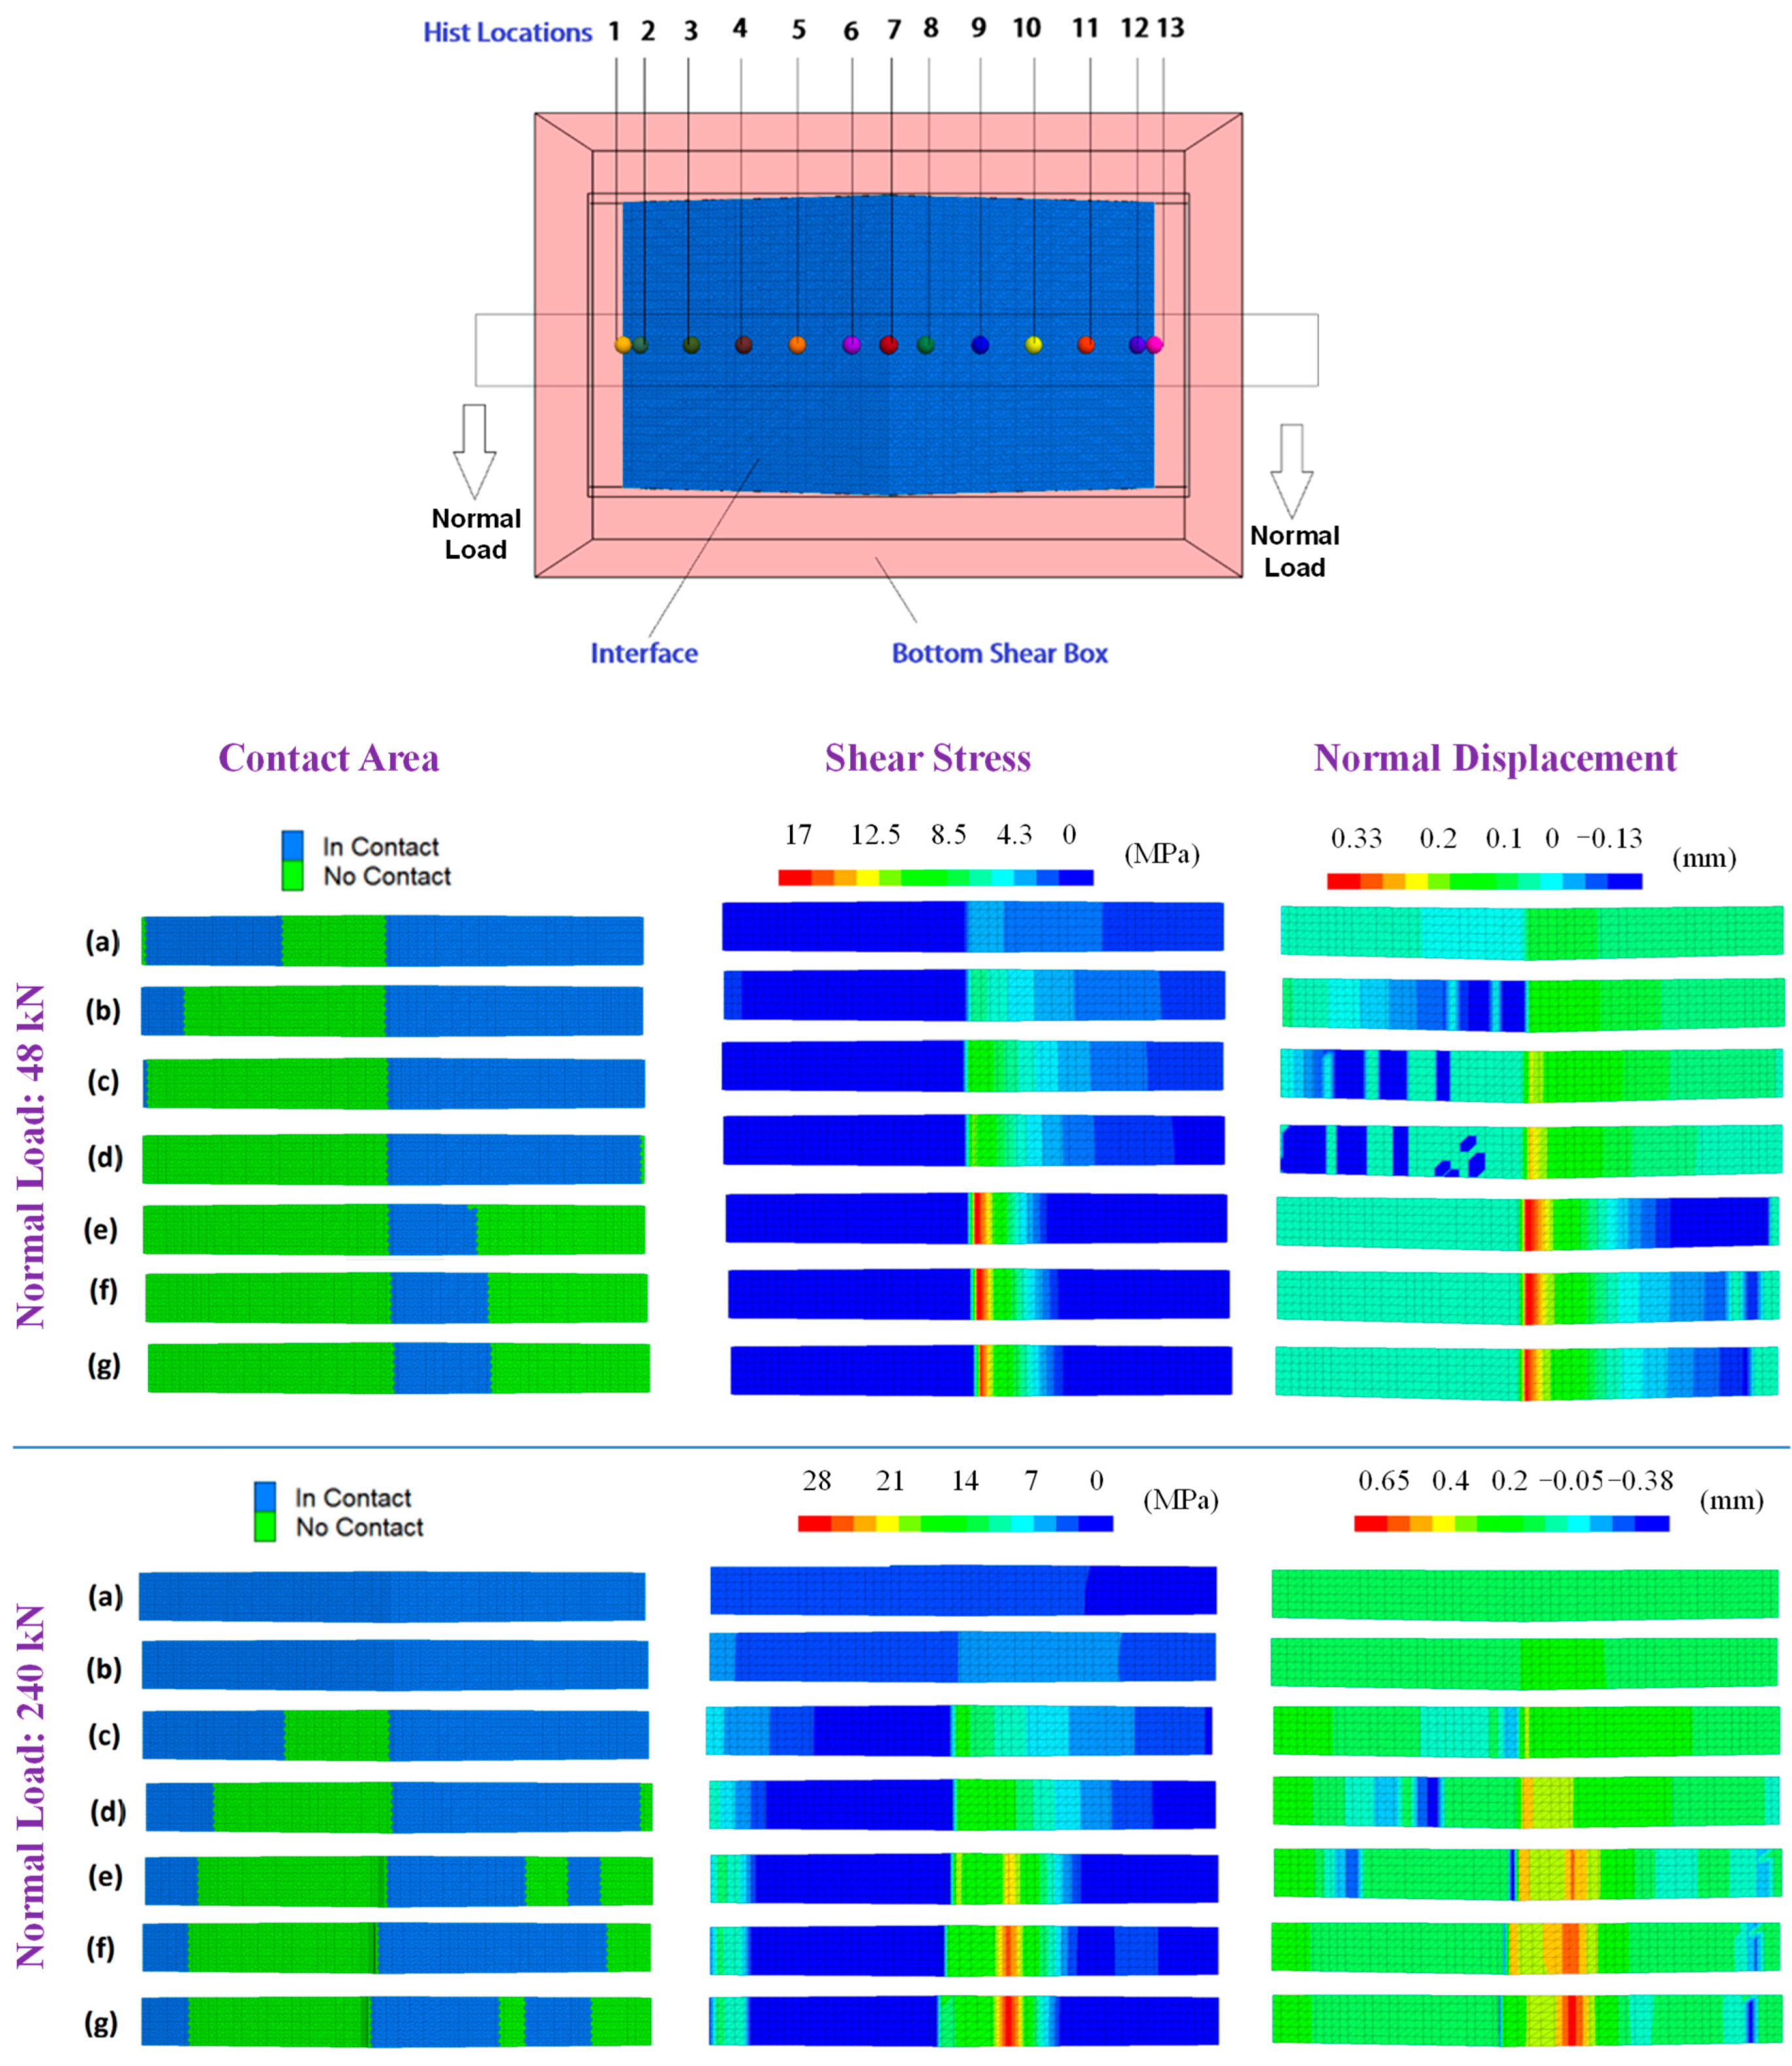
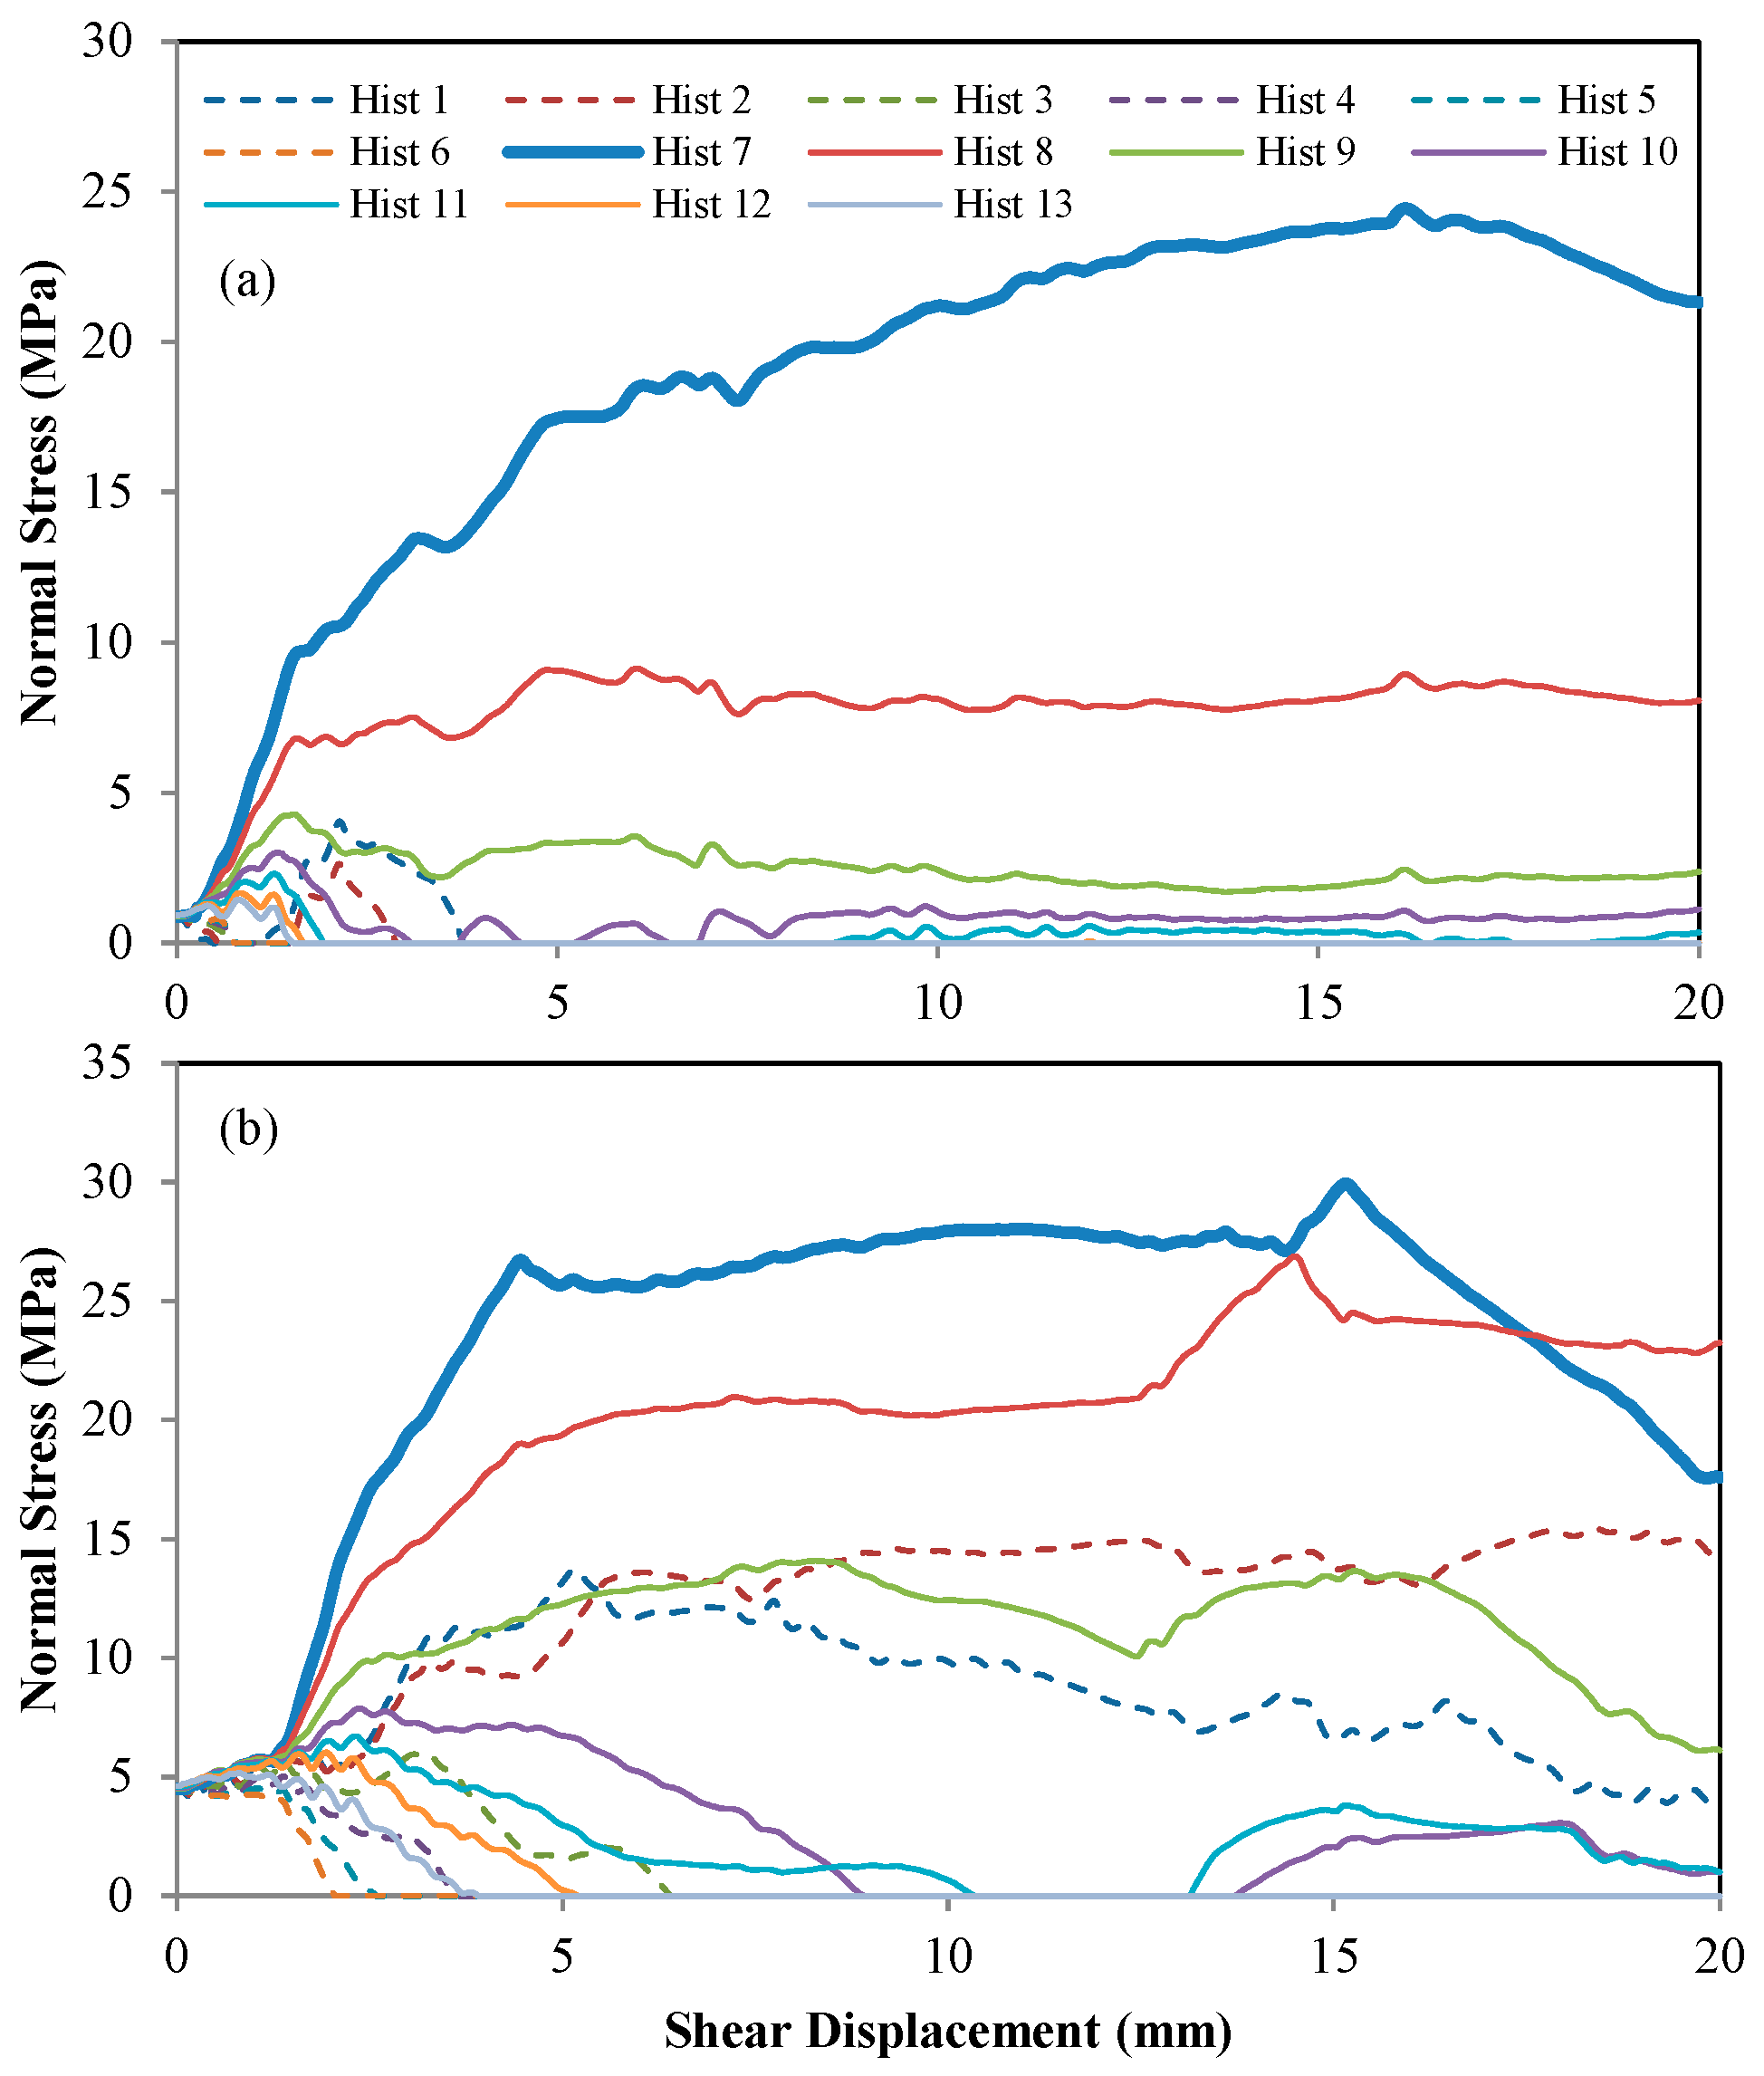
Since the Y-direction interface stress distribution is uniform, a representative strip was selected for analysis (Figure 11), with 13 points chosen to record the shear and normal stresses. Figure 11 and Figure 12 show that contact area and interface stresses are redistributed during direct shearing. Under a 48 kN normal load, the contact area of the interface decreases with the increase in shear displacement. It remains stable in the early stage, then the upper and bottom specimens separate near the left-side saw-tooth tops, leading to a sharp reduction (to zero) in contact area on the left half of the interface. Finally, the contact area remains almost constant and is mainly located on the right half, near the saw-tooth. The shear and normal stress at the interface increase as the shear progresses at the early stage, and then the stresses are only located in the right half of the interface. It is clear that, with the increase in the shear displacement, the shear and normal stress concentrate at the top of the saw-tooth and diffuse towards the right flank. The shear and normal stress increase step by step, and they move up along the slope surface; finally, the accumulated shear stress is up to 17.4 MPa. The maximum normal displacement is also located near the right-flank tooth crests when the shear process reaches a constant value.
Under a 240 kN normal load, with the increase in shear displacement, the contact area of the interface decreases. At the early stage, the contact area remains stable (with a longer stable period than under 48 kN), then decreases sharply, concentrating on the left edge and right half of the interface, and remains nearly constant until shear displacement reaches approximately 20 mm. In the early stage, distribution of shear stress is restricted to the right half of the interface. With the increase in the shear displacement, the area of shear stress concentration increases towards the hinge along with the flank and the left edge. Shear stress gradually increases and moves up the right-side slope surface, reaching a maximum of 27.7 MPa when shearing stabilizes.
Figure 13 shows that simulation results coincide with the laboratory test results, validating the numerical model and providing a reliable method for evaluating the mechanical behavior of direct shear testing of saw-tooth joint samples.

5. Discussion, Limitations, and Outlooks

5.1. Discussion

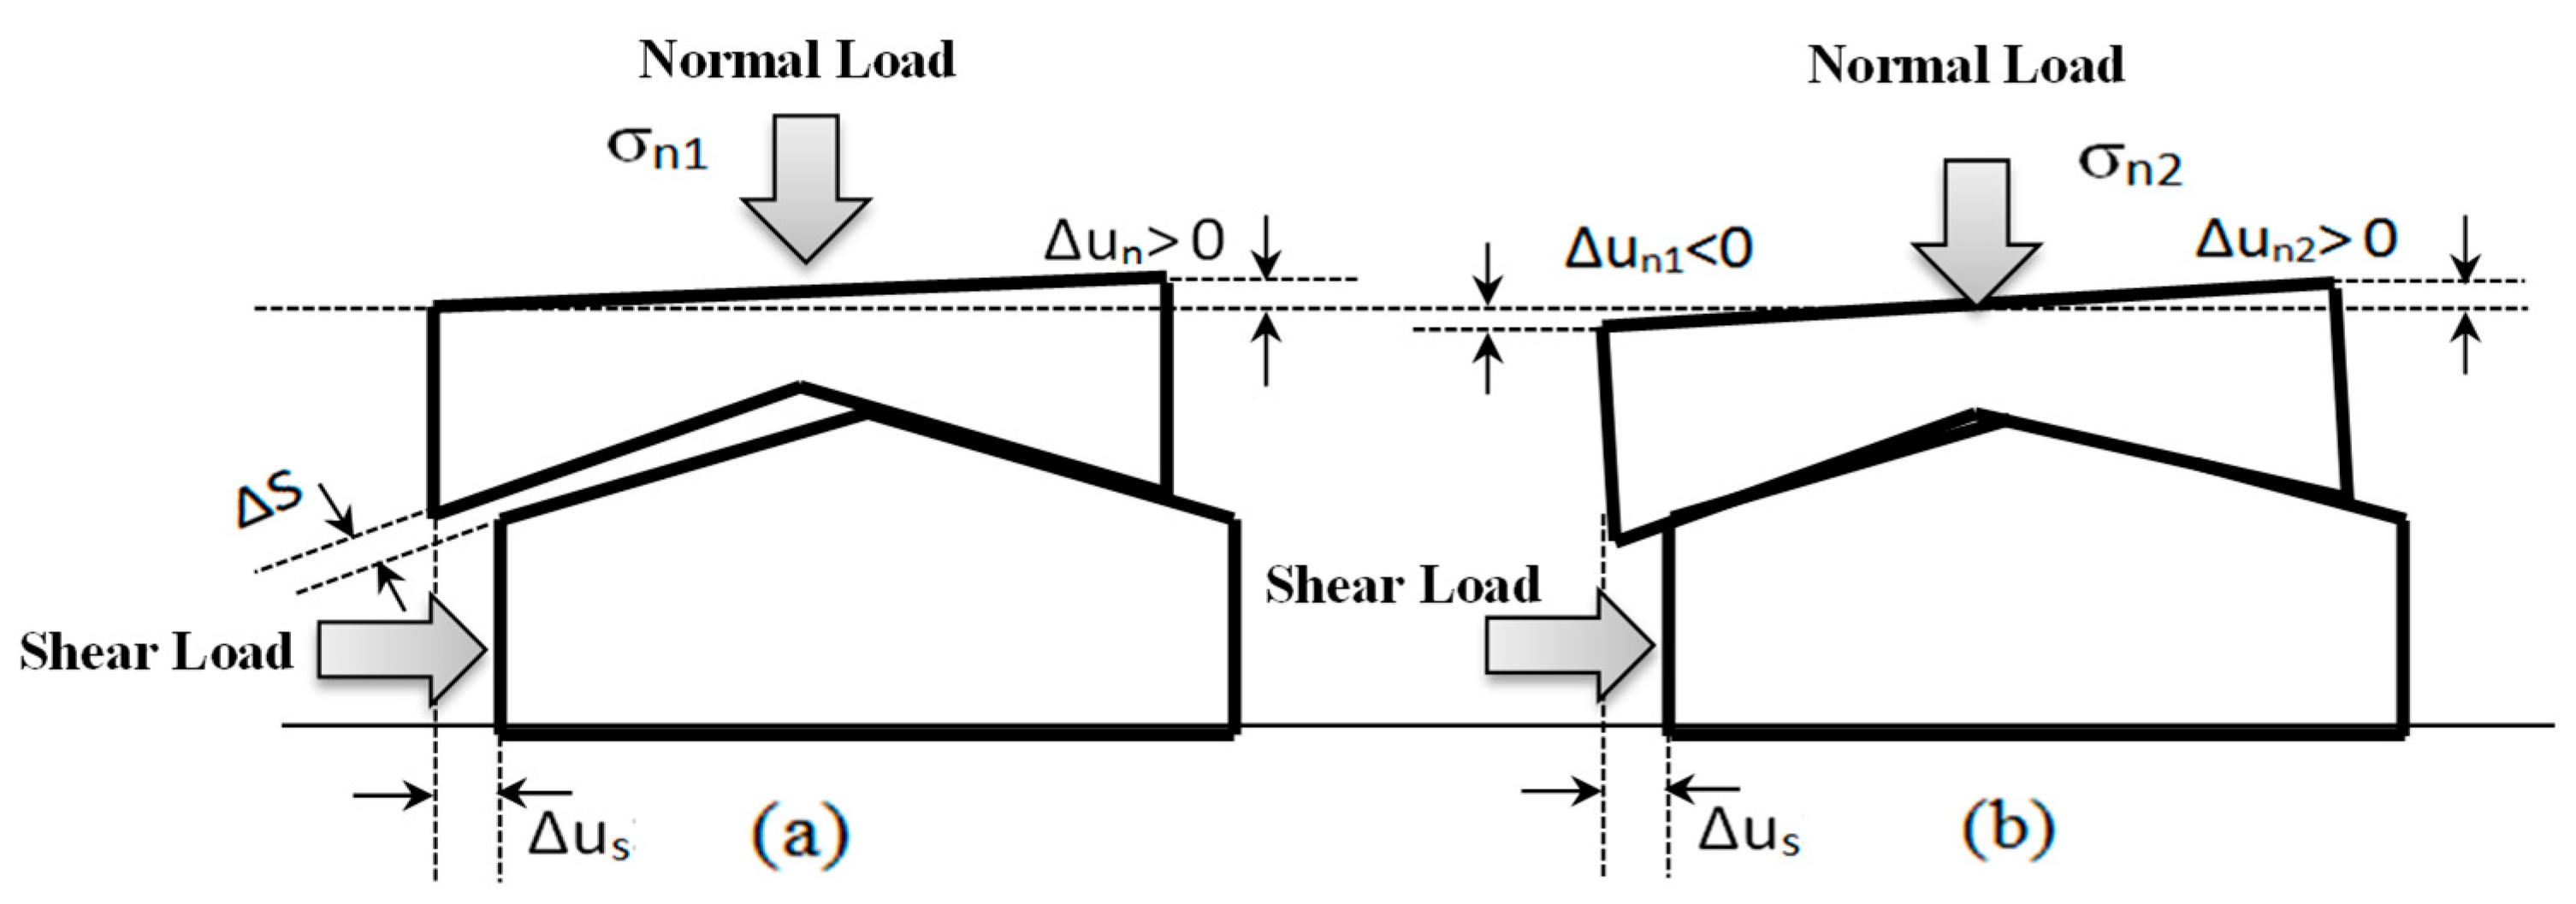
It is widely accepted that normal displacement on a negative slope decreases with increasing shear displacement [36]. However, detailed investigations prove that movement behavior varies under different normal load conditions (Figure 4, Figure 5 and Figure 12). Two general types of movement of the upper block are shown in Figure 14. Under small normal loads (Figure 14a), the upper specimen only climbs along the right slope during shearing. The normal displacement of the upper specimen in the negative slope decreases initially, then increases, and the upper and bottom specimens separate on the left slope. Under large normal loads (Figure 14b), the normal displacement in the negative slope decreases, and in the positive, increases continuously with shear displacement. Shearing causes two general types of damage: crushing and shearing of the saw tooth. Joint surface asperities and normal load are the two most critical factors influencing joint failure. During shearing, under low normal forces, the upper and lower parts of the specimen slide along the joint surface slope; as normal force increases, dilation becomes increasingly difficult. Under low normal load, the failure is primarily characterized by tensile fracturing and dilation. The asperities remain largely intact with only minor surface abrasion; there is no significant macroscopic crushing of the block. The behavior is dominated by the geometric roughness (JRC). Under high normal load, the failure shifts to shear crushing. The normal stress exceeds the compressive strength of the asperities, causing them to fracture.
Furthermore, based on the analysis of our experimental results, we hypothesize that the inclination angle changes the failure mode of the specimen by controlling the critical normal load. Steeper angles enhance dilation but trigger earlier crushing. The asperity height and length determine the magnitude of non-uniform displacement and the critical shear displacement for dilation reversal. The difference between single-tooth continuous distribution and multi-tooth distribution lies in whether the shear curve exhibits plastic behavior without an obvious peak, or brittle behavior with a sharp post-peak drop. This is because the dilation reversal phenomenon may be spatially constrained by the regular triangular asperity shape and uniform geometry.

5.2. Limitations

This research combines experimental and numerical approaches to systematically reveal the cyclic shear characteristics and the control mechanisms of dilatancy reversal in single-saw-tooth artificial rock joints subjected to constant normal load (CNL). Nevertheless, due to limitations in testing conditions and the specific scope of this work, there are still areas that require further refinement and exploration in future research.
(1)
The material employed in this study was prepared using a cement–glass sand mixture. Consequently, its mechanical properties—specifically brittleness, fracture toughness, and anisotropy—exhibit certain discrepancies when compared to natural rock. Furthermore, the investigation was confined to continuous single-saw-tooth joints with a sole dip angle of 10°. Given that natural rock joints typically feature complex multi-asperity structures, irregular roughness, and variable dip distributions, the generalizability of the conclusions drawn herein to natural rock joints requires further verification.
(2)
In addition, the cyclic shear responses, especially the dilation reversal phenomenon, may be influenced by the regular triangular asperity shape and uniform geometry. Such behavior needs to be further verified with more realistic joint morphologies, such as multi-tooth, irregular, or natural rock joint surfaces.
(3)
All tests were conducted under constant normal load (CNL) boundary conditions, which are only applicable to shallow rock engineering projects with free deformation surfaces. In contrast, in deep engineering projects such as tunnels and underground chambers, rock mass deformation is constrained by the surrounding rock, and the boundary conditions are more closely approximated by constant normal stiffness (CNS). The shear behavior, dilation characteristics, and failure modes of saw-tooth rock joints under CNS conditions may differ significantly from those under CNL conditions, which have not been investigated in this study. In addition, only a single shear rate (3.0 mm/min) and a single forward-backward shear cycle were adopted in this study. The effects of different shear rates (especially high shear rates under dynamic loads such as earthquakes) and multiple cyclic shear loads on the non-uniform deformation, damage evolution, and settlement-to-dilation transition behavior of saw-tooth rock joints have not been explored.

5.3. Outlooks

This study reveals the non-uniform deformation and settlement-to-dilation transition mechanism of single saw-tooth artificial rock joints under constant normal load (CNL) conditions through laboratory experiments and numerical simulations. However, combined with the classic energy principle for shear behavior of rock joints proposed by Seidel and Haberfield in 1995, elastic deformation will cause the measured global dilation rate to be significantly lower than the joint asperity angle without changing the joint shear strength, whereas inelastic (crushing) deformation will alter the energy balance relationship.
At present, this study only qualitatively attributes the dilation behavior to joint climbing or asperity crushing. It has not quantitatively separated the components of elastic dilation and inelastic dilation, nor analyzed the influence of elastic deformation on the critical conditions for settlement-to-dilation transition, which is also a key content that needs to be considered in our subsequent work [47].

6. Conclusions

In this study, the shear strength and normal displacement of specimens with a single saw-tooth joint under different normal load conditions were investigated using laboratory tests and numerical simulations. Shear strength increases with the increase in normal loading, and normal displacement exhibits a complex pattern at different points. Fracture and movement characteristics differ under different normal load levels, providing a more comprehensive interpretation of the movement behavior of the upper specimen and the interface behavior during direct shearing. The results can provide guidelines for evaluating the stability of infrastructures during foundation construction or geological movements. The key observations from this study are as follows:
  • Average normal displacement and average stress methods lead to incomplete and subjective interpretations of direct shear test results. Four-corner normal displacement measurements are necessary to capture the non-uniform deformation characteristics of saw-tooth joints.
  • Peak shear forces increased monotonically with normal loads, and shear resistance in the backward shearing stage was consistently lower than that in the forward stage due to joint surface damage.
  • Shearing resistance is markedly different between the forward and backward shearing directions, with the shear resistance in the backward direction being smaller.
  • Joint dilation in the forward shearing stage can be fully recovered during backward shearing with a small offset (except under high normal force).
  • Under lower normal load conditions (Figure 14a), joint tension failure dominates, normal displacement of the upper specimen on the left side initially shows a compressive trend, and then dilation behavior can be observed.
  • Under higher normal loads (Figure 14b), joint shear failure dominates, and movements of the upper specimen on the left side only exhibit a compressive trend.
In this study, we explicitly evaluate the practical value of this study for engineering rock masses. The conclusions are directly applicable to gently undulating bedding planes, structural planes, and slightly rough joints widely encountered in slopes, foundation pits, and shallow tunnels. The non-uniform displacement and local dilation reversal observed in this study highlight the importance of local deformation monitoring in engineering design, rather than relying solely on average values. The transition normal load identified in this study provides a reference threshold for judging whether joints undergo climbing-dominated or crushing-dominated failure in practical projects.

Author Contributions

Conceptualization, Z.T. and W.T.; methodology design and validation, Z.T. and W.T.; numerical implementation and software development, W.T.; formal data analysis and interpretation, Z.T.; experimental investigation and testing, Z.T.; resources and laboratory facilities, W.D.; data curation and processing, W.T.; original draft writing, Z.T.; review and editing, C.L.; visualization and figure preparation, W.T.; project supervision, C.L.; project management and administration, W.D.; funding acquisition, W.D. All authors have read and agreed to the published version of the manuscript.

Funding

This work is funded by the National Natural Science Foundation of China and the Natural Science Foundation of Guangdong Province, China.

Data Availability Statement

The original contributions presented in this study are included in the article. Further inquiries can be directed to the corresponding author.

Acknowledgments

Special thanks to Heinz Konietzky, Thomas Frühwirt, Tom Weichmann, Beatrice Tauch and Gerd Münzberger for help during the laboratory tests.

Conflicts of Interest

Authors Zongheng Tao, Wei Tang and Chuan Li are employed by the company China Communications Construction Corporation-Guanghang Dredging Co., Ltd. and China Communications Construction Corporation Guangzhou Dredging Co., Ltd. The remaining authors declare that the research was conducted in the absence of any commercial or financial relationships that could be construed as a potential conflict of interest.

Abbreviations

The following abbreviations are used in this manuscript:
LVDTsLinear Variable Differential Transformers
CNLConstant Normal Load

References

  1. Barton, N. Review of a New Shear Strength Criterion for Rock Joints. Eng. Geol. 1973, 7, 287–332. [Google Scholar] [CrossRef] [Scilit]
  2. Xing, Y.; Kulatilake, P.H.S.W.; Sandbak, L.A. Effect of Rock Mass and Discontinuity Mechanical Properties and Delayed Rock Supporting on Tunnel Stability in an Underground Mine. Eng. Geol. 2018, 238, 62–75. [Google Scholar] [CrossRef] [Scilit]
  3. Yan, B.; Qi, Q.; Liu, J.; Cai, M.; Li, X.; Wang, P. Fracture Propagation and Permeability Evolution Mechanism of Jointed Rock Mass in Coastal Mines. Rock. Mech. Rock. Eng. 2022, 56, 2763–2778. [Google Scholar] [CrossRef] [Scilit]
  4. Zhang, Y.; Xia, Y.; Lin, M.; Wang, Z.; Huang, J.; Yan, Y.; Mei, W. Experimental Analysis of Structure Rockburst in Rock-Like Materials Under Gradient Loading Using Coupled Infrared Thermography and Acoustic Emission. Rock Mech. Rock Eng. 2026, 173–178. [Google Scholar] [CrossRef] [Scilit]
  5. Zheng, Z.; Gao, S.; Li, X.; Huang, X.; Qiu, S.; Liu, X. Shear Mechanical Behaviors and Cracking Evolution Mechanism of Foliated Rock Under Tunnel Excavation Disturbance Conditions. Rock Mech. Rock Eng. 2026, 1–31. [Google Scholar] [CrossRef] [Scilit]
  6. Bai, Y.; Xu, Z.; Dou, H.; Liu, N.; Zhao, Z.; Qiu, S.; Shan, R. Study on Mechanical Properties and Mesoscopic Damage Mechanism of Composite Jointed Rock Masses. Int. J. Min. Sci. Technol. 2025, 35, 1731–1751. [Google Scholar] [CrossRef] [Scilit]
  7. Bewick, R.P. The Strength of Massive to Moderately Jointed Rock and Its Application to Cave Mining. Rock. Mech. Rock. Eng. 2021, 54, 3629–3661. [Google Scholar] [CrossRef] [Scilit]
  8. Zhao, J. Joint Surface Matching and Shear Strength Part A: Joint Matching Coefficient (JMC). Int. J. Rock. Mech. Min. Sci. 1997, 34, 173–178. [Google Scholar] [CrossRef] [Scilit]
  9. Zhao, J. Joint Surface Matching and Shear Strength Part B: JRC-JMC Shear Strength Criterion. Int. J. Rock. Mech. Min. Sci. 1997, 34, 179–185. [Google Scholar] [CrossRef] [Scilit]
  10. Zhang, Q.B.; Zhao, J. A Review of Dynamic Experimental Techniques and Mechanical Behaviour of Rock Materials. Rock. Mech. Rock. Eng. 2014, 47, 1411–1478. [Google Scholar] [CrossRef] [Scilit]
  11. Cao, W.; Li, X.; Tao, M.; Zhou, Z. Vibrations Induced by High Initial Stress Release During Underground Excavations. Tunn. Undergr. Space Technol. 2016, 53, 78–95. [Google Scholar] [CrossRef] [Scilit]
  12. Sonmez, H.; Ercanoglu, M.; Dagdelenler, G. A Novel Approach to Structural Anisotropy Classification for Jointed Rock Masses Using Theoretical Rock Quality Designation Formulation Adjusted to Joint Spacing. J. Rock. Mech. Geotech. Eng. 2022, 14, 329–345. [Google Scholar] [CrossRef] [Scilit]
  13. Zhao, D.; Xia, Y.; Zhang, C.; Tang, C.; Zhou, H.; Liu, N.; Singh, H.K.; Zhao, Z.; Chen, J.; Mu, C. Failure Modes and Excavation Stability of Large-Scale Columnar Jointed Rock Masses Containing Interlayer Shear Weakness Zones. Int. J. Rock. Mech. Min. Sci. 2022, 159, 105222. [Google Scholar] [CrossRef] [Scilit]
  14. Tao, K.; Dang, W.; Liao, X.; Li, X. Experimental Study on the Slip Evolution of Planar Fractures Subjected to Cyclic Normal Stress. Int. J. Coal Sci. Technol. 2023, 10, 67. [Google Scholar] [CrossRef] [Scilit]
  15. Tao, K.; Dang, W.; Konietzky, H.; Pan, Y.; Liu, Y. Frictional Sliding Behavior of Rock Joints under Cyclic Normal Stress: Insight from Spring-Block Model Coupled with Rate and State Friction Framework. Tribol. Int. 2026, 214, 111163. [Google Scholar] [CrossRef] [Scilit]
  16. Tao, K.; Konietzky, H.; Gao, F.; Wu, R.; Dang, W.; Li, C.; Liu, Y. Stick–Slip Friction and Surface Contact Density of Bare Granite Joint Affected by Cyclic Normal Stress. Rock Mech. Rock Eng. 2025, 1–21. [Google Scholar] [CrossRef] [Scilit]
  17. Cardona, A.; Finkbeiner, T.; Santamarina, J.C. Hydro-mechanical coupling in fractured rocks: A numerical study using the implicit joint-continuum model. Int. J. Rock. Mech. Min. Sci. 2026, 200, 106460. [Google Scholar] [CrossRef] [Scilit]
  18. Shang, J.; Zhao, Z.; Ma, S. On the Shear Failure of Incipient Rock Discontinuities under CNL and CNS Boundary Conditions: Insights from DEM Modelling. Eng. Geol. 2018, 234, 153–166. [Google Scholar] [CrossRef] [Scilit]
  19. Li, Y.; Wu, W.; Li, B. An Analytical Model for Two-Order Asperity Degradation of Rock Joints Under Constant Normal Stiffness Conditions. Rock. Mech. Rock. Eng. 2018, 51, 1431. [Google Scholar] [CrossRef] [Scilit]
  20. Song, L.; Bai, Z.; Jiang, Q.; Zhu, B.; Wang, G.; Gu, Y. Advancing the Understanding of Infilled Joint Shear Behavior: A Review of Modeling, Measurement, and Influential Factors. Rock. Mech. Rock. Eng. 2025, 58, 9265–9295. [Google Scholar] [CrossRef] [Scilit]
  21. Dang, W.; Liu, Y.; Li, S.; Li, X.; Huang, L.; Ma, J. Direct Shear Behavior of Dredged Soil under Dynamic Normal Load Conditions. Soil. Dyn. Earthq. Eng. 2023, 168, 107851. [Google Scholar] [CrossRef] [Scilit]
  22. Zhang, Q.; Gu, Q.; Li, S.; Wang, H.; Han, G. A Shear Strength Criterion of Rock Joints under Dynamic Normal Load. Int. J. Rock. Mech. Min. Sci. 2025, 186, 106002. [Google Scholar] [CrossRef] [Scilit]
  23. Anand, A.; Tiwari, G. Transition in rate-dependent shear response of rock-like joints due to clay-infill: Strength, dilation, stick-slip, and roughness analysis. Bull. Eng. Geol. Environ. 2026, 85, 75. [Google Scholar] [CrossRef] [Scilit]
  24. Tao, K.; Dang, W.; Konietzky, H.; Liu, Y.; Zhang, W.; Li, X. Velocity Effects on Slip Evolution of Faults Subjected to Constant and Cyclic Normal Stress Derived from Laboratory Tests. Rock. Mech. Bull. 2025, 4, 100190. [Google Scholar] [CrossRef] [Scilit]
  25. Hoek, E.; Bray, J.W. Rock Slope Engineering; IMM: London, UK, 1981. [Google Scholar]
  26. Patton, F.D. Multiple Modes of Shear Failure in Rock. In Proceedings of the 1st Congress of International Society of Rock Mechanics, Lisbon, Portugal, 25 September–1 October 1966; pp. 509–613. [Google Scholar]
  27. Huang, X.; Haimson, B.C.; Plesha, M.E.; Qiu, X. An Investigation of the Mechanics of Rock Joints—Part I: Laboratory Investigation. Int. J. Rock. Mech. Min. Sci. Geomech. Abstr. 1993, 30, 257–269. [Google Scholar] [CrossRef] [Scilit]
  28. Yang, Z.Y.; Chiang, D.Y. An Experimental Study on the Progressive Shear Behavior of Rock Joints with Tooth-Shaped Asperities. Int. J. Rock. Mech. Min. Sci. 2000, 37, 1247–1259. [Google Scholar] [CrossRef] [Scilit]
  29. Yin, Q.; Nie, X.; Wu, J.; Wang, Q.; Bian, K.; Jing, H. Experimental Study on Unloading Induced Shear Performances of 3D Saw-Tooth Rock Fractures. Int. J. Min. Sci. Technol. 2023, 33, 463–479. [Google Scholar] [CrossRef] [Scilit]
  30. You, W.; Dai, F.; Liu, Y.; Li, A. Dynamic Mechanical Response and Fracture Characteristics of Multi-Flawed Rocks Exposed to Hydrostatic Confinements. Rock. Mech. Rock. Eng. 2024, 57, 6301–6319. [Google Scholar] [CrossRef] [Scilit]
  31. Jiang, Y.; Han, J.; Wang, C.; Luan, H.; Zhang, S.; Wang, D.; Li, X. Study on the Shear Behavior and Damage Mechanism of 3D Engraved Sandstone Joints Subjected to Wetting–Drying Cycles. Rock Mech. Rock Eng. 2026, 1–28. [Google Scholar] [CrossRef] [Scilit]
  32. Muralha, J.; Grasselli, G.; Tatone, B. ISRM Suggested Method for Laboratory Determination of the Shear Strength of Rock Joints: Revised Version. Rock Mech. Rock Eng. 2014, 47, 291–302. [Google Scholar] [CrossRef] [Scilit]
  33. Guo, Y.; Golchin, A.; Hicks, M.A.; Liu, S.; Zhang, G.; Vardon, P.J. Experimental Investigation of Soil–Structure Interface Behaviour under Monotonic and Cyclic Thermal Loading. Acta Geotech. 2023, 18, 3585–3608. [Google Scholar] [CrossRef] [Scilit]
  34. Bahaaddini, M.; Rajaei Moghaddam, N.; Amini, E.; Jalalifar, H.; Serati, M. Experimental and Numerical Investigation of the Effect of Jaw Curvature and Material Brittleness in the Brazilian Diametral Compression Tests. Rock. Mech. Rock. Eng. 2025, 59, 2277–2294. [Google Scholar] [CrossRef] [Scilit]
  35. Larsson, J.; Flansbjer, M.; Jacobsson, L.; Johansson, F.; Johnson, E.; Mas Ivars, D.; Pérez-Rey, I. A Three-Factor Experimental Study on the Effect of Specimen Size on the Shear Strength of Rock Joints. Rock. Mech. Rock. Eng. 2025, 1–25. [Google Scholar] [CrossRef] [Scilit]
  36. Nguyen, V.H.; Konietzky, H.; Frühwirt, T. New Methodology to Characterize Shear Behavior of Joints by Combination of Direct Shear Box Testing and Numerical Simulations. Geo. Geol. Eng. 2014, 32, 829–846. [Google Scholar] [CrossRef] [Scilit]
  37. Sanei, M.; Faramarzi, L.; Fahimifar, A.; Goli, S.; Mehinrad, A.; Rahmati, A. Shear Strength of Discontinuities in Sedimentary Rock Masses Based on Direct Shear Tests. Int. J. Rock. Mech. Min. Sci. 2015, 75, 119–131. [Google Scholar] [CrossRef] [Scilit]
  38. Chen, N.; Zhang, X.; Jiang, Q.; Feng, X.; Wei, W.; Yi, B. Shear Behavior of Rough Rock Joints Reinforced by Bolts. Int. J. Geomech. 2018, 18, 04017130. [Google Scholar] [CrossRef] [Scilit]
  39. Zhang, Z.; Zhu, J.; Deng, J. A Comparative Study for Determining Rock Joint Normal Stiffness with Destructive Uniaxial Compression and Nondestructive Ultrasonic Wave Testing. J. Rock. Mech. Geotech. Eng. 2023, 15, 1700–1712. [Google Scholar] [CrossRef] [Scilit]
  40. Song, Z.Y.; Dang, W.G.; Bai, Z.C.; Zhao, Y.; Wang, P.T.; Yang, Z. Mechanical Responses and Fracturing Behaviors of Coal under Complex Normal and Shear Stresses, Part I: Experimental Results. Int. J. Coal Sci. Technol. 2024, 11, 63. [Google Scholar] [CrossRef] [Scilit]
  41. Chen, Y.; Shan, R.; Peng, Y.; Li, L.; He, Z. Performance Assessment of Anchor Cable with High-Strength C-Shaped Tube under Double Shearing. Tunn. Undergr. Space Technol. 2026, 171, 107475. [Google Scholar] [CrossRef] [Scilit]
  42. Dang, W.; Konietzky, H.; Frühwirt, T. Rotation and Stress Changes of a Plane Joint During Direct Shear Tests. Int. J. Rock. Mech. Min. Sci. 2016, 89, 129–135. [Google Scholar] [CrossRef] [Scilit]
  43. Assadi, A. Rupture Layers in Granular Materials. Ph.D. Thesis, University of London, London, UK, 1975. [Google Scholar]
  44. Dyer, M.R. Observation of the Stress Distribution in Crushed Glass with Applications to Soil Reinforcement. Ph.D. Thesis, University of Oxford, Oxford, UK, 1985. [Google Scholar]
  45. Barton, N.R.; Choubey, V. The shear strength of rock joints in theory and practice. Rock. Mech. 1977, 10, 1–54. [Google Scholar] [CrossRef] [Scilit]
  46. Barton, N.R.; Bandis, S.C. Effects of block size on the shear behavior of jointed rock. In Proceedings of the 6th International Congress on Rock Mechanics, Montreal, Canada, 6–10 August 1990; Volume 1, pp. 593–600. [Google Scholar]
  47. Seidel, J.P.; Haberfield, C.M. The Application of Energy Principles to the Determination of the Sliding Resistance of Rock Joints. Rock. Mech. Rock. Eng. 1995, 28, 211–226. [Google Scholar] [CrossRef] [Scilit]
Figure 1. (a) Shear box device, (b) shear test set-up, (c) geometry and size [mm] of the testing sample, (d,e) specimen installation.
Geosciences 16 00207 g001
Figure 2. Shear forces versus shear displacement during forward shearing and backward shearing.
Geosciences 16 00207 g002
Figure 3. Peak shear forces under different normal forces during forward shearing and backward shearing.
Geosciences 16 00207 g003
Figure 4. Shear displacement vs. average normal displacement under different normal loads.
Geosciences 16 00207 g004
Figure 5. Shear displacement vs. normal displacement at the two edges of the upper specimen under different normal loads. The letters a and b represent two displacement data monitoring points.
Geosciences 16 00207 g005
Figure 6. Specimen after shear test.
Geosciences 16 00207 g006
Figure 7. Numerical model.
Geosciences 16 00207 g007
Figure 8. Principal stresses [Pa] and reaction forces [N] distribution (a) before shearing and (b) after shearing under a normal load of 240 kN.
Geosciences 16 00207 g008
Figure 9. Zone states at different shear displacements under large and small normal load conditions.
Geosciences 16 00207 g009
Figure 10. (a) Vertical displacement contours at shear displacement of 0.5 cm, (b) vertical displacement contours at shear displacement of 2.0 cm, and (c) vectors representing shear displacement in the upper part of the specimen and the loading plane at shear displacement of 2.0 cm.
Geosciences 16 00207 g010
Figure 11. Interface behavior at different shear displacements: (a) 0.09 cm, (b) 0.15 cm, (c) 0.3 cm, (d) 0.5 cm, (e) 1.0 cm, (f) 1.5 cm, and (g) 2.0 cm.
Geosciences 16 00207 g011
Figure 12. Normal stresses at different shear displacements: (a) under a normal load of 48 kN and (b) under a normal load of 240 kN.
Geosciences 16 00207 g012
Figure 13. Laboratory test and numerical simulation results: (a) shear force and (b) normal displacement, a’ and b’ represent simulation results.
Geosciences 16 00207 g013
Figure 14. Movement behavior under different normal loads: (a) smaller normal loads and (b) larger normal loads.
Geosciences 16 00207 g014
Table 1. Key parameters of the FLAC3D numerical model.
Element TypeConstitutive ModelParameterValueUnit
Solid elementsMohr–CoulombElastic modulus
(E)
30GPa
Mohr–CoulombPoisson’s ratio
(ν)
0.2[ - ]
Mohr–CoulombDensity
(ρ)
2500kg/m3
Mohr–CoulombCohesion
(c)
7.2MPa
Mohr–CoulombInternal friction angle
(φ)
38°
Mohr–CoulombDilation angle
(φ)
10°
Interface elementsCoulomb slipInterface cohesion
(ci)
0.8MPa
Coulomb slipInternal friction angle
(φi)
32°
Coulomb slipNormal stiffness
(kn)
2.0 × 10¹¹N/m3
Coulomb slipShear stiffness
(ks)
1.0 × 10¹¹N/m3
Interface elementsCoulomb slipInterface cohesion
(cie)
0.1MPa
Coulomb slipInterface internal friction angle (φie)15°
Coulomb slipNormal stiffness
(knie)
2.0 × 10¹¹N/m3
Coulomb slipShear stiffness
(ksie)
1.0 × 10¹¹N/m3
Disclaimer/Publisher’s Note: The statements, opinions and data contained in all publications are solely those of the individual author(s) and contributor(s) and not of MDPI and/or the editor(s). MDPI and/or the editor(s) disclaim responsibility for any injury to people or property resulting from any ideas, methods, instructions or products referred to in the content.