1. Introduction
Unsaturated loess, which is a typical porous material, is widely distributed in arid and semiarid regions of northwestern China. Its hydro-mechanical coupling characteristics significantly impact regional geohazard prevention, groundwater resource assessment, and engineering foundation stability [
1,
2,
3,
4]. Investigations into the formation mechanisms of loess landslides have revealed that landslide occurrences are universally associated with variations in the soil water content, with dynamic water changes induced by processes such as rainfall infiltration constituting the primary triggering factor [
5,
6,
7]. As such, geophysical techniques for landslide assessment, including electrical resistivity tomography (ERT) [
8], ground-penetrating radar [
9], and seismic methods [
10], leverage these physics responses to map subsurface heterogeneity and identify potential slip surfaces with minimal ground disturbance. Consequently, the establishment of a real-time soil moisture monitoring system holds critical practical value for early warning and stability assessment of landslides.
In existing engineering practices, in situ water content monitoring for loess primarily relies on discrete point installations of soil moisture sensors [
11]. This method is constrained by the probe length and deployment density, which limits its ability to capture vertical gradient variations in the moisture and horizontal anisotropic migration characteristics of the vadose zone [
12]. Furthermore, sensor implantation disrupts the primary pore structure of loess, thereby creating disturbance zones around boreholes that significantly alter the local permeability field distributions [
13,
14]. Studies have demonstrated a notable correlation between loess resistivity characteristics and water content, namely, variations in the pore fluid ionic concentration and transport path connectivity during moisture migration induce measurable changes in the electrical conductivity responses [
15,
16]. This phenomenon provides a theoretical foundation for non-invasive water content inversion via the use of geophysical exploration techniques. Ranjy Roodposhti et al.’s [
17] study developed a non-invasive alternative using electrical resistivity to predict these parameters. Schwartz et al. [
18] combined ERT with time-domain reflectometry (TDR) to obtain heterogeneous soil moisture distributions through the bulk electrical conductivity, porewater conductivity derived from cation calculations, and clay content parameters, thereby establishing a field monitoring methodology. Addressing natural slope moisture migration monitoring challenges, Lu et al. [
19] integrated electrical resistivity tomography (ERT) with TDR technology, revealing a logarithmic relationship between the soil water content and resistivity. The results revealed an infiltration depth of ~2 m, with surges in the water content at depths ranging from 1.3 to 2 m triggered by rear-edge fissures during moderate rainfall events and the transition zones between high and low water contents coinciding with landslide slip surfaces, thus confirming the ability of resistivity methods to facilitate nondestructive moisture migration tracking and providing novel approaches for early warning of landslides. Wu et al. [
20] investigated the water–resistivity characteristics of loess from the Jingyang South Plateau, Shaanxi, via ERT and revealed that the groundwater table position can be determined once the loess water content reaches 30%. Moreover, they reported an apparent resistivity of 30 Ω·m and demonstrated that the vertical derivative reached a peak. This discriminative method, in which resistivity parameters are combined with water content relationships, enables precise water table depth determination, thereby providing a reliable basis for loess landslide prediction and stability analysis. Lu et al. [
21] analyzed the infiltration characteristics of irrigation water through a combination of ERT and soil moisture monitoring and revealed that the water content initially increased but then decreased with the depth, peaking at a depth of 30 cm; moreover, the shallow soil resistivity (<1.5 m) decreased significantly during infiltration, whereas deeper layers (>3.5 m) indicated minimal variation. Ciampi et al.’s [
22] study introduced a novel statistically-based clustering procedure for ERT data, constrained by borehole stratigraphy. Integrating borehole data with ERT profiles, the iterative clustering identified six distinct lithological clusters. This quantitatively characterizes the heterogeneity and resistivity signatures of shallow deposits. Zhou et al.’s [
23] study proposed soil moisture tomography, a non-invasive method for 3D spatiotemporal monitoring of field soil water content, leveraging Archie’s relationship between resistivity and moisture. The laboratory-derived Archie parameters from 46 samples were spatially interpolated, enabling 3D moisture calculation.
In summary, ERT has been successfully applied in the area of subsurface moisture distribution detection because of its efficiency and nondestructive advantages. However, substantial uncertainties persist in quantitative resistivity‒moisture conversion models. While Equation (10) [
23] performs well in saturated porous media, its applicability to unsaturated loess faces three challenges. (1) The cementation index is assumed to remain constant, whereas newly formed secondary pores cause value fluctuations with water content variations [
24,
25]. (2) Traditional models neglect the electrical double-layer (EDL) effects at solid‒liquid interfaces, leading to overestimation of the resistivity in low-moisture zones under increased porewater mineralization [
26,
27]. (3) In most studies, static water‒resistivity calibrations are employed, yet field monitoring has revealed resistivity hysteresis in loess subjected to wetting‒drying cycles owing to porewater redistribution resulting from suction changes [
28]. Consequently, the development of resistivity‒water quantification models specific to unsaturated loess is important for enhancing the engineering application accuracy of ERT. Induced polarization (IP) techniques go further by being able to map, in addition to the electrical resistivity, other physical parameters of interest, such as the chargeability and the distribution of the relaxation times. IP can be considered a useful and fruitful extension of conventional ERT [
29].
This study aimed to investigate the quantitative relationship between the electrical resistivity and water content in unsaturated loess, with the objective of converting the resistivity profiles obtained through ERT into water content profiles. Focusing on loess from a specific site in northwestern China, samples with varying densities and water contents were prepared, and their resistivity and polarization effects were obtained using the four-electrode method. Through experimental data analysis, the impacts of the water saturation and density on the resistivity were systematically examined. The results demonstrated that with increasing water saturation, the soil resistivity gradually decreased and eventually stabilized, and a similar decreasing trend was observed with increasing density. Furthermore, the experimental results were compared with the classical Archie’s law to validate the applicability of the resistivity‒water relationship model, ultimately achieving the successful conversion of the resistivity profiles into water content profiles. Additionally, practical applications were verified to assess the potential of the proposed model in geological exploration and environmental monitoring. These findings provide a sound foundation for engineering applications of ERT, particularly in enhancing the accuracy of subsurface water characterization for geohazard prevention and stability assessment in loess terrains.
2. Materials and Methods
2.1. Sample Description
Loess, which is a unique type of sediment, exhibits unique physical properties, hydraulic characteristics, and unsaturated-state behaviors [
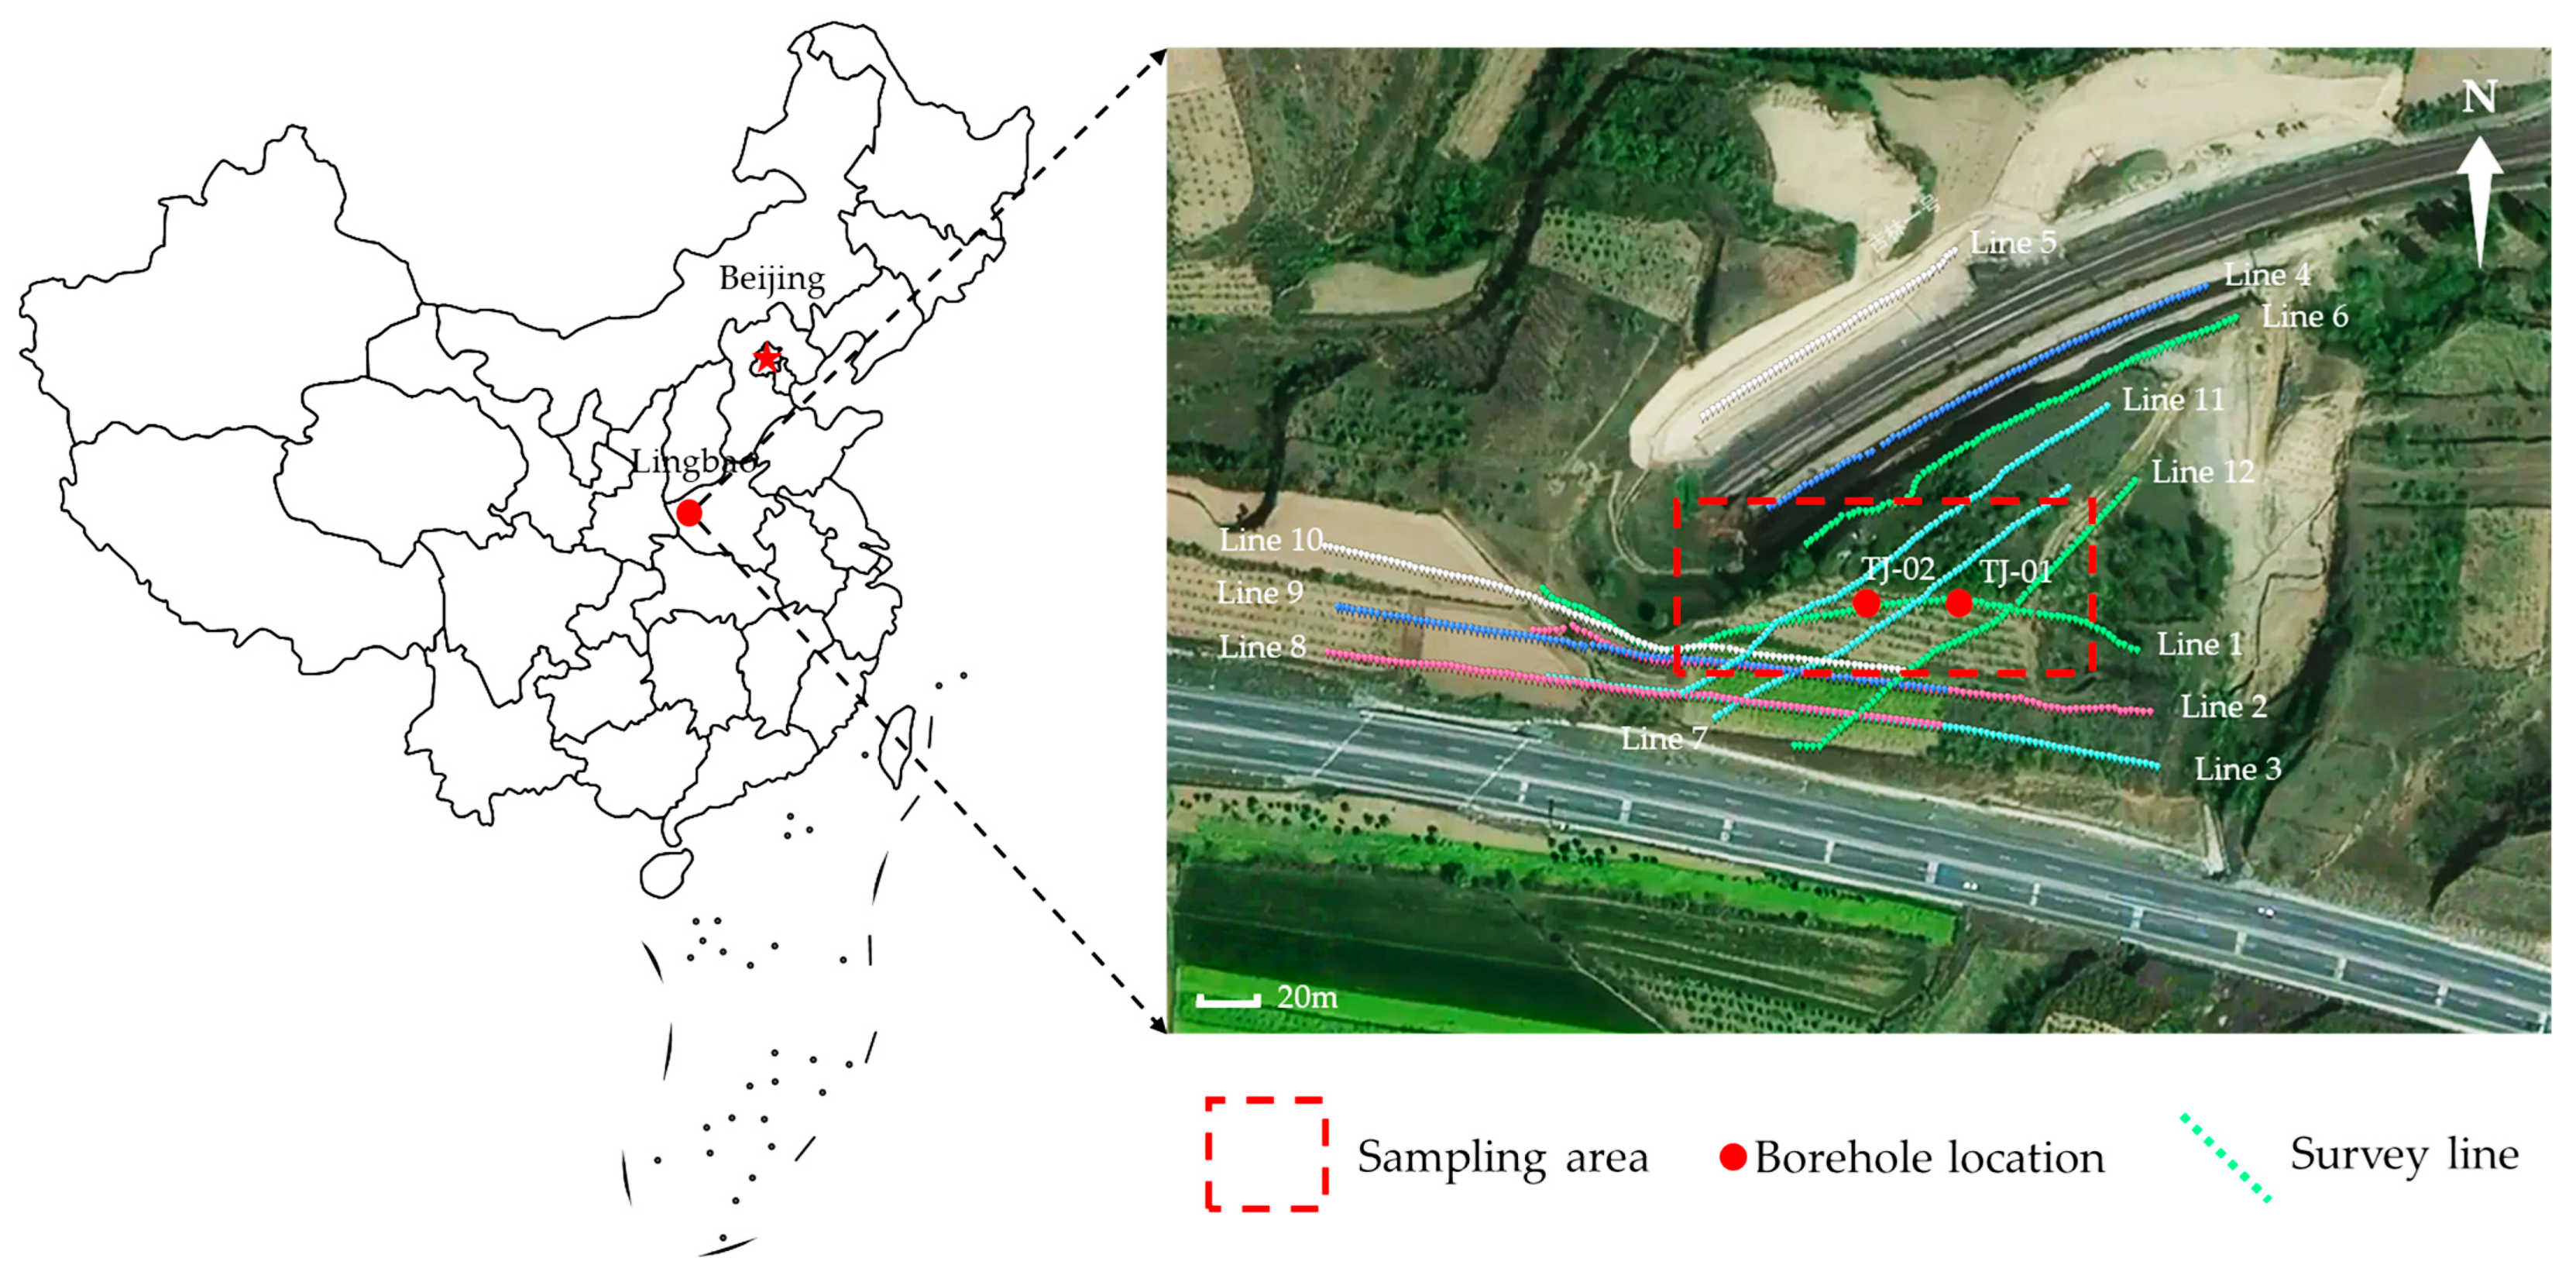
30]. Its notable physical properties include the particle size distribution, density, and porosity. Loess, which comprises primarily fine-grained particles, exhibits significant variations in density and porosity with water content changes. To investigate the relationship between the loess resistivity and water content, the loess used in this experiment was collected from Lingbao City, Henan Province (
Figure 1). We employed a portable sampling rig to extract samples at predetermined locations. Upon achieving the target sampling length, the soil core was retrieved by breaking its base, steadily lifted out, and extracted. Following extraction, both ends of the specimen were trimmed flat, promptly wrapped in cling film, secured within a sample box, and clearly labeled with pertinent sample information. The loess obtained from the study area is yellowish, exhibits a relatively uniform composition, features a loose soil structure, and is prone to disintegration and collapsibility upon contact with water.
2.2. Test Instruments
In this test, an EDYC rock sample electrical property tester from Chongqing Dingfeng Company was used, which comprises an EDYC main unit and a sample holder. The internal power supply is an adjustable DC power supply (30 V), and an external power supply can be connected via the A and B power supply terminals. The instrument can measure the electrical parameters of rock samples, including the resistivity, polarizability, half-life period, and degree of attenuation. The device relies on the four-electrode method to measure the sample resistivity (
Figure 2). In the four-electrode method, the resistivity (
ρ) can be calculated as follows:
where
V is the voltage between M and N,
V;
A is the cross-sectional area of the sample, m
2;
I is the current between A and B; and
L is the length of the sample, m.
During the power supply process, the induced polarization field superimposes on the steady electric field, producing a total potential difference. After completing the charging process of the soil sample and once the voltage stabilizes, the power is immediately disconnected. The loess sample begins discharging, with the primary field vanishing instantly while the secondary polarization field gradually decays. We measured the voltage difference at fixed time intervals, respectively, thereby obtaining the field polarization curve.
2.3. Sample Preparation and Testing
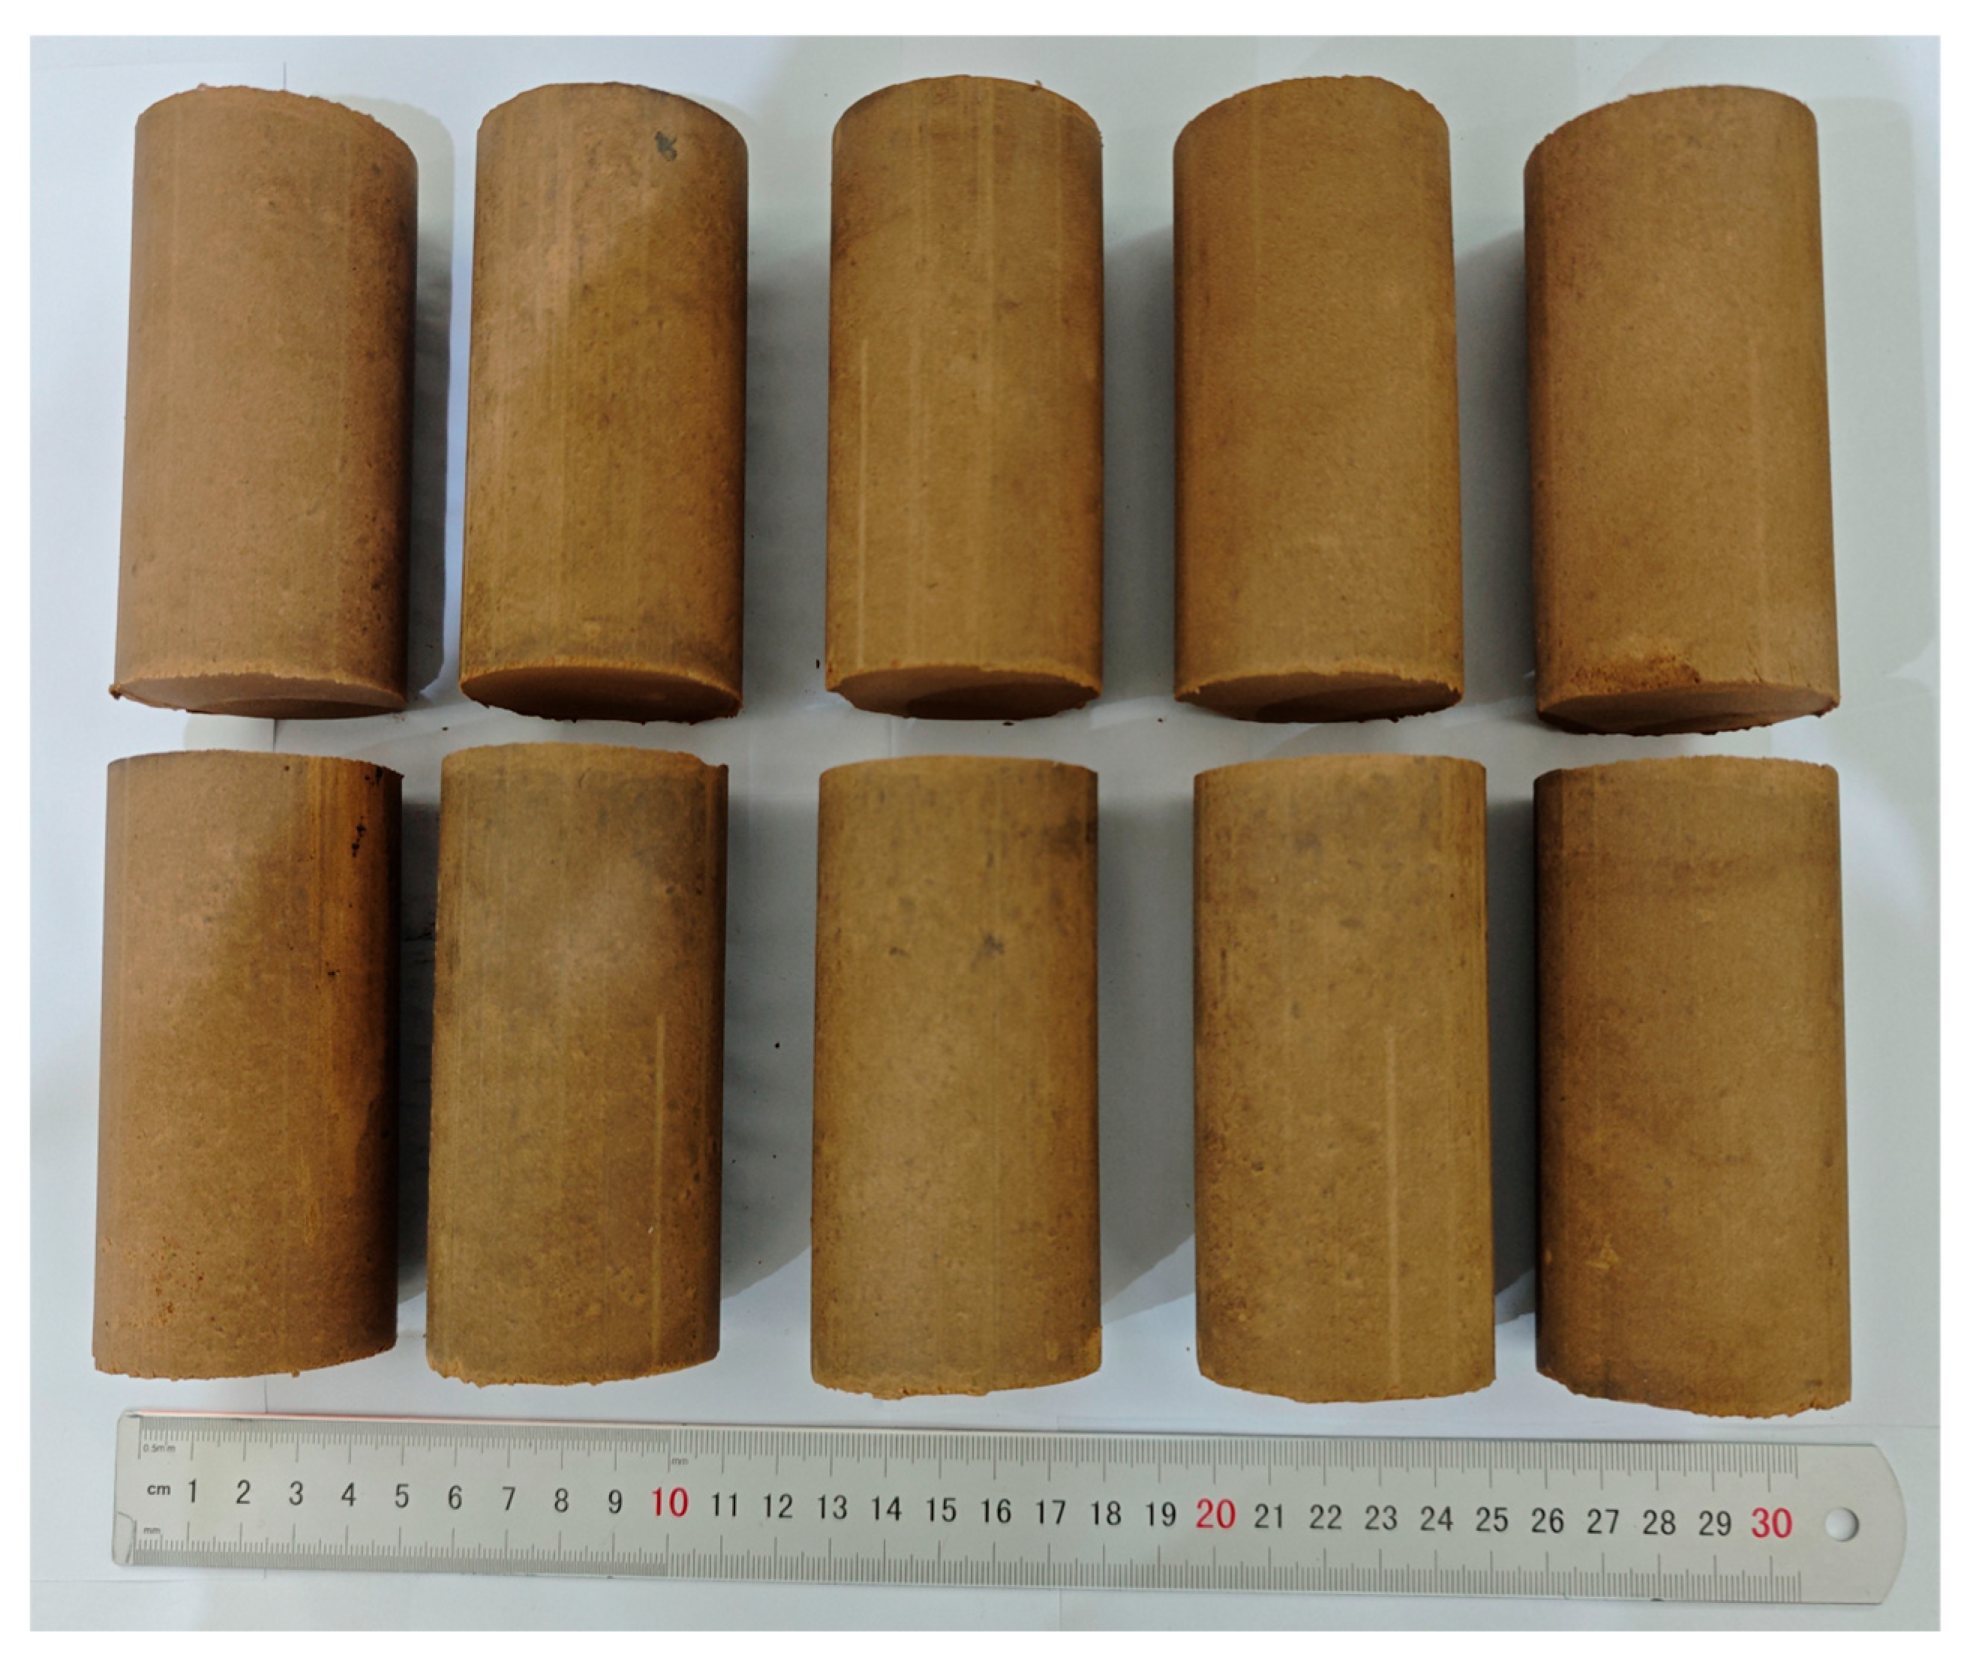
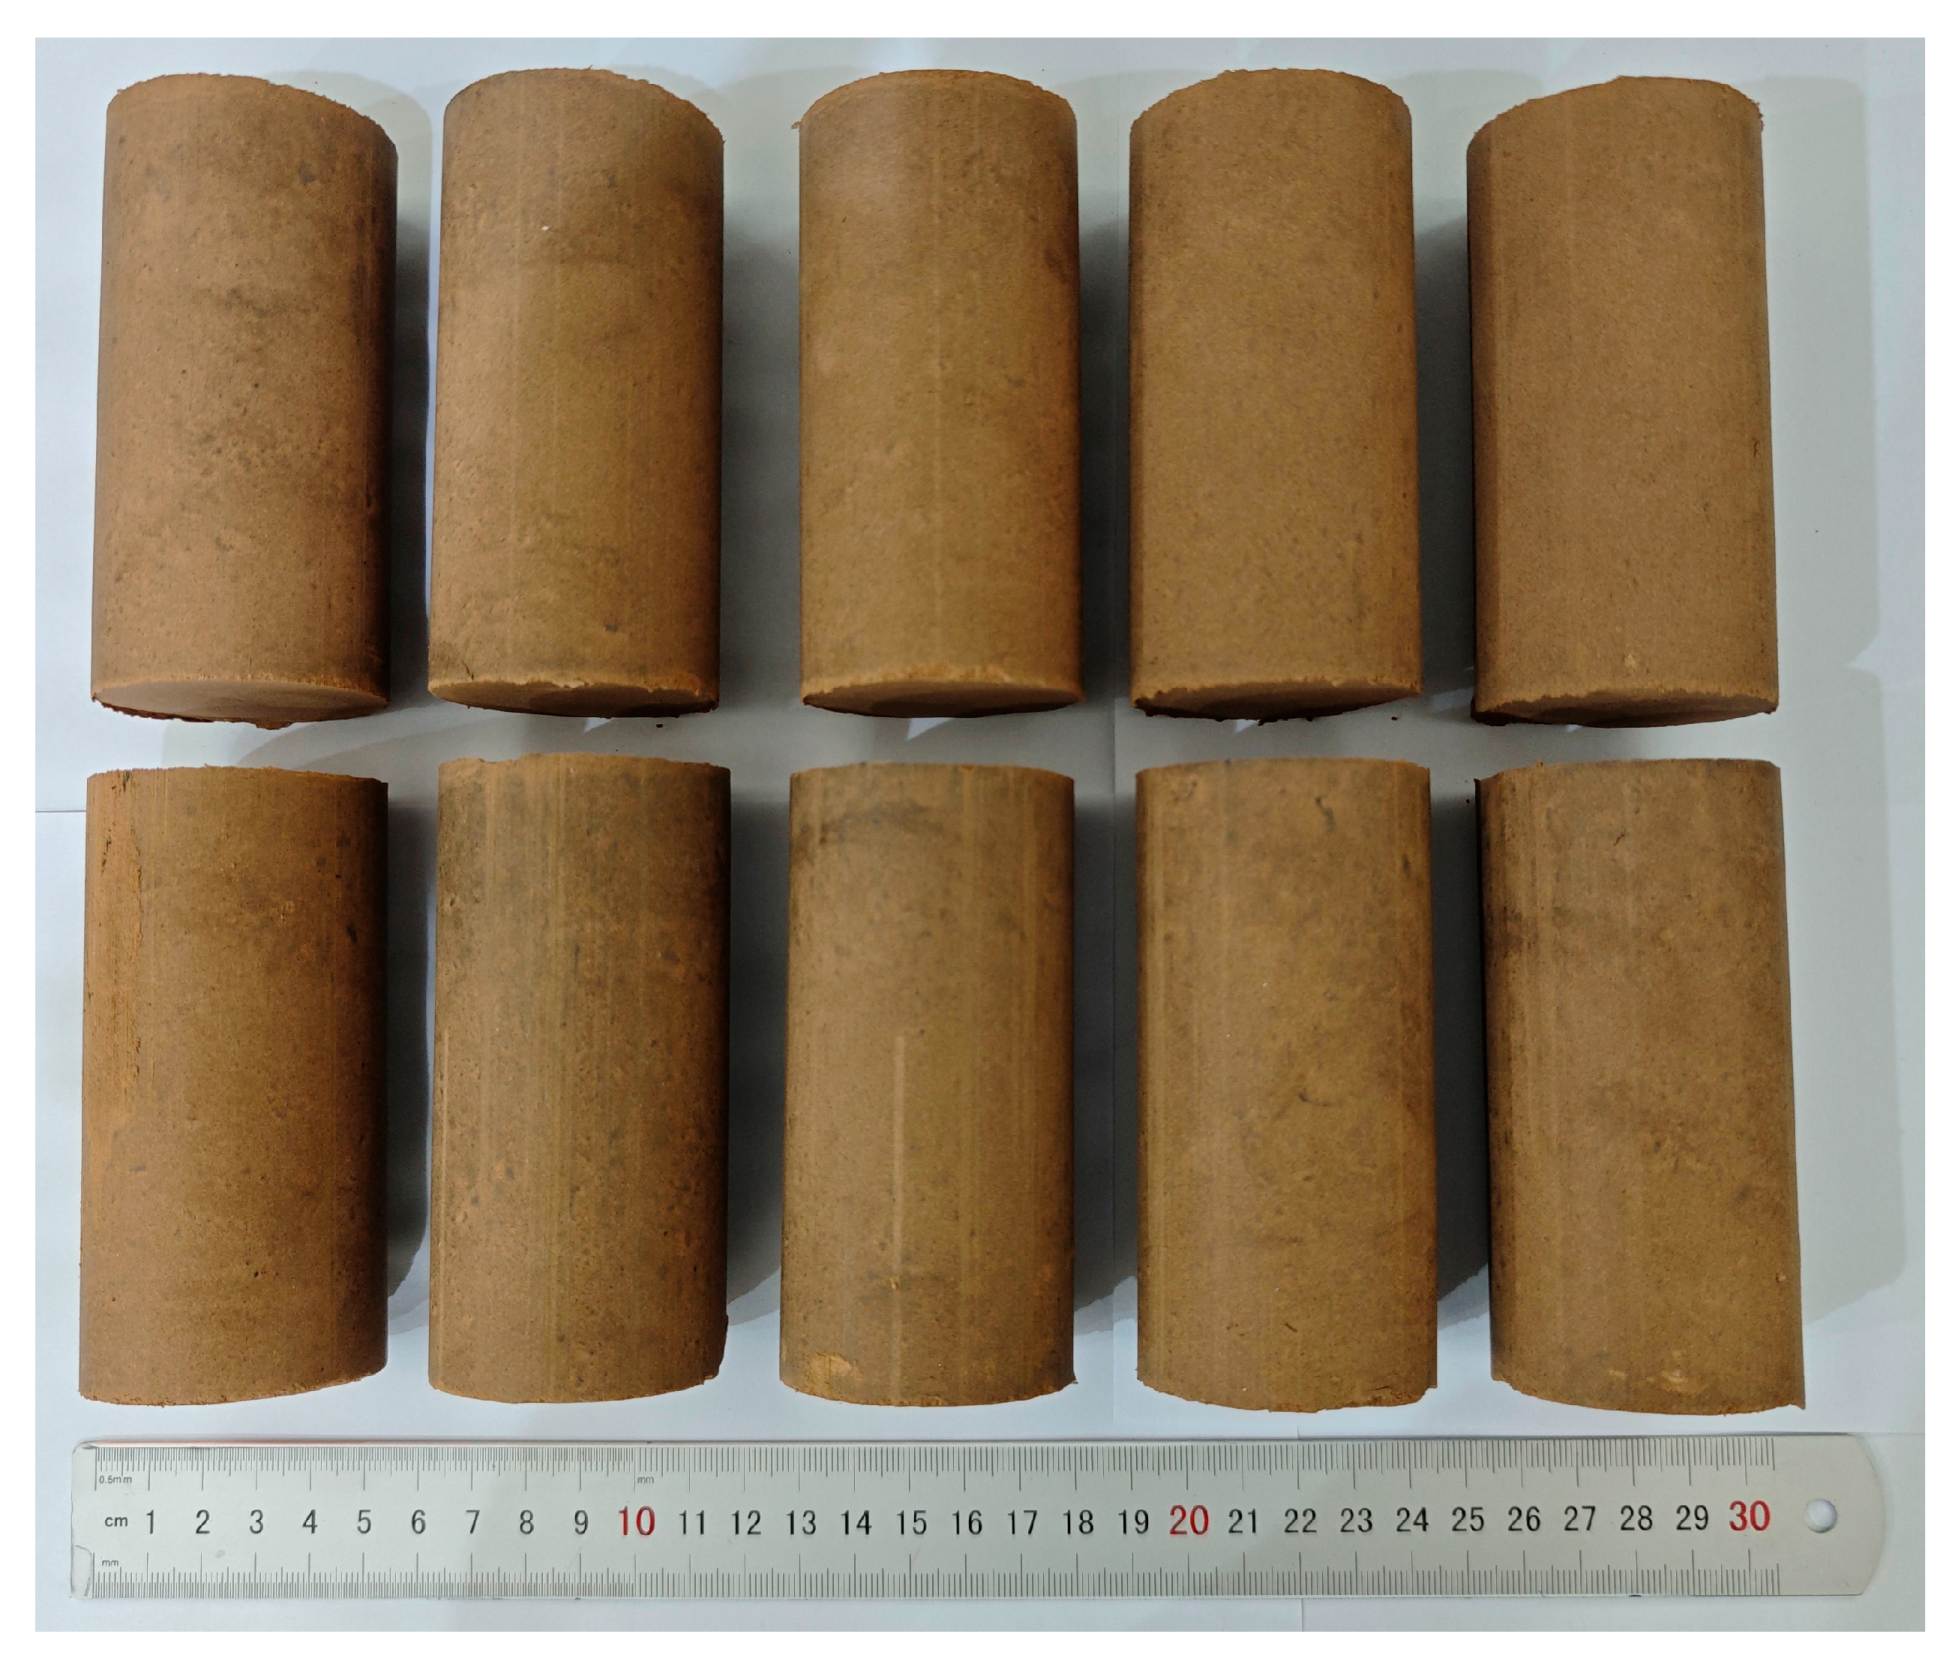
The 81 loess samples were prepared according to the experimental design (
Figure 3). Following the relevant railway engineering geotechnical test procedures (TB/10102-2023) [
31], the loess samples retrieved from the field were naturally dried. The air-dried soil samples were subsequently disaggregated without damaging the natural particles in the process. For the physical tests, a 0.5 mm analytical sieve was employed to sieve the soil samples as specified in the procedures. The sieved soil samples were then placed in a 105 °C constant-temperature oven for 24 h to obtain completely dry soil samples.
In the resistivity test, the dry densities of the samples were set to 1.4, 1.5, 1.6, 1.7, and 1.8 g/cm3, and the water contents were set to 3%, 5%, 8%, 10%, 12%, 15%, 18%, and 21%. A specific amount of oven-dried soil was weighed, and distilled water was added according to the designed water content. Notably, distilled water was evenly sprayed onto the soil using a spray bottle. After thorough mixing, the soil sample was stored in a sealed container and placed in a humidity-controlled chamber for 24 h to ensure a uniform water content distribution.
Prior to resistivity testing, the soil mass needed was weighed and compacted into standard cylindrical samples via a hydraulic sample preparation mold. The specimens exhibited approximate dimensions of 100 mm (length) and 50 mm (diameter). Before each measurement, the actual mass and dimensions of the samples were recorded.
Resistivity testing was conducted immediately after sample preparation. Three replicate samples were prepared for each water content level, and the resistivity of each sample was measured three times, with the average value recorded. After each resistivity test, the sample was divided into two portions for water content measurement following the specified procedures. The final water content was determined on the basis of the measured values.
2.4. Conversion of Various Water Content Types
The water content
fw refers to the percentage of the weight of water
mw in a medium relative to the total weight of the dry medium
mdry. Specifically, the water content can be calculated as follows:
where
m is the mass of the water-bearing medium.
The water saturation
Sw refers to the ratio of the volume of water occupying the pore spaces
Vw within a unit volume of the medium to the total pore volume of the medium (i.e., porosity
Φ).
For a given medium, the porosity
Φ per unit volume can be expressed as:
where
m0 denotes the grain density of the medium. Via the use of Equations (2)–(4), the relationship between the water saturation and water content per unit volume of the medium can be derived as:
The volumetric water content
Vw refers to the percentage of the water volume within a medium relative to the total volume of the medium. Similarly, the relationship between the water content (gravimetric) and volumetric water content can be expressed as:
where
ρdry is the dry density of the loess sample, and
ρw is the density of water.
We conducted a series of experiments in a laboratory environment. These experiments were designed to provide key water content–formation resistivity relationship curves for constraining and calibrating the field inversion models, as well as to validate their applicability under the specific geological conditions of this study.
4. Discussion
4.1. Effective Medium Theory
Theoretically predicting the effective resistivity (
ρ) of multiphase mixtures typically requires the following: (1) volume fractions of the constituent phases; (2) dielectric constants of the constituent phases; and (3) geometric details of the phase arrangement. As geometric details of the phase arrangement are often difficult to obtain precisely, if only the volume fractions and resistivities of the constituent phases are provided, the optimal scenario involves predicting results bounded within upper and lower limits. The narrowest possible resistivity range derived without specifying the geometric configuration of the components is referred to as the Hashin‒Shtrikman (HS) bounds [
32]. For two-phase composites, the HS bounds for resistivity can be obtained by Equation (9):
where
ρ1 and
ρ2 denote the resistivities of the constituent phases, and
f1 and
f2 denote their volume fractions.
The upper and lower bounds can be calculated by categorizing the components into types 1 and 2, where component 1 at the upper bound corresponds to the phase with a higher resistivity, and component 2 corresponds to the phase with a lower resistivity. At the lower bound, the assignments of components 1 and 2 are reversed compared with those at the upper bound.
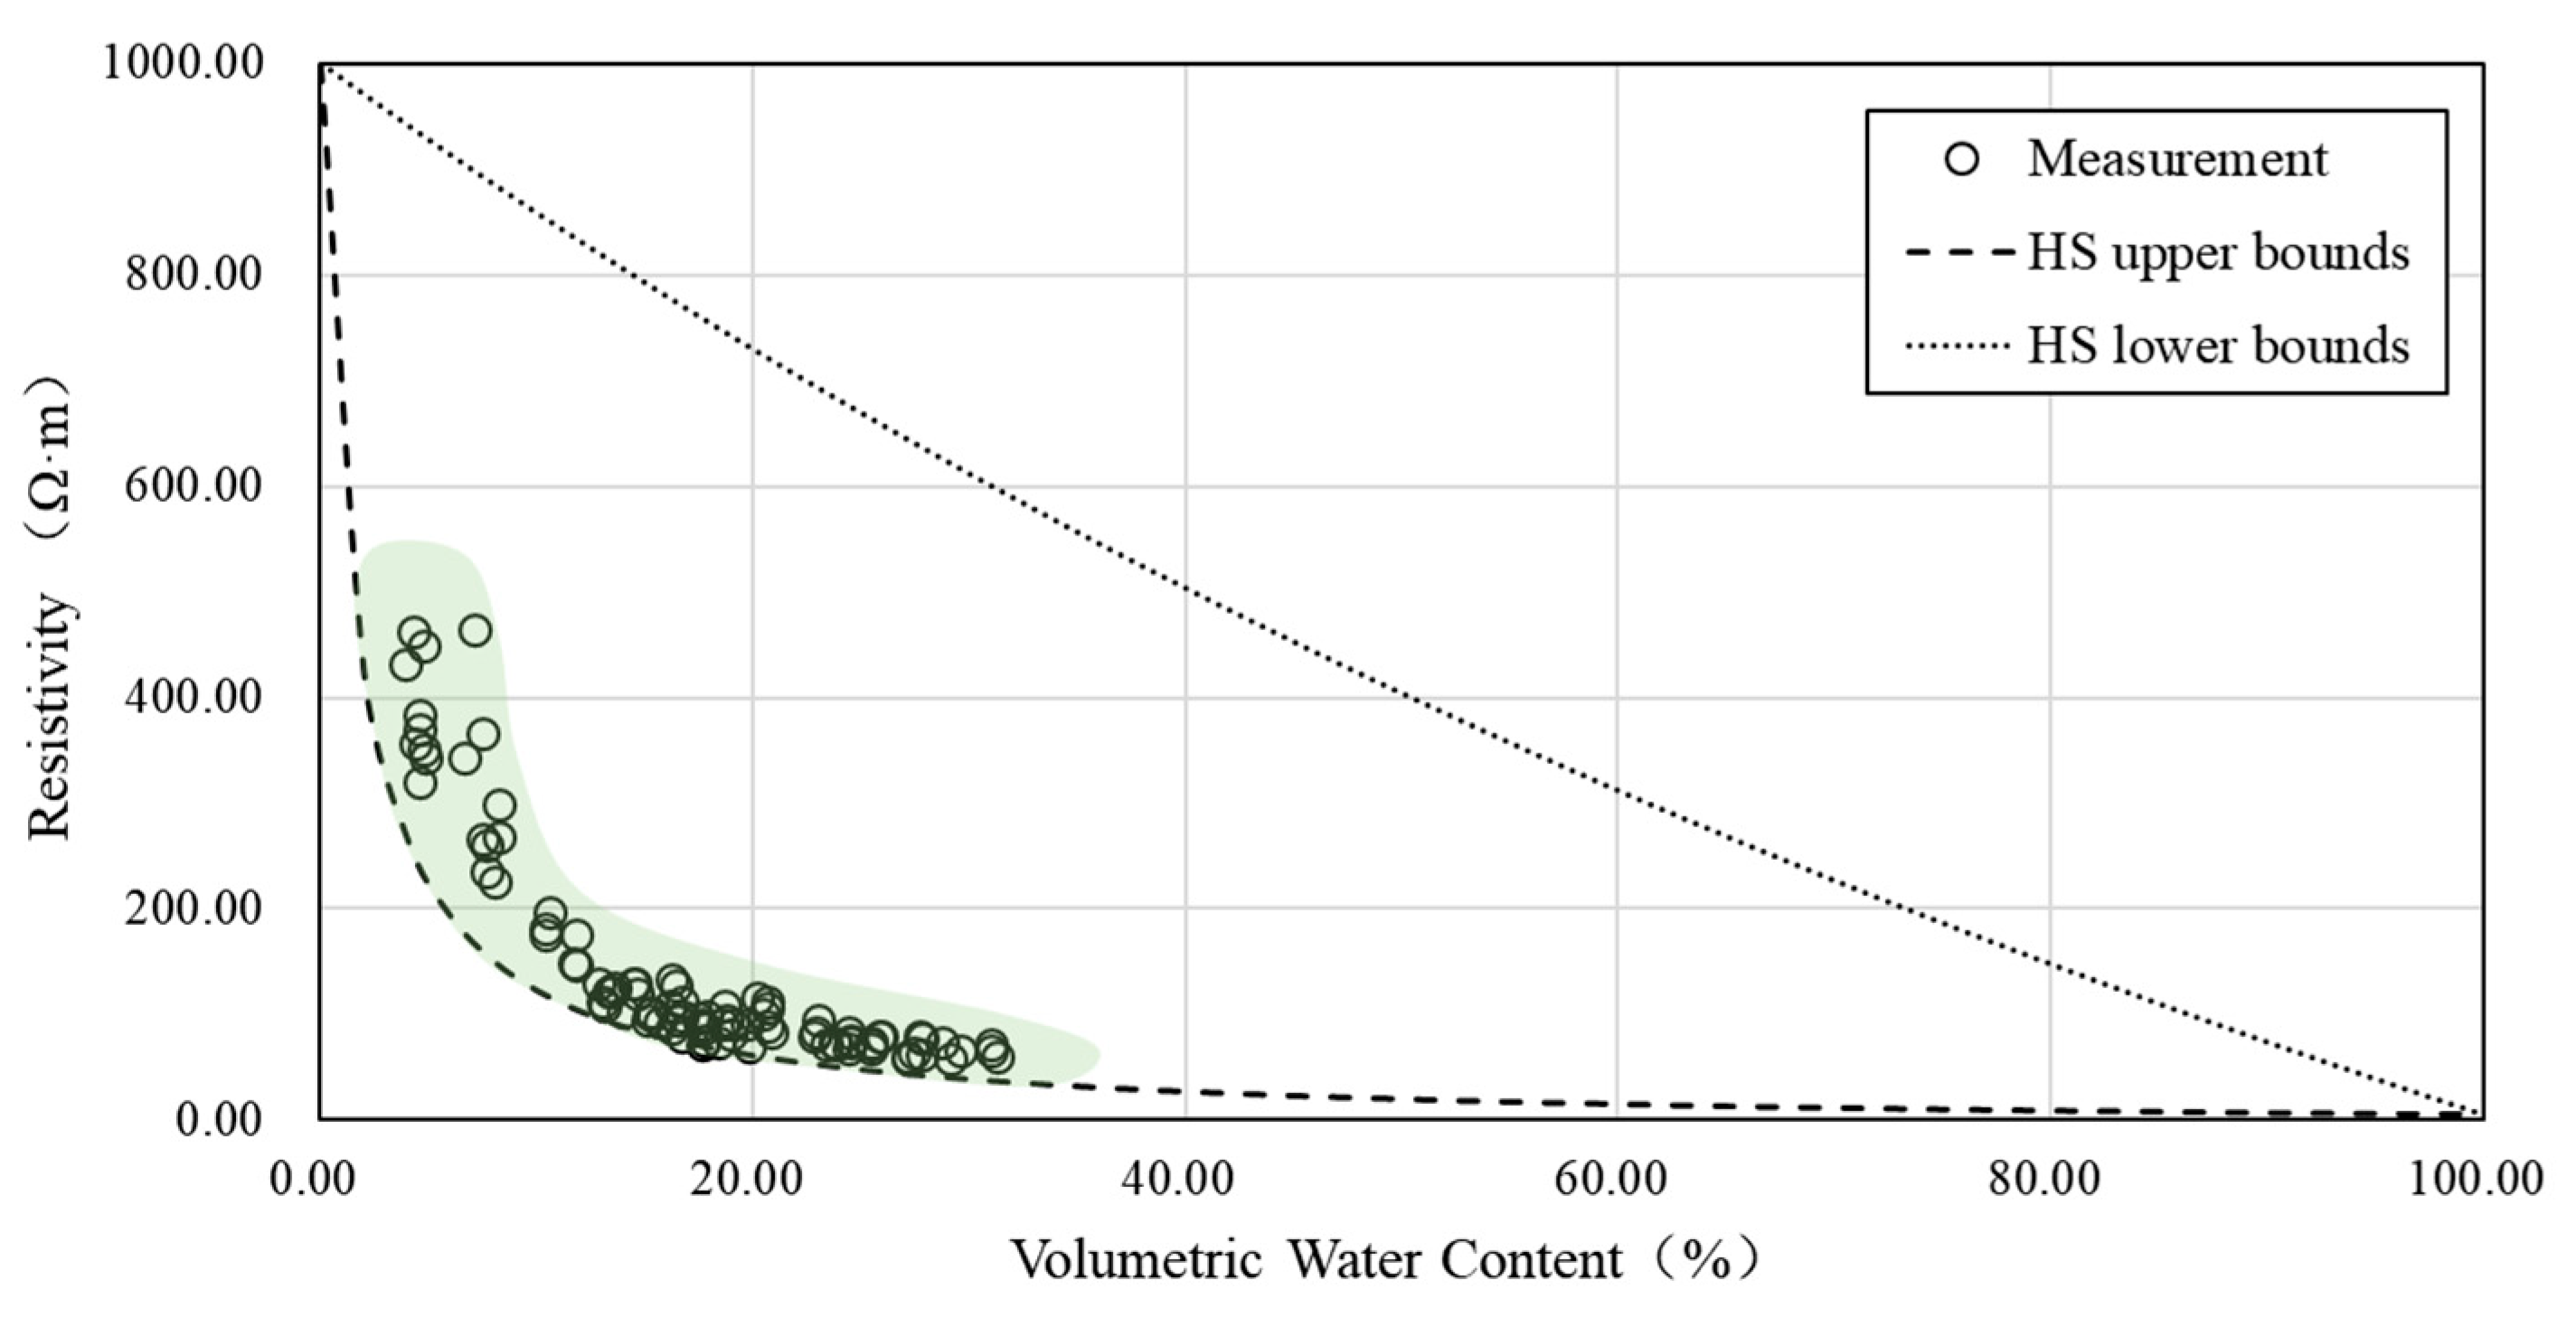
As indicated by the measured resistivity distribution characteristics shown in
Figure 8, the loess resistivity conforms to the HS bounds. The measured resistivity values exhibit distinct spatial clustering within the HS theoretical boundary model: nearly all the experimental sample points occur within a narrow interval near the HS lower bound. As the soil compaction degree and water content increase, the data points exhibit a gradient convergence trend along the HS lower bound. This phenomenon occurs because the increased volume fraction of the low-resistivity phases in loess (e.g., bound water films on clay mineral surfaces, free water in the pores, and dissolved salt ions) yields a three-dimensional percolation network through the adsorbed water bridges between particles. This shifts the dominant current transmission path from a tunneling mode governed by high-resistivity mineral frameworks (e.g., quartz and feldspar) to a low-resistivity continuous conduction mode dominated by ion migration.
In this state, cations such as Na+ and Ca2+ adsorbed onto the interlayers of clay minerals create directional migration channels within the diffuse double layer, whereas anions such as Cl− and CO32− in the free water within the pores contribute to secondary conductive pathways through bulk diffusion. The synergistic effect drives the system resistivity closer to the fully connected conductive-phase state corresponding to the HS lower bound. In contrast, high-resistivity phases (e.g., quartz and feldspar), which serve as insulating barriers dispersed within the conductive network, occupy a relatively large volume fraction but fail to significantly increase the overall resistivity. Therefore, in practical engineering applications, the HS lower bound can be adopted as the baseline for resistivity prediction to inversely deduce critical parameters such as the water content and salinity level in loess.
4.2. Archie’s Formula
In Archie’s formula for saturation, the DC resistivity of partially saturated loess is related to the
Sw and porosity (
Φ) through Equation (10).
where
Rw is the resistivity of the pore fluid,
Rt is the resistivity of the partially water-saturated loess,
m is the cementation exponent of loess, and
n is the saturation exponent of the pore fluid.
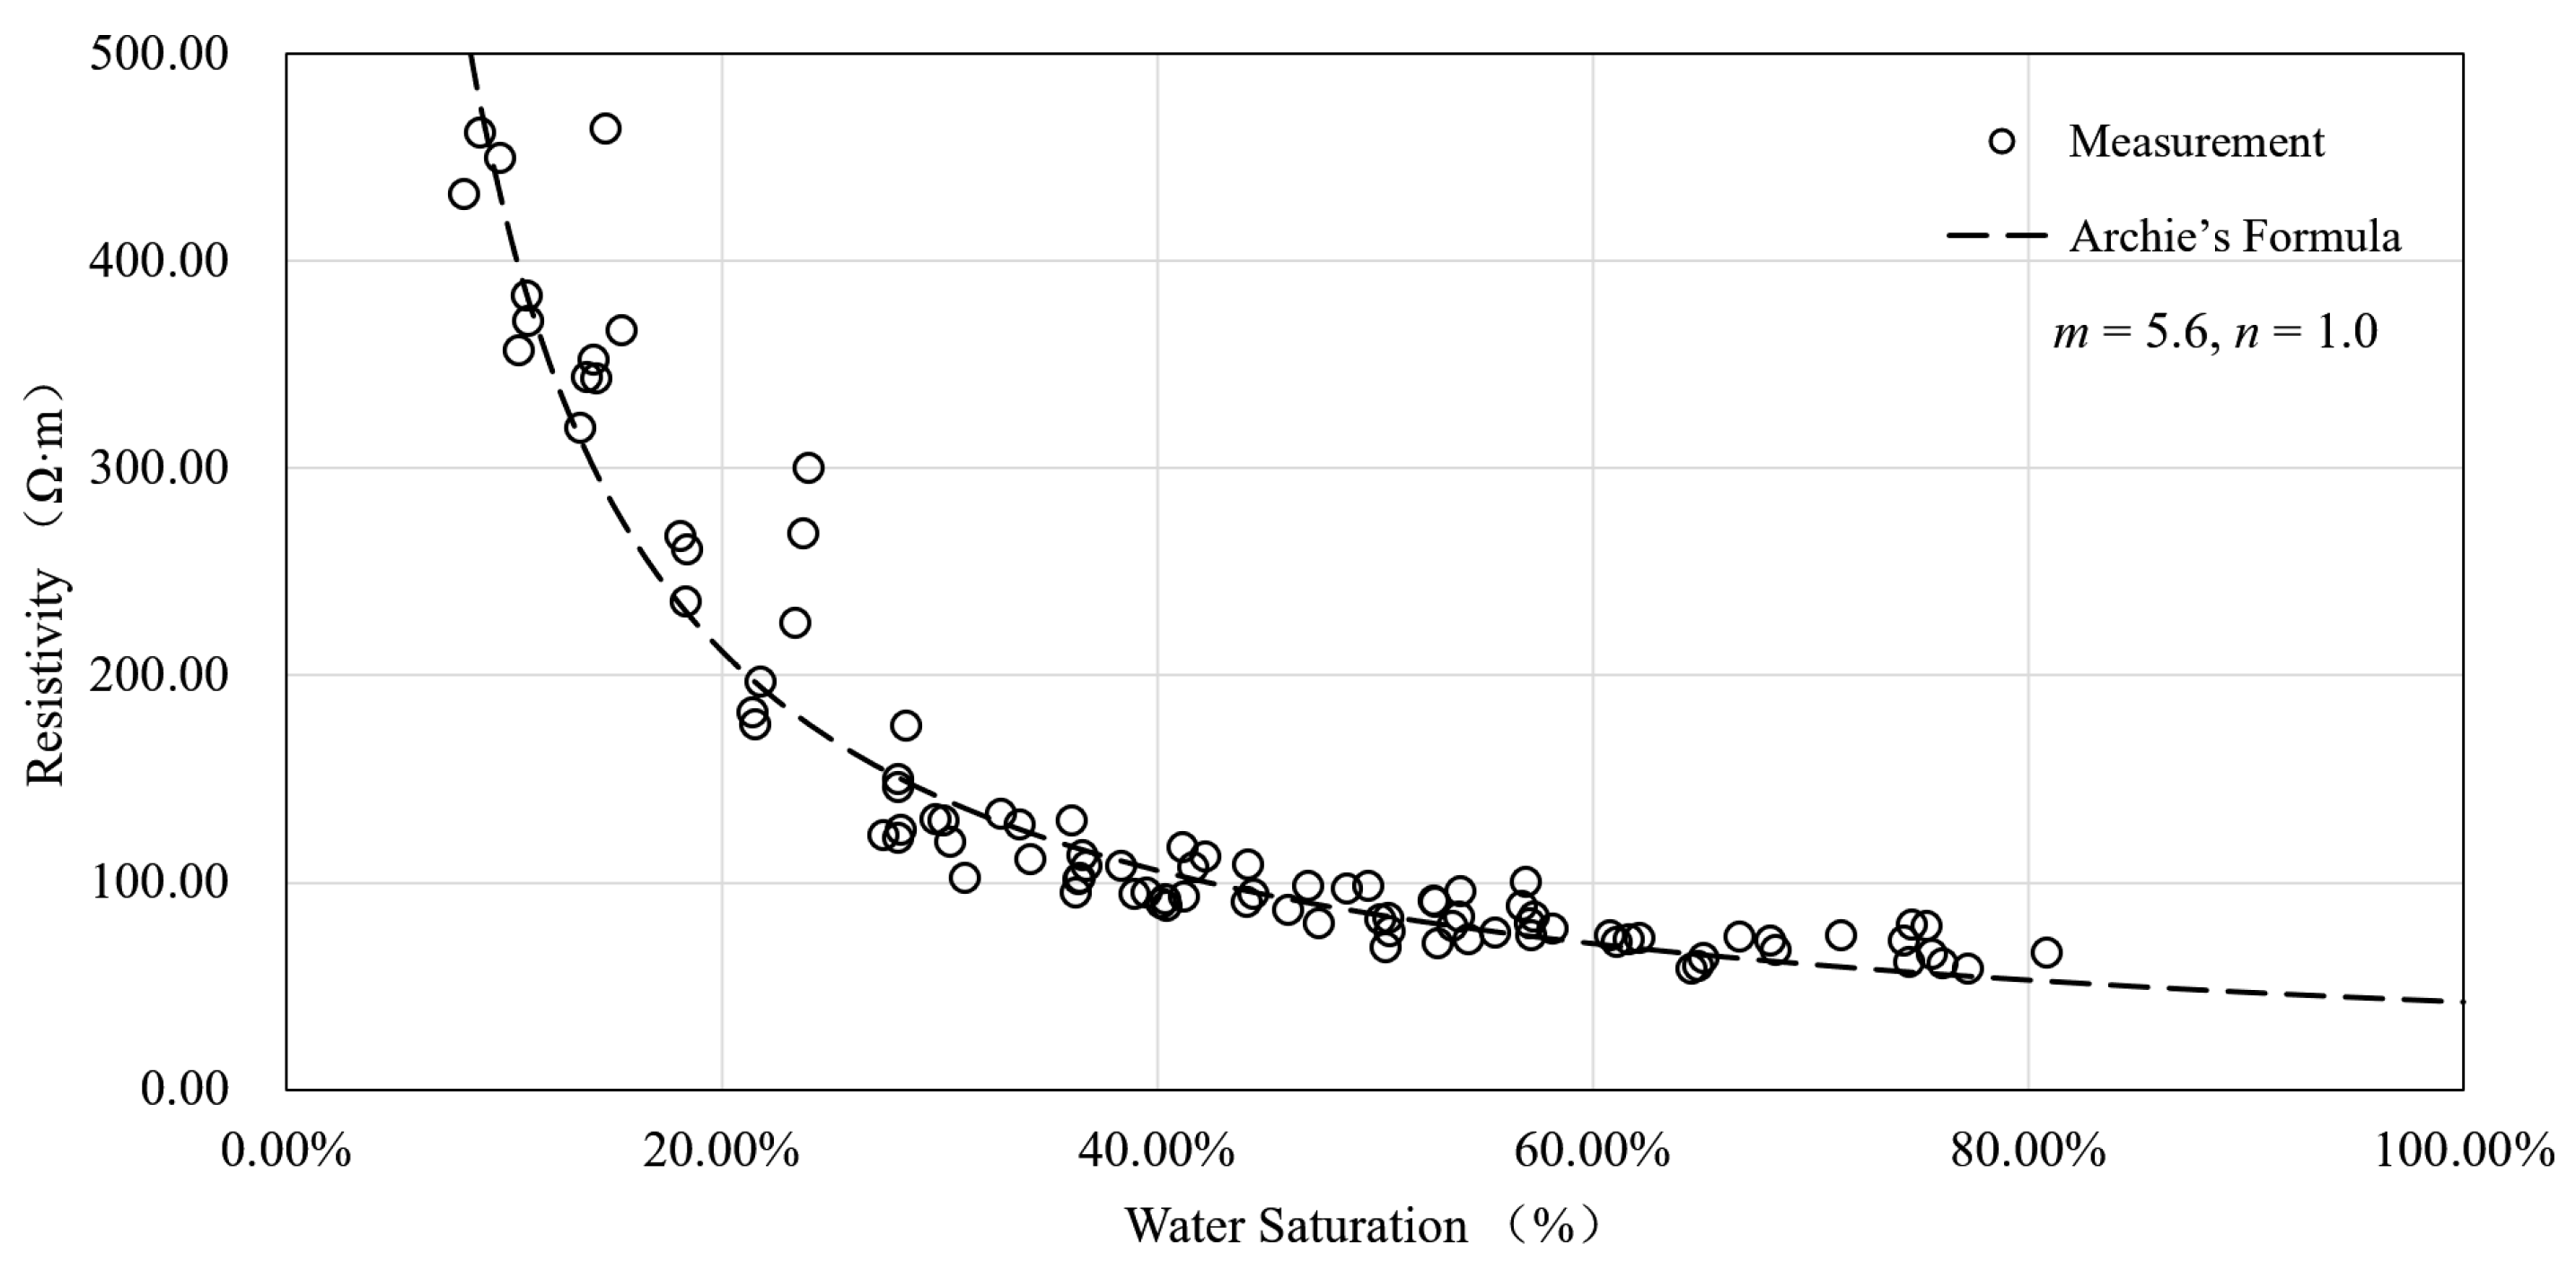
As shown in
Figure 9, nonlinear least squares fitting (
R2 = 0.91) of the loess resistivity–water saturation data for the study area revealed region-specific characteristics of the structural parameters in the modified Archie’s formula.
The cementation exponent m of loess is correlated with the tortuosity of the pore structure. The m value of 5.6 in this area is significantly greater than that of typical clastic rocks (1.8–2.5), which can be attributed primarily to the multiscale pore structure of the local loess. The flaky microstructure formed by clay minerals (e.g., kaolinite and illite) dramatically increases the tortuosity of conductive pathways, thus extending ion migration paths.
The saturation exponent n of the pore fluid is 1.0, which is lower than that of typical water-saturated sandstone (1.8–2.2), indicating a heterogeneous pore water distribution in loess. Pore water primarily exists in the adsorbed and free states within the pore structure [
33], with 1.9–3.9% being adsorbed/bound water on clay mineral surfaces [
34]. This heterogeneity results from the anisotropy of the pore structure.
The parameter combination (m = 5.6, n = 1.0) provides a calibration basis for electrical prospecting in this loess region. However, when extrapolating this model for water content inversion, special attention must be paid to the local variability in clay mineral types and pore cementation degrees.
4.3. Induced Polarization Effect in Loess
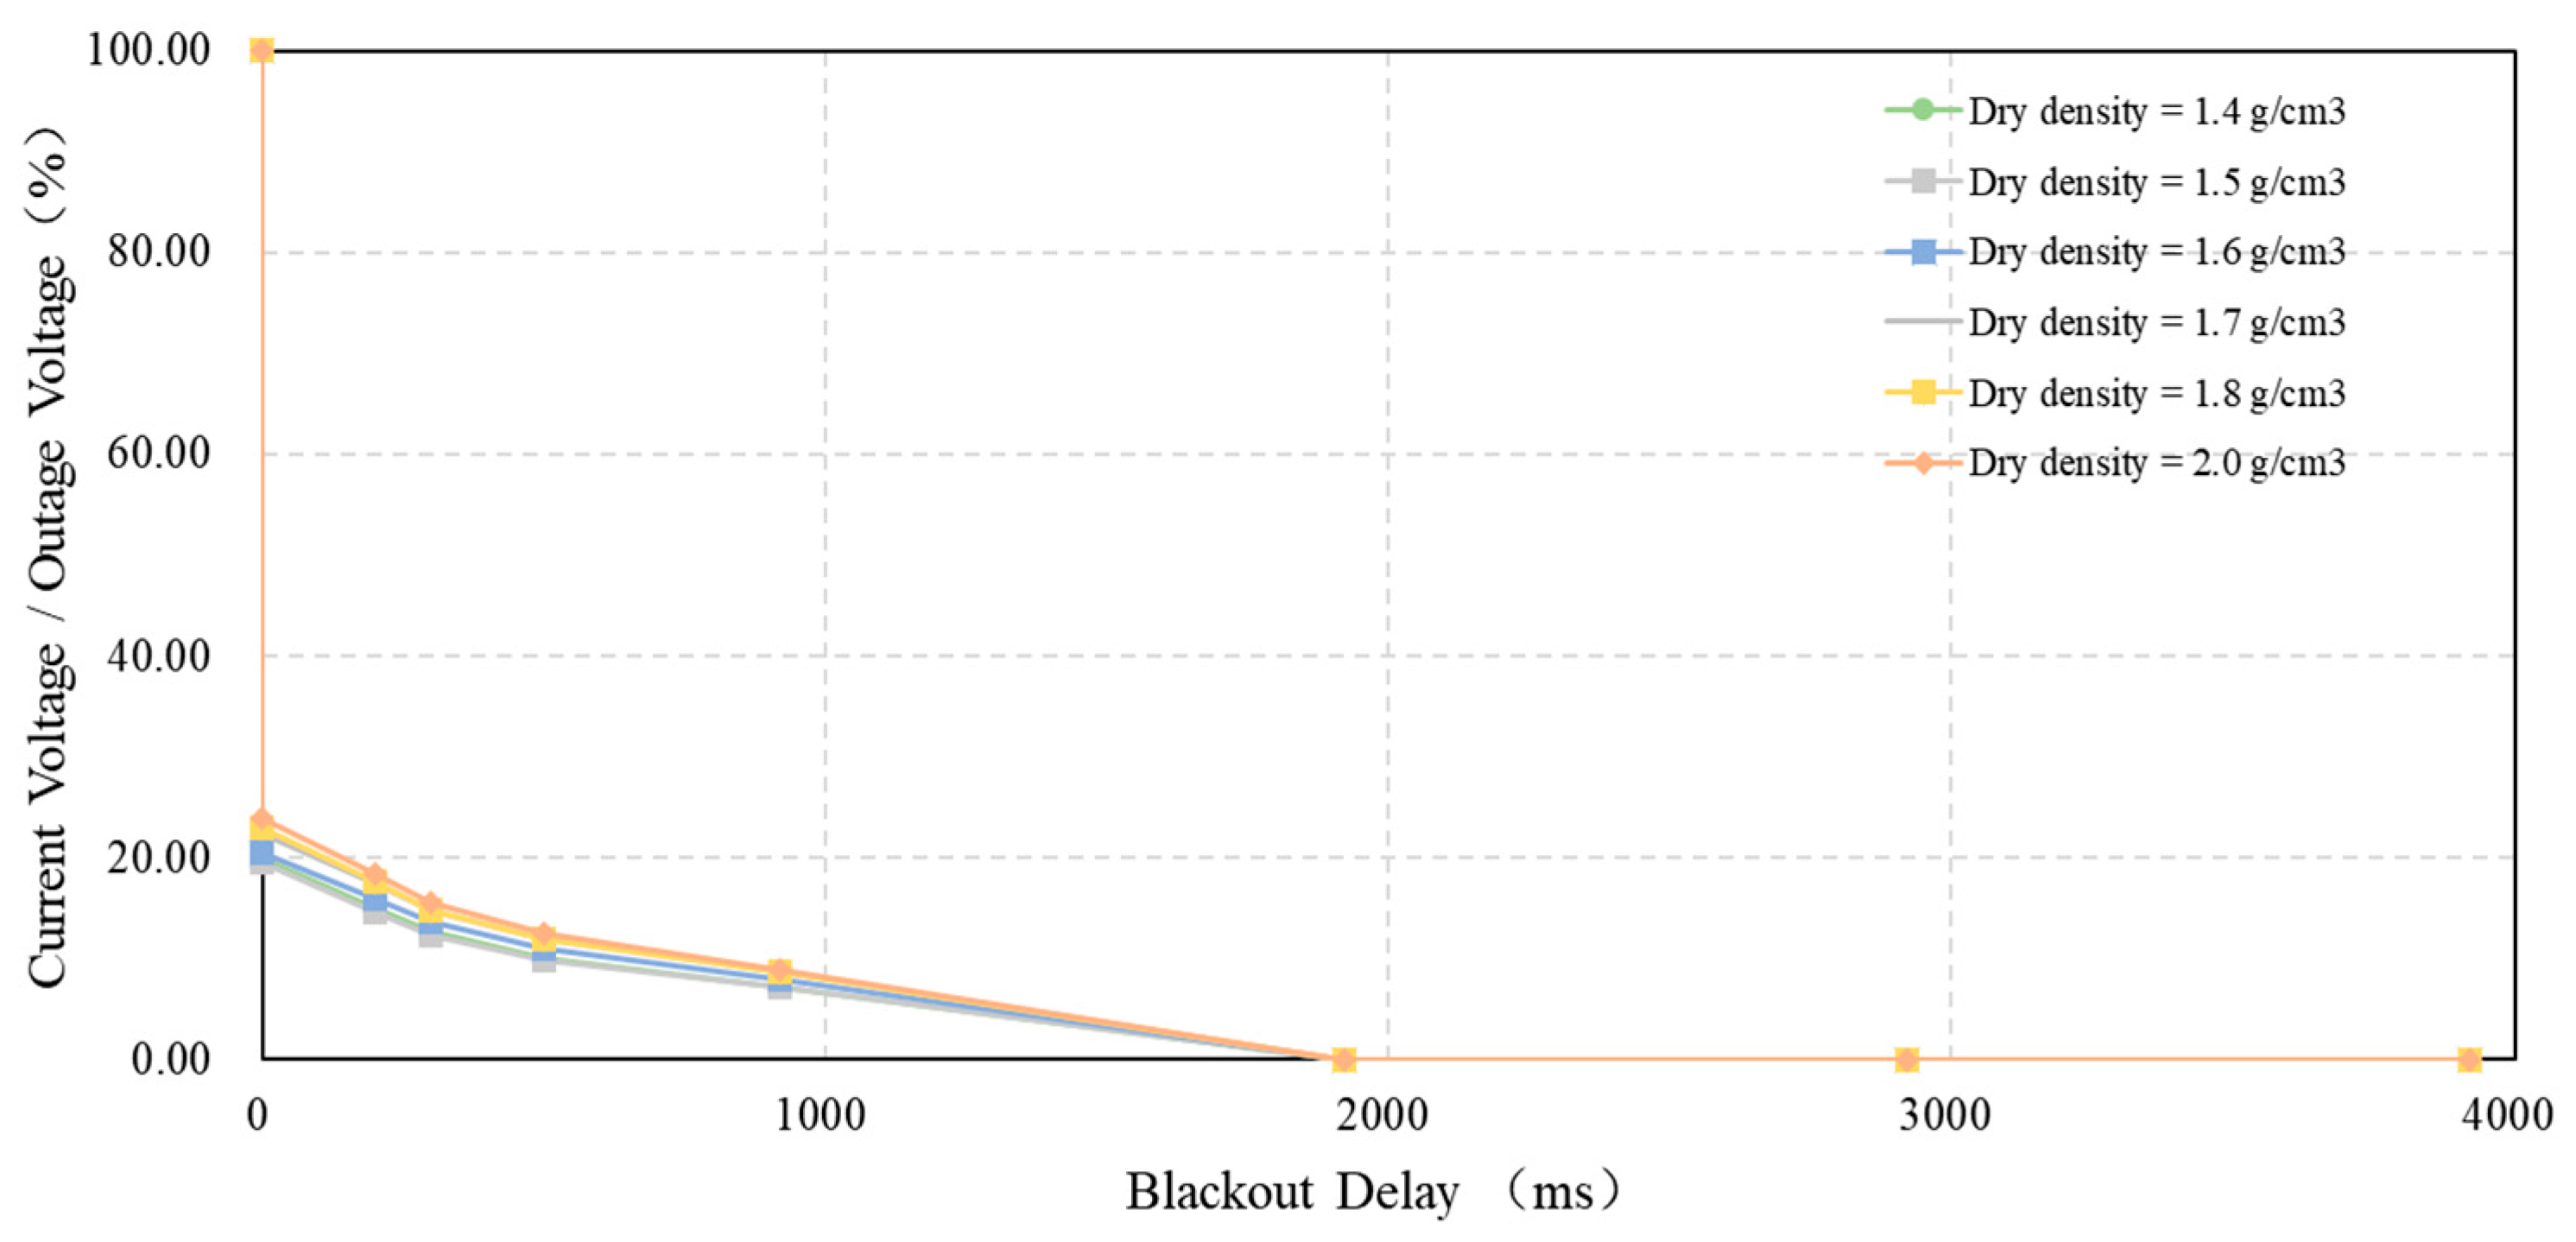
The induced polarization phenomenon of loess exhibits significant time-varying characteristics and physical property dependencies. Under sustained power supply conditions, the internal polarization effect in soil evolves with the energization time. During loess polarization experiments, an induced polarization field is rapidly established at the initial stage, accompanied by a swift increase in the additional electric field intensity. The growth rate subsequently stabilizes, resulting in the formation of a stable electric field. At the moment of power interruption, the primary field potential difference almost instantaneously disappears, whereas the induced polarization field enters a nonlinear decay phase. The decay rate progressively decreases over time until the potential difference reaches 0 mV (
Figure 10 and
Figure 11). As shown in
Figure 11, the secondary field potential difference decreases dramatically from 25% to 5% (an 80% reduction) within 1000 ms after power cutoff. When the water content increases from 5% to 15%, the instantaneous secondary field voltage after power interruption reveals a corresponding 20% enhancement.
Figure 10 shows that as the dry density of loess increases from 1.40 to 2.00 g/cm
3, the instantaneous secondary field voltage after power interruption increases by approximately 25%.
4.4. Practical Applications
The loess in the study area is relatively uniform; therefore, ERT was employed to detect the distribution of the loess water content. The Wenner array (survey lines 4 and 6 employed a three-level array) configuration was selected for cross-sectional imaging measurements, and the electrode spacing was 2 m. In the Wenner array, four electrodes are arranged in a rectangular pattern at specific intervals. The current is injected through the outer pair of electrodes, while the voltage is measured between the inner pair. This configuration offers advantages, including the simple setup and measurement procedures, suitability for moderate depths of investigation, and accurate resistivity measurements in homogeneous media.
Based on the resistivity profiles (
Figure 12) and the volumetric water content profiles derived using our novel conversion Equation (8) (
Figure 13), the subsurface strata within the investigation area are delineated into three distinct geoelectrical domains.
Surface layer (0–10 m depth): This layer exhibits significant heterogeneity in both electrical properties and moisture distribution. Primarily composed of cultivated soil (typically 2–3 m thick), it shows predominant resistivities of 100–200 Ω·m. Crucially, localized zones with resistivities below 100 Ω·m correlate with elevated volumetric water contents (>12%), indicating preferential saturation. A notable overburden (1–2 m thick between 20 and 70 m along the transect) displays higher resistivities (>200 Ω·m) and low water content (<5%), signifying drier conditions. Most significantly, our Equation (8) identifies a distinct low-resistivity structure (40–70 m position, ~10–15 m thick) with resistivities of 100–200 Ω·m and water content of 5–8%. This structure is interpreted as a zone of enhanced subsurface infiltration capacity—a key hydrological insight uniquely quantified by our model.
Intermediate layer (10–20 m depth): Characterized by uniformly high resistivities exceeding 200 Ω·m, this deeper domain exhibits consistently low volumetric water contents (<5%), as confirmed by Equation (8). This establishes it as an extensive desiccated layer. The quantitative validation of this moisture deficit zone underscores the robustness of our conversion methodology in identifying critical hydrogeological barriers.
Deep layer (≥20 m depth): This layer displays increasing complexity with depth, marked by gradually decreasing resistivity (100–200 Ω·m) and significant vertical undulations in resistivity contours. Equation (8) uniquely quantifies that these patterns reflect substantial spatial variability in the water content distribution. This heterogeneity indicates strong influences from geological boundaries and structural controls on deep groundwater conditions. Notably, the water content progressively increases with the depth, signifying a transition toward saturated conditions in the deeper strata.
The integrated analysis (
Figure 14) reveals a critical vertical hydrological trend: the water content decreases from the surface through the desiccated intermediate layer before increasing again in deeper strata.
Borehole data support these findings (
Figure 15). Borehole TJ-01 shows a surface layer (0–2 m) water content of ~10%, a lower water content in the intermediate loess layer (2–13 m; ~5%), and a higher water content in the deeper loess layer (13–26 m; ~8%). This distribution generally conforms with the ERT-derived volumetric water content profile. Borehole TJ-02 indicates a relatively uniform average loess water content of ~9% with minimal vertical variation, also consistent with the ERT-derived pattern. This unequivocally validates both the domain classification and the quantitative hydrological insights: (1) the surface layer exhibits laterally variable moisture influenced by surface processes, (2) the intermediate layer maintains regionally persistent low water content (<5%), and (3) the deep layer exhibits depth-progressive saturation with structural heterogeneity.
As indicated in
Table 2, comparative analysis of the two boreholes demonstrates the high accuracy of ERT in estimating the loess water content at depths shallower than 20 m. The average prediction errors were 8.79% for borehole TJ-01 and 9.13% for borehole TJ-02. This precision results from the regional loess exhibiting relatively homogeneous physical properties, where the water content serves as the primary factor controlling resistivity variations.
At depths exceeding 20 m, the accuracy of the ERT-derived water content decreases substantially, with the prediction errors averaging 34.52% for borehole TJ-01 and 17.02% for TJ-02. This discrepancy is primarily attributed to two interrelated factors: (1) progressive loss of ERT resolution with depth due to reduced current density and signal-to-noise ratios; and (2) significant density increases in deep loess layers due to gravitational compaction by overlying strata.
4.5. Methodological Implications and Limitations
This study significantly advances understanding of loess’s hydro-electrical properties by systematically exploring how induced polarization (IP), dry density, and water content interact. Our experiments confirm that density becomes a dominant resistivity control factor at greater depths, progressively overriding water content influences. Critically, ERT’s inherent resolution degradation compounds this issue: as the electrode spacing increases for deeper investigation, the method’s ability to resolve fine-scale moisture variations diminishes. This resolution loss explains the growing misfit between ERT-derived and borehole-measured water content at depth. The IP response intensifies with both the water content and dry density, highlighting its potential to supplement ERT in detecting compaction and water-bearing anomalies in loess.
Our findings advance previous ERT applications in loess hydrology through two key innovations. First, our domain-specific conversion model (Equation (8)) demonstrates significantly improved accuracy in near-surface moisture quantification compared to conventional Archie-based transformations [
35], particularly in detecting the critical infiltration-enriched zone. Second, the identification of a regionally extensive desiccated intermediate layer (10–20 m depth) with <5% water content provides new evidence supporting drying in thick loess sequences. Dry loess layers have been observed in recent decades in regions such as the Chinese Loess Plateau, Russia, eastern Amazonia, and southern Australia [
36]. However, our approach shares the limitations noted in deep ERT investigations. While our explicit incorporation of gravitational compaction effects represents progress, the resolution limitations inherent to standard Wenner arrays still constrain quantitative moisture mapping in deep layers [
37]. Subsequent work should integrate frequency-domain ERT to mitigate depth attenuation artifacts while maintaining our domain-partitioned conversion framework.
Future modeling efforts should incorporate both density gradients and temperature effects while accounting for ERT’s depth-dependent resolution constraints to improve the accuracy of deep-layer water content detection. To address uncertainties in moisture–density relationships, integrated IP-ERT joint surveys show particular promise as they can help resolve ambiguities in these critical parameter contrasts.
5. Conclusions
To address the challenge of quantitatively monitoring the water distribution in loess regions, a quantitative resistivity‒water content conversion model for unsaturated loess was established, and an engineering verification framework was constructed through laboratory experiments, model optimization calibration, and field borehole validation, thereby achieving precise mapping from electrical parameters to hydrological parameters.
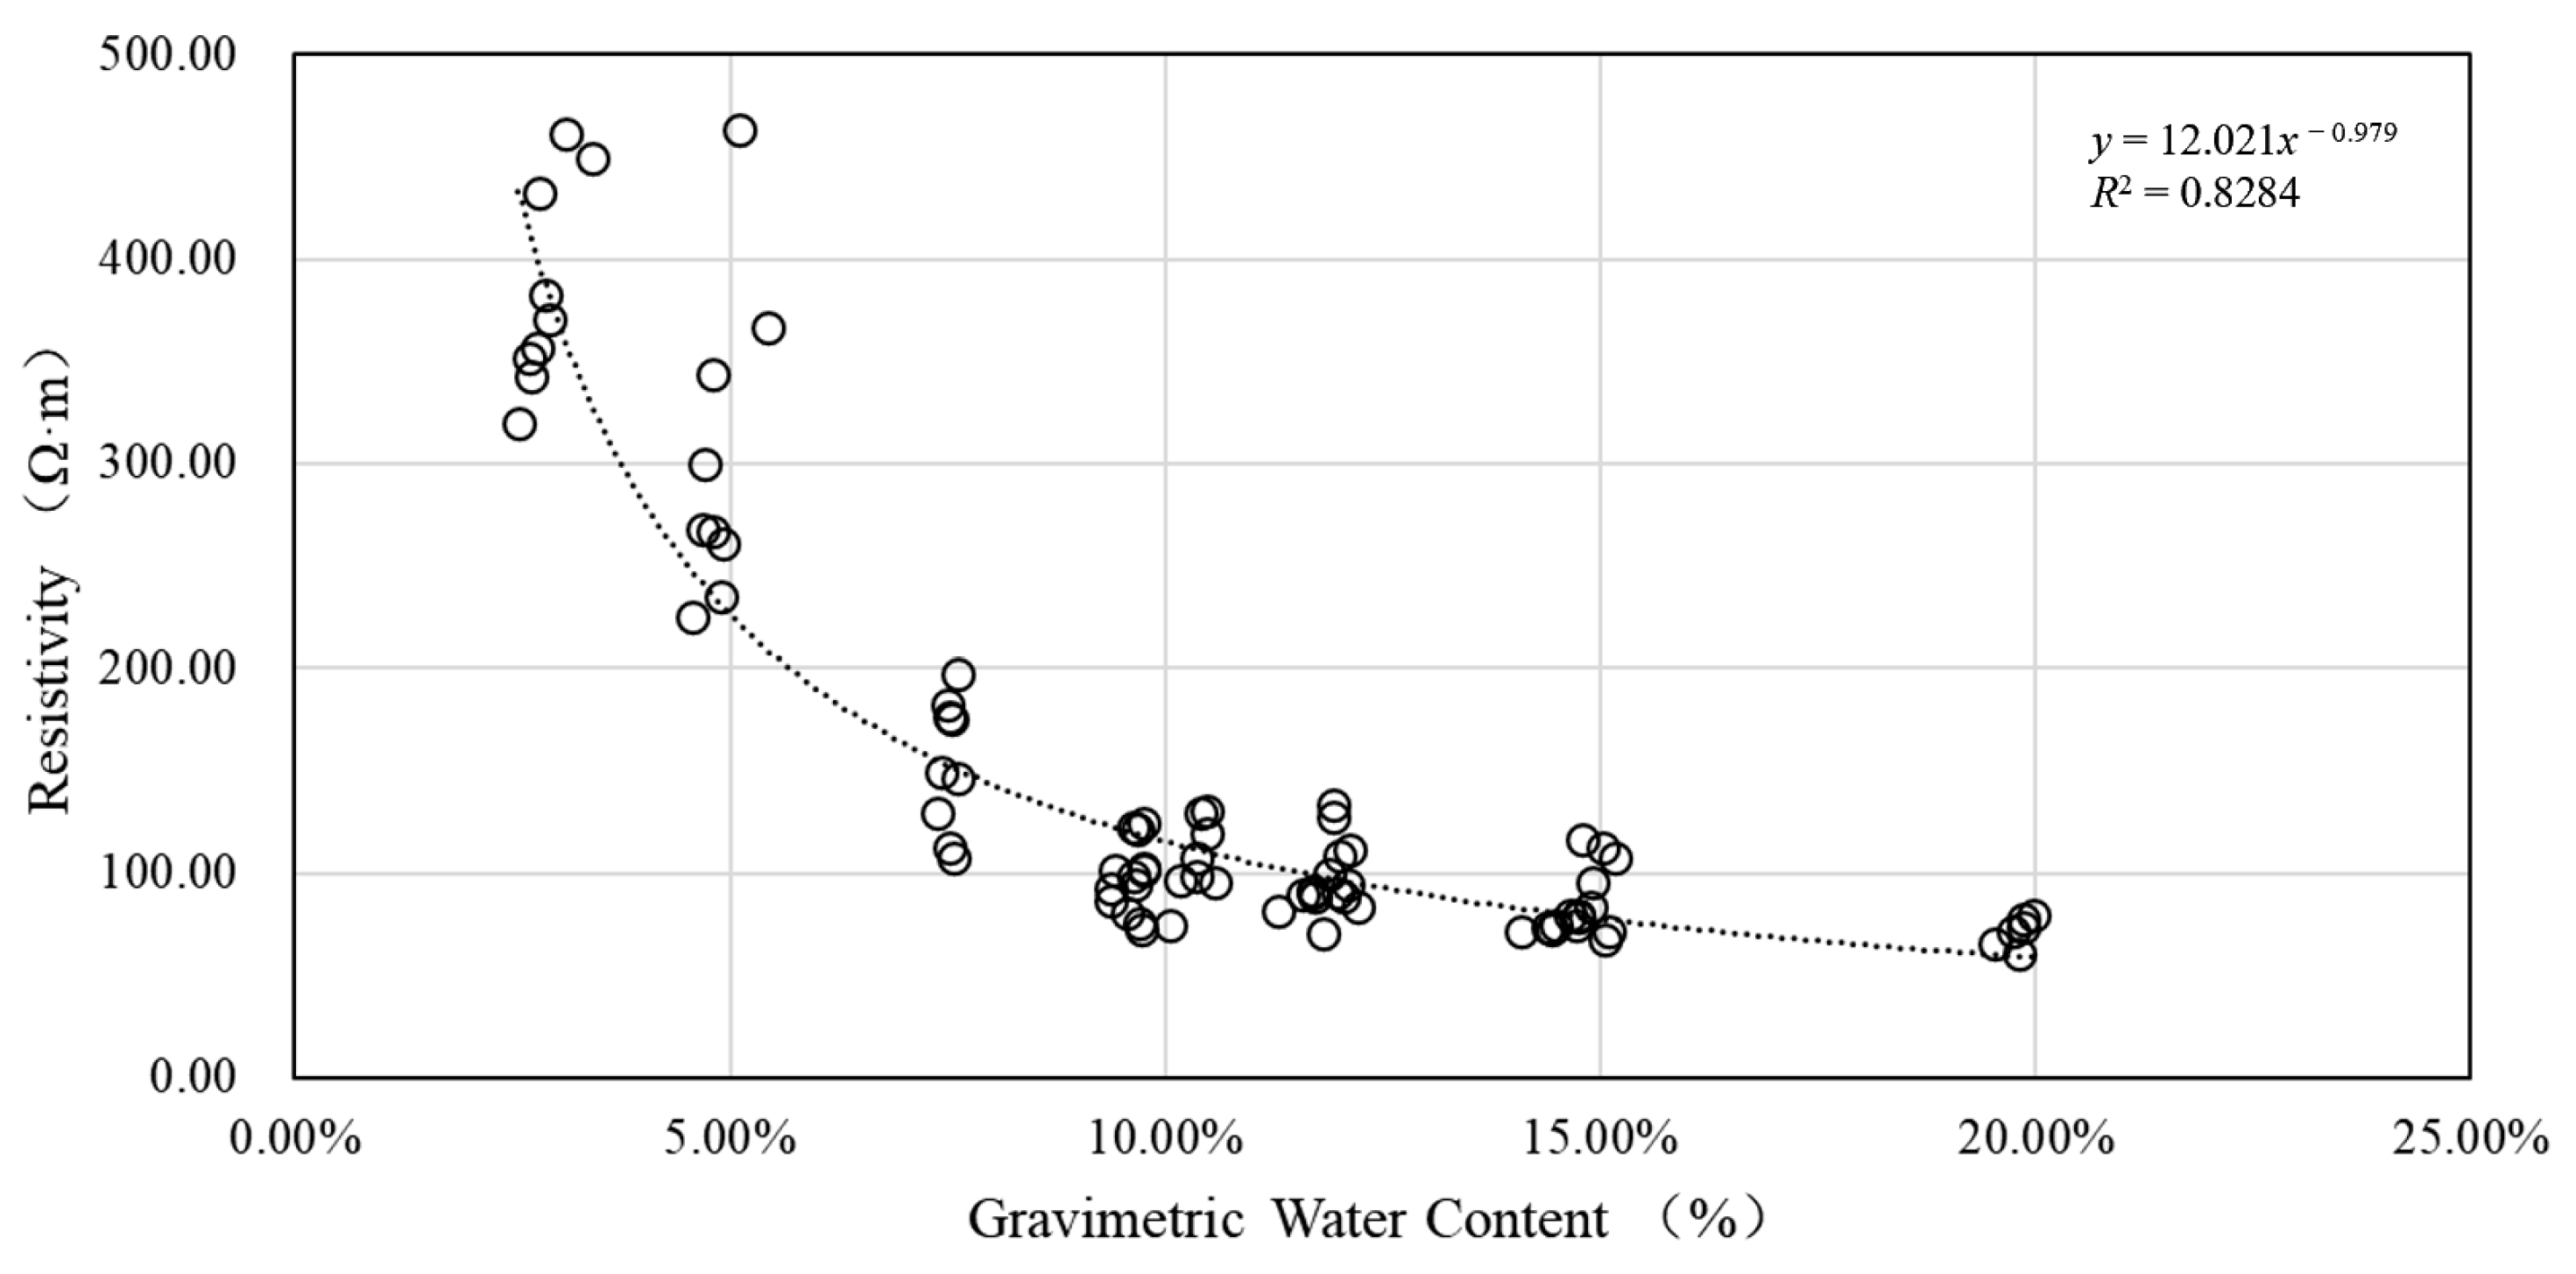
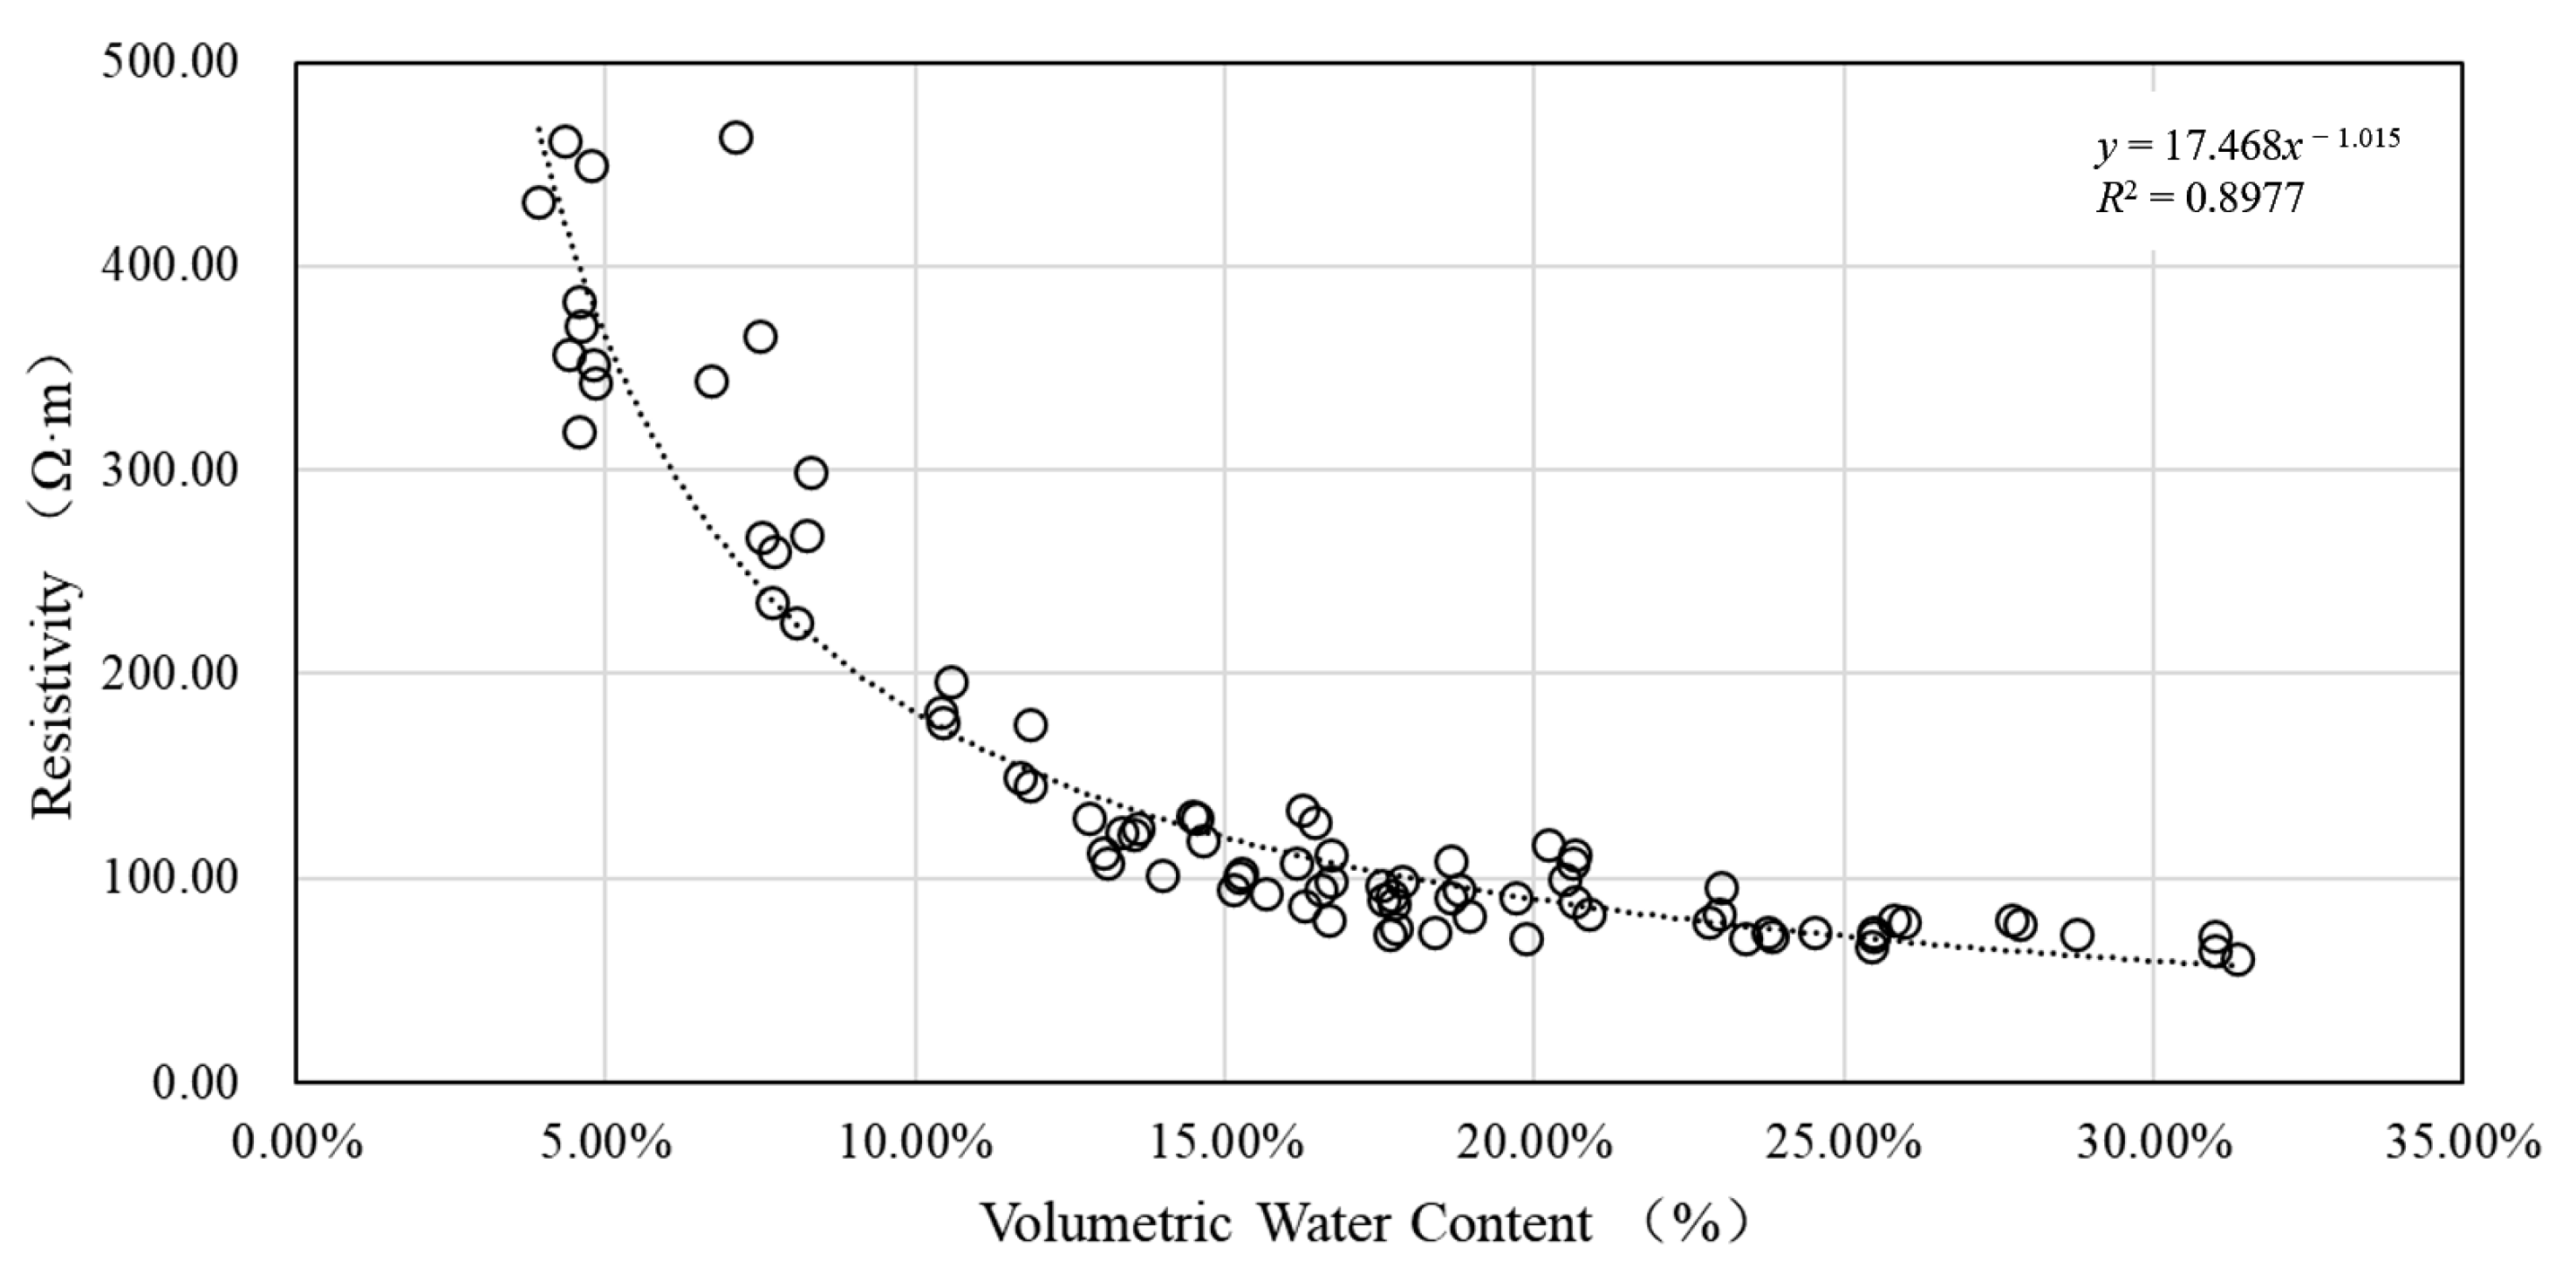
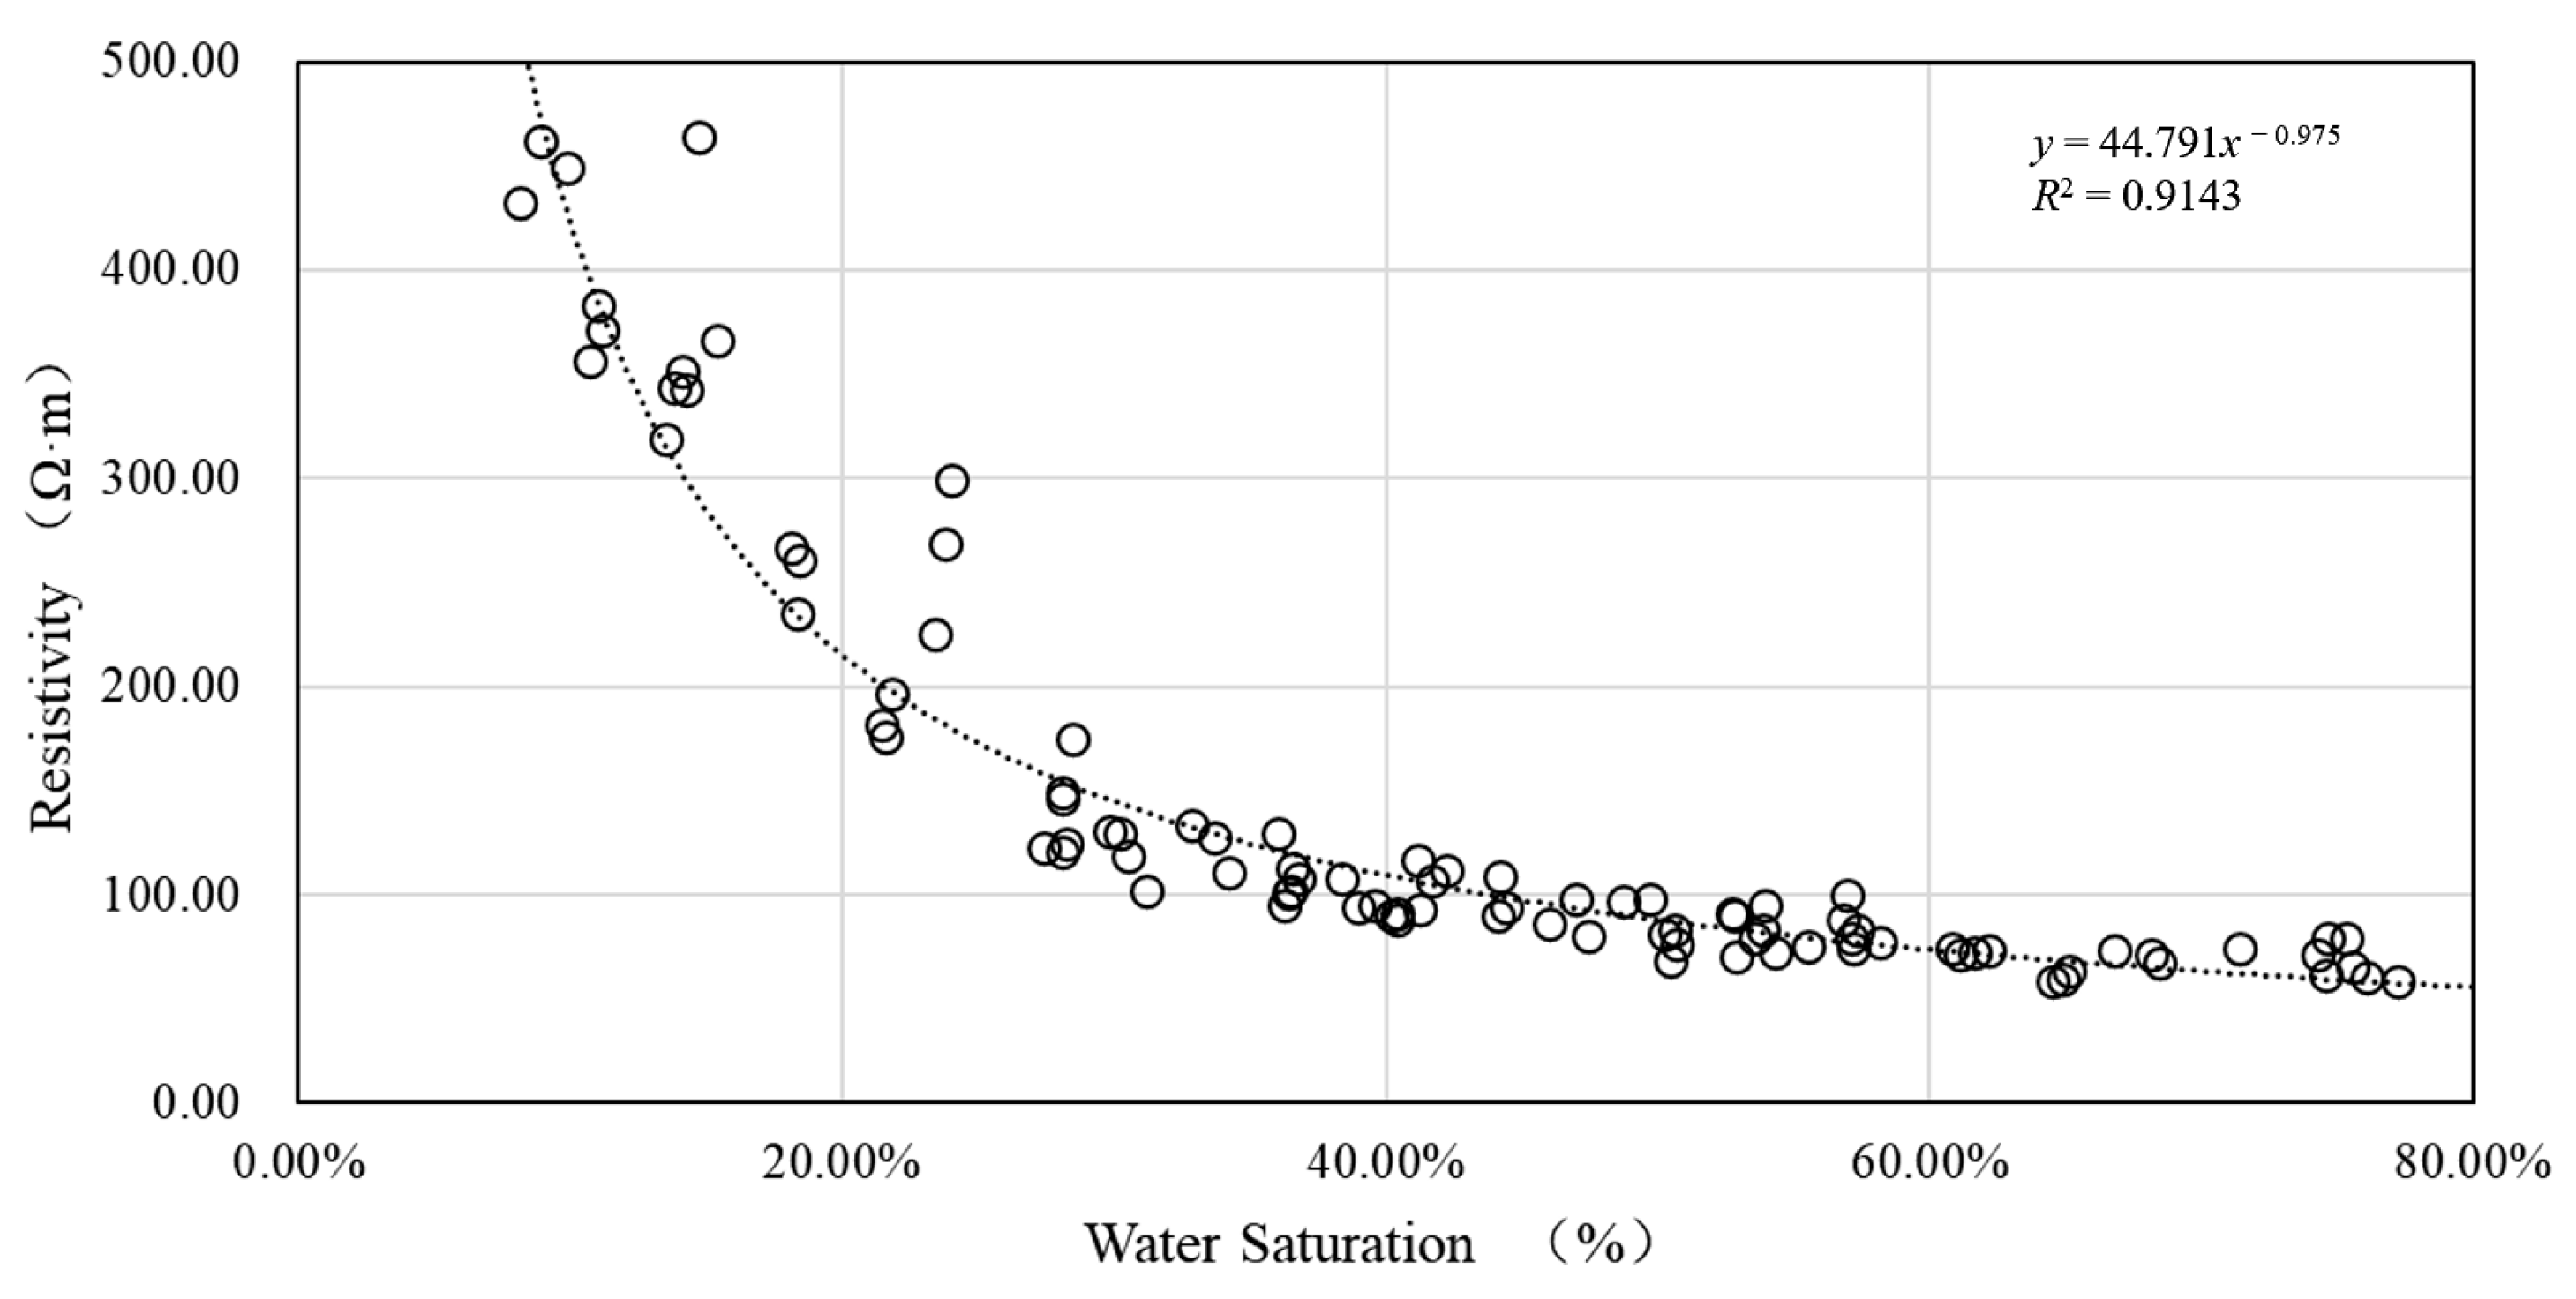
(1) A quantitative resistivity‒water content model was developed through experimental investigations, enabling the conversion of resistivity profiles into volumetric water content profiles. The experiments revealed a strong negative correlation between the resistivity and the volumetric water content (or water saturation), which was significantly superior to the relationship between the resistivity and the gravimetric water content. The resistivity of unsaturated loess exhibited a distinct two-stage decreasing pattern with increasing water saturation, featuring an inflection point at an approximately 40% saturation. When Sw < 40%, the resistivity decreased rapidly from 420 Ω·m (Sw = 10%) to 90 Ω·m (Sw = 40%), corresponding to a decay rate of approximately 80%. When Sw ≥ 40%, the resistivity decline rate notably decreased, with each 10% increase in Sw corresponding to only an ~10 Ω·m reduction.
(2) Under constant water content conditions, an increase in the wet density significantly reduced the loess resistivity. Loess compaction decreases the porosity, thereby increasing the volumetric water content (water saturation) per unit volume under a fixed water content. This facilitates the formation of continuous conductive water networks within the loess matrix, consequently lowering the resistivity.
(3) Comparative analysis between borehole data and ERT data revealed a higher water content prediction accuracy (mean error <9%) for shallow loess (<20 m), which is attributable to the homogeneous physical properties and water-dominated resistivity variations. The prediction accuracy decreased significantly with the depth (>20 m), potentially because the density increased due to gravitational compaction. Enhanced density effects reduced the dominant influence of the water content on the resistivity. Future modeling should integrate multiphysics coupling mechanisms (temperature, density, etc.) to increase the accuracy of deep-layer water content inversion.
