
Integrated Application of Radon Measurement and Conventional Electrical Prospecting in Geothermal Exploration: A Case Study of Lantian Section, Ningdu, Jiangxi Province


Abstract
1. Introduction
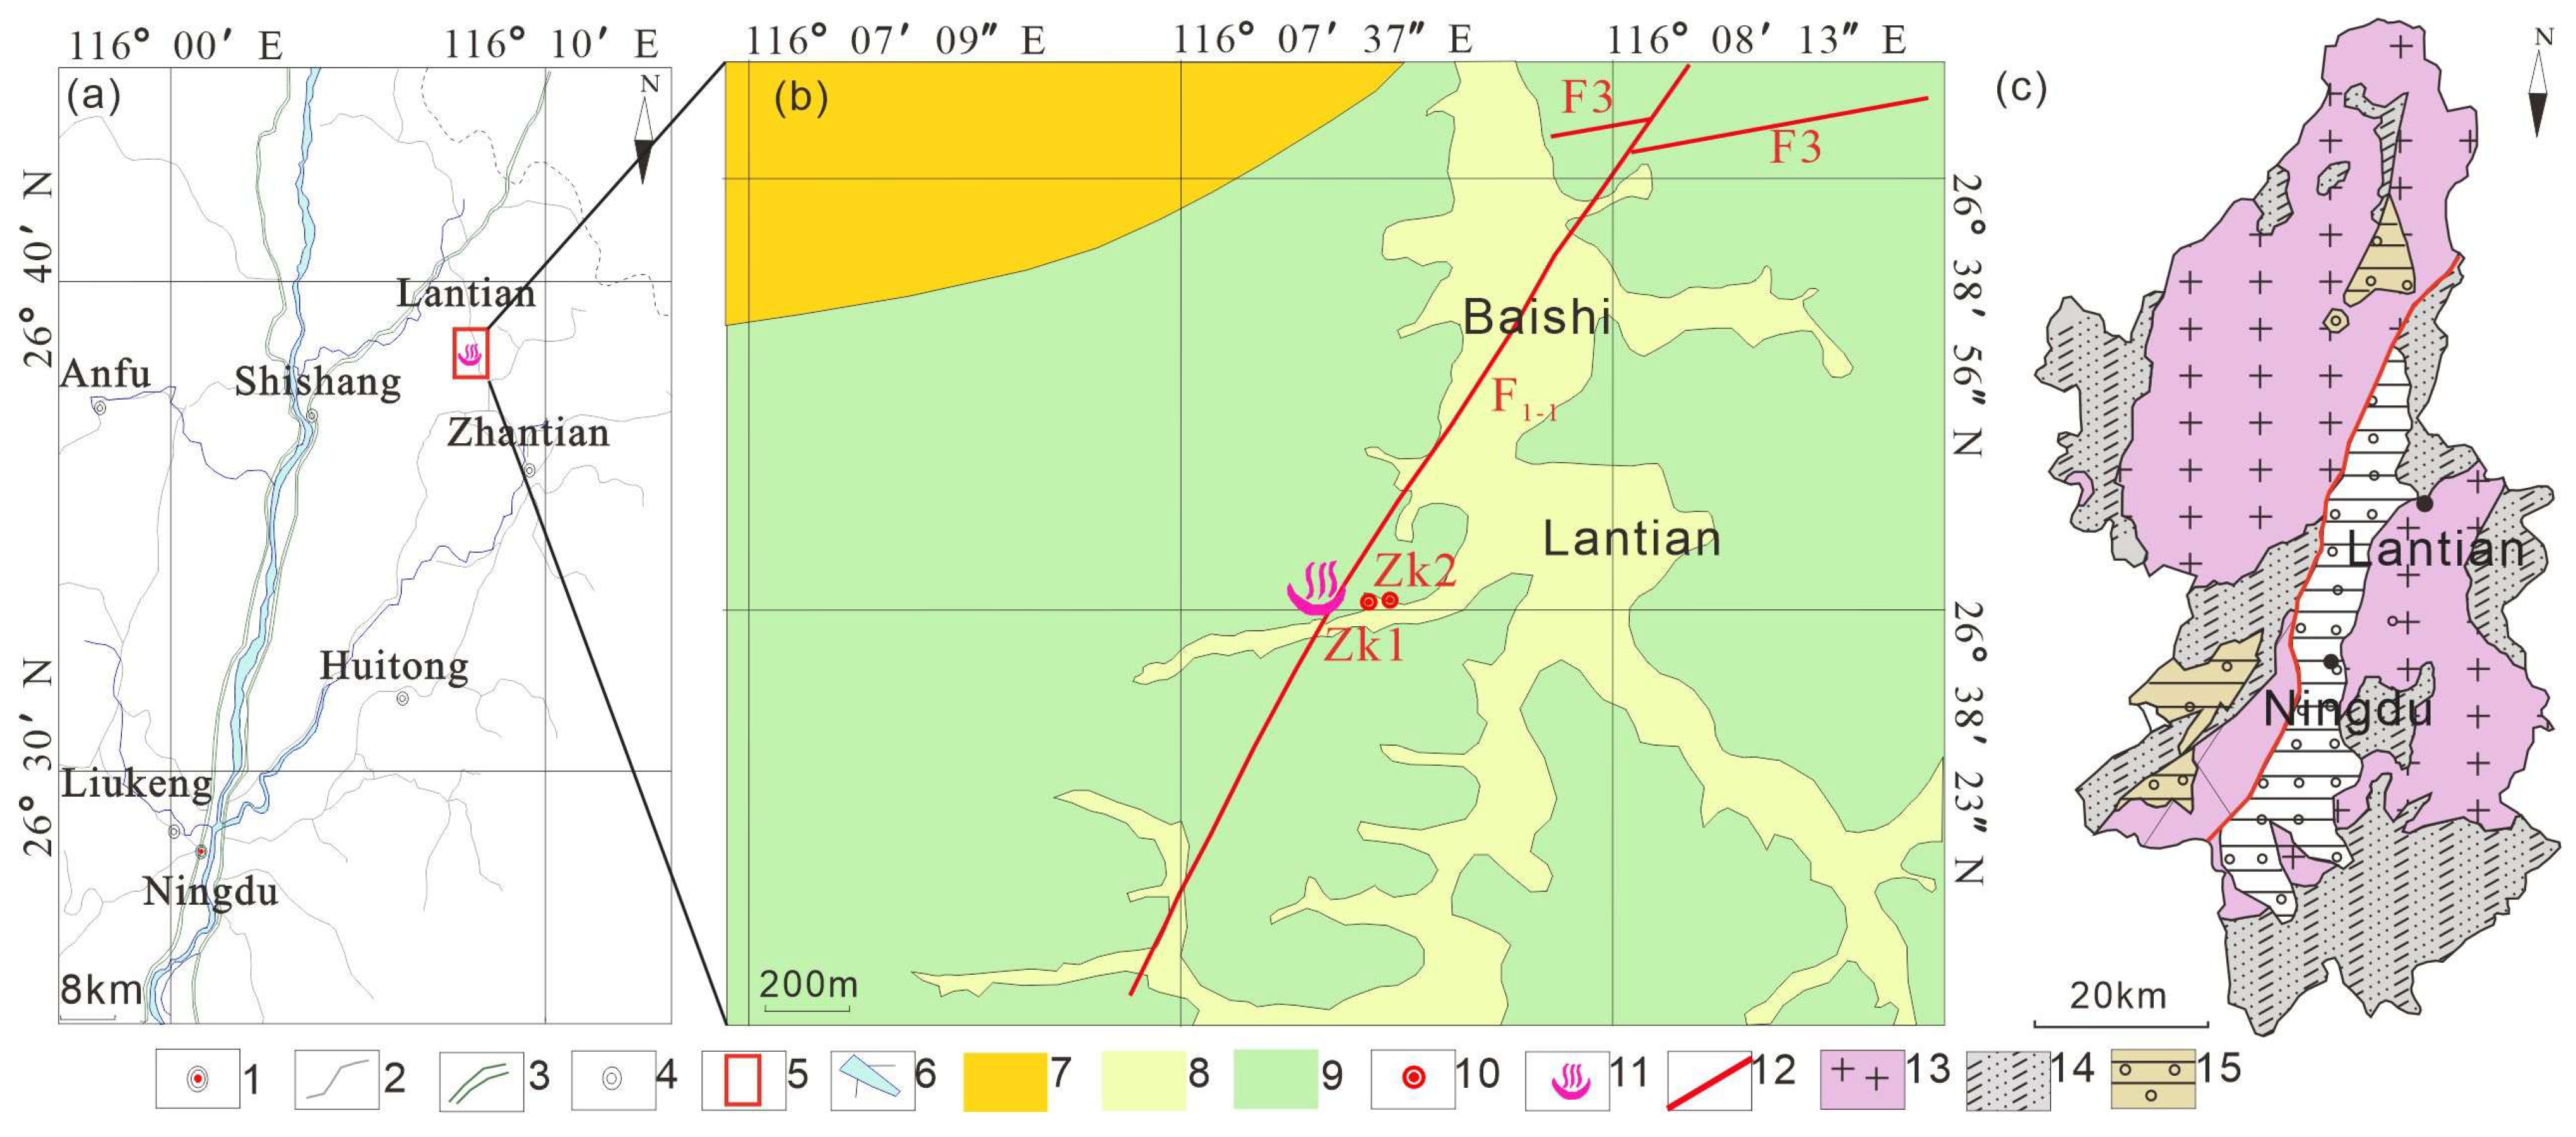
2. Overview of the Research Area
2.1. Geological Structure
2.2. Hydrogeology
3. Measurement Methods and Data Acquisition
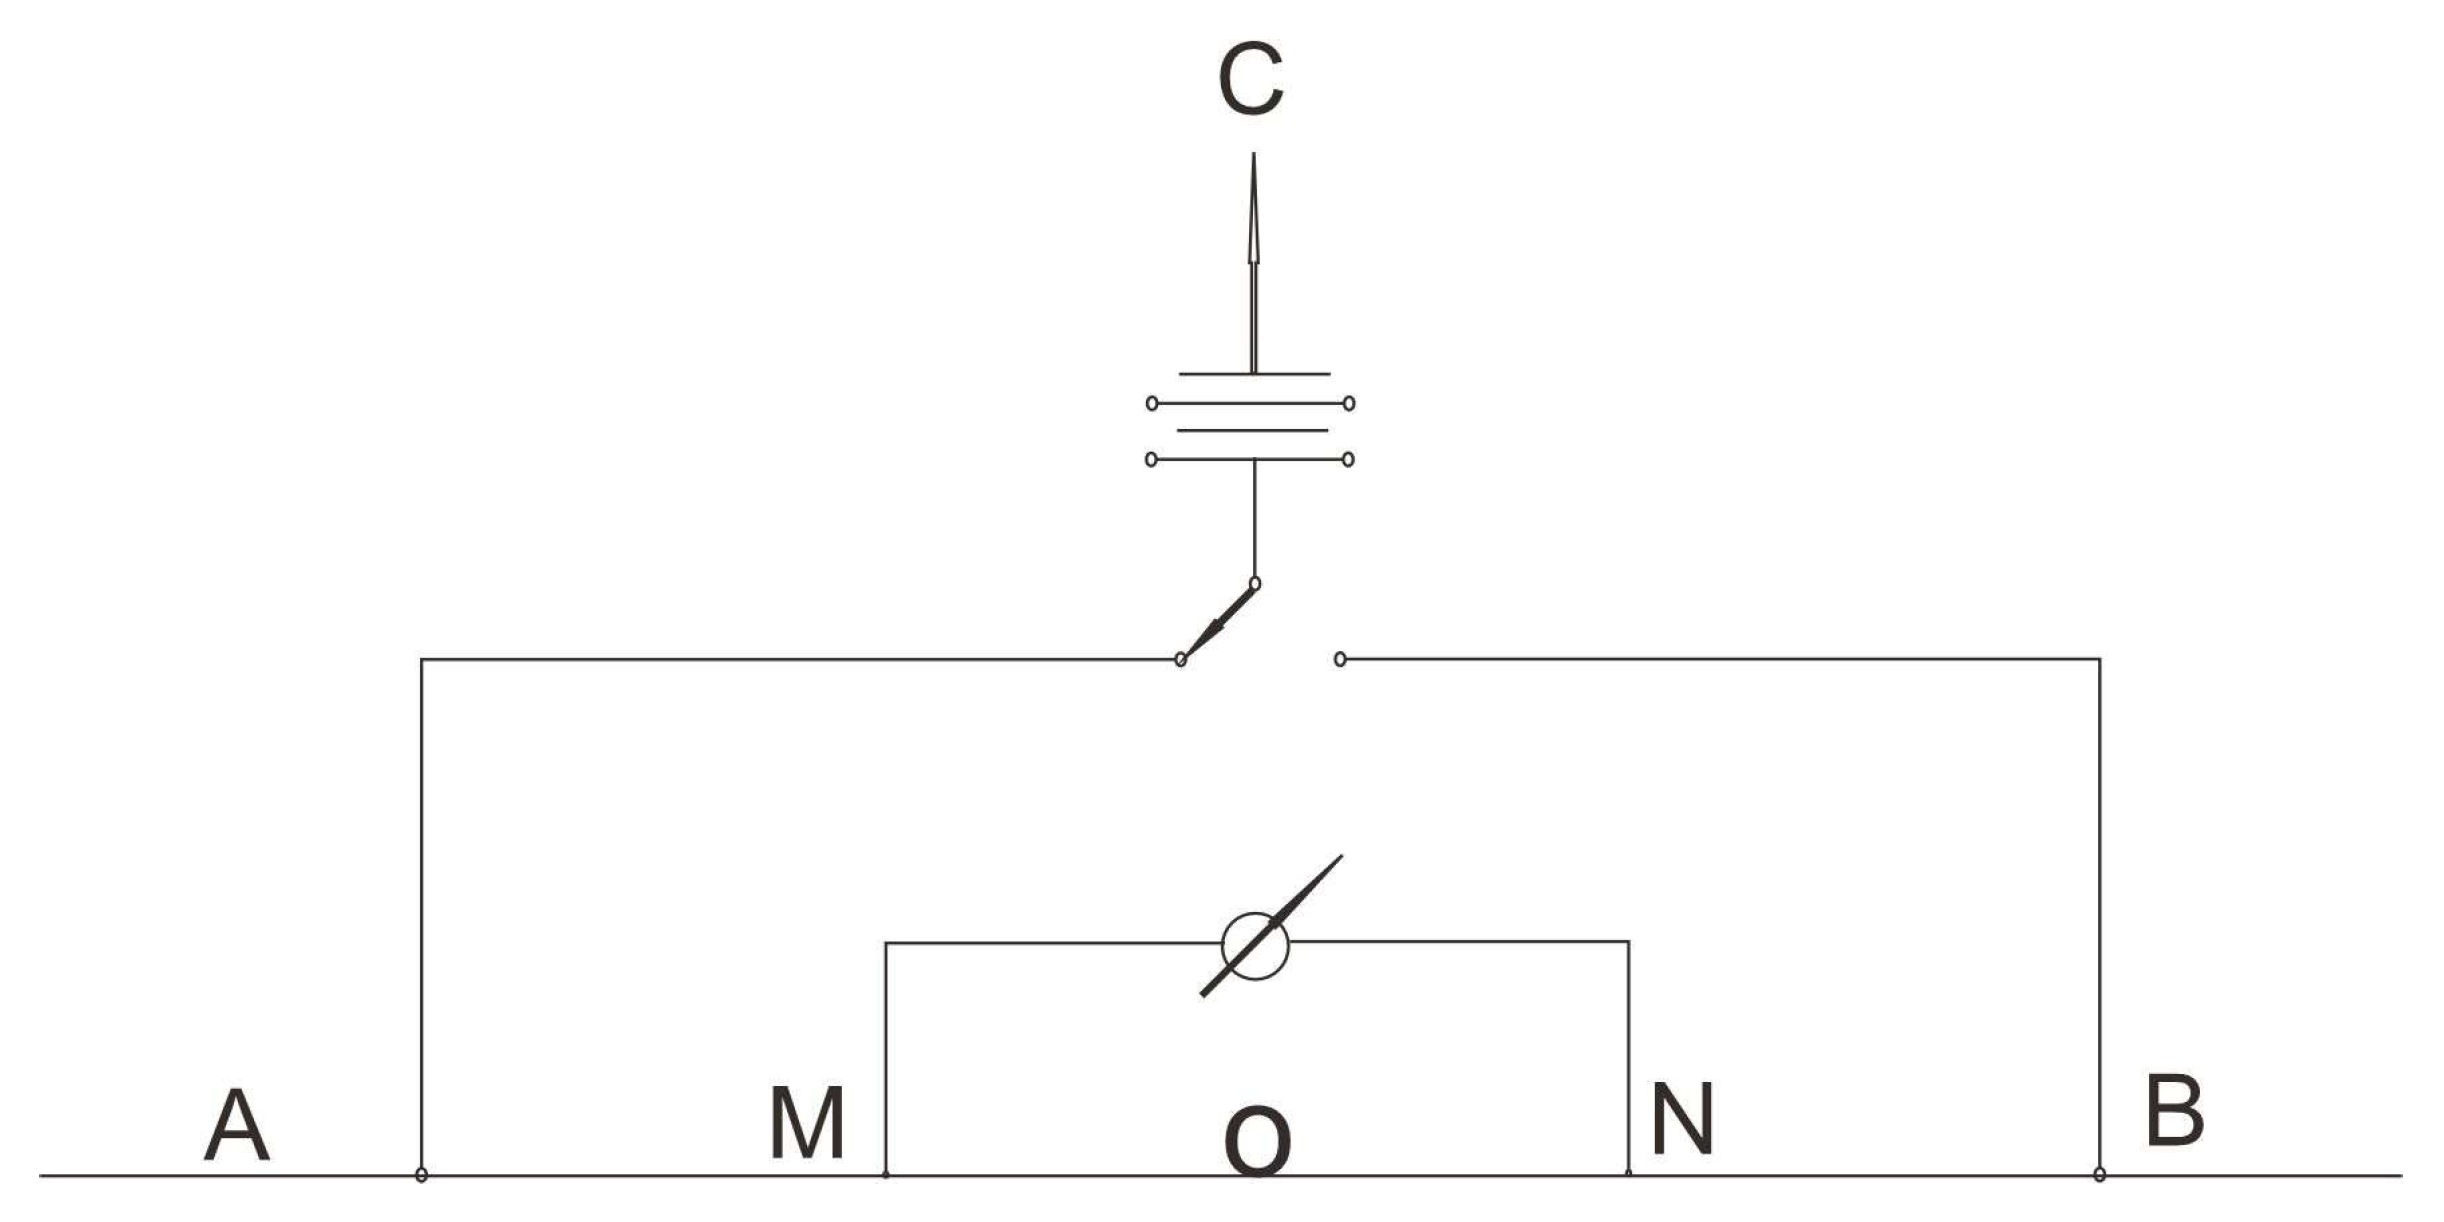
3.1. Conventional Electrical Prospecting
Instrument and Line Arrangement
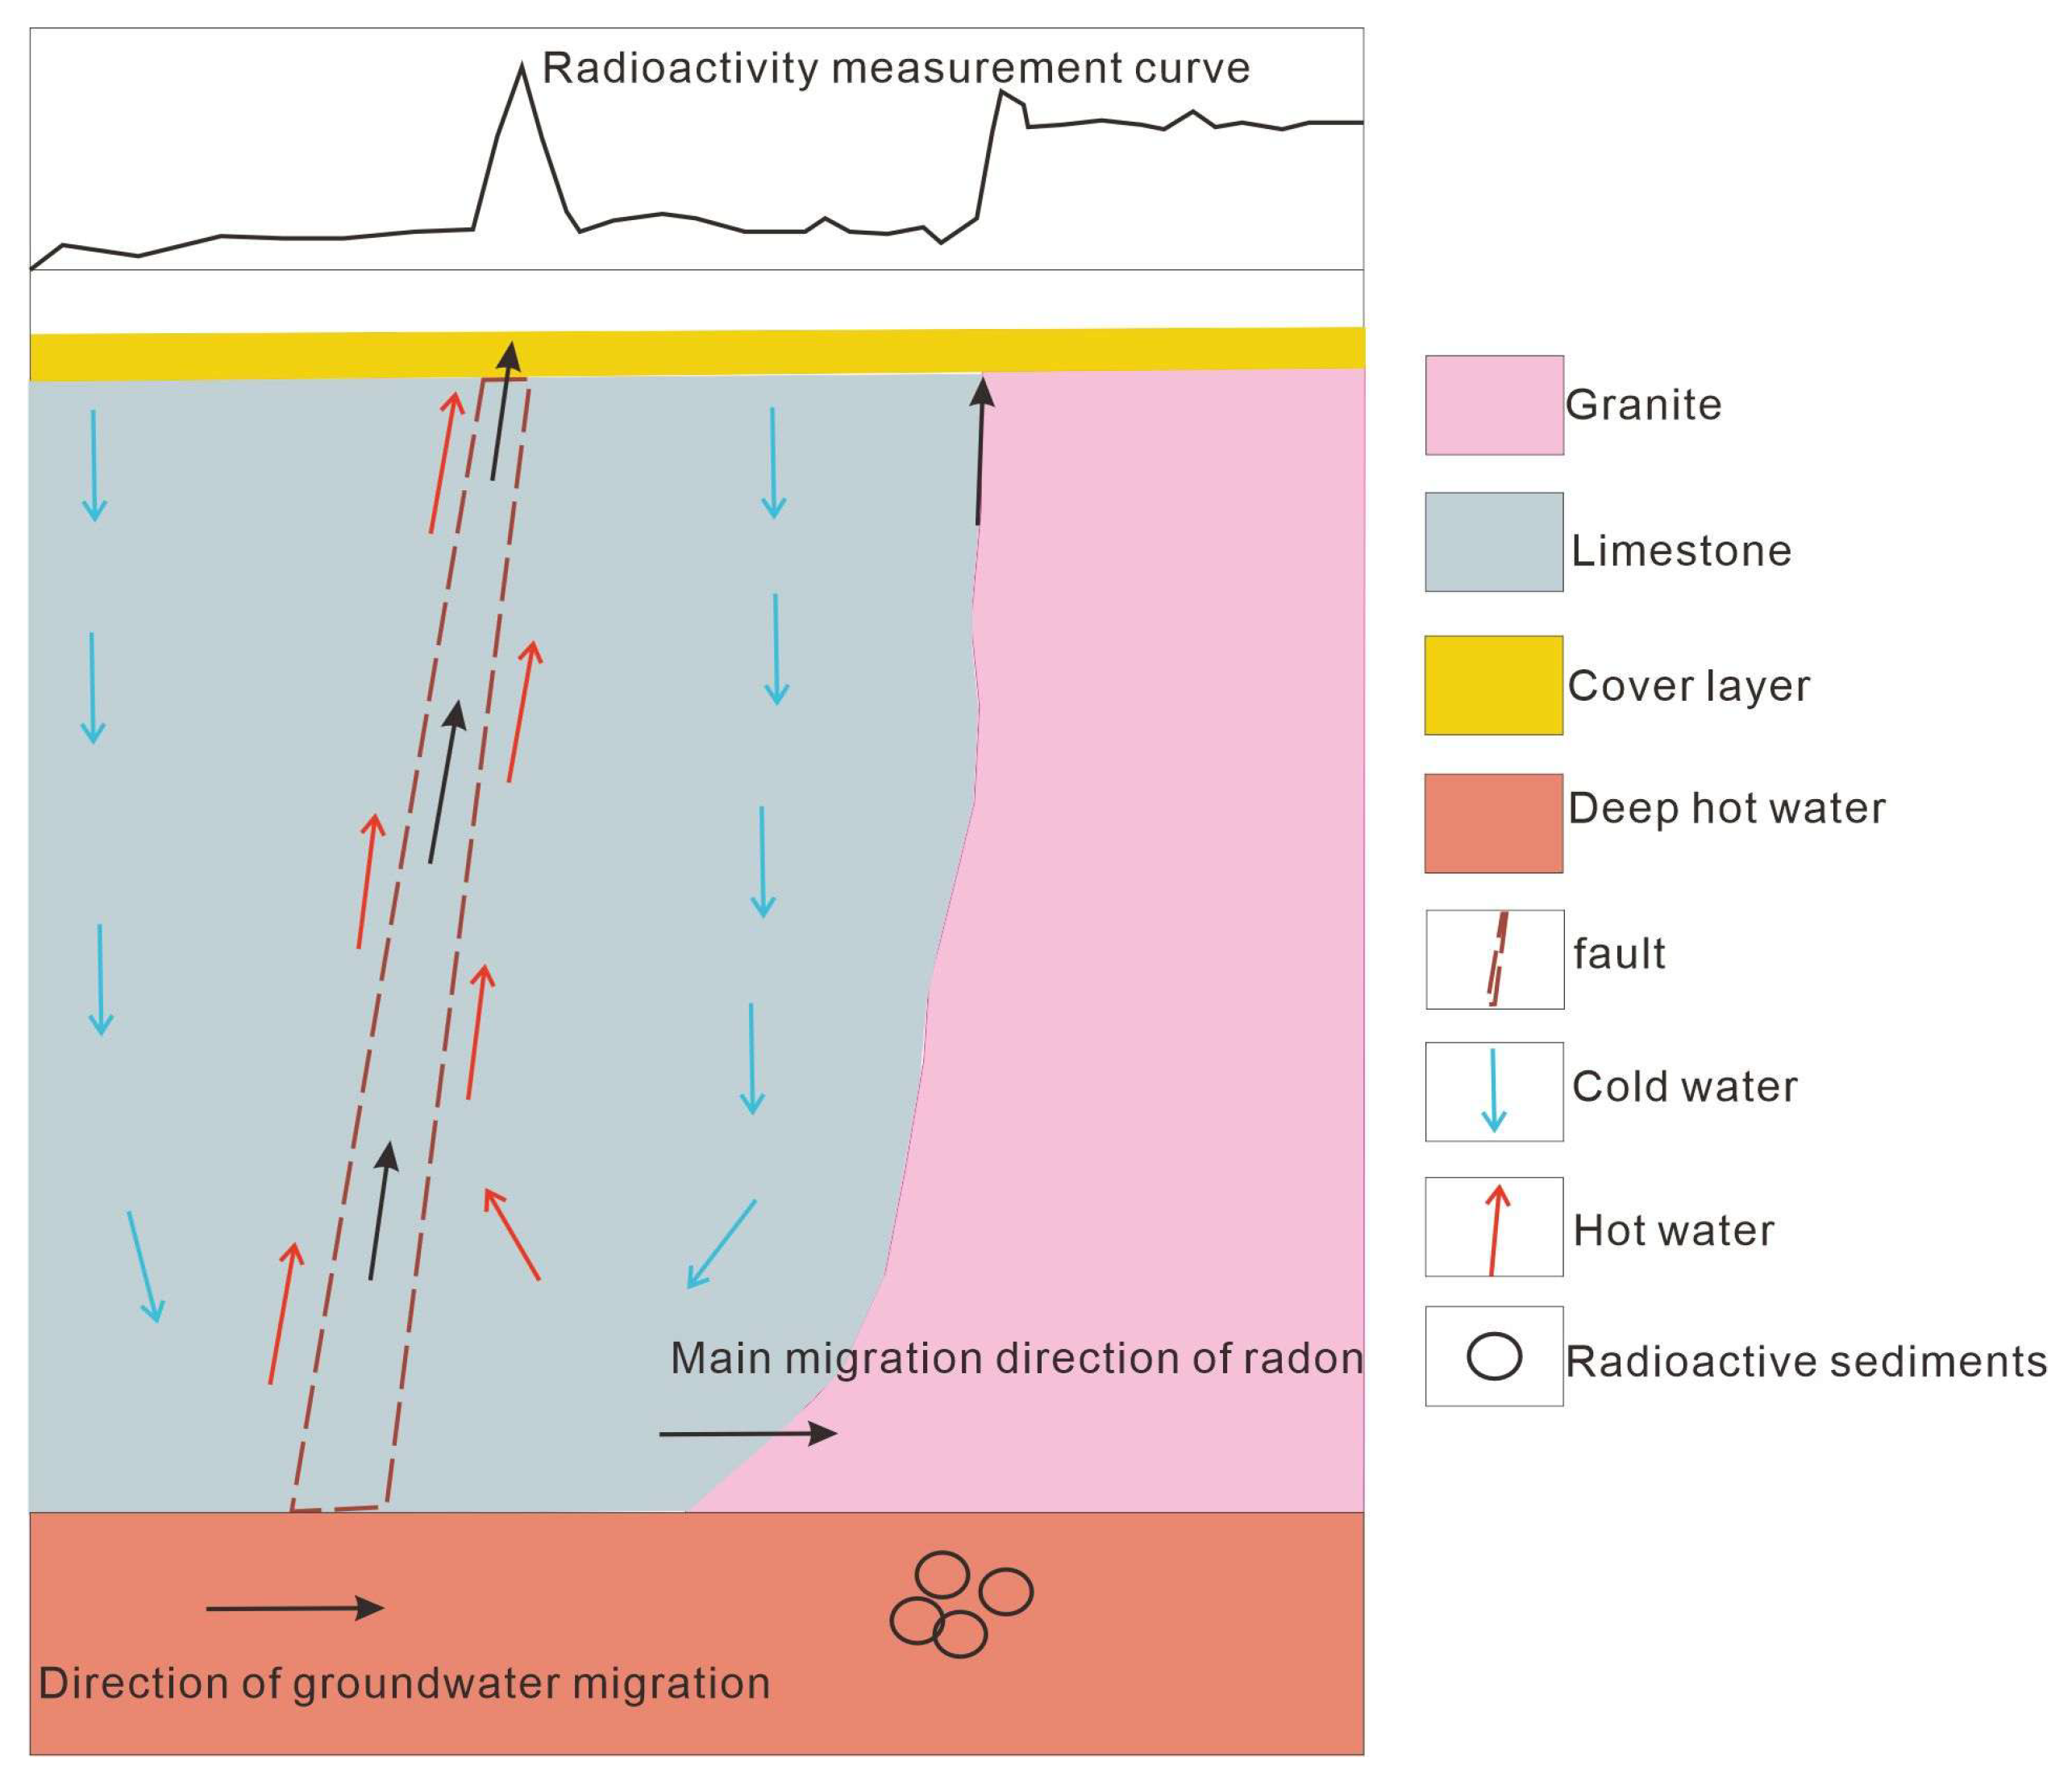
3.2. Radon Measurement
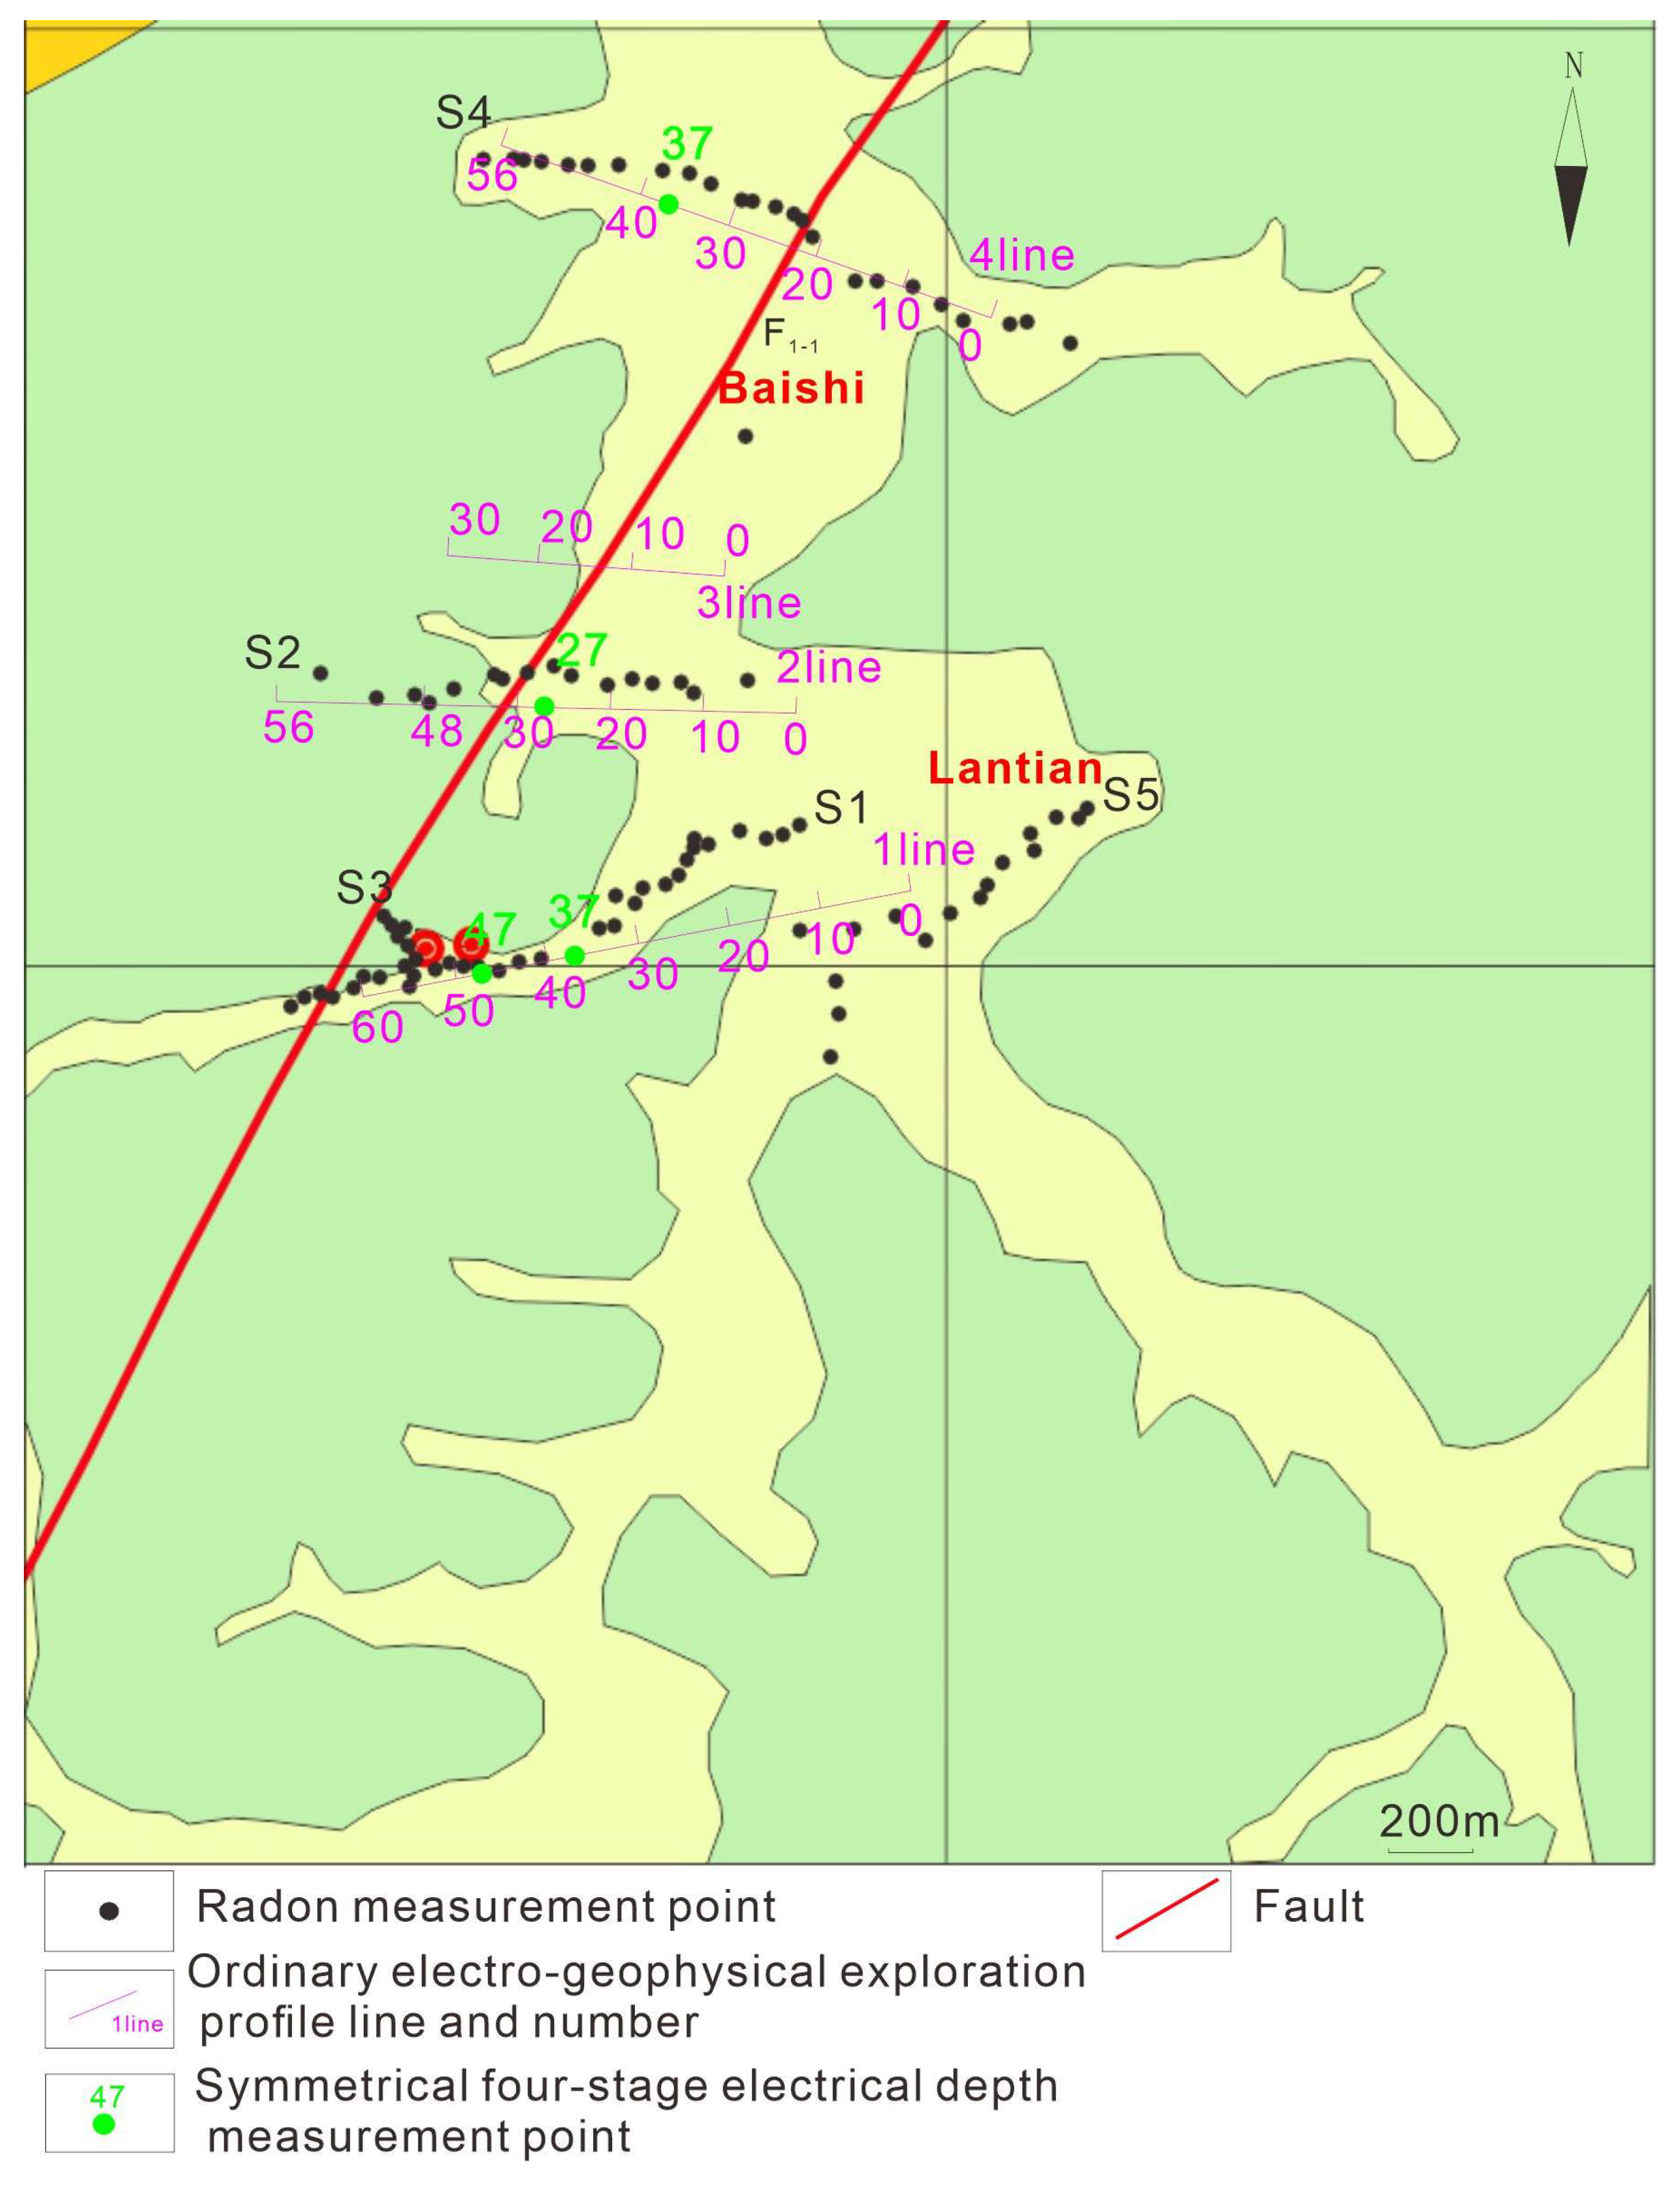
Instrument and Measurement Line Layout
4. Data Processing and Analysis
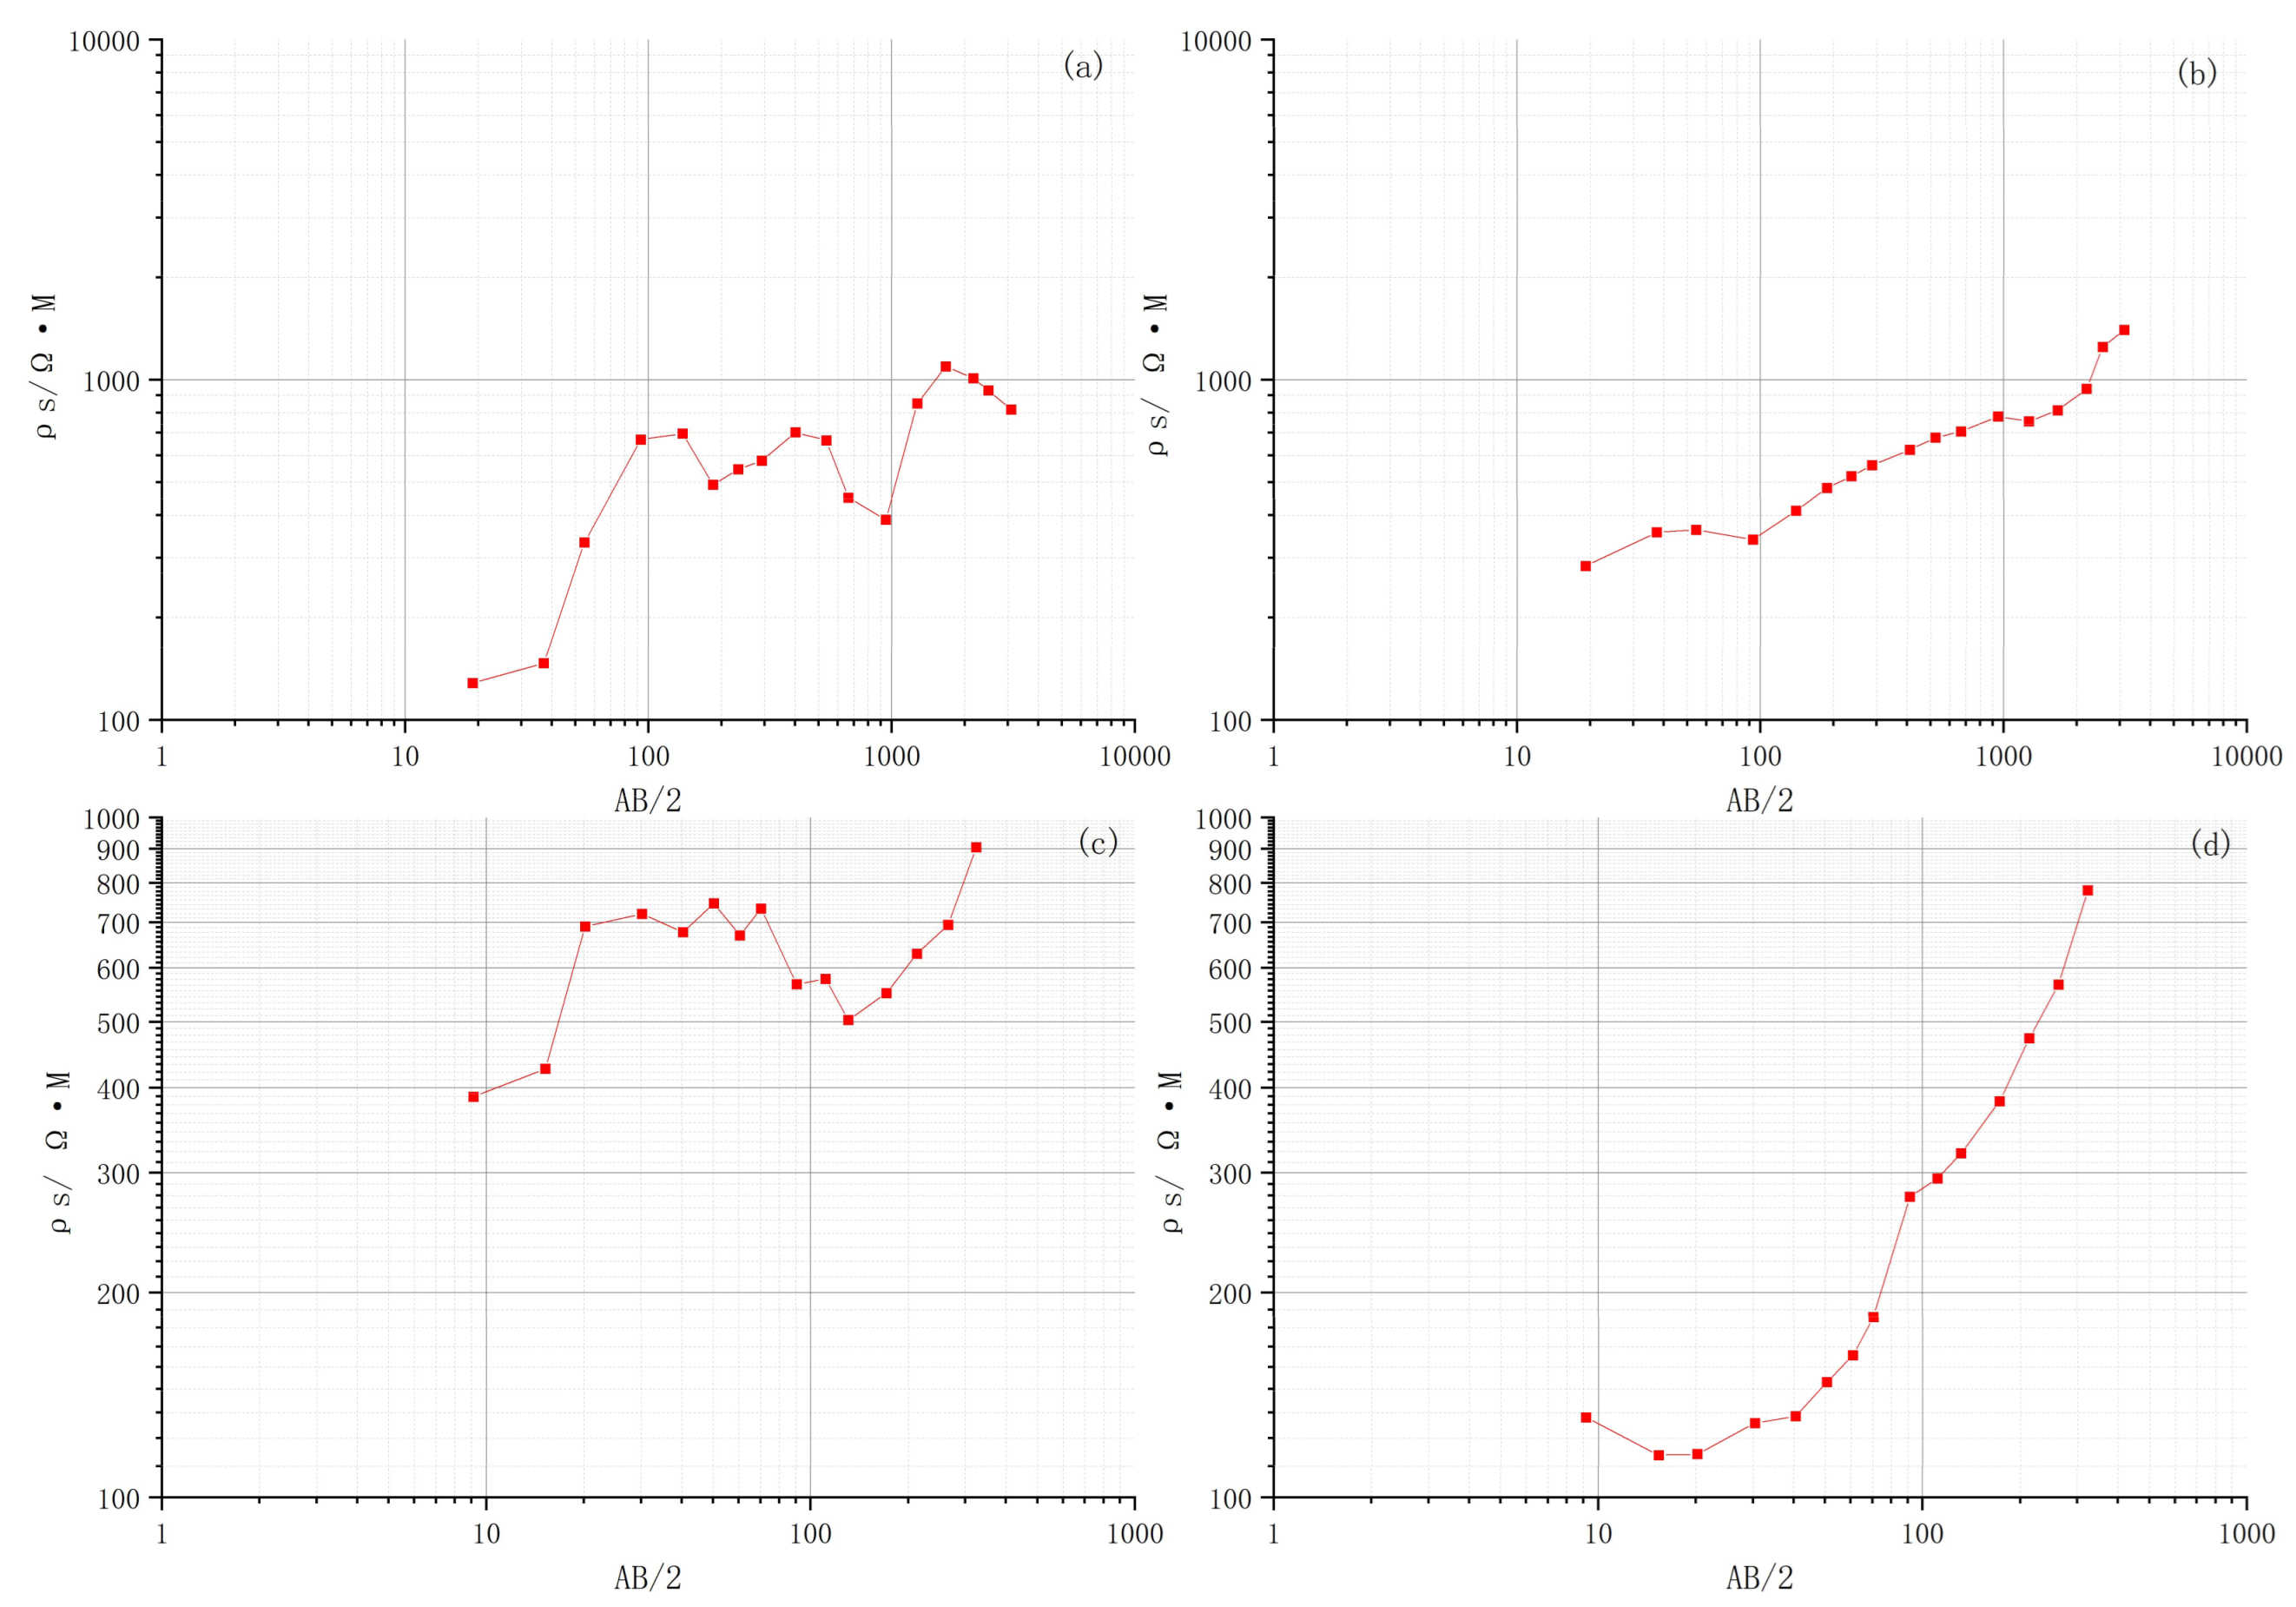
4.1. Characteristic Analysis of Apparent Resistivity Combined Profiling and Vertical Electrical Sounding Method
- Line 1
- 2.
- Line 2
- 3.
- Line 3
- 4.
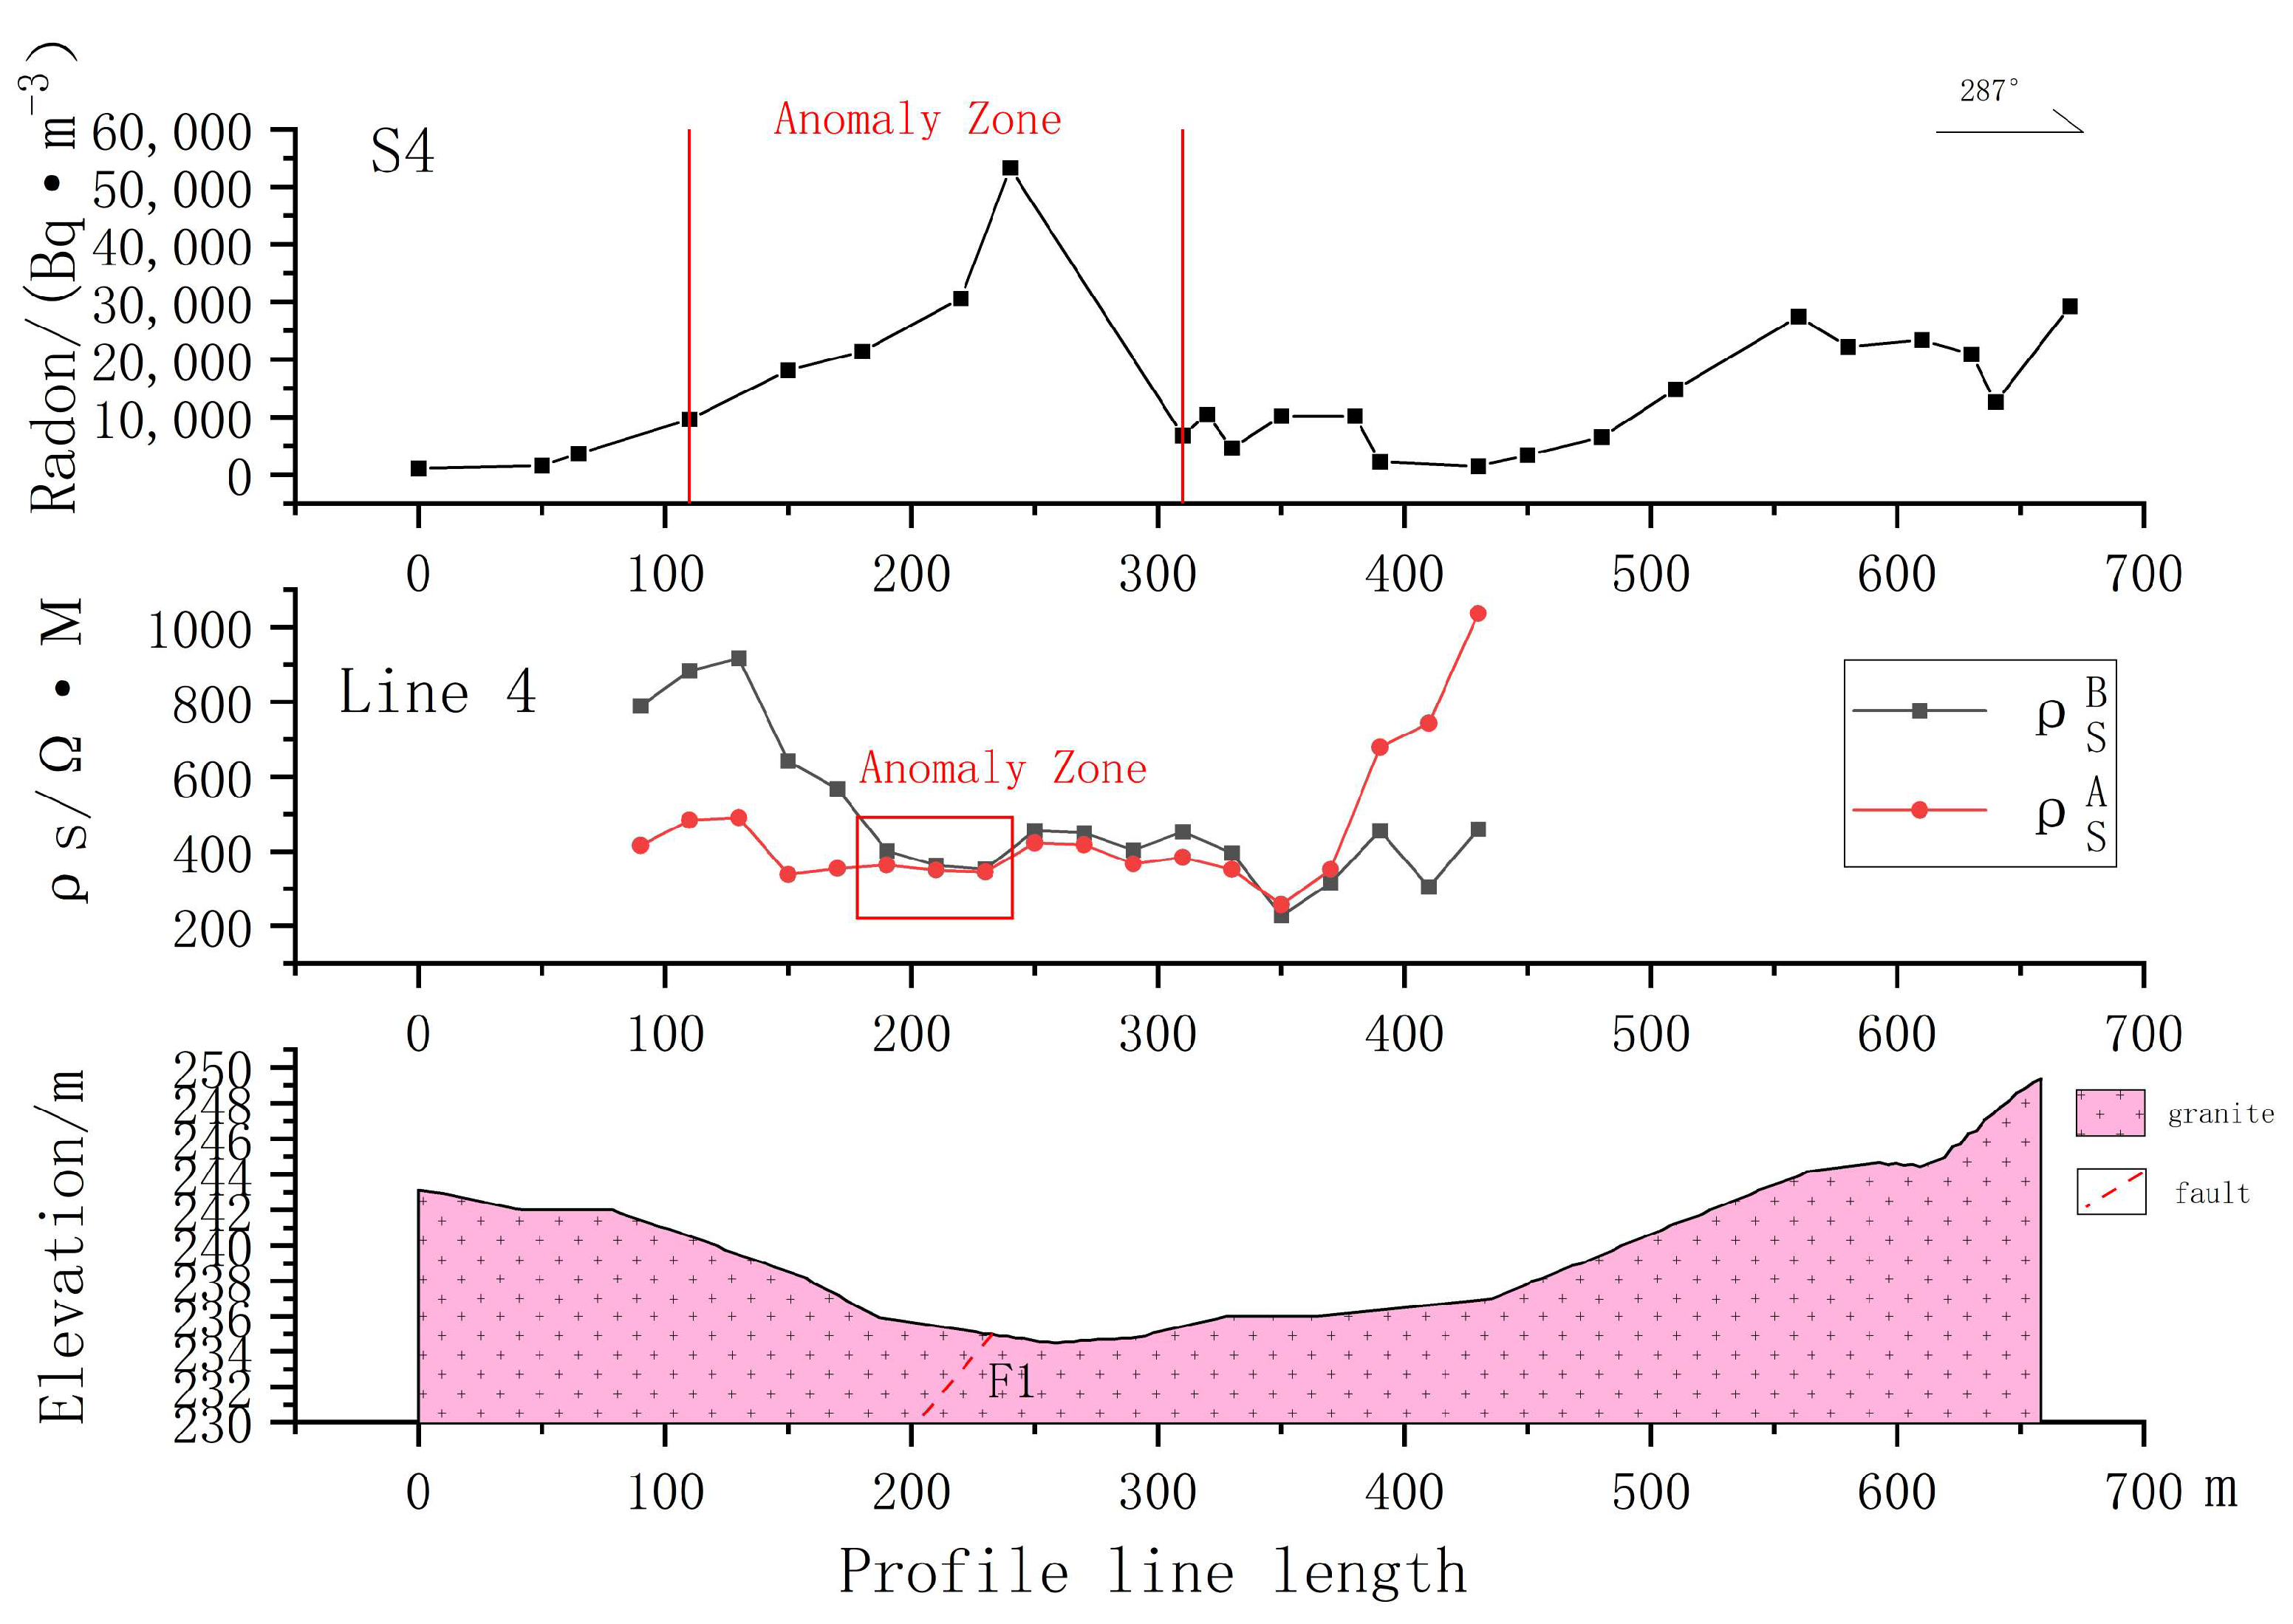
- Line 4
4.2. Radon Data Processing and Profile Line Characteristics
5. Discussion
6. Conclusions
- (1)
- Electrical prospecting identifies granite bedrock with thin Quaternary overburden, ascertaining radon method applicability to radioactive terrains with shallow cover.
- (2)
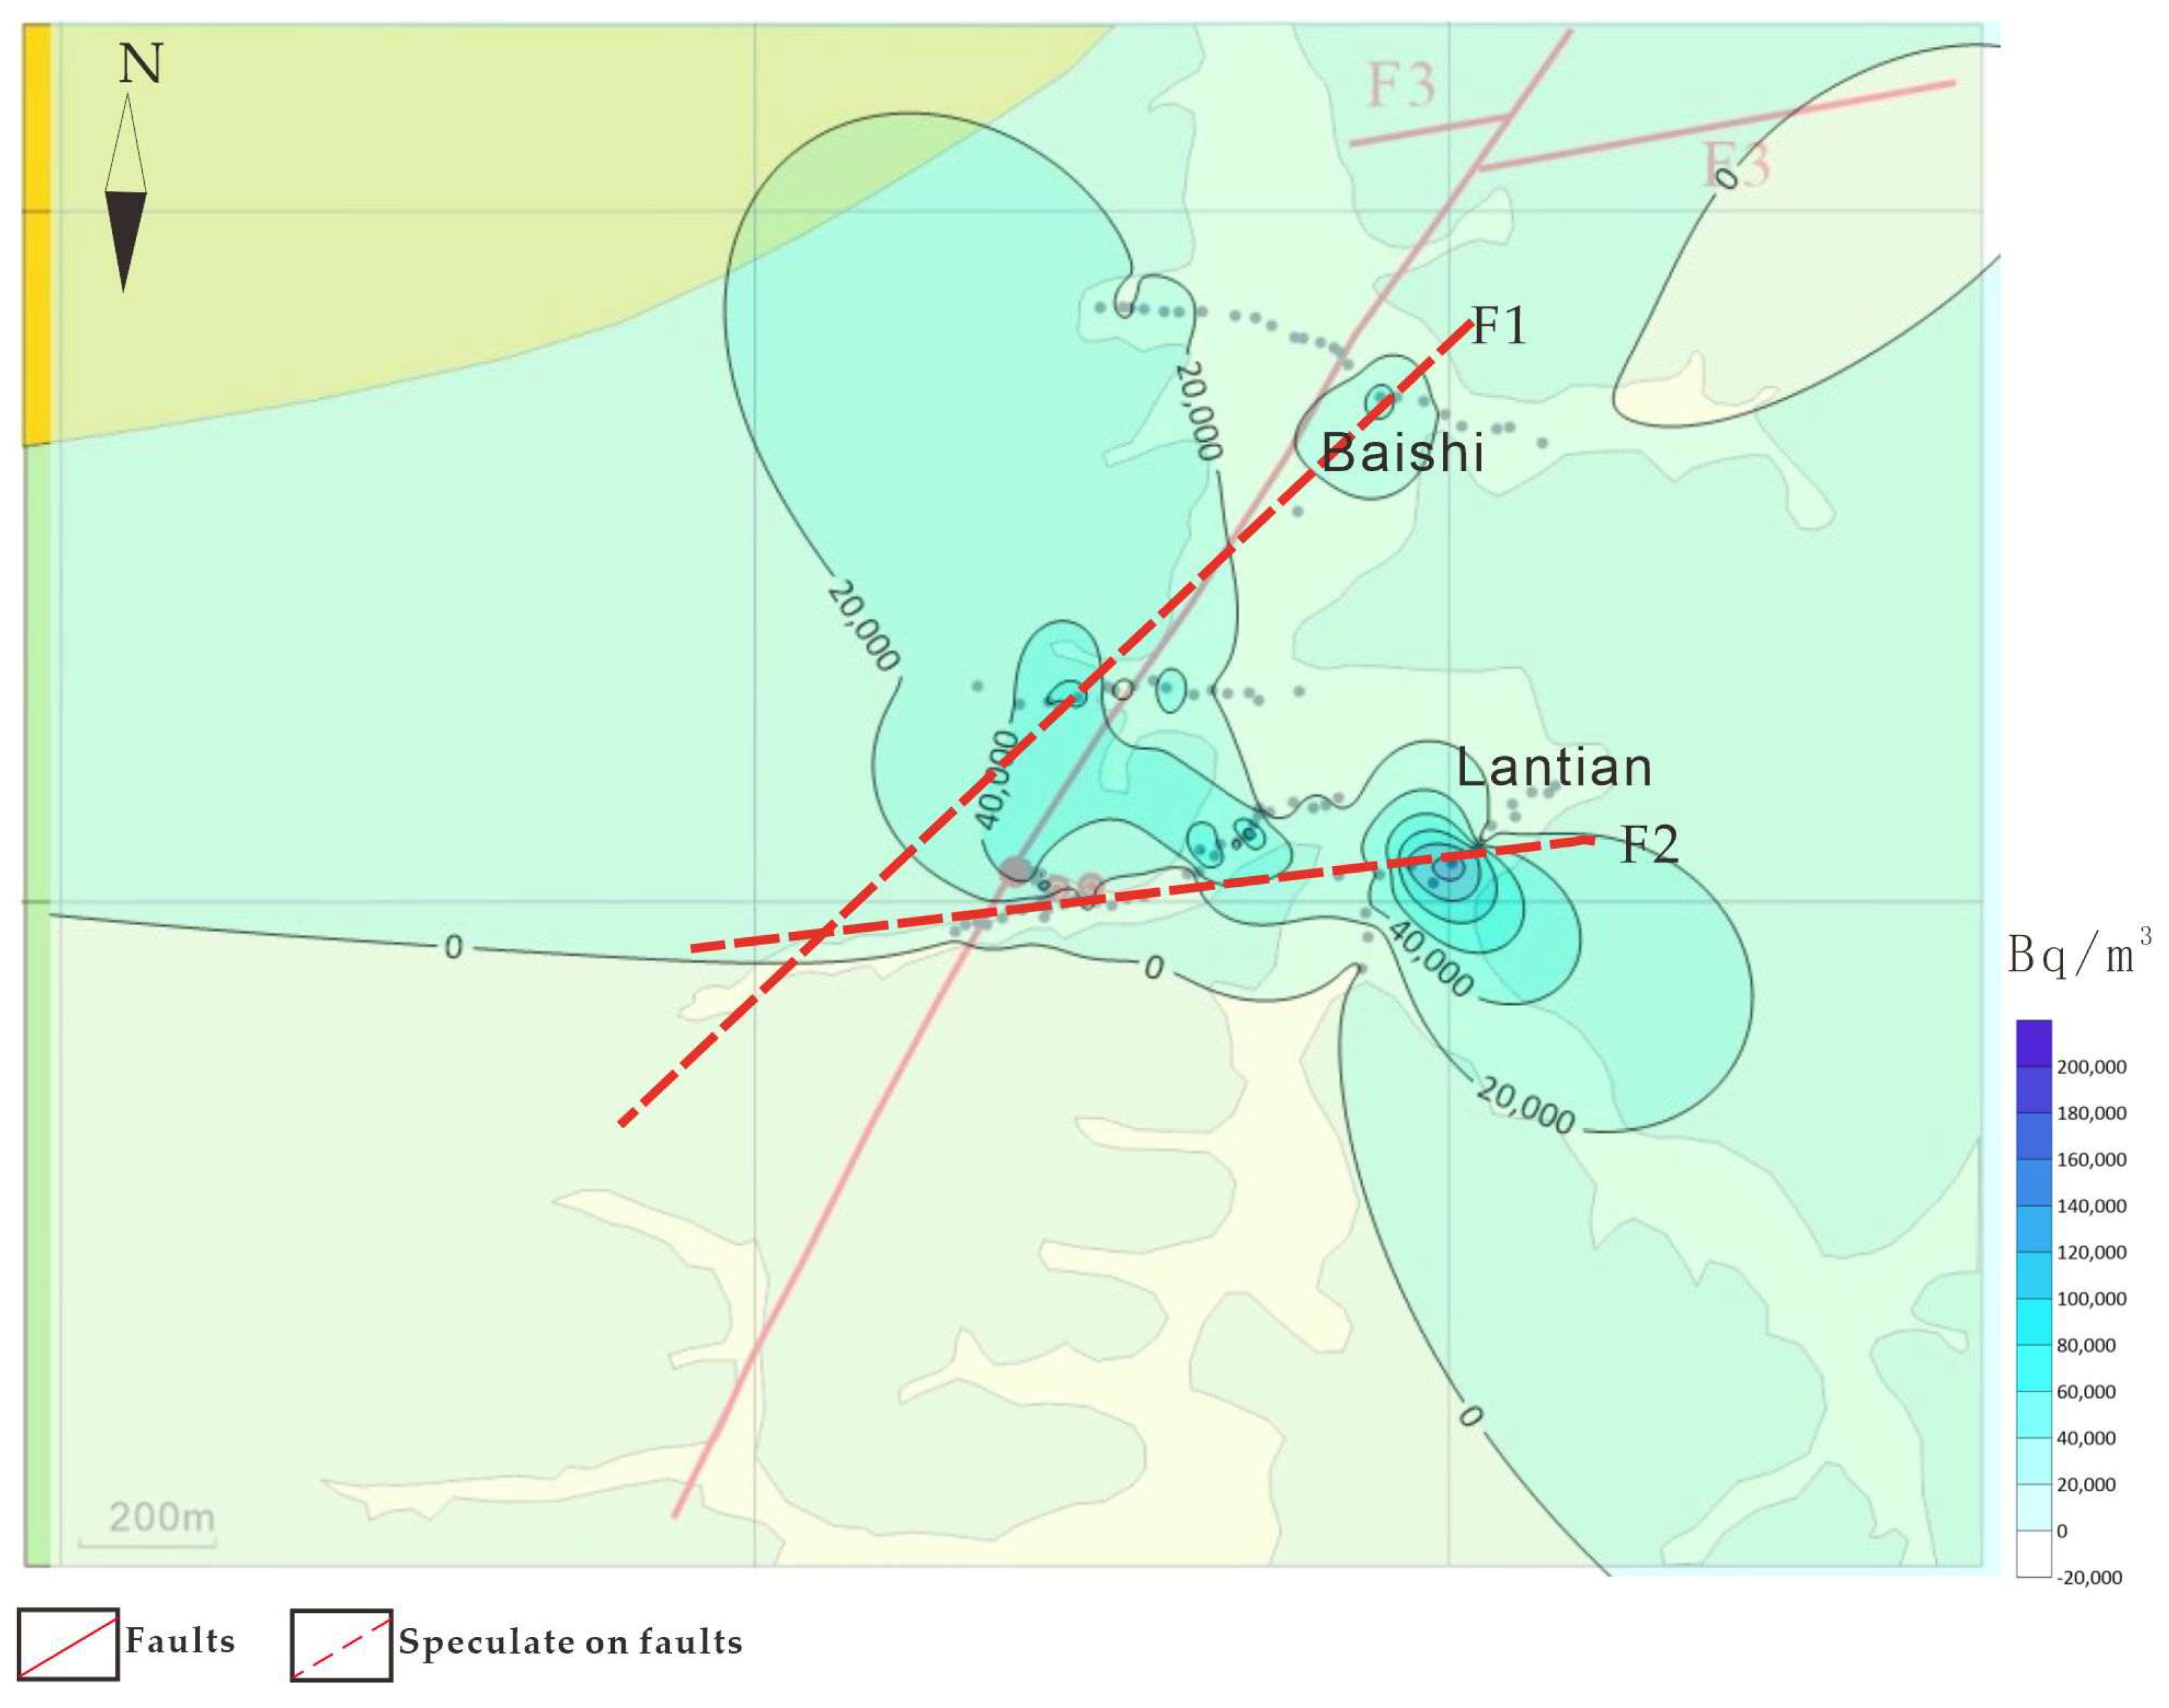
- Resistivity profiles (Lines 2/4) and radon anomalies (S2/S4) delineate a NE-trending fault zone F1 (65°–75° NW dip; about 40 m width). Complementary data from Line 1 and profiles S1/S5 indicate an NEE-trending fault zone F2.
- (3)
- Stress concentration at the F1–F2 intersection creates fractured rock masses that are conducive to groundwater accumulation, designating this zone as a preferential geothermal exploration target.
- (4)
- Strong correlation between electrical and radon methods substantiates their synergistic application for fault detection. Radon anomalies provide distinct, intuitive signatures in fracture-controlled geothermal systems, demonstrating efficacy for structural mapping. Yet this approach warrants expanded implementation in Lantian’s geothermal exploration program.
- (5)
- Radon gas measurement results are considerably susceptible to environmental factors. Therefore, it is imperative to conduct in-depth studies on how the environment affects radon content and to develop appropriate correction models. Future endeavor may focus on drilling in the fault structure complicated fracture zones of the study area, combined with geochemical analysis and geothermal measurements, in order to holistically interpret the formation mechanisms of geothermal zones.
Author Contributions
Funding
Data Availability Statement
Acknowledgments
Conflicts of Interest
References
- Butuzov, V.A. Experience of the Development of Geothermal Energy on the Example of Iceland. Therm. Eng. 2023, 70, 701–710. [Google Scholar] [CrossRef]
- International Geothermal Association. Global Geothermal Resource Database. Available online: https://worldgeothermal.org/geothermal-data/geothermal-energy-database (accessed on 3 July 2025).
- Ma, B.; Jia, L.X.; Yu, Y.; Wang, H. The development and utilization of geothermal energy in the world. China Geol. 2021, 48, 1734–1747. [Google Scholar]
- Jin, W.Z. Structural Characteristics of Faults in Eryuan County, Yunnan Province and Their Control on Geothermal Resources. Carsologica Sin. 2024, 43, 57–71. [Google Scholar]
- Chen, C.X.; Yan, J.Y.; Zhou, W.Y.; Wang, Z.H.; Zhang, D.L. Current Status and Prospects of Geothermal Geophysical Exploration. Prog. Geophys. 2020, 35, 1223–1231. [Google Scholar] [CrossRef]
- Ma, J.; Wang, X.G.; Liu, M.M.; Wu, Z.; Guo, H.; Zhang, L. Application Summary of Comprehensive Geophysical Methods in Exploration of Geothermal Resources in Middle and Deep Layers. Miner. Explor. 2024, 15, 623–633. [Google Scholar]
- García, B.; Guevara-Pillaca, C.J.; Unsworth, M.; Pereyra, P.; Benavente, C.; Combey, A.; Palacios, D.; Palomino, A.; Ponce, R.; Rosell, L.; et al. Locating active faults in the Cusco Valley using magnetotelluric and radon gas data. Tectonophysics 2025, 898, 230639. [Google Scholar] [CrossRef]
- Chen, Z.; Li, Y.; Liu, Z.F.; Wang, J.; Zhou, X.C.; Du, J.G. Radon emission from soil gases in the active fault zones in the Capital of China and its environmental effects. Sci. Rep. 2018, 8, 16772. [Google Scholar] [CrossRef]
- Benà, E.; Ciotoli, G.; Ruggiero, L.; Coletti, C.; Bossew, P.; Massironi, M.; Mazzoli, C.; Mair, V.; Morelli, C.; Galgaro, A.; et al. Evaluation of tectonically enhanced radon in fault zones by quantification of the radon activity index. Sci. Rep. 2022, 12, 21586. [Google Scholar] [CrossRef] [PubMed]
- Wang, A.D.; Sun, Z.X.; Lin, W.J.; Yang, N.; Ye, H.L.; Tong, J.; Wang, Y. Occurrence features of geothermal resources and geothermal potential assessment of Jiangxi Province. China Geol. 2023, 50, 1646–1654. [Google Scholar]
- Yuan, J.; Chen, Y.; Tang, C.H.; Sun, C.; Wan, S.; Qian, Z.J.; Tang, X.; Wang, M.Y. Remote sensing geothermal GIS prediction method—A case study in Ningdu City, Jiangxi Province. Resour. Surv. Environ. 2023, 44, 424–438. [Google Scholar] [CrossRef]
- Liu, F.; Wang, G.L.; Zhang, W.; Yue, C.; Gan, H.N.; Xiao, Z.Y.; Ou, X.K. Terrestrial heat flow and geothermal genesis mechanism of geothermal resources in northern Ningdu County, Jiangxi Province. Geol. Bull. China 2020, 39, 1883–1890. [Google Scholar]
- Chen, Q.L.; Hai, Y.; Yang, L.Y. An analysis on the thermal control structure and deep prospecting potential of luopi geothermal in Ningdu County, Jiangxi Province. J. Geol. Hazards Environ. Preserv. 2021, 32, 102–107. [Google Scholar]
- Li, J.H. A discussion on the symbolic role of secondary fault structure in geothermal prospecting in southern mountainous areas—To take the longgui mountain geothermal field in Ningdu County, Jiangxi Province as an example. J. Geol. Hazards Environ. Preserv. 2019, 30, 85–90. [Google Scholar]
- Liu, W.; Huang, Y.-C.Y.; Fan, C. Geological characteristics and resource evaluation of Pixia geotherm in Ningdu County, Jiangxi Province. Resour. Surv. Environ. 2020, 41, 375–380. [Google Scholar] [CrossRef]
- Yang, M.G.; Wang, K. The geological tectonic framework and the crustal evolution in Jiangxi province. Jiangxi Geol. 1994, 04, 239–251. [Google Scholar]
- Bureau of Geology and Mineral Exploration and Development of Jiangxi Province. Regional Geology of China Jiangxi Province; Geological Publishing House: Beijing, China, 2017. [Google Scholar]
- Li, X.L.; Yang, Z.Y. Analysis on the geological structure conditions formed in Jiangxi hot-spring. J. East China Geol. Inst. 1992, 15, 221–228. [Google Scholar]
- Huang, Q.W. Geochemical Characteristics of Jiangxi Geothermal. Master’s Thesis, East China University of Technology, Nanchang, China, 2021. [Google Scholar]
- Qin, Q.J.; Liu, J.H.; Ye, H.L.; Bai, X.M.; Wan, P.Q. Characteristics and genesis of mesothermal geothermal water in Tanghu, Suichuan and Lantian, Ningdu, Jiangxi Province. Geol. Rev. 2025, 71, 511–523. [Google Scholar] [CrossRef]
- Liu, D.Q. The combined electrical resistivity method applied in exploration of fracture zone in the fault of a reservoir dam area. Shanxi Hydrotech. 2016, 3, 27–29. [Google Scholar]
- Liu, G.W.; Yang, X.M.; Cui, X. Application of ground penetration radar and apparent resistivity combined profiling in subway investigation. Urban Rapid Rail Transit 2020, 33, 104–108. [Google Scholar]
- Gong, D.P. Method of conventional combined profiling by high density electric prospecting system. Site Investig. Sci. Technol. 2002, 5, 58–61. [Google Scholar]
- Ji, X.K.; Bai, Y.; Guo, W.L. Application of resistivity sounding method in investigation and evaluation of groundwater in Qaidam basin. Ground Water 2017, 39, 13–15. [Google Scholar]
- Moreno, V.; Bach, J.; Zarroca, M.; Font, L.; Roqué, C.; Linares, R. Characterization of radon levels in soil and groundwater in the North Maladeta Fault area (Central Pyrenees) and their effects on indoor radon concentration in a thermal spa. J. Environ. Radioact. 2018, 189, 1–13. [Google Scholar] [CrossRef]
- Nurohman, H.; Nugraha, E.D.; Iskandarsyah, T.Y.W.; Hendarmawan, H. Investigation on radon levels in soil and water associated with Mount Tampomas geothermal activity in Indonesia. Radiat. Med. Prot. 2024, 5, 248–253. [Google Scholar] [CrossRef]
- Sun, J.L.; Liu, K.; He, Q.C.; Yu, T.X.; Deng, Y.F. Thermal infrared remote sensing and soil gas radon for detecting blind geothermal area. Geothermics 2022, 105, 102534. [Google Scholar] [CrossRef]
- Ghose, D.; Paul, D.; Sastri, R.C. Radon as a tracer for helium exploration in geothermal areas. Radiat. Meas. 2003, 36, 375–377. [Google Scholar] [CrossRef]
- Chen, X.Q.; Chen, J.; Luo, X.R.; Ou-Yang, F.; Wen, M.L. The tentative application of the geogas(radon) measuring method to the prospecting for concealed ore-bearing fractures. Geophys. Geochem. Explor. 2011, 35, 817–820. [Google Scholar]
- Seyis, C.; İnan, S.; Streil, T. Ground and indoor radon measurements in a geothermal area. Acta Geophys. 2010, 58, 939–946. [Google Scholar] [CrossRef]
- Liang, Y.D.; Ren, K.H.; Jiang, X.; Ding, B.Y.; Tong, P.X.; Hu, P.Q. Application of the activated charcoal radon measurement in the geothermal exploration: A study of the Zhangye-Minle basin. Geophys. Geochem. Explor. 2022, 46, 1419–1424. [Google Scholar]
- Gan, F.P.; Lv, Y.; Yu, L.P.; Chen, Y.X. The utilization of combined radon and CSAMT methods to detect underground geological structures: A case study of detection in Palian and Fapa profiles, Luxi area, western Yunnan Province. Geol. Bull. China 2012, 31, 389–395. [Google Scholar]
- Zhao, H.Y.; Li, X.L.; Cui, Y.L. Application of CSAMT combined with radon measurement in a geothermal exploration in jilin province. Site Investig. Sci. Technol. 2022, 5, 61–64. [Google Scholar]
- Gu, Y.; Ge, L.Q.; Wang, G.X.; Jiang, H.J.; Zeng, B.; Zhang, Z. Analysis and evaluation of faults activities in Chengdu region with radon concentration measurements after Wenchuan earthquake. J. Eng. Geol. 2009, 17, 296–300. [Google Scholar]
- Li, Q.; Xiao, Y.F.; Xu, X.; Zhao, Z.L.; Zhan, J. Application of Radon Measurement in Geothermal Resources Exploration of Jiayu County. Resour. Environ. Eng. 2019, 33, 541–546. [Google Scholar]
- Zhang, K.; Lin, N.T.; Wan, X.L.; Yang, J.Q.; Wang, X.D.; Tian, G.P. An approach for predicting geothermal reservoirs distribution using wavelet transform and self-organizing neural network: A case study of radon and CSAMT data from Northern Jinan, China. Geomech. Geophys. Geo-Energy Geo-Resour. 2022, 8, 156. [Google Scholar] [CrossRef]
- Wang, J.; Liu, C.F.; Chen, Z.; Zhang, Z.X.; Zhang, F.; Zhang, S.X. Geochemical characterization and implications of soil gas and geothermal fluids in the fault zone of Xiongan new area. Appl. Geochem. 2024, 161, 105886. [Google Scholar] [CrossRef]
- Jia, W.Y.; Tang, H.; Ge, J.W.; Fang, F. Radon measurement and its application to groundwater and geothermal prospecting as well. as to engineering geology. Geophys. Geochem. Explor. 1987, 5, 339–347. [Google Scholar]
- Luo, H.; Liu, Z.W.; Guo, Q.H. Optimization in quantitative measurement of soil radon and its application in identification of low-medium temperature convective. Sci. China Earth Sci. 2025, 50, 1559–1574. [Google Scholar]
- Guo, P.W.; Wang, F. Application of soil radon measurement in mine fracture investigation. World Nonferrous Met. 2021, 6, 153–154. [Google Scholar]
- Ma, T.T.; Que, Z.S. Robustness Analysis and Application of Methods for Estimating the Background Value and Anomaly Threshold of Radon Concentration in Urban Soil Based on Different Survey Scales. Radiat. Prot. Commun. 2023, 43, 29–34. [Google Scholar]
- Li, J.H.; Li, F.Q.; Fan, J.M. Statistics; Nanjing University Press: Nanjing, China, 2020. [Google Scholar]
- Liu, J.H. Numerical Simulation, Inversion Fitting of Radon Migration in the Overburden above Active Fault. Ph.D Thesis, Jilin University, Jilin, China, 2006. [Google Scholar]


| Sampling Location | Number of Samples | U | Th | K (10%) | Radioactive Heat Generation Rate (μW/m3) | Mean |
|---|---|---|---|---|---|---|
| Ningdu | NDZK1-1 | 7.5 | 24.48 | 3.38 | 3.87 | 5.32 |
| NDZK1-2 | 7.71 | 15.38 | 4.21 | 3.35 | ||
| NDZK1-3 | 8.19 | 32.68 | 3.02 | 4.58 | ||
| NDZK1-4 | 14.6 | 31.21 | 4.32 | 6.2 | ||
| NDZK1-5 | 18.49 | 40.13 | 4.25 | 7.73 | ||
| NDZK1-6 | 10.22 | 37.54 | 2.72 | 5.44 | ||
| NDZK1-7 | 10.56 | 35.12 | 4.04 | 5.45 | ||
| NDZK1-8 | 8.88 | 46.98 | 4.39 | 5.94 |
| Quaternary Remnant Slope Deposited Silty Clay | Granite | Fault Fracture Zone | |
|---|---|---|---|
| Resistivity (Ω·M) | 20–200 | 500–2000 | 300–500 |
| Type of Fault | Soil Radon Profile Morphology |
|---|---|
| Gently dipping fault | Presenting multi-peak anomalies with significant amplitude fluctuations, and reflecting intersecting fracture networks. |
| Steep dip fault | Displaying asymmetric unimodal anomalies, characterized by gentler gradient transitions on the down-dip flank. |
| Vertical fault | Producing symmetrical unimodal anomalies with steep gradient boundaries. |
| Depth Measurement Point | Detection Depth | Lower Bedrock | Strong Regolith Depth | Bedrock Fracture |
|---|---|---|---|---|
| 37/1 line | 280 m | granite | 5–12 m | 35–115 m and 280 m |
| 27/2 line | 210 m | granite | 5–15 m | 60–125 m |
| 37/4 line | 210 m | granite | 10–40 m | 60–90 m and 140 m |
| Section Number | Concentration Value Range | Mean | Variance | Background Value | Abnormal Lower Limit | Number of Outliers Exceeded |
|---|---|---|---|---|---|---|
| S1 | 1890–101,000 | 14,405.42 | 12,511.58 | 25,806 | 51,695 | 4 |
| S2 | 8140–68,600 | 31,725 | 19,370.43 | 4 | ||
| S3 | 8800–55,800 | 29,900 | 20,390.4 | 3 | ||
| S4 | 1090–53,300 | 14,405.42 | 12,511.58 | 1 | ||
| S5 | 2291–132,000 | 36,913.40 | 41,475.68 | 3 | ||
| Total | 1090–132,000 | 25,806.32 | 25,889.03 | 15 |
Disclaimer/Publisher’s Note: The statements, opinions and data contained in all publications are solely those of the individual author(s) and contributor(s) and not of MDPI and/or the editor(s). MDPI and/or the editor(s) disclaim responsibility for any injury to people or property resulting from any ideas, methods, instructions or products referred to in the content. |
© 2025 by the authors. Licensee MDPI, Basel, Switzerland. This article is an open access article distributed under the terms and conditions of the Creative Commons Attribution (CC BY) license (https://creativecommons.org/licenses/by/4.0/).
Share and Cite
Zhang, Y.; Chen, G.; Ye, H.; Bai, X. Integrated Application of Radon Measurement and Conventional Electrical Prospecting in Geothermal Exploration: A Case Study of Lantian Section, Ningdu, Jiangxi Province. Geosciences 2025, 15, 286. https://doi.org/10.3390/geosciences15080286
Zhang Y, Chen G, Ye H, Bai X. Integrated Application of Radon Measurement and Conventional Electrical Prospecting in Geothermal Exploration: A Case Study of Lantian Section, Ningdu, Jiangxi Province. Geosciences. 2025; 15(8):286. https://doi.org/10.3390/geosciences15080286
Chicago/Turabian StyleZhang, Yingying, Gongxin Chen, Hailong Ye, and Ximin Bai. 2025. "Integrated Application of Radon Measurement and Conventional Electrical Prospecting in Geothermal Exploration: A Case Study of Lantian Section, Ningdu, Jiangxi Province" Geosciences 15, no. 8: 286. https://doi.org/10.3390/geosciences15080286
APA StyleZhang, Y., Chen, G., Ye, H., & Bai, X. (2025). Integrated Application of Radon Measurement and Conventional Electrical Prospecting in Geothermal Exploration: A Case Study of Lantian Section, Ningdu, Jiangxi Province. Geosciences, 15(8), 286. https://doi.org/10.3390/geosciences15080286