Abstract
Carbon isotopes in magmatic systems serve as powerful tracers for understanding magma evolution, mantle processes, the deep carbon cycle, and the origin of Earth’s carbon. This review provides a comprehensive overview of carbon isotope measurements and behavior in magmatic systems, highlighting recent technological advancements and scientific insights. We begin by examining methods for measuring δ13C in volcanic gases, vesicles, glasses, melt, and fluid inclusions. We then explore the behavior of carbon isotopes in magmatic systems, especially during magmatic degassing. Finally, we evaluate what recent advances mean for our understanding of the carbon isotope signature of the Earth’s upper mantle.
1. Introduction
Magmatic processes have been instrumental in shaping Earth’s history, from planetary accretion and differentiation to whole-mantle convection, plate tectonics, and atmospheric degassing. Investigating the behavior of carbon isotopes in magmatic systems offers valuable insights into these fundamental processes. Carbon possesses two stable isotopes, 12C and 13C, with natural abundances of approximately 98.9% and 1.1%, respectively. The large relative mass difference of about 8% between these isotopes can be expected to result in measurable fractionation during magmatic processes, making carbon isotopes an effective tracer for studying the Earth’s interior and the carbon cycle.
Carbon isotope data are reported as δ13C values, which represent the deviations in parts per thousand (‰) of the 13C/12C ratio of a sample from that of the Pee Dee Belemnite (PDB) standard (from the Upper-Cretaceous Peedee Formation of South Carolina). The δ13C value is defined as follows:
A negative δ13C value indicates that the sample is depleted in 13C relative to the PDB standard. Conversely, a positive δ13C value signifies enrichment in 13C relative to the PDB standard. Early research on carbon isotopes in geological and biological materials [1] revealed a wide range of isotopic signatures, with δ13C values spanning from +10 to −36‰. This diversity was partly attributed to variable isotope fractionation by living matter (see Degens [2] for a review of early studies). Soon after, distinct patterns emerged, with marine limestones clustering around δ13C = ~0‰, organic sediments around δ13C = ~−27‰, and carbonatites and diamonds around δ13C = ~−5‰ (e.g., Degens [2] and references therein). This tri-partite view of the isotopic signature of the carbonate, organic, and mantle reservoirs of carbon will have a profound influence on subsequent views of carbon in magmatic systems with variable contribution of these three reservoirs becoming the default interpretation for observed variations in the carbon isotopic composition of volcanic gases (e.g., Refs. [3,4]; see also compilation of literature data in Figure 1 of Deines [5]).
This review aims to synthesize the current state of knowledge on carbon isotopes in magmatic systems, highlight recent developments, and identify key areas for future research. We first give an overview of methods used to measure carbon isotopes in magmatic systems in the gas phase and the melt. We then look at experimental and theoretical constraints on the behavior of carbon isotopes in magmatic systems. Finally, we look at current constraints on the carbon isotopic signature of the upper mantle.
2. Carbon Isotope Measurements in Magmatic Systems
2.1. Carbon Isotope Measurements in Volcanic Gases
The study of carbon isotopes in volcanic gases began in the mid-20th century, coinciding with the development of isotope ratio mass spectrometry (IRMS). One of the earliest studies was conducted by Craig [1], who measured carbon isotopes in geothermal gases from Yellowstone National Park. In the second half of the 20th century, advances in IRMS technology enabled more precise measurements of δ13C in volcanic gases, and such measurements started being performed on volcanoes across the globe such as at Mauna Loa [6], Kilauea [6,7], Usu [8], Satsuma-Iojima [8], Erta’ Ale [9], Asal rift [10], Merapi [11], Momotombo [11], Vulcano [12], White Island [13], and Etna [14] volcanoes.
Table 1 shows a compilation of δ13C values obtained on high-temperature (>600 °C) volcanic gases by early studies. We focus on high-temperature volcanic gases as they are the most faithful representation of true magmatic gases (e.g., Refs. [15,16,17,18]). It is clear from this non-exhaustive compilation alone that the carbon isotopic composition in magmatic gases can vary widely (from −2.6 to −13.1‰). We explore the reason behind these variations in the next section, and first present the methodology used to collect and analyze these gases.

Table 1.
Early (1950s–1990s) C isotope measurements in high-temperature (>600 °C) volcanic gases.
2.1.1. Traditional Technique (Direct Sampling + IRMS)
The so-called “direct sampling” method for collecting volcanic gases was first developed by Charles Joseph Sainte-Claire Deville and Felix Leblanc [19,20] during their pioneering studies on Vesuvius, the Phlegraean Fields, Mount Etna, and the Aeolian Islands. Their approach involved using custom-made, pre-evacuated glass tubes, which they filled with volcanic gases by breaking the tubes open at the sampling site. After sealing the tubes, they transported them back to the laboratory for analysis. This foundational concept—filling a pre-evacuated container with volcanic gases—remains a cornerstone of volcanic gas sampling to this day.
In modern practice, the method has been refined but retains the same basic principle. A tube, typically made of titanium, stainless steel, or quartz, is inserted into a volcanic vent (such as a fumarole or skylight) to ensure that the sampled gases are uncontaminated by atmospheric air (Figure 1A). The volcanic gases are then flushed through the tube for approximately 10 min to purge any atmospheric gases from the sampling line. At the end of the tube, the gas is directed into a pre-evacuated sampling flask, usually made of glass or, for helium analysis, lead glass [21]. Once the flask is filled, it is sealed and transported to the laboratory for further analysis.
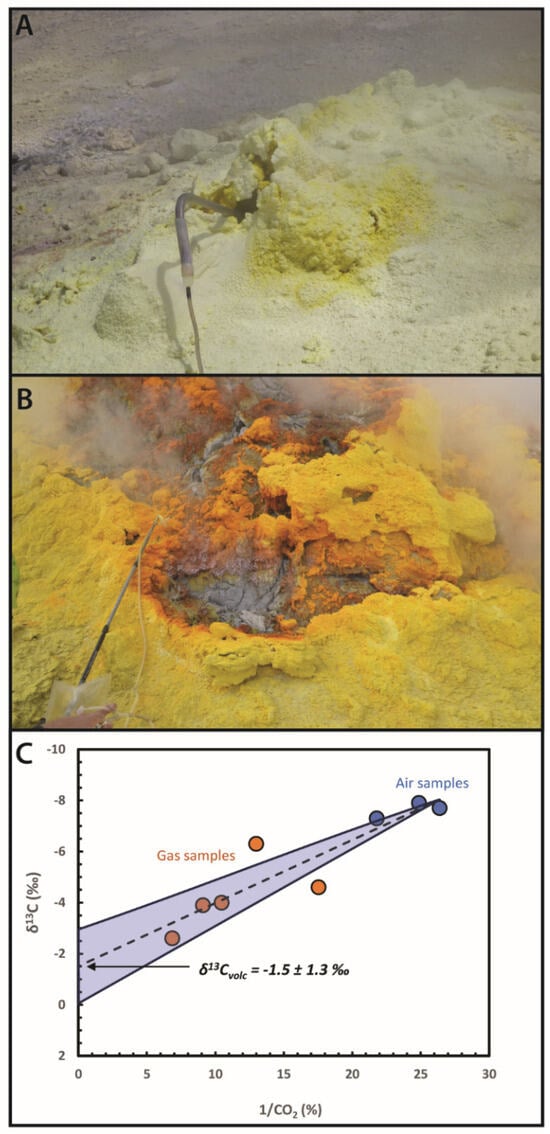
Figure 1.
(A) Direct sampling of volcanic gases from a fumarole at Isluga volcano (Northern Chile). A titanium tube is inserted into the fumarole to route volcanic gas, free of air contamination, to a sampling flask. (B) Dilute plume sampling at Lastarria volcano (northern Chile). Samples of volcanic gas, with varying levels of background air contamination, are collected in gas sampling bags and then directly analyzed using isotope ratio infrared spectroscopy (field photographs from the Trail by Fire expedition; https://www.trailbyfire.org/; accessed on 10 April 2025). (C). Plot of δ13C versus 1/CO2 in gas samples from the main plume of Mt. Etna, collected in 2008 and 2009 by Liotta et al. [22]. The dashed line represents the linear best-fit, intercepting the y-axis at the pure volcanic CO2 endmember. The blue shaded region indicates the 95% confidence interval for the extrapolation.
Before conducting isotope ratio mass spectrometry (IRMS) analysis, the volcanic gases must be purified to isolate CO2 for isotopic measurement. This purification is typically achieved using a vacuum extraction line, where CO2 is separated from other gases through cryogenic trapping and release. The purified CO2 is then analyzed for its carbon isotope ratio (δ13C) using IRMS, which remains the gold standard for high precision δ13C measurements.
2.1.2. Novel Approach (Dilute Samples + IRIS)
The traditional method of direct sampling involves collecting gas sampled directly from the volcanic vent. While this approach is effective, it poses significant risks due to the high concentration of volcanic hazards near the active vent. Several tragic incidents have highlighted these dangers, including the 14 January 1993 eruption of Galeras volcano, where six volcanologists on a gas sampling expedition and three tourists lost their lives [23]. Another limitation of the traditional method is that collection of gases free of any atmospheric contamination is not always feasible. In environments such as lava lakes or gas-filled craters, atmospheric dilution of the volcanic gases is inevitable.
In recent years, a novel approach using dilute gas sampling has emerged, reducing the need for close-proximity sampling and expanding the range of volcanoes suitable for carbon isotope measurements. This method employs the Keeling-plot technique [24], where volcanic gas samples, collected with variable amount of atmospheric air dilution, define a mixing line on a δ13C vs. 1/CO2 plot between pure ambient air CO2 and pure volcanic CO2 (Figure 1). The isotopic composition of the volcanic CO2 is then determined by the y-intercept of a linear best-fit through the data. When paired with isotope ratio infrared spectroscopy (IRIS), which saw the development of field-deployable instruments in the early 2000s, this approach can deliver real-time measurements. The technique was first successfully applied to high-temperature volcanic gases at Mt. Etna [22,25,26] and quickly gained popularity with measurements performed at Isluga [27], Lastarria [27], Turrialba [28], Aso [29], and Stromboli [30] volcanoes and during fissure eruptions in Iceland [31,32], in addition to systems emitting lower temperature volcanic gases [27,33,34].
A limitation of the Keeling-plot technique is that while it always provides a value for the δ13C of pure volcanic CO2, the reliability of this value is based on an extrapolation. Consequently, it is heavily influenced by the degree of dilution in the analyzed volcanic gas samples. Proper error propagation in the extrapolation is crucial, but it can result in such high uncertainties that the measurement becomes uninformative. For example, a study at Manam volcano reported a volcanic gas δ13C value of −4‰ ± 9.5‰, illustrating this issue [35]. Another limitation is the potential for contamination from sources other than background atmospheric CO2. Studies have reported contamination from car [26] and helicopter [33] exhaust as well as from CO2 emitted from local fires [31]. Additionally, CO2 produced by humans, animals, or plants in the vicinity can introduce contamination.
2.2. Carbon Isotope Measurements in Vesicles
Another approach to measuring the carbon isotopic composition of volcanic gases involves analyzing vesicles; gas bubbles trapped within solidified lava. This method, developed by Pineau et al. [36], involves crushing lava fragments containing gas inclusions under vacuum. In the original design, lava fragments were placed in stainless steel tubes. After evacuating the tubes, they were compressed using a press, and the released gases were collected in a vacuum line. The CO2 was purified in the same manner as described in the previous section for volcanic gas samples and then analyzed by IRMS. In subsequent work, the crushing procedure was refined. Lava fragments have been crushed using an electromagnetically operated piston [37] (which allows for progressive crushing) or a ball mill [38] while connected to a vacuum line. A cryogenic trap immediately collects the CO2 released, avoiding adsorption problems when the powder becomes very fine grained. An alternative approach to crushing for releasing and analyzing CO2 trapped in vesicles is via step-heating extraction, as described in the next section.
The study of carbon isotope in CO2 from vesicles has mostly focused on submarine and subglacial lavas as subaerial equivalents rarely retain entrapped gases. Measurements have been made at volcanoes in arc [38,39,40,41] and hotspot [42,43,44,45] contexts as well as mid-ocean ridges [36,37,46,47,48,49,50,51,52,53,54,55,56,57,58]. Measured δ13Cvesicle values range from −1 to −27‰ with a median of −6‰, an average of −7‰, and large overlaps between geodynamic contexts (Table 2).
Table 2.
Population statistics for δ13C measurements in natural vesicles and glasses. Vesicle data compiled from Refs. [36,37,38,39,40,41,42,43,44,45,46,47,48,49,50,51,52,53,54,55,56,57,58]. Glass data compiled from Refs. [37,40,43,44,50,51,55,56,57,59,60,61,62,63,64,65,66].
2.3. Carbon Isotope Measurements in Glasses and Melt Inclusions
2.3.1. Traditional Technique (Fusion-Extraction + IRMS)
Measuring the isotopic signature of carbon dissolved in silicate melts/glasses has proved a challenging endeavor. Early (1950s to 1980s) studies on carbon extraction from basalts all used a bulk heating/melting techniques whereby the entire sample was fused and the carbon released analyzed [1,47]. These studies systematically found low δ13C values that were later understood to be due to contamination. In 1984, the step-heating technique was introduced [48,59], revealing that previous bulk fusion methods had analyzed mixtures of three distinct carbon sources: surface contamination, vesicles, and dissolved carbon in the silicate glass. Since then, the step-heating technic has become the standard.
In this technique, a phenocryst-free glass fragment is weighted, cleaned (typically in dichloromethane but it should be noted that this substance is carcinogenic), and loaded onto the extraction part of a vacuum line typically made of fused quartz glass or any other material with a fusion point higher than that of the sample of interest. The system is then evacuated, and the sample is heated using an external resistance furnace. The heating is carried out in steps; no strict convention exists, but the sample will typically be heated to 400–600 °C first and then incrementally in ~100 °C steps until complete fusion (~1200 °C) (Figure 2). At each step, the CO2 released by the sample is extracted in the vacuum line. The gases released are first oxidized (via interaction with O2 produced by a copper oxide furnace), trapped in a liquid nitrogen trap, then transferred to a variable temperature trap, permitting CO2 to be released in isolation from all of the other gas species, its quantity measured (using manometry), and finally trapped in a sealed container that can be transferred to a mass spectrometer for isotopic analysis by IRMS.
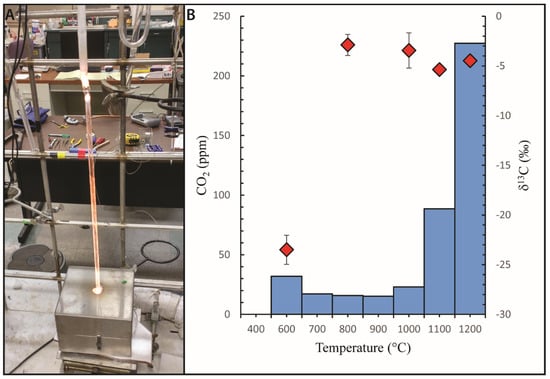
Figure 2.
(A) Fusion-extraction under vacuum. Sample contained in a fused quartz glass tube is heated in steps by an external resistance furnace. The CO2 released at each step is extracted via cryogenic trapping and released in the vacuum line prior to isotope ratio mass spectrometry analysis. (B) Carbon step-heating profiles for a natural basaltic glass (EPR-981-R23). The abundance (blue histogram) and δ13C values (red diamond symbols) of carbon released by each heating step are shown. Note the large difference in isotopic composition between the surficial contamination carbon released at 600 °C and the dissolved carbon released mostly at 1100 and 1200 °C. Carbon contained in the vesicles is expected to be released around the 800 to 900 °C steps (small or inexistant in this example). Extraction and analyses performed at Scripps Institution of Oceanography by the author.
The step-heating technique allows for the various sources of carbon that may be present in a sample to be released and analyzed independently. It was found that carbon released around 400 to 600 °C would typically be from organic carbon present as a contaminant on the sample surface. Organic carbon is so prevalent that it can be introduced at any point from the time a sample erupts until it undergoes analysis [48,50,59,67]. The subsequent heating steps from 700 to 900 °C, if they release significant amounts of CO2, are typically taken to represent the carbon present in vesicles [40,44,48,61]. The final heating steps, from 1000 to 1200 °C, release the dissolved carbon component (Figure 2).
The incremental step-heating technique has been highly successful, and until recently, was the sole source of data on the isotopic composition of carbon dissolved in silicate melts. Despite its effectiveness, the technique is time-consuming and resource intensive. Only three laboratories worldwide have developed extraction lines capable of performing these measurements in basaltic glasses: Royal Holloway University of London, Scripps Institution of Oceanography, and the Paris Institute of Planetary Physics (IPGP). Of these, only the line at IPGP remains functional to date.
2.3.2. Novel Approach (SIMS)
One of the most significant limitations of the fusion-extraction procedure is its destructive and bulk nature, despite being applicable to relatively small samples, just a few millimeters in diameter. This technique is also primarily limited to submarine or subglacial basalts, constraining our understanding of the carbon isotopic system in mafic melts to depths of up to 4000 m below sea level. This depth restriction is problematic because at such low pressures (around 40 MPa), most of the CO2 has already exsolved from the melt. Consequently, the δ13C values preserved in the glass and vesicles significantly deviate from those in equilibrium with the mantle, as discussed in Section 3.
Secondary Ion Mass Spectrometry (SIMS) is an in situ microanalytical technique that provides micron-scale spatial resolution, enabling analysts to avoid visibly altered or crystallized areas and assess sample homogeneity. The high sensitivity of SIMS makes it ideal for determining the concentrations and isotopic compositions of volatile elements such as hydrogen [68], oxygen [69], and sulfur [70] in silicate glasses. For carbon however, the low natural abundance of 13C and low abundance of CO2 in silicate glasses in general, together with difficulties in maintaining a low background signal have made its isotopic analyses particularly challenging.
The appeal of an in situ approach for measuring δ13C in glasses and melt inclusions that can preserve melts trapped at much greater depths is clear. Several secondary ion mass spectrometry laboratories have attempted to develop this technique. However, early efforts resulted in measurements with a very high uncertainty [71]. The development and characterization of a large set of standards together with the optimization of analytical conditions have recently led to a breakthrough in δ13C analyses in silicate glasses by SIMS [72]. The technique has now been applied to both melt inclusions [32,73] and natural glasses [74]. Natural glasses with CO2 contents as low as 67 ppm have been characterized with better than 0.8‰ precision (1σ) [74]. Natural melt inclusions with CO2 contents as low as 390 ppm have been characterized with better than 0.5‰ precision (1σ) [32].
The precision of isotopic measurements is fundamentally related to the number of counts (or ions) detected. The theoretical relationship can be understood through counting statistics, which are governed by Poisson statistics. The standard deviation (σ) of a Poisson distribution is the square root of the mean number of counts (N). Therefore, σ = √N. The relative standard deviation, which is our measure of precision, is given by the standard deviation divided by the mean number of counts: RSD = σ/N = 1/√N. If one wants to achieve a precision of ±0.5‰ on a δ13C analysis, a total of 4 million counts are needed on 13C (the number of count and precision on 12C will be far greater so the error on the ratio is dominated by the error on the 13C measurements). The results from Lee et al. [72] aligned well with these statistical expectation. Achieving the required number of counts for the desired precision can be accomplished through several methods. These include increasing the primary beam current, widening the field aperture, extending the counting time, or increasing the number of cycles. However, it is important to be aware that adjusting these parameters can have other consequences that may compromise the quality of the analysis. Increasing the beam current results in a larger crater size. Widening the aperture degrades signal quality by increasing background noise and reducing spatial resolution and exacerbating border effects as secondary ions near the sides of the crater are being collected. Additionally, an excessive counting time and number of cycles can exacerbate edge effects as the crater deepens.
The accuracy of isotopic measurements by SIMS is directly related to two key factors: (i) the characterization of reference materials, and (ii) the characterization of instrumental mass fractionation (IMF). IMF refers to the systematic bias or discrimination that occurs during the measurement of isotopic ratios due to instrumental and analytical conditions. This bias arises from variations in ionization and transmission efficiencies between isotopes, detector response, and matrix effects. Because IMF is dependent on analytical conditions, it must be characterized under the exact same conditions used to analyze unknown samples. Since the precision of an analysis is a function of the count rate, which is related to the CO2 content, reference materials should have CO2 contents similar to those of the unknown samples to ensure consistent analytical conditions. The study of Lee et al. [72] provided that; 31 reference silicate glasses of basaltic and basanitic compositions covering a wide range of CO2 concentrations (380–12,000 ppm) and δ13C values (−28.1 ± 0.2 to −1.1 ± 0.2‰, ±1σ) that were made available to the community.
A third critical factor is the background level during analysis. Characterizing the isotopic signature of the background signal is challenging, but assuming an organic signature around −25‰, measuring a silicate glass with 1000 ppm CO2 and a true δ13C value of −4‰ in an ion probe instrument with a background level equivalent to 50 ppm CO2 would yield a measured δ13C value of −5‰ for the sample. Therefore, ion probe instruments routinely analyzing C-rich phases or samples mounted in epoxy mounts should not be used for carbon isotope analyses in silicate glasses. With optimal instrumental conditions, background levels as low as 1 ppm equivalent can be achieved [74]. Finally, it is essential to ensure that no drift in IMF occurs over time to maintain measurement accuracy (Figure 3B).
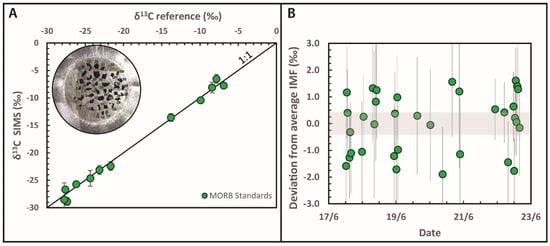
Figure 3.
(A). Comparison between IMF-corrected δ13C measurements obtained by secondary ion mass spectrometry and reference values for a suite of 11 synthetic and one natural MORB glass standards. Each point represents the average of 5 SIMS analyses, vertical error bars show the standard deviation on repeats. Data from Moussallam et al. [32]. Inset shows picture of the indium mount containing the 31 standards of Lee et al. [72] available at the CNRS-CRPG ion microprobe facility in Nancy (France) and soon to be available on loan from the Smithsonian National Museum of Natural History, (USA). (B) A total of 34 repeat analyses of natural basaltic glass standards during one week of analyses. Shaded grey area shows the 95% confidence interval on the average instrumental mass fractionation. Error bars indicate the analytical error on each individual measurement (1σ). Data from Moussallam et al. [74].
2.4. Carbon Isotope Measurements in Fluid Inclusions
2.4.1. Traditional Technique (Crushing-Extraction + IRMS)
Fluid inclusions are microscopic pockets of fluids trapped within minerals. The first carbon isotope measurements in fluid inclusions were conducted in the 1970s and 1980s, with studies primarily focusing on quartz [75,76,77], where fluid inclusions can be relatively large. The traditional method for CO2 extraction and isotopic analysis of fluid inclusions is similar to that used for vesicles and glass analyses. Both crushing and heating approaches have been employed. The heating approach for fluid inclusions differs slightly from glass analysis in that the required temperatures are generally lower. This method can be performed at a single temperature increment or in steps [78,79]. Similar to glass analyses, the lower temperature steps often reveal organic carbon contamination [80,81]. The crushing approach for fluid inclusions is identical to that described for vesicles. Minerals can be crushed using various methods including a manual crusher [81], a ball mill [79], an automated piston crusher [82], or other vacuum crushing systems [83]. All of these approaches can be applied to mineral separates or single crystals, but they remain bulk and destructive methods. Even within a single crystal, multiple populations of fluid inclusions may exist [84,85,86], complicating the interpretation of carbon isotope data obtained from bulk extraction.
2.4.2. Novel Approach (Raman Spectroscopy)
Measuring the isotopic composition of individual fluid inclusions without destroying the sample is possible using Raman spectroscopy, which can distinguish between peaks for 12CO2 and 13CO2 [87]. While the theoretical basis for such measurements is straightforward [88], it was only recently, in 2023, that the first successful measurements in natural fluid inclusions hosted in corundum [89], pyroxene [90], and olivine [90,91] were achieved.
However, carbon isotopic measurements in fluid inclusions remain challenging. Even when the areas under the 12CO2 and 13CO2 peaks can be accurately resolved, calibrating these area or intensity ratios is complex. This calibration depends on the pressure [92], temperature [93], and the isotopic composition itself [93]. Controlling temperature is particularly difficult, as the laser used in Raman spectroscopy can locally heat the inclusions, requiring additional corrections to ensure accurate measurements [91].
3. Carbon Isotope Behavior in Magmatic Systems
The temptation to look at the carbon isotopic signature of volcanic gases and compare it directly to that of the mantle or even to subducted carbon components for arc volcanoes has been a constant in the last 30 years [3,4]. Such an approach, however, blissfully ignores the multiple isotopic fractionation episodes that can occur as carbon changes forms on its journey in and out of the deep Earth.
3.1. Carbon Isotopic Fractionation During Degassing
3.1.1. Isotopic Fractionation Between CO2 Gas and Dissolved Carbon in Silicate Melts; The Javoy-Mattey Conundrum and Its Resolution
Differences in the δ13C values of coexisting vesicles and glass in submarine basalts provide direct evidence of local carbon isotope fractionation between the vapor and melt phases (e.g., [37,48,50,58,64]). Even before this realization, Javoy et al. (1978) [94] conducted an experimental study to determine the isotopic fractionation between dissolved carbon and CO2 gas in basaltic melts, reporting a fractionation (1000lnαgas-melt ≈ △13Ceq = δ13Cgas − δ13Cmelt) between 4.0 and 4.6‰. Twelve years later, similar experimental studies by Mattey et al. in sodamelilite and MORB compositions reported a much smaller fractionation coefficient, ranging from 1.8 to 2.7‰ [95,96].
The discrepancy between these two sets of experimental results has led to significant confusion in the literature on carbon isotopes in magmas over the past decades. Knowing the isotopic fractionation factor is crucial for interpreting δ13C measurements in volcanic gases or glasses, as discussed in the next section. Consequently, studies reporting such measurements have had to choose which fractionation coefficient to use. Some studies adopted values close to those determined by Javoy et al., around 4.3 to 4.5‰ [37,44,47], while others used values closer to those reported by Mattey et al., around 2.3 to 2.5‰ [40,43,65]. Some studies considered both estimates [45,64], and others used intermediate values around 3.3 to 3.5‰, based either on observed differences between vesicles and glass in natural samples [58] or on the experimentally determined fractionation coefficient between CO2 gas and carbonate melts [54,55,56,57,97]. A few studies even used entirely different values such as 1.5‰ [42].
In 2024, a new experimental study [98] measured the gas-melt carbon isotopic fractionation coefficient in silicate melts, but this time across a range of compositions, providing a clearer picture that reconciled almost all pre-existing experimental data within a single framework (Figure 4). The study found that the isotopic fractionation coefficient is strongly influenced by the melt composition, particularly the degree of polymerization (NBO/T, the ratio of non-bridging oxygens per tetrahedral cations). In highly polymerized melts (NBO/T ≈ 0), the isotope fractionation coefficient is 0‰, consistent with previous experiments in rhyolites [99]. In contrast, in depolymerized melts (NBO/T > 1), the fractionation coefficient is around 3 to 3.5‰, aligning with previous experiments in nephelinite [100] and natrocarbonatite [97]. For NBO/T values between 0 and 1, the experimental data define a trend consistent with the Mattey [95,96] experiments, best fitted by the equation 1000lnαg-m = 3.251 × NBO/T + 0.026, or alternatively, expressed using simply SiO2 and Al2O3, the two most abundant network forming cations, the equation becomes 1000lnαg-m = −0.087 × (SiO2 + Al2O3)wt% + 7.968 [98].
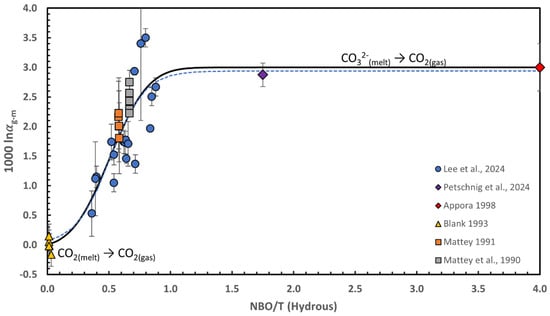
Figure 4.
Carbon isotope fractionation coefficient (1000lnαg–m) between CO2 gas and carbon dissolved in silicate melts as a function of NBO/T (the ratio of non-bridging oxygens per tetrahedral cations, calculated on a hydrous basis). Experimental data obtained at temperatures greater than 1170 °C from Refs. [95,96,98,99,100] are shown together with the fractionation coefficient at 1200 °C predicted by Appora [97] from extrapolation of their experiments in pure carbonatite at lower temperature. The carbon isotope fractionation coefficient can be predicted using an error function of the form , capturing the transition in the overall reaction from molecular CO2 in the melt going to CO2 in the gas, to CO32− in the melt going to CO2 in the gas, and which best fit to the experimental data is shown as the solid black curve. The dashed blue curve shows the best fit to the data using a sigmoidal function. Error bars on the experimental data are 1 sigma. The large error bar on one of the experiment from Lee et al. [98] is due to using the δ13C values of the glass measured by secondary ion mass spectrometry by Lee et al. [72].
The mechanism proposed by Lee et al. [98] to explain the transition in the isotope fractionation coefficient over a specific structural/compositional range has to do with carbon speciation in silicate melts. Carbon in silicate melts can exist as molecular CO2 or CO32− (carbonate ion). Spectroscopic studies in glasses have long shown that CO2 exists exclusively as molecular CO2 in rhyolite glasses and as CO32− in basaltic glasses and glasses of other silica-undersaturated magmas [101,102,103,104,105,106,107]. Multiple lines of evidence, however, from annealing experiments [108], molecular dynamics simulation studies [109,110], and in situ spectroscopy studies [111] have shown that in the melt (not the quenched glass), molecular CO2 is present even in basaltic and carbonated melt compositions. The CO32−/CO2 ratios in silicate melts is a function of polymerization, decreasing with increasing degree of polymerization. In a highly polymerized melt (NBO/T ≈ 0), all the carbon will be as molecular CO2, and the isotope fractionation coefficient between molecular CO2 in the melt and CO2 gas appears to be negligible, close to 0‰. In a depolymerized melt (NBO/T > 1), most (not quite all) of the carbon will be as CO32−, and the isotope fractionation coefficient between CO32− and CO2 gas appears close to ~3‰. In detail, CO32− first converts to molecular CO2 in the melt prior to going into the gas phase, and it is that first conversion which causes the heavy isotope (13C) to be preferentially converted to molecular CO2 and depleted in the CO32− remaining in the melt [98]. In the transition region (NBO/T values between 0 and 1), the isotope fractionation coefficient is hence simply a linear combination of the relative proportion of molecular CO2 in the melt going to CO2 gas and CO32− in the melt going to CO2 gas. An interesting implication of this theoretical framework is that the observed bulk isotopic fractionation coefficient should be indicative of the CO32−/CO2 ratio in the melt, potentially offering a novel approach to estimate this ratio.
Here, an alternative parametrization of the isotope fractionation coefficient as a function of melt polymerization is proposed to the one of Lee et al. [98]. The available experimental data were fitted with an error function of the form . An error function is appropriate to model the observed behavior in line with the theoretical expectation of a shift in reaction mechanisms (and reactant) as the melt composition changes. The best fit, obtained by minimizing the mean square error on 35 experimental data points, is shown in Figure 4, has a R2 of 0.82 and a standard deviation of ±0.4‰ (Figure S1), making it slightly better than the previous parametrization (which had a R2 of 0.74) and allowing for fitting of the entire compositional spectra with a single equation. Best fit parameters were , , , and . Several other functions could fit the experimental data just as well. The best fit of a sigmoidal function of the form similarly obtained by minimizing the mean square error on the 35 experimental data points, is shown in Figure 4, has a similar R2 of 0.82, and a similar standard deviation of ±0.4‰. Best fit parameters were , , and .
3.1.2. Degassing Styles and Carbon Isotope Evolution During Degassing
With a clear understanding of the carbon isotope fractionation coefficient, we can now calculate the evolution of the isotopic composition of both the melt and gas phases during degassing. CO2 degassing can occur in four distinct modes, depending on two key factors: (1) System behavior, whether the gas phase remains within the system or escapes (closed vs. open system degassing), and (2) diffusion dynamics, whether the diffusion of CO2 from the melt into the gas bubble is time-limited (equilibrium vs. kinetic degassing).
Closed system equilibrium degassing (batch degassing). In this scenario, the evolution of the melt’s δ13C is described by:
where δ13Cmelt is the δ13C of C dissolved in the melt, δ13Cinitial is the initial δ13C of C in the melt before degassing, F is the fraction of C remaining in the melt, and 1000lnαgas−melt is the carbon isotopic fractionation coefficient at equilibrium. The evolution of the gas δ13C can be calculated using:
δ13Cmelt = δ13Cinitial − (1 − F) 1000lnαgas−melt
δ13Cgas = 1000 lnαgas−melt + δ13Cmelt
Open system equilibrium degassing (Rayleigh distillation). For open system equilibrium degassing, also known as fractional equilibrium degassing, the evolution of the melt’s δ13C is given by:
δ13Cmelt = δ13Cinitial − 1000 (1 − Fα−1)
The evolution of the gas δ13C at any point can still be calculated with Equation (3).
Kinetic degassing. For both closed-system and open-system kinetic degassing, the evolution of the melt’s δ13C follows the same formulas as Equation (2) and Equation (4), respectively, and the evolution of the gas’ δ13C follows the same formula as Equation (3). However, the isotopic fractionation factor 1000 lnαgas−melt is replaced by the kinetic isotopic fractionation coefficient 1000lnαkinetic. According to Graham’s law of diffusion, this coefficient can be calculated as the square root of the inverse ratio of the molar masses of the diffusing species. This results in a kinetic isotopic fractionation coefficient of −8.2‰, if the diffusing species considered is CO32−, or −11.1‰, if the diffusing species considered is molecular CO2. It is important to note that although kinetic isotopic fractionation coefficients have been widely used to model observed degassing trajectories [32,37,56,66], they have yet to be experimentally validated.
Magmas can hence follow four main degassing paths, each with distinct isotopic evolutions (Figure 5). The specific path a degassing magma follows depends on several parameters including the magma ascent/decompression rate, bubble ascent rate, bubble number density, melt composition, volatile content, and temperature. As these parameters can change during magma ascent, the degassing path may consist of multiple stages with different degassing styles. For example, open-system degassing can occur after a stage of closed-system degassing, and kinetic degassing may follow a stage of equilibrium degassing. Most natural systems indeed show evidence of such complex, multi-stage, degassing [66].
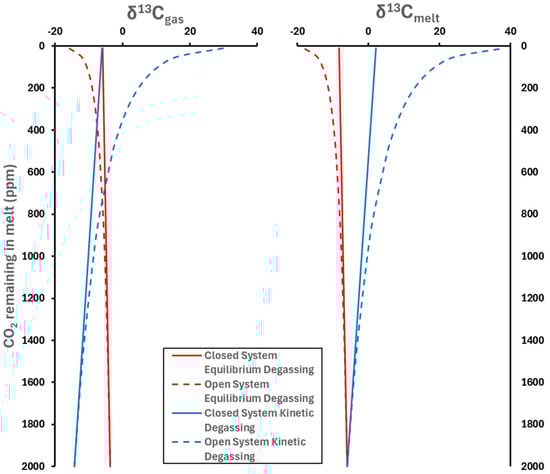
Figure 5.
Carbon isotopic evolution of the gas and melt phases during four possible degassing scenarios. A 1000lnαgas−melt of 2.3‰ and a 1000lnαkinetic of −8.2‰ were used. Starting conditions were δ13Cinitial = −6‰ and Cinitial = 2000 ppm CO2.
3.2. Isotopic Fractionation in Subduction and Mantle Processes
3.2.1. Isotopic Fractionation During Mantle Partial Melting
Isotopic fractionation during degassing has been a focal point of numerous studies because it is often an incomplete process, leading to significant isotopic variations in both the melt and gas phases (Figure 5). In contrast, any phase change reaction that runs to completion should not result in isotopic fractionation. Partial melting, at least batch melting, of the mantle is often considered such a reaction.
Carbon is present in the upper mantle primarily as carbonate minerals and elemental carbon (graphite or diamond) [112,113,114] as it enters the structure of common mantle silicate minerals in only extremely small quantities [115]. During partial melting, carbonate minerals are the first to melt, producing carbon-rich and silica-poor melts, even at very low degrees of partial melting [116,117,118,119,120,121]. Under the oxidized conditions of the upper mantle, diamond and graphite are unstable and will also melt entirely to form a carbonated melt [122,123,124]. Therefore, no isotopic fractionation is expected from the partial melting of the upper mantle, as all carbon is expected to transition into the melt phase.
Until recently, direct evidence of this absence of fractionation had been lacking. CO2-undersaturated melts, which have never reached saturation and thus never degassed CO2, are rare at the Earth’s surface [125,126,127,128]. One such series of melts (preserved as melt inclusions) from the Southwest Indian Mid-Ocean Ridge shows evidence of generation from varying degrees of partial melting [128]. Carbon isotopic measurements on these inclusions revealed no correlation between their δ13C values and major, trace, or volatile element abundances, nor with the degree of partial melting [73]. Both theoretical considerations and available empirical evidence thus indicate that there is no carbon isotopic fractionation during mantle partial melting.
3.2.2. Isotopic Fractionation During Slab Release and Diamond Formation
Subduction zones introduce carbon into the Earth’s mantle through various carbonate-bearing lithologies including pelagic marine sediments, variably altered oceanic crust, and hydrated subcrustal ultramafic rocks. The conditions under which these lithologies decarbonate and release their carbon into fluids that may migrate into the mantle wedge have been explored in numerous theoretical [129,130,131,132] and experimental [133,134,135] studies. However, the isotopic fractionation of carbon during this decarbonation process has not been investigated, either experimentally or theoretically. If decarbonation proceeds to completion, no fractionation is expected to occur. Rare field studies have documented instances where the δ13C of metasediments changes with metamorphic grade. A study of the δ13C of carbonaceous matter (metamorphosed organic matter) in metapelites from the Western Alps showed a strong increases (from around—24‰ to values as high as—10‰) with metamorphic grade, potentially reflecting partial loss of carbon to metamorphic fluids as methane [136,137]. Notwithstanding this field evidence, the extent to which isotopic fractionation occurs during slab fluid release remains poorly known. In addition to isotopic fractionation, we should consider that some subducted lithologies will decarbonate at lower pressure-temperature conditions than others, potentially changing the bulk δ13C of the downgoing slab and releasing fluids/melts with variable δ13C at different depths (Figure 6). Exactly which lithology decarbonates when is a complex function of pressure, temperature, and fluid infiltration [138,139,140,141].
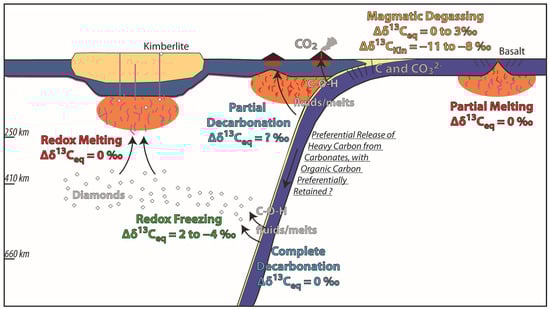
Figure 6.
Cartoon illustration of the multiple isotopic fractionation episodes that may influence the carbon isotopic composition as it transitions between solid, fluid, melt, and gas phases within the context of the deep carbon cycle.
Upon release, slab fluids can migrate into the mantle wedge. Partial melting of the mantle wedge is not expected to result in isotopic fractionation, as previously discussed for the partial melting of the mid-ocean ridge mantle [73], although direct evidence for this is still lacking. As magma migrates to the surface and undergoes partial to near-complete degassing of its initial CO2 concentrations, significant isotopic fractionation occurs, as outlined in the previous section. Additional processes, such as contamination of the melt through the assimilation of carbon-rich crustal components, may further modify its isotopic signature. Consequently, the carbon isotopic signatures of erupted products, including glasses (ranging from −34 to −3‰; Table 1) and gases (ranging from −14‰ [142] to +2‰ [143], with a mean of −5 ± 3‰ based on compiled literature data from 33 arc volcanoes) at arc volcanoes, are never a direct reflection of their source isotopic composition. This will remain the case until CO2-undersaturated melts can be identified in arc settings, which has yet to occur.
Slab fluids released deeper in the mantle, can potentially become trapped as diamonds through redox freezing. Understanding isotopic fractionation during this process is crucial for interpreting the isotopic composition of carbon in diamonds. Detailed examinations of the isotopic composition of carbon in diamonds have revealed zonation in δ13C values [144], either increasing [145,146,147] or decreasing [148] from core to rim. An increase in δ13C from core to rim is typically attributed to diamond formation from oxidized carbon sources, such as CO2 or carbonate, whereas a decrease suggests formation from reduced carbon sources like methane [149]. The isotopic fractionation coefficient in each scenario has been determined through both theoretical considerations [145,150,151,152,153,154] and experimental [155,156,157,158,159,160,161,162,163] studies and in the temperature range of diamond formation varies between.
1000lnαdiamond−CO2 ≈ −4‰ and 1000lnαdiamond−CH4 ≈ 2‰. Additionally, Rayleigh distillation processes, driven by fluid depletion and growth rate evolution, can significantly influence the isotopic composition of diamonds [164,165,166]. These processes highlight the complex interplay between carbon sources and fractionation mechanisms in the formation and isotopic signature of diamonds.
4. Carbon Isotope Signature of Earth’s Upper Mantle
4.1. Review of Available Evidence
Constraining the average carbon isotopic value of Earth’s convecting upper mantle, its variability, and its potential evolution through time is critical to understand carbon’s origin and its deep cycling. Multiple sample types can be used toward that aim including diamonds, kimberlites, carbonatites, popping rocks, CO2-undersaturated melts, and fluid and melt inclusions.
Diamonds have by far been the most studied sample type for carbon isotopes [1,167,168,169,170,171]. Their bulk δ13C signature ranges from −41.4‰ [172] to 2.7‰ [173]. A recent review compiled 4308 diamond δ13C analyses [165] and found, in line with previous studies [149], that peridotitic diamonds (n = 1906) formed a narrow distribution centered at −4.9 ± 1.9‰ [165]. This mode in the carbon population at −5‰ (Figure 7) has long been recognized and held as representing the carbon isotopic signature of the mantle [5,174].
Carbonatite and kimberlite melt can retain most of their initial CO2 contents until shallow depths [107,175]. As such, their δ13C signature may remain partly or entirely unchanged during ascent. A recent compilation of kimberlite δ13C measurements [176] shows a range from −8.9‰ to −3.4‰ with a mean at −5.5 ± 1.2‰. For carbonatites, data compiled from the GEOROC database (https://georoc.eu/; accessed on 17 March 2025) reveal δ13C signatures ranging from −12.1‰ to 3.5‰, with a mean of −4.2 ± 2.1‰ (Figure 7).
Mid-ocean ridge basalts are typically highly degassed by the time they reach the seafloor, resulting in carbon isotopic signatures ranging from −24‰ to −1‰ (Table 2), significantly modified by degassing. However, some MORB samples have either retained all of their exsolved CO2 in vesicles (known as “popping rock” samples [55,177,178]) or have never degassed any of their initial CO2 content [125,126,127,128]. Both sample types should hence retain the δ13C signatures they had at equilibrium with the mantle. While the two ‘popping rock’ samples analyzed record δ13C values close to −4‰ [55,177], the twelve CO2-undersaturated MORBs analyzed to date record a much larger range, from −10.5‰ to −3.6‰ [73,74]. Taken together, these data currently show a bi-modal distribution with the mode centered around −4‰ comprising all samples from the Mid-Atlantic Ridge, while the mode around −8‰ is representative of samples from the Indian, Arctic, and Pacific ridges [74].
Melt inclusion δ13C studies are still very few in number. Besides the ones on CO2-undersaturated MORBs [73,74], only a single study on the 2021 Fagradalsfjall eruption (Iceland) reported δ13C measurements in melt inclusions [32]. Because these melts are not CO2-undersaturated, however, the isotopic signature they had at mantle depth can only be estimated assuming a given initial CO2 concentration and degassing path (in this study, the δ13C signature of the Icelandic mantle was estimated to be −6.5 ± 2.5‰). Fluid inclusion δ13C studies will suffer from the same limitation, with the added caveat that most such studies to date are bulk, measuring all fluid inclusions in a crystal or batch of crystals at once. Most fluid inclusion studies in magmatic systems have focused on mantle xenolith. A compilation of recent fluid inclusions in xenolith studies from Stromboli [179], Fogo [180], La Palma [181], El Hierro [90,182], Piton de la Fournaise [183], and the Ethiopian Plateau [90] reveals a very wide range from −8.9‰ to 7.5‰, and a possible bi-modal distribution with modes around −7‰ and −2‰ (Figure 7, Table 3).


Figure 7.
Distribution in the carbon isotope composition (δ13C) of diamonds [165], kimberlites [176], carbonatites (GEOROC), CO2-undersaturated MORBs and popping rocks [74], and fluid inclusions in magmatic xenoliths. Histograms have a 1‰ binning interval, red curves show the kernel density estimation using Gaussian function and a bandwidth of 1.
Table 3.
Population statistics for δ13C measurements in natural diamonds, kimberlites, carbonatites, CO2-undersaturated MORBs and popping rocks, and fluid inclusions in magmatic xenoliths.
4.2. Carbon Isotope Signature of Earth’s Upper Mantle, Spatial, and Temporal Variability
From our review of available samples, it is evident that we cannot assign a single δ13C value to the Earth’s convecting mantle, particularly for the modern convecting mantle. The variability in diamond δ13C values has long been attributed to plate tectonics and the recycling of sedimentary carbon [171,184,185]. Multiple lines of evidence now indicate that the mantle is heterogeneous in its carbon isotopic signature; studies of fluid inclusions in xenoliths from active volcanic systems provide clear evidence of heavy δ13C values, interpreted as mantle contamination by recycled carbonates [179,181,182]. Zoned diamonds, which trap inclusions from both lower and upper mantle assemblages, record δ13C values ranging from −10.4‰ to 3.8‰ [186], indicating vertical heterogeneity in mantle δ13C values. Additionally, CO2-undersaturated melts and popping rocks from mid-ocean ridges worldwide exhibit δ13C values ranging from −10.5‰ to −3.6‰ [74], suggesting lateral heterogeneity in mantle δ13C values.
Has the Earth’s mantle always been heterogeneous in δ13C? If this heterogeneity is linked to plate tectonics and the recycling of sedimentary carbon, one might expect it to increase over time. This hypothesis has been suggested based on the age distribution of kimberlite δ13C values [176], but based on a skewed sample size distribution over time. While diamond formation ages remain unknown at many localities, compiling the available diamond δ13C isochron age data reveals that both the existence of variability in diamond δ13C values and the presence of a strong mode around −5‰ are features that have persisted over the last 3.5 Ga (Figure 8, see also Figure 7 in Howell et al. [187]). This brings into question the assumption that all heterogeneity in mantle δ13C values is due to subduction processes. In fact, Moussallam et al. [74] found that the carbon isotopic signature of CO2-undersatutated MORBs was uncorrelated with geochemical markers of contamination from subduction materials. The possibility of primordial heterogeneity in the mantle carbon isotopic signature should hence not be discarded.
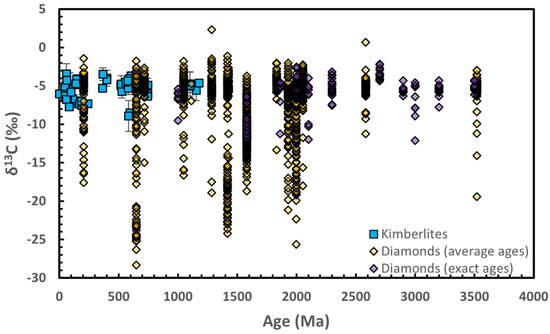
Figure 8.
Carbon isotope composition (δ13C) of diamonds [165,187] and kimberlites [176] as a function of age. For most diamond (yellow symbols) the age reported here is the average of the isochron ages reported by Smit et al. [188] and references therein for each locality in addition to ages reported in Chapman et al. [189] for the Argyle and in Timmerman et al. [190] for the Juína and Kankan diamond localities. In the study of Howell et al. [187] however (purple symbols) the δ13C values are from diamonds used to establish formation ages. Note that repeats are probable between the two diamond δ13C databases displayed.
5. Future Studies
The recent development of carbon isotopic analyses in individual melt inclusions by SIMS [32,72,73,74] and individual fluid inclusions by Raman spectroscopy [89,90,91] opens the door to a golden age for research on carbon isotopes in magmatic systems. These types of studies will greatly enhance the interpretation of carbon isotopic measurements in volcanic gases, which can now be made operationally from the main plume of active volcanoes. By tracking the degassing process, they will also improve our understanding of the styles of degassing taking place during magma ascent and their potential relation to eruption dynamics. Additionally, such studies will bring new constraints on the carbon isotopic composition of the mantle source of magmatic systems worldwide, from which a much clearer image of the isotopic composition and distribution of carbon in the modern upper mantle should emerge.
A number of critical questions remain that warrant further investigation to advance our understanding of carbon isotopes in magmatic systems. While the carbon isotopic fractionation factors during equilibrium degassing and diamond formation are now well-understood, the fractionation occurring during carbon release from the subducting slab remains poorly constrained. Additionally, the kinetic isotopic fractionation during magmatic degassing is currently only theoretically constrained and requires experimental validation. Further research is needed to determine the extent of the mantle’s heterogeneity in its carbon isotopic signature and to explore the temporal evolution of this heterogeneity over geological time. This investigation will help ascertain whether the observed heterogeneity is primarily or solely a result of subduction processes or if it reflects, in part, primordial variations in the mantle’s carbon isotopic signature. Finally, if we want to compare the carbon isotopic signature of the early Earth to that of other solar system bodies (meteorites, comets, planets, and the Sun) in an attempt to elucidate the provenance of carbon on Earth [191,192], we need to understand the carbon isotopic fractionation that occurred during planetary accretion, core formation, and the giant impact.
Supplementary Materials
The following supporting information can be downloaded at: https://www.mdpi.com/article/10.3390/geosciences15070266/s1, Figure S1: Comparison between predicted and measured carbon isotope fractionation coefficient (1000lnαg–m) between CO2 gas and carbon dissolved in silicate melts. A. Using the error function model. B. Using the sigmoidal function model.
Funding
This research was funded, in part, by US NSF award 2407264 to Y.M.
Conflicts of Interest
The author declares no conflict of interest.
References
- Craig, H. The Geochemistry of the Stable Carbon Isotopes. Geochim. Cosmochim. Acta 1953, 3, 53–92. [Google Scholar] [CrossRef]
- Degens, E.T. Biogeochemistry of Stable Carbon Isotopes. In Organic Geochemistry: Methods and Results; Eglinton, G., Murphy, M.T.J., Eds.; Springer: Berlin, Heidelberg, 1969; pp. 304–329. ISBN 978-3-642-87734-6. [Google Scholar]
- Sano, Y.; Marty, B. Origin of Carbon in Fumarolic Gas from Island Arcs. Chem. Geol. 1995, 119, 265–274. [Google Scholar] [CrossRef]
- Mason, E.; Edmonds, M.; Turchyn, A.V. Remobilization of Crustal Carbon May Dominate Volcanic Arc Emissions. Science 2017, 357, 290–294. [Google Scholar] [CrossRef]
- Deines, P. The Carbon Isotope Geochemistry of Mantle Xenoliths. Earth-Sci. Rev. 2002, 58, 247–278. [Google Scholar] [CrossRef]
- Naughton, J.J.; Terada, K. Effect of Eruption of Hawaiian Volcanoes on the Composition and Carbon Isotope Content of Associated Volcanic and Fumarolic Gases. Science 1954, 120, 580–581. [Google Scholar] [CrossRef]
- Gerlach, T.M.; Taylor, B.E. Carbon Isotope Constraints on Degassing of Carbon Dioxide from Kilauea Volcano. Geochim. Cosmochim. Acta 1990, 54, 2051–2058. [Google Scholar] [CrossRef]
- Sakai, H.; Matsubaya, O. Stable Isotopic Studies of Japanese Geothermal Systems. Geothermics 1977, 5, 97–124. [Google Scholar] [CrossRef]
- Allard, P.; Le Guern, F.; Sabroux, J.C. Thermodynamic and Isotopic Studies in Eruptive Gases. Geothermics 1977, 5, 37–40. [Google Scholar] [CrossRef]
- Allard, P. 13C/12C and 34S/32S Ratios in Magmatic Gases from Ridge Volcanism in Afar. Nature 1979, 282, 56–58. [Google Scholar] [CrossRef]
- Allard, P. The Origin of Water, Carbon, Sulphur, Nitrogen and Rare Gases in Volcanic Exhalations; Evidence from Isotope Geochemistry. In Forecasting Volcanic Events; Tazieff, H., Sabroux, J.C., Eds.; Elsevier: Amsterdam, The Netherlands, 1983; pp. 337–386. [Google Scholar]
- Shinohara, H.; Matsuo, S. Results of Analyses on Fumarolic Gases from F-1 and F-5 Fumaroles of Vulcano, Italy. Geothermics 1986, 15, 211–215. [Google Scholar] [CrossRef]
- Marty, B.; Giggenbach, W.F. Major and Rare Gases at White Island Volcano, New Zealand: Origin and Flux of Volatiles. Geophys. Res. Lett. 1990, 17, 247–250. [Google Scholar] [CrossRef]
- Allard, P.; Jean-Baptiste, P.; D’Alessandro, W.; Parello, F.; Parisi, B.; Flehoc, C. Mantle-Derived Helium and Carbon in Groundwaters and Gases of Mount Etna, Italy. Earth Planet. Sci. Lett. 1997, 148, 501–516. [Google Scholar] [CrossRef]
- Ellis, A.J. Chemical Equilibrium in Magmatic Gases. Am. J. Sci. 1957, 255, 416–431. [Google Scholar] [CrossRef]
- Elskens, I.; Tazieff, H.; Tonani, F. Investigations Nouvelles sur les Gaz Volcaniques. Bull. Volcanol. 1968, 32, 521–574. [Google Scholar] [CrossRef]
- Giggenbach, W.F. Chemical Composition of Volcanic Gases. In Monitoring and Mitigation of Volcano Hazards; Scarpa, R., Tilling, R.I., Eds.; Springer Nature: Dordrecht, The Netherlands, 1996; pp. 202–226. [Google Scholar]
- Symonds, R.B.; Gerlach, T.M.; Reed, M.H. Magmatic Gas Scrubbing: Implications for Volcano Monitoring. J. Volcanol. Geotherm. Res. 2001, 108, 303–341. [Google Scholar] [CrossRef]
- Sainte-Claire Deville, C.J. Mémoire sur les Emanations Volcaniques; Impr. L. Martinet: Paris, France, 1857. [Google Scholar]
- Sainte-Claire Deville, C.J.; Leblanc, F. Mémoire Sur la Composition Chimique Des Gaz Rejetés Par Les Events Volcaniques de L’Italie Méridionale; Mallet-Bachelier: Paris, France, 1858. [Google Scholar]
- Sano, Y.; Wakita, H. Geographical Distribution of 3He/4He Ratios in Japan: Implications for Arc Tectonics and Incipient Magmatism. J. Geophys. Res. Solid. Earth 1985, 90, 8729–8741. [Google Scholar] [CrossRef]
- Liotta, M.; Paonita, A.; Caracausi, A.; Martelli, M.; Rizzo, A.; Favara, R. Hydrothermal Processes Governing the Geochemistry of the Crater Fumaroles at Mount Etna Volcano (Italy). Chem. Geol. 2010, 278, 92–104. [Google Scholar] [CrossRef]
- Baxter, P.J.; Gresham, A. Deaths and Injuries in the Eruption of Galeras Volcano, Colombia, 14 January 1993. J. Volcanol. Geotherm. Res. 1997, 77, 325–338. [Google Scholar] [CrossRef]
- Keeling, C.D. The Concentration and Isotopic Abundances of Atmospheric Carbon Dioxide in Rural Areas. Geochim. Cosmochim. Acta 1958, 13, 322–334. [Google Scholar] [CrossRef]
- Rizzo, A.L.; Jost, H.-J.; Caracausi, A.; Paonita, A.; Liotta, M.; Martelli, M. Real-Time Measurements of the Concentration and Isotope Composition of Atmospheric and Volcanic CO2 at Mount Etna (Italy). Geophys. Res. Lett. 2014, 41, 2014GL059722. [Google Scholar] [CrossRef]
- Rizzo, A.L.; Liuzzo, M.; Ancellin, M.A.; Jost, H.J. Real-Time Measurements of δ13C, CO2 Concentration, and CO2/SO2 in Volcanic Plume Gases at Mount Etna, Italy, over 5 Consecutive Days. Chem. Geol. 2015, 411, 182–191. [Google Scholar] [CrossRef]
- Schipper, C.I.; Moussallam, Y.; Curtis, A.; Peters, N.; Barnie, T.; Bani, P.; Jost, H.J.; Hamilton, D.; Aiuppa, A.; Tamburello, G.; et al. Isotopically (δ13C and δ18O) Heavy Volcanic Plumes from Central Andean Volcanoes: A Field Study. Bull. Volcanol. 2017, 79, 65. [Google Scholar] [CrossRef]
- Malowany, K.S.; Stix, J.; de Moor, J.M.; Chu, K.; Lacrampe-Couloume, G.; Sherwood Lollar, B. Carbon Isotope Systematics of Turrialba Volcano, Costa Rica, Using a Portable Cavity Ring-down Spectrometer. Geochem. Geophys. Geosyst. 2017, 18, 2769–2784. [Google Scholar] [CrossRef]
- Shingubara, R.; Tsunogai, U.; Ito, M.; Nakagawa, F.; Yoshikawa, S.; Utsugi, M.; Yokoo, A. Development of a Drone-Borne Volcanic Plume Sampler. J. Volcanol. Geotherm. Res. 2021, 412, 107197. [Google Scholar] [CrossRef]
- D’Arcy, F.; Aiuppa, A.; Grassa, F.; Rizzo, A.L.; Stix, J. Large Isotopic Shift in Volcanic Plume CO2 Prior to a Basaltic Paroxysmal Explosion. Geophys. Res. Lett. 2024, 51, e2023GL107474. [Google Scholar] [CrossRef]
- Fischer, T.P.; Mandon, C.L.; Nowicki, S.; Ericksen, J.; Vilches, F.R.; Pfeffer, M.A.; Aiuppa, A.; Bitetto, M.; Vitale, A.; Fricke, G.M.; et al. CO2 Emissions during the 2023 Litli Hrútur Eruption in Reykjanes, Iceland: ẟ13C Tracks Magma Degassing. Bull. Volcanol. 2024, 86, 60. [Google Scholar] [CrossRef]
- Moussallam, Y.; Rose-Koga, E.F.; Fischer, T.P.; Georgeais, G.; Lee, H.J.; Birnbaum, J.; Pfeffer, M.A.; Barnie, T.; Regis, E. Kinetic Isotopic Degassing of CO2 During the 2021 Fagradalsfjall Eruption and the δ13C Signature of the Icelandic Mantle. Geochem. Geophys. Geosyst. 2024, 25, e2024GC011997. [Google Scholar] [CrossRef]
- Fischer, T.P.; Lopez, T.M. First Airborne Samples of a Volcanic Plume for δ13C of CO2 Determinations. Geophys. Res. Lett. 2016, 43, 2016GL068499. [Google Scholar] [CrossRef]
- D’Arcy, F.; de Moor, J.M.; Stix, J.; Alan, A.; Bogue, R.; Corrales, E.; Diaz, J.A.; Mick, E.; Salas-Navarro, J.; Lauzeral, R. New Insights into Carbon Isotope Systematics at Poás Volcano, Costa Rica. J. Volcanol. Geotherm. Res. 2022, 431, 107639. [Google Scholar] [CrossRef]
- Liu, E.J.; Aiuppa, A.; Alan, A.; Arellano, S.; Bitetto, M.; Bobrowski, N.; Carn, S.; Clarke, R.; Corrales, E.; de Moor, J.M.; et al. Aerial Strategies Advance Volcanic Gas Measurements at Inaccessible, Strongly Degassing Volcanoes. Sci. Adv. 2020, 6, eabb9103. [Google Scholar] [CrossRef] [PubMed]
- Pineau, F.; Javoy, M.; Bottinga, Y. 13C/12C Ratios of Rocks and Inclusions in Popping Rocks of the Mid-Atlantic Ridge and Their Bearing on the Problem of Isotopic Composition of Deep-Seated Carbon. Earth Planet. Sci. Lett. 1976, 29, 413–421. [Google Scholar] [CrossRef]
- Pineau, F.; Javoy, M. Strong Degassing at Ridge Crests: The Behaviour of Dissolved Carbon and Water in Basalt Glasses at 14°N, Mid-Atlantic Ridge. Earth Planet. Sci. Lett. 1994, 123, 179–198. [Google Scholar] [CrossRef]
- Nishio, Y.; Sasaki, S.; Gamo, T.; Hiyagon, H.; Sano, Y. Carbon and Helium Isotope Systematics of North Fiji Basin Basalt Glasses: Carbon Geochemical Cycle in the Subduction Zone. Earth Planet. Sci. Lett. 1998, 154, 127–138. [Google Scholar] [CrossRef]
- Alt, J.C.; Shanks, W.C.; Jackson, M.C. Cycling of Sulfur in Subduction Zones: The Geochemistry of Sulfur in the Mariana Island Arc and Back-Arc Trough. Earth Planet. Sci. Lett. 1993, 119, 477–494. [Google Scholar] [CrossRef]
- Macpherson, C.; Mattey, D. Carbon Isotope Variations of CO2 in Central Lau Basin Basalts and Ferrobasalts. Earth Planet. Sci. Lett. 1994, 121, 263–276. [Google Scholar] [CrossRef]
- Marty, B.; Sano, Y.; France-Lanord, C. Water-Saturated Oceanic Lavas from the Manus Basin: Volatile Behaviour during Assimilation–Fractional Crystallisation–Degassing (AFCD). J. Volcanol. Geotherm. Res. 2001, 108, 1–10. [Google Scholar] [CrossRef]
- Aubaud, C.; Pineau, F.; Hékinian, R.; Javoy, M. Degassing of CO2 and H2O in Submarine Lavas from the Society Hotspot. Earth Planet. Sci. Lett. 2005, 235, 511–527. [Google Scholar] [CrossRef]
- Aubaud, C.; Pineau, F.; Hékinian, R.; Javoy, M. Carbon and Hydrogen Isotope Constraints on Degassing of CO2 and H2O in Submarine Lavas from the Pitcairn Hotspot (South Pacific). Geophys. Res. Lett. 2006, 33. [Google Scholar] [CrossRef]
- Barry, P.H.; Hilton, D.R.; Füri, E.; Halldórsson, S.A.; Grönvold, K. Carbon Isotope and Abundance Systematics of Icelandic Geothermal Gases, Fluids and Subglacial Basalts with Implications for Mantle Plume-Related CO2 Fluxes. Geochim. Cosmochim. Acta 2014, 134, 74–99. [Google Scholar] [CrossRef]
- Graham, D.W.; Michael, P.J.; Truong, T.B. Carbon Isotope Composition of Basalts from Loihi Seamount: Primordial or Recycled Carbon in the Hawaiian Mantle Plume? Earth Planet. Sci. Lett. 2023, 617, 118248. [Google Scholar] [CrossRef]
- Moore, J.G.; Batchelder, J.N.; Cunningham, C.G. CO2-Filled Vesicles in Mid-Ocean Basalt. J. Volcanol. Geotherm. Res. 1977, 2, 309–327. [Google Scholar] [CrossRef]
- Pineau, F.; Javoy, M. Carbon Isotopes and Concentrations in Mid-Oceanic Ridge Basalts. Earth Planet. Sci. Lett. 1983, 62, 239–257. [Google Scholar] [CrossRef]
- Des Marais, D.J.; Moore, J.G. Carbon and Its Isotopes in Mid-Oceanic Basaltic Glasses. Earth Planet. Sci. Lett. 1984, 69, 43–57. [Google Scholar] [CrossRef]
- Marty, B.; Jambon, A. C3He in Volatile Fluxes from the Solid Earth: Implications for Carbon Geodynamics. Earth Planet. Sci. Lett. 1987, 83, 16–26. [Google Scholar] [CrossRef]
- Mattey, D.P.; Exley, R.A.; Pillinger, C.T. Isotopic Composition of CO2 and Dissolved Carbon Species in Basalt Glass. Geochim. Cosmochim. Acta 1989, 53, 2377–2386. [Google Scholar] [CrossRef]
- Jendrzejewski, N. Relations Entre Dynamique D’éruption et Géochimie Élémentaire et Isotopique Du Carbone et de L’eau Dans Les Basaltes de Rides. Ph.D. Thesis, Institut de physique du globe, Paris, France, 1994. [Google Scholar]
- Nishio, Y.; Ishii, T.; Gamo, T.; Sano, Y. Volatile Element Isotopic Systematics of the Rodrigues Triple Junction Indian Ocean MORB: Implications for Mantle Heterogeneity. Earth Planet. Sci. Lett. 1999, 170, 241–253. [Google Scholar] [CrossRef]
- Marty, B.; Zimmermann, L. Volatiles (He, C, N, Ar) in Mid-Ocean Ridge Basalts: Assesment of Shallow-Level Fractionation and Characterization of Source Composition. Geochim. Cosmochim. Acta 1999, 63, 3619–3633. [Google Scholar] [CrossRef]
- Cartigny, P.; Jendrzejewski, N.; Pineau, F.; Petit, E.; Javoy, M. Volatile (C, N, Ar) Variability in MORB and the Respective Roles of Mantle Source Heterogeneity and Degassing: The Case of the Southwest Indian Ridge. Earth Planet. Sci. Lett. 2001, 194, 241–257. [Google Scholar] [CrossRef]
- Pineau, F.; Shilobreeva, S.; Hekinian, R.; Bideau, D.; Javoy, M. Deep-Sea Explosive Activity on the Mid-Atlantic Ridge near 34°50′N: A Stable Isotope (C, H, O) Study. Chem. Geol. 2004, 211, 159–175. [Google Scholar] [CrossRef]
- Aubaud, C.; Pineau, F.; Jambon, A.; Javoy, M. Kinetic Disequilibrium of C, He, Ar and Carbon Isotopes during Degassing of Mid-Ocean Ridge Basalts. Earth Planet. Sci. Lett. 2004, 222, 391–406. [Google Scholar] [CrossRef]
- Cartigny, P.; Pineau, F.; Aubaud, C.; Javoy, M. Towards a Consistent Mantle Carbon Flux Estimate: Insights from Volatile Systematics (H2O/Ce, δD, CO2/Nb) in the North Atlantic Mantle (14° N and 34° N). Earth Planet. Sci. Lett. 2008, 265, 672–685. [Google Scholar] [CrossRef]
- Graham, D.W.; Michael, P.J.; Rubin, K.H. An Investigation of Mid-Ocean Ridge Degassing Using He, CO2, and δ13C Variations during the 2005–06 Eruption at 9°50′N on the East Pacific Rise. Earth Planet. Sci. Lett. 2018, 504, 84–93. [Google Scholar] [CrossRef]
- Mattey, D.P.; Carr, R.H.; Wright, I.P.; Pillinger, C.T. Carbon Isotopes in Submarine Basalts. Earth Planet. Sci. Lett. 1984, 70, 196–206. [Google Scholar] [CrossRef]
- Sakai, H.; Des Marais, D.J.; Ueda, A.; Moore, J.G. Concentrations and Isotope Ratios of Carbon, Nitrogen and Sulfur in Ocean-Floor Basalts. Geochim. Cosmochim. Acta 1984, 48, 2433–2441. [Google Scholar] [CrossRef] [PubMed]
- Exley, R.A.; Mattey, D.P.; Clague, D.A.; Pillinger, C.T. Carbon Isotope Systematics of a Mantle “Hotspot”: A Comparison of Loihi Seamount and MORB Glasses. Earth Planet. Sci. Lett. 1986, 78, 11. [Google Scholar] [CrossRef]
- Blank, J.G.; Delaney, J.R.; Marais, D.J.D. The Concentration and Isotopic Composition of Carbon in Basaltic Glasses from the Juan de Fuca Ridge, Pacific Ocean. Geochim. Cosmochim. Acta 1993, 57, 875–887. [Google Scholar] [CrossRef]
- Macpherson, C.G.; Hilton, D.R.; Newman, S.; Mattey, D.P. CO2, 13C/12C and H2O Variability in Natural Basaltic Glasses: A Study Comparing Stepped Heating and Ftir Spectroscopic Techniques. Geochim. Cosmochim. Acta 1999, 63, 1805–1813. [Google Scholar] [CrossRef]
- Macpherson, C.G.; Hilton, D.R.; Mertz, D.F.; Dunai, T.J. Sources, Degassing, and Contamination of CO2, H2O, He, Ne, and Ar in Basaltic Glasses from Kolbeinsey Ridge, North Atlantic. Geochim. Cosmochim. Acta 2005, 69, 5729–5746. [Google Scholar] [CrossRef]
- Shaw, A.M.; Hilton, D.R.; Macpherson, C.G.; Sinton, J.M. The CO2-He-Ar-H2O Systematics of the Manus Back-Arc Basin: Resolving Source Composition from Degassing and Contamination Effects. Geochim. Cosmochim. Acta 2004, 68, 1837–1855. [Google Scholar] [CrossRef]
- Aubaud, C. Carbon Stable Isotope Constraints on CO2 Degassing Models of Ridge, Hotspot and Arc Magmas. Chem. Geol. 2022, 605, 120962. [Google Scholar] [CrossRef]
- Exley, R.; Mattey, D.; Pillinger, C. Low Temperature Carbon Components in Basaltic Glasses—Reply to Comment by H. Craig. Earth Planet. Sci. Lett. 1987, 82, 387–390. [Google Scholar] [CrossRef]
- Hauri, E.H.; Shaw, A.M.; Wang, J.; Dixon, J.E.; King, P.L.; Mandeville, C. Matrix Effects in Hydrogen Isotope Analysis of Silicate Glasses by SIMS. Chem. Geol. 2006, 235, 352–365. [Google Scholar] [CrossRef]
- Eiler, J.M.; Graham, C.; Valley, J.W. SIMS Analysis of Oxygen Isotopes: Matrix Effects in Complex Minerals and Glasses. Chem. Geol. 1997, 138, 221–244. [Google Scholar] [CrossRef]
- Shimizu, K.; Ushikubo, T.; Murai, T.; Matsu’ura, F.; Ueno, Y. In Situ Analyses of Hydrogen and Sulfur Isotope Ratios in Basaltic Glass Using SIMS. Geochem. J. 2019, 53, 195–207. [Google Scholar] [CrossRef]
- Hauri, E.; Wang, J.; Dixon, J.E.; King, P.L.; Mandeville, C.; Newman, S. SIMS Analysis of Volatiles in Silicate Glasses: 1. Calibration, Matrix Effects and Comparisons with FTIR. Chem. Geol. 2002, 183, 99–114. [Google Scholar] [CrossRef]
- Lee, H.; Moussallam, Y.; Rose Koga, E.F.; Piani, L.; Villeneuve, J.; Bouden, N.; Gurenko, A.A.; Monteleone, B.; Gaetani, G.A. High–Precision Determination of Carbon Stable Isotope in Silicate Glasses by Secondary Ion Mass Spectrometry: Evaluation of International Reference Materials. Chem. Geol. 2024, 670, 122428. [Google Scholar] [CrossRef]
- Moussallam, Y.; Koga, K.T.; Rose–Koga, E.F.; Aubaud, C.; Lee, H.J.; Georgeais, G. The Carbon Isotopic Signature of the Upper Mantle Is Heterogeneous. Commun. Earth Environ. 2025, 6, 6. [Google Scholar] [CrossRef]
- Moussallam, Y.; Rose-Koga, E.F.; Aubaud, C.; Georgeais, G.; Cartigny, P.; Koga, K.T.; Devidal, J.-L.; Michael, P.J.; Shimizu, K.; Saal, A.E. Enigmatic Carbon Isotopic Variability in the Oceanic Upper Mantle. Proc. Natl. Acad. Sci. USA 2025, 122, e2502886122. [Google Scholar] [CrossRef]
- Hoefs, J. The Carbon Isotopic Composition of CO2 from Fluid Inclusions. Fortschr. Miner. 1975, 52, 475. [Google Scholar]
- Hoefs, J.; Touret, J. Fluid Inclusion and Carbon Isotope Study from Bamble Granulites (South Norway). Contr. Mineral. Petrol. 1975, 52, 165–174. [Google Scholar] [CrossRef]
- Jackson, D.H.; Mattey, D.P.; Harris, N.B.W. Carbon Isotope Compositions of Fluid Inclusions in Charnockites from Southern India. Nature 1988, 333, 167–170. [Google Scholar] [CrossRef]
- Hattori, K.; Sakai, H. D/H Ratios, Origins, and Evolution of the Ore-Forming Fluids for the Neogene Veins and Kuroko Deposits of Japan. Econ. Geol. 1979, 74, 535–555. [Google Scholar] [CrossRef]
- Kazahaya, K.; Matsuo, S. A New Ball-Milling Method for Extraction of Fluid Inclusions from Minerals. Geochem. J. 1985, 19, 45–54. [Google Scholar] [CrossRef]
- Nadeau, S.; Pineau, F.; Javoy, M.; Francis, D. Carbon Concentrations and Isotopic Ratios in Fluid-Inclusion-Bearing Upper-Mantle Xenoliths along the Northwestern Margin of North America. Chem. Geol. 1990, 81, 271–297. [Google Scholar] [CrossRef]
- Miller, M.F.; Pillinger, C.T. An Appraisal of Stepped Heating Release of Fluid Inclusion CO2 for Isotopic Analysis: A Preliminary to δ13C Characterisation of Carbonaceous Vesicles at the Nanomole Level. Geochim. Cosmochim. Acta 1997, 61, 193–205. [Google Scholar] [CrossRef]
- Luciani, N.; van der Lubbe, J.H.L.; Verdegaal-Warmerdam, S.J.A.; Postma, O.; Nikogosian, I.K.; Davies, G.R.; Koornneef, J.M. Carbon and Oxygen Isotope Analysis of CO2 Trapped in Silicate Minerals. Chem. Geol. 2022, 602, 120872. [Google Scholar] [CrossRef]
- Wilske, C.; Suckow, A.; Gerber, C.; Deslandes, A.; Crane, P.; Mallants, D. Mineral Crushing Methods for Noble Gas Analyses of Fluid Inclusions. Geofluids 2023, 2023, 8040253. [Google Scholar] [CrossRef]
- Roedder, E. Volume 12: Fluid Inclusions. Rev. Miner. 1984, 12, 644. [Google Scholar]
- Andersen, T.; Neumann, E.-R. Fluid Inclusions in Mantle Xenoliths. Lithos 2001, 55, 301–320. [Google Scholar] [CrossRef]
- Pineau, F.; Mathez, E.A. Carbon Isotopes in Xenoliths from the Hualalai Volcano, Hawaii, and the Generation of Isotopic Variability. Geochim. Cosmochim. Acta 1990, 54, 217–227. [Google Scholar] [CrossRef]
- Fermi, E. Über den Ramaneffekt des Kohlendioxyds. Z. Phys. 1931, 71, 250–259. [Google Scholar] [CrossRef]
- Cui, S.; Wang, W.; Cheng, C.; Yao, Y.; Qin, C.; Sun, Q. Raman Quantitative Measurement for Carbon Isotopic Composition of CO2: Theory and Method. Chem. Geol. 2021, 585, 120570. [Google Scholar] [CrossRef]
- Wang, W.; Lu, W. High-Precision Analysis of Carbon Isotopic Composition for Individual CO2 Inclusions via Raman Spectroscopy to Reveal the Multiple-Stages Evolution of CO2- Bearing Fluids and Melts. Geosci. Front. 2023, 14, 101528. [Google Scholar] [CrossRef]
- Remigi, S.; Frezzotti, M.-L.; Rizzo, A.L.; Esposito, R.; Bodnar, R.J.; Sandoval-Velasquez, A.; Aiuppa, A. Spatially Resolved CO2 Carbon Stable Isotope Analyses at the Microscale Using Raman Spectroscopy. Sci. Rep. 2023, 13, 18561. [Google Scholar] [CrossRef]
- Wang, H.; Lu, W.; Wang, W.; Liu, Q.; Yamamoto, J. High-Precision Analysis of Carbon Isotopic Composition for Individual CO2 Inclusions via Raman Spectroscopy: Addressing Issues Arising from the Laser-Heating Effects. Chem. Geol. 2024, 651, 122014. [Google Scholar] [CrossRef]
- Yokokura, L.; Hagiwara, Y.; Yamamoto, J. Pressure Dependence of Micro-Raman Mass Spectrometry for Carbon Isotopic Composition of Carbon Dioxide Fluid. J. Raman Spectrosc. 2020, 51, 997–1002. [Google Scholar] [CrossRef]
- Lu, W.; Wang, X.; Wan, Q.; Hu, W.; Chou, I.-M.; Wan, Y. In Situ Raman Spectroscopic Measurement of the 13C/12C Ratio in CO2: Experimental Calibrations on the Effects of Fluid Pressure, Temperature and Composition. Chem. Geol. 2023, 615, 121201. [Google Scholar] [CrossRef]
- Javoy, M.; Pineau, F.; Iiyama, I. Experimental Determination of the Isotopic Fractionation between Gaseous CO2 and Carbon Dissolved in Tholeiitic Magma. Contr. Mineral. Petrol. 1978, 67, 35–39. [Google Scholar] [CrossRef]
- Mattey, D.P.; Taylor, W.R.; Green, D.H.; Pillinger, C.T. Carbon Isotopic Fractionation between CO2 Vapour, Silicate and Carbonate Melts: An Experimental Study to 30 Kbar. Contr. Mineral. Petrol. 1990, 104, 492–505. [Google Scholar] [CrossRef]
- Mattey, D.P. Carbon Dioxide Solubility and Carbon Isotope Fractionation in Basaltic Melt. Geochim. Cosmochim. Acta 1991, 55, 3467–3473. [Google Scholar] [CrossRef]
- Appora Gnekindy, I. Etude Expérimentale Du Fractionnement Isotopique Du Carbone et de l’oxygène Dans Les Systèmes CO2-Carbonates Liquides: Application Aux Contextes Carbonatitiques. Ph.D. Thesis, Ministère chargé de l’Enseignement supérieur et de la Recherche, Paris, France, 1998. [Google Scholar]
- Lee, H.; Moussallam, Y.; Aubaud, C.; Iacono–Marziano, G.; Hammond, K.; Ebel, D. Carbon Isotope Fractionation between CO2 and Carbon in Silicate Melts at High Temperature. Geochim. Cosmochim. Acta 2024, 380, 208–219. [Google Scholar] [CrossRef]
- Blank, J.G. An Experimental Investigation of the Behavior of Carbon Dioxide in Rhyolitic Melt. Ph.D. Thesis, California Institute of Technology, Pasadena, CA, USA, 1993. [Google Scholar]
- Petschnig, P.; Schmidt, M.W.; Kueter, N.; Sartori, G.; Bernasconi, S.M. An Almost Universal CO2-CO32− Carbon Isotope Fractionation Function for High Temperatures. Earth Planet. Sci. Lett. 2024, 627, 118552. [Google Scholar] [CrossRef]
- Mysen, B.O.; Arculus, R.J.; Eggler, D.H. Solubility of Carbon Dioxide in Melts of Andesite, Tholeiite, and Olivine Nephelinite Composition to 30 Kbar Pressure. Contr. Mineral. Petrol. 1975, 53, 227–239. [Google Scholar] [CrossRef]
- Fine, G.; Stolper, E. Dissolved Carbon Dioxide in Basaltic Glasses: Concentrations and Speciation. Earth Planet. Sci. Lett. 1986, 76, 263–278. [Google Scholar] [CrossRef]
- Fine, G.; Stolper, E. The Speciation of Carbon Dioxide in Sodium Aluminosilicate Glasses. Contr. Mineral. Petrol. 1985, 91, 105–121. [Google Scholar] [CrossRef]
- Blank, J.G.; Brooker, R.A. Experimental Studies of Carbon Dioxide in Silicate Melts; Solubility, Speciation, and Stable Carbon Isotope Behavior. Rev. Mineral. Geochem. 1994, 30, 157–186. [Google Scholar]
- Fogel, R.A.; Rutherford, M.J. The Solubility of Carbon Dioxide in Rhyolitic Melts; a Quantitative FTIR Study. Am. Mineral. 1990, 75, 1311–1326. [Google Scholar]
- Giordano, D.; Romano, C.; Dingwell, D.B.; Poe, B.; Behrens, H. The Combined Effects of Water and Fluorine on the Viscosity of Silicic Magmas. Geochim. Cosmochim. Acta 2004, 68, 5159–5168. [Google Scholar] [CrossRef]
- Moussallam, Y.; Morizet, Y.; Massuyeau, M.; Laumonier, M.; Gaillard, F. CO2 Solubility in Kimberlite Melts. Chem. Geol. 2015, 418, 198–205. [Google Scholar] [CrossRef]
- Nowak, M.; Porbatzki, D.; Spickenbom, K.; Diedrich, O. Carbon Dioxide Speciation in Silicate Melts: A Restart. Earth Planet. Sci. Lett. 2003, 207, 131–139. [Google Scholar] [CrossRef]
- Guillot, B.; Sator, N. Carbon Dioxide in Silicate Melts: A Molecular Dynamics Simulation Study. Geochim. Cosmochim. Acta 2011, 75, 1829–1857. [Google Scholar] [CrossRef]
- Moussallam, Y.; Florian, P.; Corradini, D.; Morizet, Y.; Sator, N.; Vuilleumier, R.; Guillot, B.; Iacono-Marziano, G.; Schmidt, B.C.; Gaillard, F. The Molecular Structure of Melts along the Carbonatite–Kimberlite–Basalt Compositional Joint: CO2 and Polymerisation. Earth Planet. Sci. Lett. 2016, 434, 129–140. [Google Scholar] [CrossRef]
- Konschak, A.; Keppler, H. The Speciation of Carbon Dioxide in Silicate Melts. Contrib. Miner. Pet. 2014, 167, 1–13. [Google Scholar] [CrossRef]
- McGetchin, T.R.; Besancon, J.R. Carbonate Inclusions in Mantle-Derived Pyropes. Earth Planet. Sci. Lett. 1973, 18, 408–410. [Google Scholar] [CrossRef]
- Biellmann, C.; Gillet, P.; Guyot, F.; Peyronneau, J.; Reynard, B. Experimental Evidence for Carbonate Stability in the Earth’s Lower Mantle. Earth Planet. Sci. Lett. 1993, 118, 31–41. [Google Scholar] [CrossRef]
- Wang, A.; Pasteris, J.D.; Meyer, H.O.A.; Dele-Duboi, M.L. Magnesite-Bearing Inclusion Assemblage in Natural Diamond. Earth Planet. Sci. Lett. 1996, 141, 293–306. [Google Scholar] [CrossRef]
- Shcheka, S.S.; Wiedenbeck, M.; Frost, D.J.; Keppler, H. Carbon Solubility in Mantle Minerals. Earth Planet. Sci. Lett. 2006, 245, 730–742. [Google Scholar] [CrossRef]
- Wyllie, P.J.; Huang, W.-L. Carbonation and Melting Reactions in the System CaO–MgO–SiO2–CO2 at Mantle Pressures with Geophysical and Petrological Applications. Contr. Mineral. Petrol. 1976, 54, 79–107. [Google Scholar] [CrossRef]
- Eggler, D.H. The Effect of CO<2) upon Partial Melting of Peridotite in the System Na<2) O-CaO-Al<2) O<3) -MgO-SiO<2) -CO<2) to 35 Kb, with an Analysis of Melting in a Peridotite-H<2) O-CO<2) System. Am. J. Sci. 1978, 278, 305–343. [Google Scholar] [CrossRef]
- Wyllie, P.J. Origin of Carbonatites; Evidence from Phase Equilibrium Studies; Unwin Hyman: London, UK, 1989; pp. 500–545. ISBN 0-04-445068-0. [Google Scholar]
- Dalton, J.A.; Presnall, D.C. The Continuum of Primary Carbonatitic–Kimberlitic Melt Compositions in Equilibrium with Lherzolite: Data from the System CaO–MgO–Al2O3–SiO2–CO2 at 6 GPa. J. Petrol. 1998, 39, 1953–1964. [Google Scholar] [CrossRef]
- Gudfinnsson, G.H.; Presnall, D.C. Continuous Gradations among Primary Carbonatitic, Kimberlitic, Melilititic, Basaltic, Picritic, and Komatiitic Melts in Equilibrium with Garnet Lherzolite at 3–8 GPa. J. Petrol. 2005, 46, 1645–1659. [Google Scholar] [CrossRef]
- Dasgupta, R.; Hirschmann, M.M. Melting in the Earth’s Deep Upper Mantle Caused by Carbon Dioxide. Nature 2006, 440, 659–662. [Google Scholar] [CrossRef]
- Taylor, W.R.; Green, D.H. Measurement of Reduced Peridotite-C-O-H Solidus and Implications for Redox Melting of the Mantle. Nature 1988, 332, 349. [Google Scholar] [CrossRef]
- Foley, S.F. A Reappraisal of Redox Melting in the Earth’s Mantle as a Function of Tectonic Setting and Time. J. Petrol. 2010, 52, 1363–1391. [Google Scholar] [CrossRef]
- Rohrbach, A.; Schmidt, M.W. Redox Freezing and Melting in the Earth/’s Deep Mantle Resulting from Carbon-Iron Redox Coupling. Nature 2011, 472, 209–212. [Google Scholar] [CrossRef]
- Saal, A.; Hauri, E.; Langmuir, C.H.; Perfit, M. Vapour Undersaturation in Primitive Mid-Ocean-Ridge Basalt and the Volatile Content of Earth’s Upper Mantle. Nature 2002, 419, 451. [Google Scholar] [CrossRef]
- Michael, P.J.; Graham, D.W. The Behavior and Concentration of CO2 in the Suboceanic Mantle: Inferences from Undegassed Ocean Ridge and Ocean Island Basalts. Lithos 2015, 236–237, 338–351. [Google Scholar] [CrossRef]
- Le Voyer, M.; Kelley, K.A.; Cottrell, E.; Hauri, E.H. Heterogeneity in Mantle Carbon Content from CO2-Undersaturated Basalts. Nat. Commun. 2017, 8, 14062. [Google Scholar] [CrossRef]
- Moussallam, Y.; Georgeais, G.; Rose-Koga, E.F.; Koga, K.T.; Hartley, M.E.; Scaillet, B.; Oppenheimer, C.; Peters, N. CO2-Undersaturated Melt Inclusions From the South West Indian Ridge Record Surprisingly Uniform Redox Conditions. Geochem. Geophys. Geosyst. 2023, 24, e2023GC011235. [Google Scholar] [CrossRef]
- Kerrick, D.M.; Connolly, J.A.D. Metamorphic Devolatilization of Subducted Marine Sediments and the Transport of Volatiles into the Earth’s Mantle. Nature 2001, 411, 293–296. [Google Scholar] [CrossRef] [PubMed]
- Kerrick, D.M.; Connolly, J.A.D. Metamorphic Devolatilization of Subducted Oceanic Metabasalts: Implications for Seismicity, Arc Magmatism and Volatile Recycling. Earth Planet. Sci. Lett. 2001, 189, 19–29. [Google Scholar] [CrossRef]
- Kerrick, D.M.; Connolly, J.A.D. Subduction of Ophicarbonates and Recycling of CO2 and H2O. Geology 1998, 26, 375–378. [Google Scholar] [CrossRef]
- Gorman, P.J.; Kerrick, D.M.; Connolly, J.A.D. Modeling Open System Metamorphic Decarbonation of Subducting Slabs. Geochem. Geophys. Geosyst. 2006, 7. [Google Scholar] [CrossRef]
- Molina, J.F.; Poli, S. Carbonate Stability and Fluid Composition in Subducted Oceanic Crust: An Experimental Study on H2O–CO2-Bearing Basalts. Earth Planet. Sci. Lett. 2000, 176, 295–310. [Google Scholar] [CrossRef]
- Yaxley, G.M.; Green, D.H. Experimental Demonstration of Refractory Carbonate-Bearing Eclogite and Siliceous Melt in the Subduction Regime. Earth Planet. Sci. Lett. 1994, 128, 313–325. [Google Scholar] [CrossRef]
- Poli, S.; Franzolin, E.; Fumagalli, P.; Crottini, A. The Transport of Carbon and Hydrogen in Subducted Oceanic Crust: An Experimental Study to 5 GPa. Earth Planet. Sci. Lett. 2009, 278, 350–360. [Google Scholar] [CrossRef]
- Bebout, G.E.; Anderson, L.D.; Agard, P.; Bastoni, C.; Sills, G.; McCall, A.M. Retention of Metasedimentary Carbon during Subduction through Forearcs: Evidence from HP/UHP Rocks. AGU Fall Meet. Abstr. 2010, 2010, U21A-0004. [Google Scholar]
- Cook-Kollars, J.; Bebout, G.E.; Collins, N.C.; Angiboust, S.; Agard, P. Subduction Zone Metamorphic Pathway for Deep Carbon Cycling: I. Evidence from HP/UHP Metasedimentary Rocks, Italian Alps. Chem. Geol. 2014, 386, 31–48. [Google Scholar] [CrossRef]
- Farsang, S.; Louvel, M.; Zhao, C.; Mezouar, M.; Rosa, A.D.; Widmer, R.N.; Feng, X.; Liu, J.; Redfern, S.A.T. Deep Carbon Cycle Constrained by Carbonate Solubility. Nat. Commun. 2021, 12, 4311. [Google Scholar] [CrossRef]
- Tumiati, S.; Recchia, S.; Remusat, L.; Tiraboschi, C.; Sverjensky, D.A.; Manning, C.E.; Vitale Brovarone, A.; Boutier, A.; Spanu, D.; Poli, S. Subducted Organic Matter Buffered by Marine Carbonate Rules the Carbon Isotopic Signature of Arc Emissions. Nat. Commun. 2022, 13, 2909. [Google Scholar] [CrossRef]
- Arzilli, F.; Burton, M.; La Spina, G.; Macpherson, C.G.; van Keken, P.E.; McCann, J. Decarbonation of Subducting Carbonate-Bearing Sediments and Basalts of Altered Oceanic Crust: Insights into Recycling of CO2 through Volcanic Arcs. Earth Planet. Sci. Lett. 2023, 602, 117945. [Google Scholar] [CrossRef]
- Lan, C.; Tao, R.; Huang, F.; Jiang, R.; Zhang, L. High-Pressure Experimental and Thermodynamic Constraints on the Solubility of Carbonates in Subduction Zone Fluids. Earth Planet. Sci. Lett. 2023, 603, 117989. [Google Scholar] [CrossRef]
- Taran, Y.; Gavilanes, J.C.; Cortés, A. Chemical and Isotopic Composition of Fumarolic Gases and the SO2 Flux from Volcán de Colima, México, between the 1994 and 1998 Eruptions. J. Volcanol. Geotherm. Res. 2002, 117, 105–119. [Google Scholar] [CrossRef]
- Menyailov, I.A.; Nikitina, L.P.; Shapar, V.N.; Pilipenko, V.P. Temperature Increase and Chemical Change of Fumarolic Gases at Momotombo Volcano, Nicaragua, in 1982–1985: Are These Indicators of a Possible Eruption? J. Geophys. Res. Solid Earth 1986, 91, 12199–12214. [Google Scholar] [CrossRef]
- Boyd, S.R.; Mattey, D.P.; Pillinger, C.T.; Milledge, H.J.; Mendelssohn, M.; Seal, M. Multiple Growth Events during Diamond Genesis: An Integrated Study of Carbon and Nitrogen Isotopes and Nitrogen Aggregation State in Coated Stones. Earth Planet. Sci. Lett. 1987, 86, 341–353. [Google Scholar] [CrossRef]
- Boyd, S.R.; Pineau, F.; Javoy, M. Modelling the Growth of Natural Diamonds. Chem. Geol. 1994, 116, 29–42. [Google Scholar] [CrossRef]
- Smart, K.A.; Chacko, T.; Stachel, T.; Muehlenbachs, K.; Stern, R.A.; Heaman, L.M. Diamond Growth from Oxidized Carbon Sources beneath the Northern Slave Craton, Canada: A δ13C–N Study of Eclogite-Hosted Diamonds from the Jericho Kimberlite. Geochim. Cosmochim. Acta 2011, 75, 6027–6047. [Google Scholar] [CrossRef]
- Palot, M.; Pearson, D.G.; Stern, R.A.; Stachel, T.; Harris, J.W. Multiple Growth Events, Processes and Fluid Sources Involved in Diamond Genesis: A Micro-Analytical Study of Sulphide-Bearing Diamonds from Finsch Mine, RSA. Geochim. Cosmochim. Acta 2013, 106, 51–70. [Google Scholar] [CrossRef]
- Thomassot, E.; Cartigny, P.; Harris, J.; Viljoen, K.F. Methane-Related Diamond Crystallization in the Earth’s Mantle: Stable Isotope Evidences from a Single Diamond-Bearing Xenolith. Earth Planet. Sci. Lett. 2007, 257, 362–371. [Google Scholar] [CrossRef]
- Cartigny, P.; Palot, M.; Thomassot, E.; Harris, J.W. Diamond Formation: A Stable Isotope Perspective. Annu. Rev. Earth Planet. Sci. 2014, 42, 699–732. [Google Scholar] [CrossRef]
- Deines, P. The Carbon Isotopic Composition of Diamonds: Relationship to Diamond Shape, Color, Occurrence and Vapor Composition. Geochim. Cosmochim. Acta 1980, 44, 943–961. [Google Scholar] [CrossRef]
- Galimov, E. Isotope Fractionation Related to Kimberlite Magmatism and Diamond Formation. Geochim. Cosmochim. Acta 1991, 55, 1697–1708. [Google Scholar] [CrossRef]
- Cartigny, P.; Harris, J.W.; Javoy, M. Diamond Genesis, Mantle Fractionations and Mantle Nitrogen Content: A Study of δ13C–N Concentrations in Diamonds. Earth Planet. Sci. Lett. 2001, 185, 85–98. [Google Scholar] [CrossRef]
- Stachel, T.; Harris, J.W.; Muehlenbachs, K. Sources of Carbon in Inclusion Bearing Diamonds. Lithos 2009, 112, 625–637. [Google Scholar] [CrossRef]
- Horita, J.; Polyakov, V.B. Carbon-Bearing Iron Phases and the Carbon Isotope Composition of the Deep Earth. Proc. Natl. Acad. Sci. USA 2015, 112, 31–36. [Google Scholar] [CrossRef] [PubMed]
- Knoche, R.; Sweeney, R.J.; Luth, R.W. Carbonation and Decarbonation of Eclogites: The Role of Garnet. Contrib. Miner. Pet. 1999, 135, 332–339. [Google Scholar] [CrossRef]
- Reutsky, V.; Borzdov, Y.; Palyanov, Y.; Sokol, A.; Izokh, O. Carbon Isotope Fractionation during Experimental Crystallisation of Diamond from Carbonate Fluid at Mantle Conditions. Contrib. Miner. Pet. 2015, 170, 41. [Google Scholar] [CrossRef]
- Kueter, N.; Schmidt, M.W.; Lilley, M.D.; Bernasconi, S.M. Experimental Determination of Equilibrium CH4–CO2–CO Carbon Isotope Fractionation Factors (300–1200 °C). Earth Planet. Sci. Lett. 2019, 506, 64–75. [Google Scholar] [CrossRef]
- Polyakov, V.B.; Horita, J. Equilibrium Carbon Isotope Fractionation Factors of Hydrocarbons: Semi-Empirical Force-Field Method. Chem. Geol. 2021, 559, 119948. [Google Scholar] [CrossRef]
- Shiryaev, A.A.; Polyakov, V.B.; Rols, S.; Rivera, A.; Shenderova, O. Inelastic Neutron Scattering: A Novel Approach towards Determination of Equilibrium Isotopic Fractionation Factors. Size Effects on Heat Capacity and Beta-Factor of Diamond. Phys. Chem. Chem. Phys. 2020, 22, 13261–13270. [Google Scholar] [CrossRef]
- Bottinga, Y. Carbon Isotope Fractionation between Graphite, Diamond and Carbon Dioxide. Earth Planet. Sci. Lett. 1968, 5, 301–307. [Google Scholar] [CrossRef]
- Polyakov, V.B.; Kharlashina, N.N.; Shiryaev, A.A. Thermodynamic Properties of 13C-Diamond. Diam. Relat. Mater. 1997, 6, 172–177. [Google Scholar] [CrossRef]
- Krylov, D.P. Comparative analysis of nitrogen and carbon isotopic fractionation during diamond formation based on β-factor determination. J. Min. Inst. 2025, 272, 40–50. [Google Scholar]
- Polyakov, V.B.; Kharlashina, N.N. The Use of Heat Capacity Data to Calculate Carbon Isotope Fractionation between Graphite, Diamond, and Carbon Dioxide: A New Approach. Geochim. Cosmochim. Acta 1995, 59, 2561–2572. [Google Scholar] [CrossRef]
- Stachel, T.; Chacko, T.; Luth, R.W. Carbon Isotope Fractionation during Diamond Growth in Depleted Peridotite: Counterintuitive Insights from Modelling Water-Maximum CHO Fluids as Multi-Component Systems. Earth Planet. Sci. Lett. 2017, 473, 44–51. [Google Scholar] [CrossRef]
- Stachel, T.; Cartigny, P.; Chacko, T.; Pearson, D.G. Carbon and Nitrogen in Mantle-Derived Diamonds. Rev. Mineral. Geochem. 2022, 88, 809–875. [Google Scholar] [CrossRef]
- Reutsky, V.N.; Borzdov, Y.M. Effect of Growth Rate on Diamond Composition. Diam. Relat. Mater. 2023, 135, 109865. [Google Scholar] [CrossRef]
- Wickman, F.E. The Cycle of Carbon and the Stable Carbon Isotopes. Geochim. Cosmochim. Acta 1956, 9, 136–153. [Google Scholar] [CrossRef]
- Javoy, M.; Pineau, F.; Allègre, C.J. Carbon Geodynamic Cycle. Nature 1982, 300, 171–173. [Google Scholar] [CrossRef]
- Sobolev, N.; Galimov, E.; Ivanovskaia, I.; Efimova, E. Isotopic Composition of Carbon from Diamonds Containing Crystalline Inclusions. Dokl. Akad. Nauk. SSSR 1979, 249, 1217–1220. [Google Scholar]
- Milledge, H.J.; Mendelssohn, M.J.; Seal, M.; Rouse, J.E.; Swart, P.K.; Pillinger, C.T. Carbon Isotopic Variation in Spectral Type II Diamonds. Nature 1983, 303, 791–792. [Google Scholar] [CrossRef]
- Nisbet, E.G.; Mattey, D.P.; Lowry, D. Can Diamonds Be Dead Bacteria? Nature 1994, 367, 694. [Google Scholar] [CrossRef]
- De Stefano, A.; Kopylova, M.G.; Cartigny, P.; Afanasiev, V. Diamonds and Eclogites of the Jericho Kimberlite (Northern Canada). Contrib. Miner. Pet. 2009, 158, 295–315. [Google Scholar] [CrossRef]
- Vinogradov, A.; Kropotova, O.; Ustinov, V. Possible Source of Carbon in Diamonds as Indicated by the 12C/13C Ratios. Geochem. Int. 1965, 2, 495–503. [Google Scholar]
- Cartigny, P. Stable Isotopes and the Origin of Diamond. Elements 2005, 1, 79–84. [Google Scholar] [CrossRef]
- Moussallam, Y.; Morizet, Y.; Gaillard, F. H2O–CO2 Solubility in Low SiO2-Melts and the Unique Mode of Kimberlite Degassing and Emplacement. Earth Planet. Sci. Lett. 2016, 447, 151–160. [Google Scholar] [CrossRef]
- Giuliani, A.; Drysdale, R.N.; Woodhead, J.D.; Planavsky, N.J.; Phillips, D.; Hergt, J.; Griffin, W.L.; Oesch, S.; Dalton, H.; Davies, G.R. Perturbation of the Deep-Earth Carbon Cycle in Response to the Cambrian Explosion. Sci. Adv. 2022, 8, eabj1325. [Google Scholar] [CrossRef]
- Javoy, M.; Pineau, F. The Volatiles Record of a “Popping” Rock from the Mid-Atlantic Ridge at 14°N: Chemical and Isotopic Composition of Gas Trapped in the Vesicles. Earth Planet. Sci. Lett. 1991, 107, 598–611. [Google Scholar] [CrossRef]
- Bekaert, D.V.; Barry, P.H.; Curtice, J.; Blusztajn, J.; Hudak, M.; Seltzer, A.; Broadley, M.W.; Krantz, J.A.; Wanless, V.D.; Soule, S.A.; et al. A Carbon, Nitrogen, and Multi-Isotope Study of Basalt Glasses near 14°N on the Mid-Atlantic Ridge. Part A: Degassing Processes. Geochim. Cosmochim. Acta 2023, 369, 160–178. [Google Scholar] [CrossRef]
- Gennaro, M.E.; Grassa, F.; Martelli, M.; Renzulli, A.; Rizzo, A.L. Carbon Isotope Composition of CO2-Rich Inclusions in Cumulate-Forming Mantle Minerals from Stromboli Volcano (Italy). J. Volcanol. Geotherm. Res. 2017, 346, 95–103. [Google Scholar] [CrossRef]
- Lo Forte, F.M.; Boudoire, G.; Frezzotti, M.L.; Rotolo, S.G.; Sandoval-Velasquez, A.; Viveiros, F.; Zanon, V.; Aiuppa, A.; Rizzo, A.L. The Helium and Carbon Isotopic Signature of Ocean Island Basalts: Insights from Fogo Volcano (Cape Verde Archipelago). Earth Planet. Sci. Lett. 2024, 645, 118930. [Google Scholar] [CrossRef]
- Sandoval-Velasquez, A.; Casetta, F.; Ntaflos, T.; Aiuppa, A.; Coltorti, M.; Frezzotti, M.L.; Alonso, M.; Padrón, E.; Pankhurst, M.; Pérez, N.M.; et al. 2021 Tajogaite Eruption Records Infiltration of Crustal Fluids within the Upper Mantle beneath La Palma, Canary Islands. Front. Earth Sci. 2024, 12, 1303872. [Google Scholar] [CrossRef]
- Sandoval-Velasquez, A.; Rizzo, A.L.; Aiuppa, A.; Remigi, S.; Padrón, E.; Pérez, N.M.; Frezzotti, M.L. Recycled Crustal Carbon in the Depleted Mantle Source of El Hierro Volcano, Canary Islands. Lithos 2021, 400, 106414. [Google Scholar] [CrossRef]
- Boudoire, G.; Rizzo, A.L.; Di Muro, A.; Grassa, F.; Liuzzo, M. Extensive CO2 Degassing in the Upper Mantle beneath Oceanic Basaltic Volcanoes: First Insights from Piton de La Fournaise Volcano (La Réunion Island). Geochim. Cosmochim. Acta 2018, 235, 376–401. [Google Scholar] [CrossRef]
- Stachel, T.; Harris, J.; Aulbach, S.; Deines, P. Kankan Diamonds (Guinea) III: δ13C and Nitrogen Characteristics of Deep Diamonds. Contrib. Miner. Pet. 2002, 142, 465–475. [Google Scholar] [CrossRef]
- Tappert, R.; Stachel, T.; Harris, J.W.; Muehlenbachs, K.; Ludwig, T.; Brey, G.P. Diamonds from Jagersfontein (South Africa): Messengers from the Sublithospheric Mantle. Contrib. Miner. Pet. 2005, 150, 505–522. [Google Scholar] [CrossRef]
- Palot, M.; Cartigny, P.; Harris, J.W.; Kaminsky, F.V.; Stachel, T. Evidence for Deep Mantle Convection and Primordial Heterogeneity from Nitrogen and Carbon Stable Isotopes in Diamond. Earth Planet. Sci. Lett. 2012, 357–358, 179–193. [Google Scholar] [CrossRef]
- Howell, D.; Stachel, T.; Stern, R.A.; Pearson, D.G.; Nestola, F.; Hardman, M.F.; Harris, J.W.; Jaques, A.L.; Shirey, S.B.; Cartigny, P.; et al. Deep Carbon through Time: Earth’s Diamond Record and Its Implications for Carbon Cycling and Fluid Speciation in the Mantle. Geochim. Cosmochim. Acta 2020, 275, 99–122. [Google Scholar] [CrossRef]
- Smit, K.V.; Timmerman, S.; Aulbach, S.; Shirey, S.B.; Richardson, S.H.; Phillips, D.; Pearson, D.G. Geochronology of Diamonds. Rev. Mineral. Geochem. 2022, 88, 567–636. [Google Scholar] [CrossRef]
- Chapman, J.; Brown, G.; Sechos, B. The Typical Gemmological Characteristics of Argyle Diamonds. Aust. Gemmol. 1996, 19, 339–346. [Google Scholar]
- Timmerman, S.; Stachel, T.; Koornneef, J.M.; Smit, K.V.; Harlou, R.; Nowell, G.M.; Thomson, A.R.; Kohn, S.C.; Davies, J.H.F.L.; Davies, G.R.; et al. Sublithospheric Diamond Ages and the Supercontinent Cycle. Nature 2023, 623, 752–756. [Google Scholar] [CrossRef] [PubMed]
- Marty, B.; Avice, G.; Sano, Y.; Altwegg, K.; Balsiger, H.; Hässig, M.; Morbidelli, A.; Mousis, O.; Rubin, M. Origins of Volatile Elements (H, C, N, Noble Gases) on Earth and Mars in Light of Recent Results from the ROSETTA Cometary Mission. Earth Planet. Sci. Lett. 2016, 441, 91–102. [Google Scholar] [CrossRef]
- Mikhail, S.; Füri, E. On the Origin(s) and Evolution of Earth’s Carbon. Elements 2019, 15, 307–312. [Google Scholar] [CrossRef]


Disclaimer/Publisher’s Note: The statements, opinions and data contained in all publications are solely those of the individual author(s) and contributor(s) and not of MDPI and/or the editor(s). MDPI and/or the editor(s) disclaim responsibility for any injury to people or property resulting from any ideas, methods, instructions or products referred to in the content. |
© 2025 by the author. Licensee MDPI, Basel, Switzerland. This article is an open access article distributed under the terms and conditions of the Creative Commons Attribution (CC BY) license (https://creativecommons.org/licenses/by/4.0/).