1. Introduction
The idea that electromagnetic pulses can be produced in the Earth’s crust as a conversion result of the tectonic energy into electrical one, both before and during earthquake, has given rise in the 1970s to intensive searching for the characteristic signs of earthquake preparation among the variation of electromagnetic emission [
1]. At that time, Prof. A. A. Vorobyov introduced the notion of the Earth’s natural pulsed electromagnetic field (ENPEMF). Presently, the investigation of temporal variations in ENPEMF is one of the most promising directions to reveal the seismogenic effects of earthquake preparation in geophysical fields.
Successive development of the methods for studying ENPEMF in the very low-frequency band revealed the presence of a substantial part of the lithospheric component in the structure of ENPEMF [
2,
3,
4]. Application of the ENPEMF method augmented the capabilities of the research aimed the short-term earthquake forecasting. Based on a variety of experimental evidence, the structure of an earthquake precursor was specified as vanishing of the characteristic daily cycle of the electromagnetic field with a decrease in its amplitude, followed by a sharp jump. It was shown that the spatial distribution of the stations destined for monitoring geodynamic processes in the lithosphere allows for determining both the intensity of ENPEMF pulses and the bearing of incoming signals [
3,
4,
5]. Consistent research is conducted for the development of special data processing and analyzing methods aimed at the detection of the signals with stable informational features of earthquake preparation in the ENPEMF variation [
6,
7,
8,
9].
Detection of anomalies in ultra-low frequency (ULF) signals a few days and hours prior to an earthquake is one of the most frequent events in the series of confirmed electromagnetic precursors of major earthquakes. Among the candidates for short-term earthquake forecasting, much attention is paid to electromagnetic phenomena in the ULF (0.001–3 Hz) band [
10,
11,
12].
Mostly, objective predictive expectations are connected with electromagnetic radiation propagating from an earthquake epicenter [
13]. This applies to earthquakes of a magnitude
, under the condition that the measuring equipment is located at a sufficiently close distance to the epicenter of future earthquakes [
10]. It is especially true for ULF waves (
Hz), due to their deeper skin effect.
According to [
14,
15], at a distance of 10–50 km from the epicenter, magnetic and electric disturbances can reach the levels of 1–10 nT and 1–10
V/m correspondingly, while less than a day before an earthquake intensity of electromagnetic signals can rise dramatically from several nT to tens of nT [
10]. Such estimates are rather close to the values observed before the
Loma Prieta (1989) and
Spitak (1988) earthquakes [
16]. Anomalous effects arising in the variation of ULF electromagnetic waves some days and hours before a seismic event were considered in detail in a number of reviews of historical and recent studies, where the connection of such a signal with an earthquake is actively discussed [
10,
11,
17,
18,
19,
20]. With the development of modern technologies, such as satellite and ground-based methods for monitoring the ionosphere, it becomes noticeably more relevant to investigate the ionospheric anomalies on the eve of an earthquake, which could serve as a possible prognostic of a seismic event. Understanding the coupling between peculiarities of ionospheric phenomena and the mechanism of earthquake preparation in the lithosphere is widely discussed in the literature [
21,
22,
23,
24,
25,
26], including perspectives of the Global Electric Circuit (GEC) concept [
27,
28,
29].
The Doppler method is the most sensitive radiophysical technique for the detection of ionospheric instabilities. Since the 1980s, a study of anthropogenic and natural influence on the ionosphere has been carried out at the Institute of Ionosphere using the method of Doppler frequency shift (DFS) measurement on an inclined radio path [
30,
31,
32]. The method was successfully applied to detect ionospheric anomalies both at preparation and during earthquakes and at the study of lithosphere–atmosphere–ionosphere coupling [
32,
33].
This paper presents a complex investigation of the anomalous effects that were detected prior to an earthquake in the data time series on electromagnetic waves in the ULF/VLF bands, the flux of subsurface gamma rays, and the DFS of ionospheric signal. A comprehensive study of these effects was carried out at the Geophysical Observatory, which resides at the High Mountain Station of the Institute of Ionosphere and at the Tien Shan High Mountain Research Station of the P. N. Lebedev Physical Institute of the Russian Academy of Sciences. The observatory is situated in one of the most earthquake-prone regions of Northern Tien Shan (Kazakhstan), where the sources of the historical Verny (, 1887), Chilik (, 1888), and Kemin (, 1911) catastrophic earthquakes are located. Long-term continuous monitoring of geophysical fields is performed here with the goal of disclosing the anomalies bound with earthquake preparation.
In the present publication, attention is drawn to the seismo-electromagnetic phenomena registered in a ground-based experiment, namely to the anomalous effects in the ULF/VLF band, as a possible precursor of an earthquake that occurred on 4 March 2024. The anomalies of electromagnetic emission are considered here in complex with the variation of the flux of gamma rays measured among subsoil rocks and with the changes in DFS of the ionospheric signal.
Interest in this work appeared when, a few days before the earthquake, we detected in real time a characteristic cove-like depression in the counting rate record of a gamma detector installed in a borehole. This observation indicated a high probability of an incoming earthquake, which did actually take place 8 days later. Earlier, similar anomalies in the gamma-ray flux have been repeatedly observed 8–2 days before several
earthquakes with epicenters situated within the Dobrovolsky circle [
34].
2. Experimental Set-Up
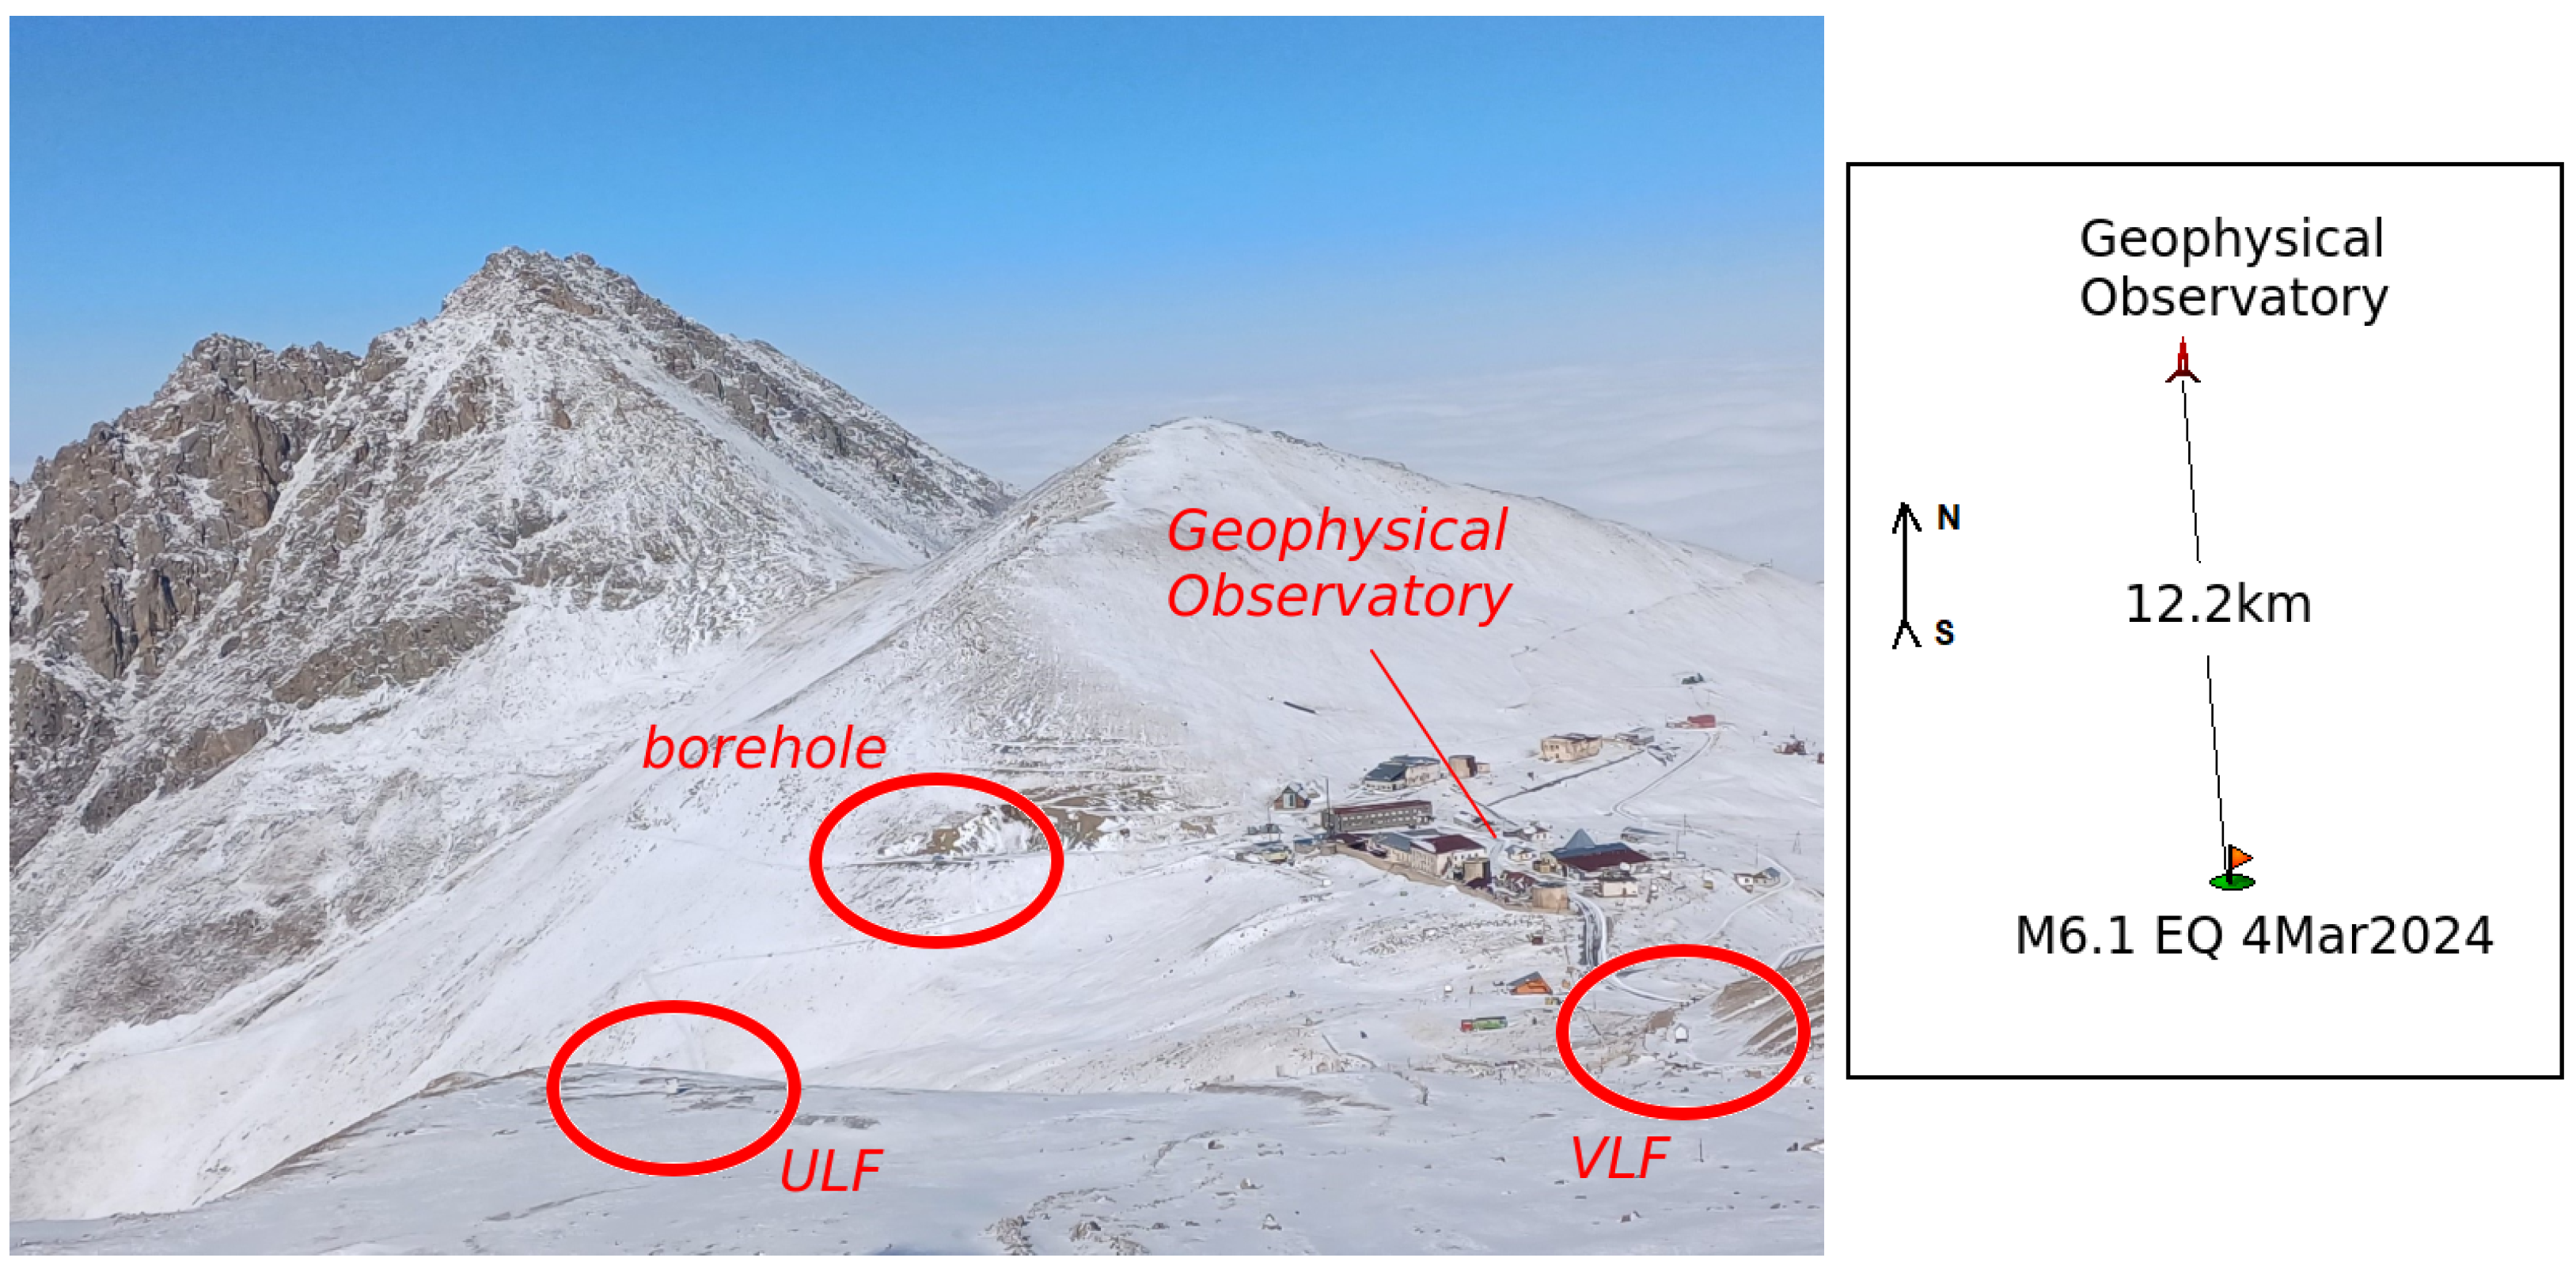
Multi-parametric Geophysical Observatory resides at the two high-altitude experimental sites of the Institute of Ionosphere and of the Tien Shan Research Station of the Lebedev Physical Institute, both hosted in mountain at the altitudes between 3340 and 3400 m above the sea level, far away from any technogenic interference. The uniqueness of the Observatory lies in its location in vicinity to the epicenters of two catastrophic earthquakes, the Verny (13.3 km) and Kemin (16.3 km) ones, and also not far from the sources of about ten other major earthquakes, which have occurred on the territory of Kazakhstan during the last century. The experimental base of the Observatory comprises complex equipment for simultaneous monitoring the processes proceeding in the lithosphere, atmosphere, and ionosphere.
A multi-channel geophysics recorder MGR-02-16 is installed at an altitude of 3400 m. The device is designed for monitoring the temporal changes in ENPEMF, which is measured here continuously, and simultaneously at the two frequencies of VLF band, 7.5 kHz and 10.0 kHz, in accordance with the method proposed in [
2,
3,
4,
5]. Two mutually orthogonal ferrite antennas of the geophysical recorder are set in the north–south (7.5 kHz) and West–East (10.0 kHz) directions. The counting rate of electromagnetic pulses is defined over 10 s long time intervals.
Next to the recorder resides an IMS-008 magnetic sensor of inductive type, which registers the strength variation of the horizontal component of the Earth’s magnetic field in an ULF band, 0.001–20 Hz, with a sampling rate of Hz. The magnetic sensor is oriented in the north–south direction. To ensure registration of the electromagnetic signals only in the ULF band, a 12-order Chebyshev low-pass filter with a cut-off bandwidth of 20 Hz is applied. A notch filter is also used for better suppression of the interference from the 50 Hz industrial main.
At the territory of Geophysical Observatory there exists a 300 m deep borehole, which is also used for the study of seismogenic effects. Up to the depth of () m, the borehole is filled with water. At the depth of 100 m it is installed a gamma ray detector, which is based on a ⌀40 mm sized NaI(Tl) scintillation crystal. The detector was especially designed for the measurement of the flux of gamma rays from tens of keV to some MeV in borehole.
The gamma detector was calibrated using the reference gamma sources 241Am (with the energy of emitted radiation ≃ 60 keV) and 137Cs (660 keV). The rate of output pulses obtained from the detector is registered with a 10 s periodicity in the four energy ranges: 30–150 keV, 150–250 keV, 250–500 keV, and ⩾500 keV.
Besides the gamma detector, three temperature sensors are also installed in the borehole at the levels of 1 m, 24 m, and 39 m; one more sensor is placed on the surface near the upper borehole orifice. It was found that below 24 m under the surface, the air temperature varies only by a few hundredths of a centigrade throughout a year, providing stable operation conditions for the electronic circuitry and scintillation crystal of the gamma detector, which generally could be affected by temperature variation. The on-ground part of all geophysical recorders is kept under temperature stabilization in the limits of () °C.
The mutual disposition of the mentioned detectors at the Geophysical Observatory is listed in
Table 1 and illustrated by a picture in
Figure 1.
All observations made at Geophysical Observatory are analyzed with regard to the current geomagnetic situation. For the purpose, we use the
and
indices of geomagnetic activity obtained at the website of the World Data Center for Geomagnetism in Kyoto [
35].
3. Results and Discussion
3.1. The Earthquake on 4 March 2024
On 4 March 2024, at 06:22:06 UT, an earthquake occurred. The earthquake had an energy class of 13.2, a magnitude
, epicenter coordinates of
N,
E, and a depth of 10 km [
36]. The epicenter was situated 31 km apart from Almaty, a city with more than 2 million people. The sensitivity information of the earthquake in Almaty was 5–6 points on the MSK-64 scale. As illustrated in
Figure 1, the distance of the epicenter from the Geophysical Observatory was only 12 km.
3.2. The Earth’s Natural Pulsed Electromagnetic Field
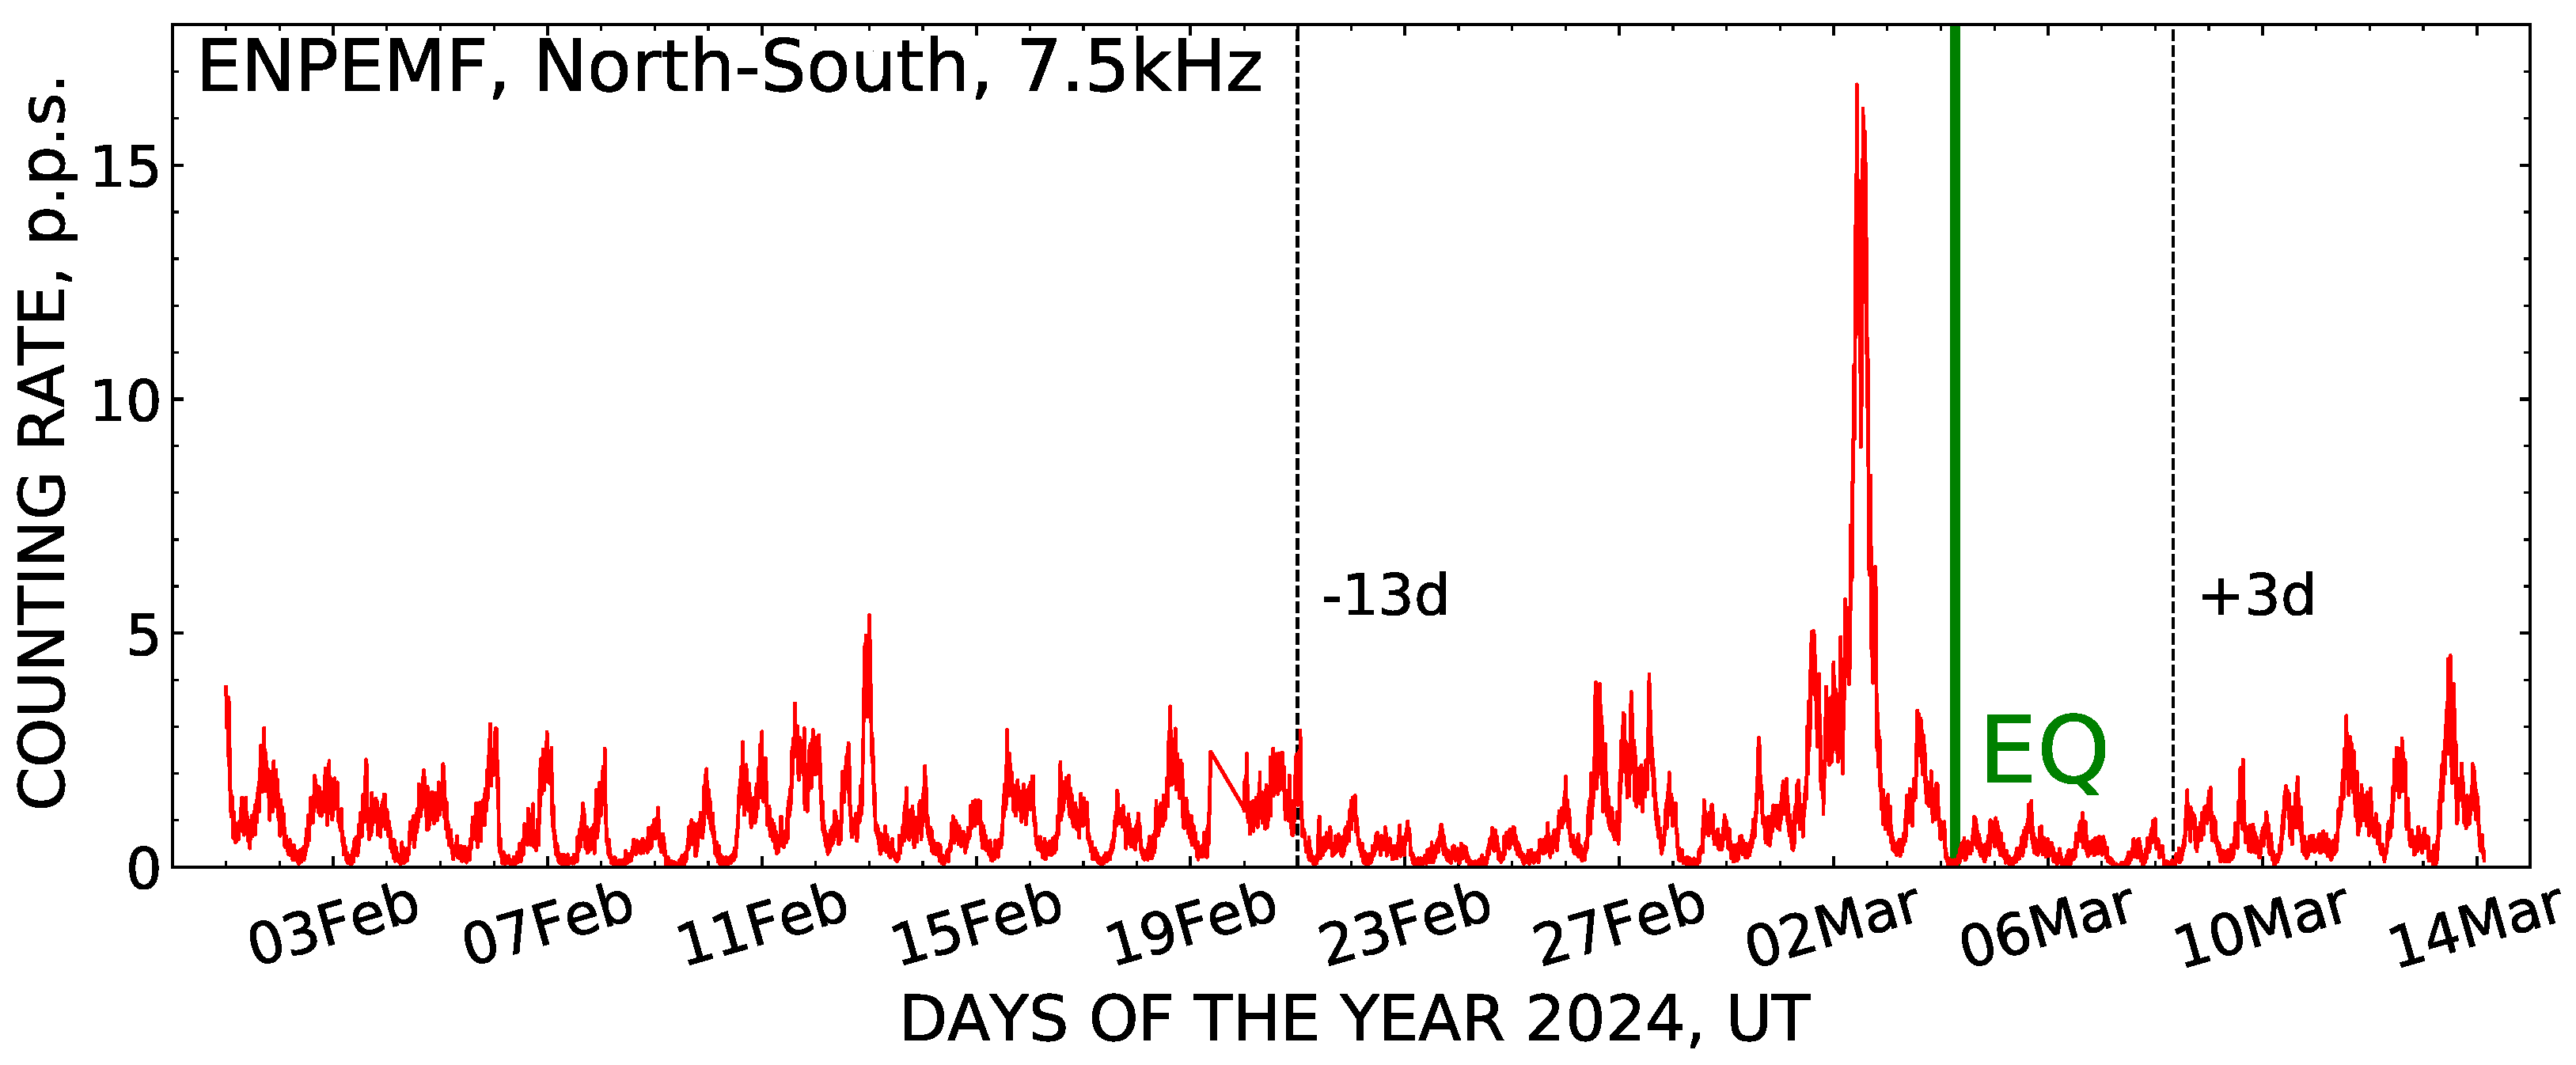
In
Figure 2, a record is shown of the intensity variation of ENPEMF in the VLF band (
kHz) obtained with the north–south-oriented antenna of the MGR-02-16 recorder. As happened, at the time of the 4 March 2024, earthquake the antenna was pointing nearly toward its epicenter (see
Figure 1). The accumulation time of the ENPEMF pulse signals for each point in the plot equals 5 min; in the figure, these data are presented in normalization to the number of pulses that arrived in one second.
First, note that during the period between 1 and 20 February 2024, the counting rate of the pulses of the electromagnetic field clearly demonstrates the presence of diurnal oscillation. This is a typical record of the background change in ENPEMF intensity registered by an MGR-02-16 instrument, which the authors [
2,
3,
4,
5] explain by the influence of the highly stable daily rhythms of the Earth’s crust on mechanoelectrical transformations in rocks.
The proximity of the earthquake epicenter to the recording equipment of the Geophysical Observatory allowed for the detection of distinct anomalous effects in the ENPEMF intensity during the short-term preparation period of the seismic event. Thus, on 21 February, about 13 days before the earthquake, there occurred a significant suppression of the amplitude of diurnal variation. Next, on 2 March 2024, two days until the main shock, a significant, 4–5 times above the background, growth in the rate of electromagnetic pulses took place, which continued throughout the whole day.
According to observations, the longer a prognostic signal lasts, the more likely the occurrence of a high-magnitude seismic event [
4,
5]. As stated by the authors, detection of decline in ENPEMF intensity is an objective reason to inform the population of possible events.
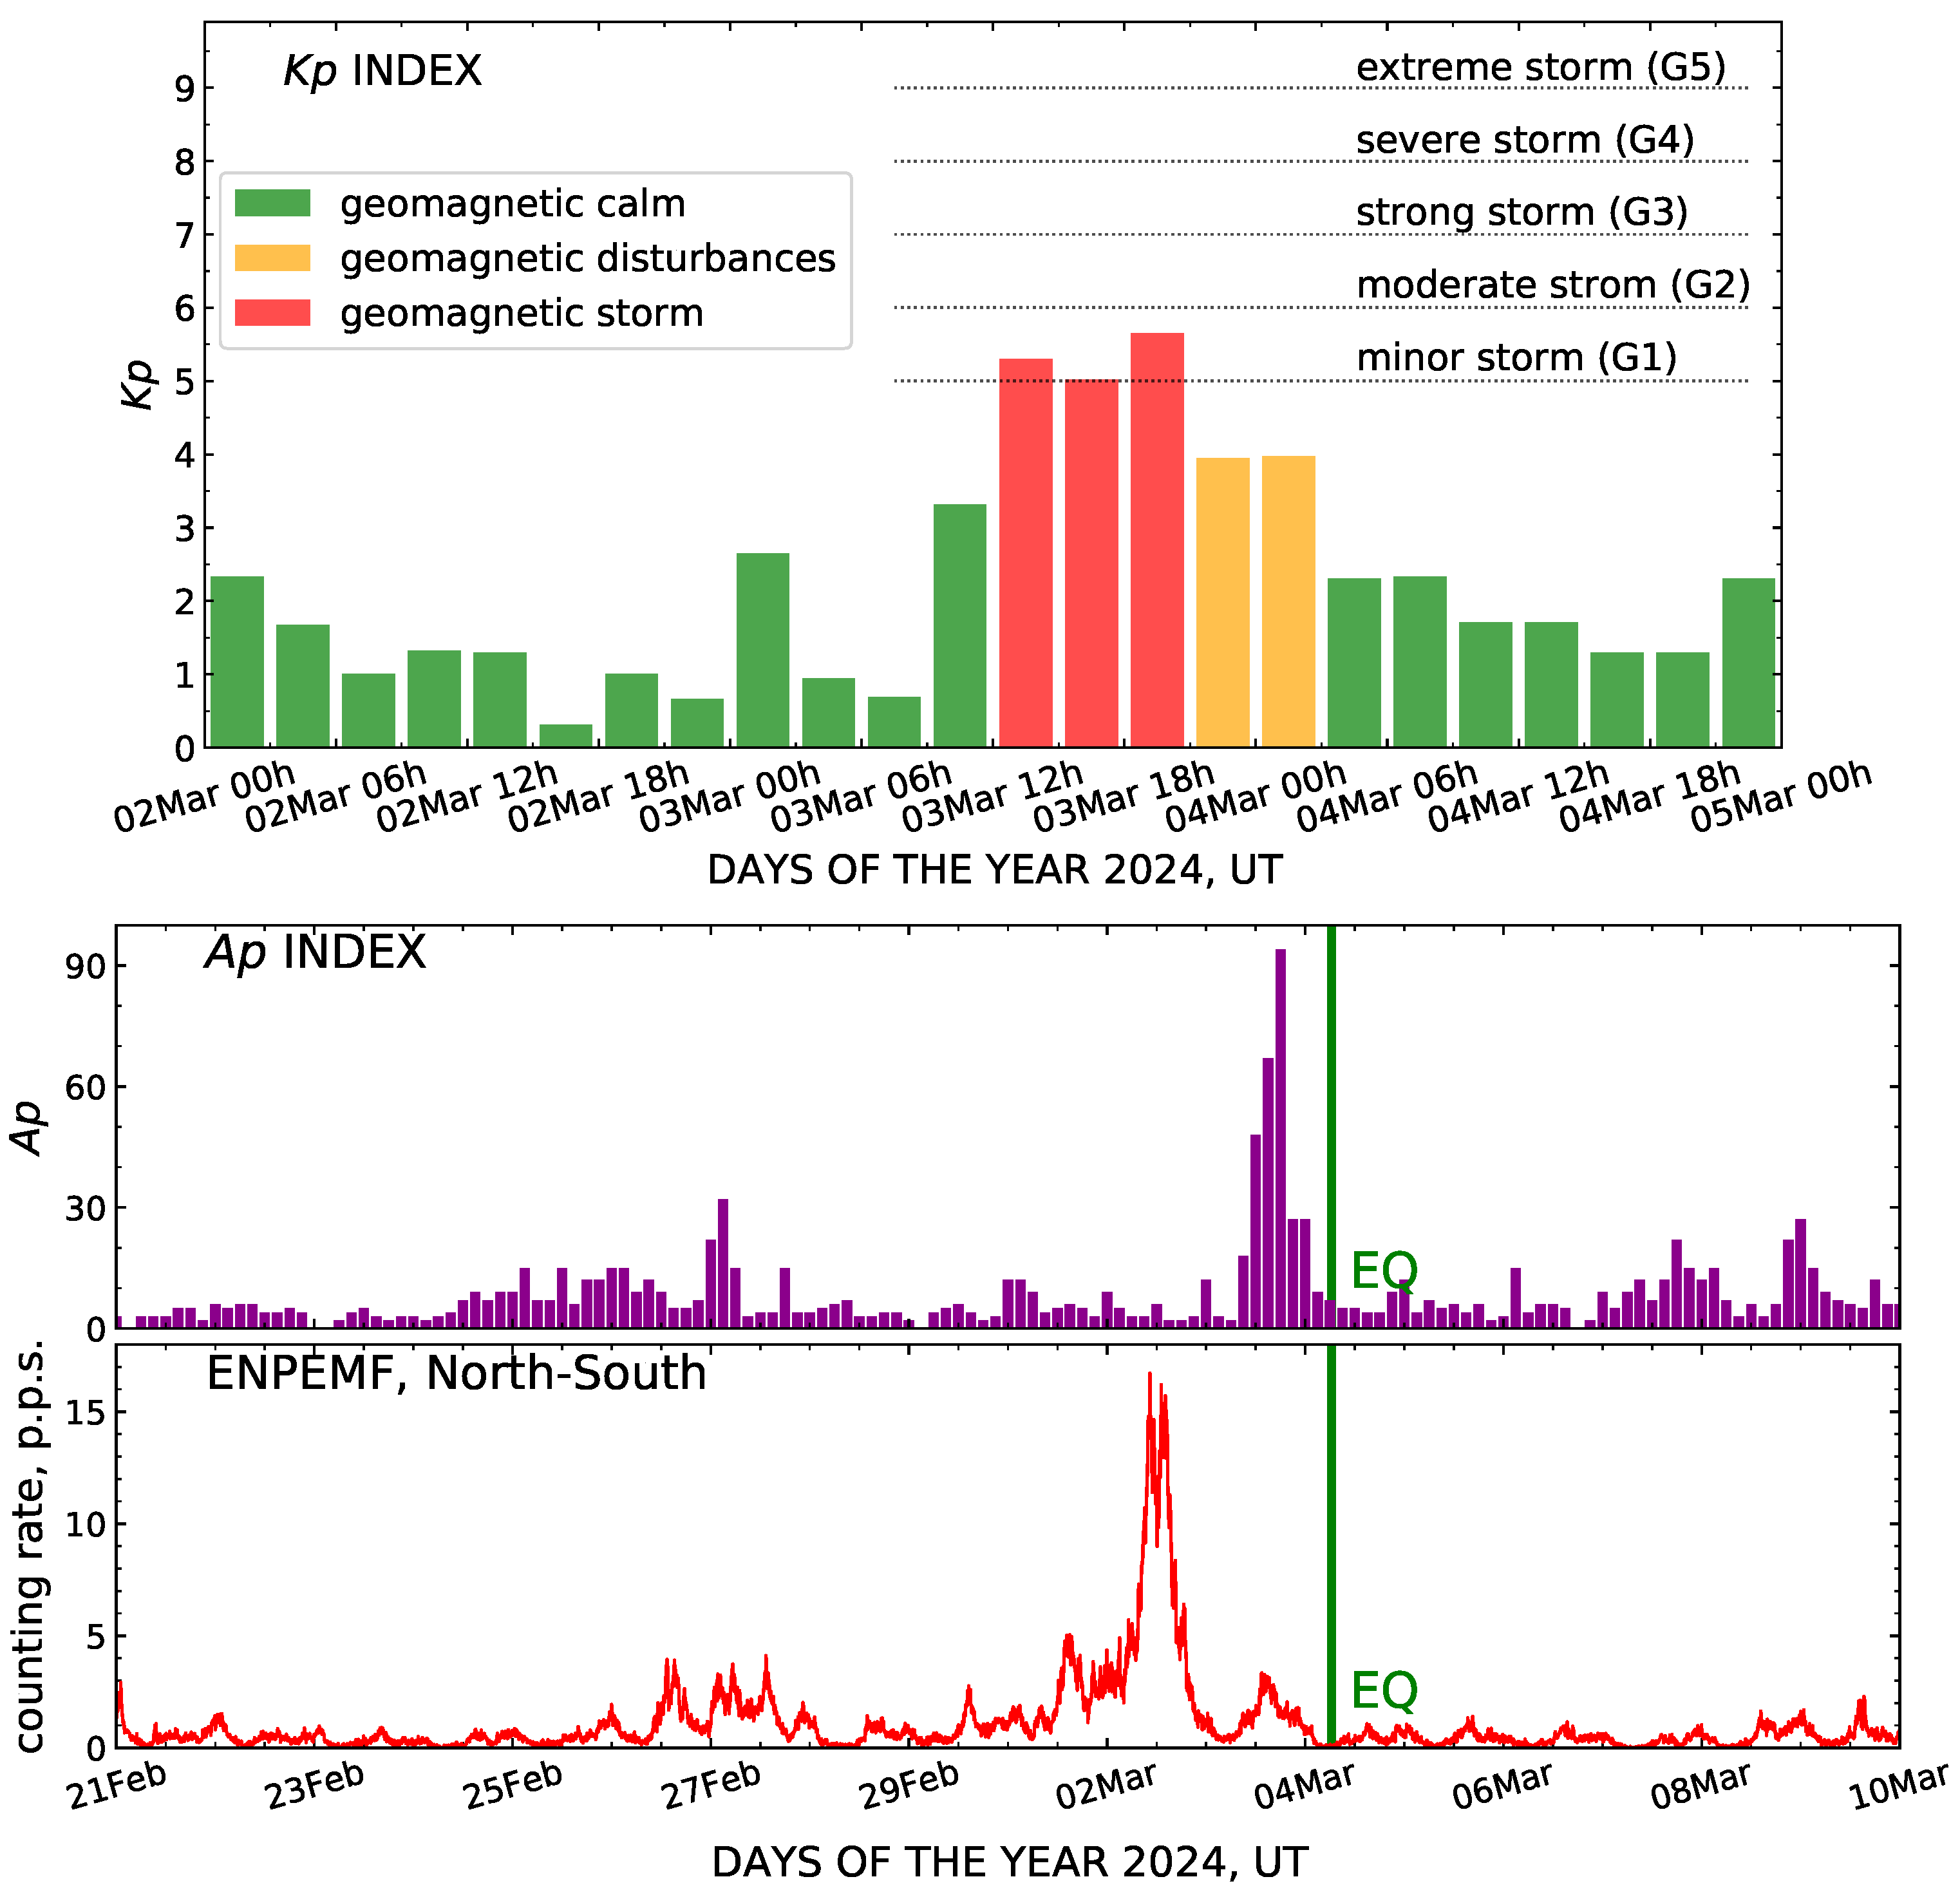
Importantly, during the whole observed period, both the meteorological and geomagnetic conditions remained quiet, and there were no thunderstorms or magnetic storms, which could have influenced the electromagnetic field and masked the effects of earthquake preparation. Only on 3 March, one day before the earthquake, was there a minor magnetic storm of a 9 h duration (
Figure 3, top). Taking into account possible impact of this magnetic storm, in the two lower panels of
Figure 3, a comparison is made between the variation of the electromagnetic field and the data on the
index of geomagnetic activity; the latter was borrowed from the website [
35]. According to this comparison, the increase in the ENPEMF intensity observed on 2 March can not be related to the magnetic storm that caused the rise of the
index only on 3 March.
Thus, the anomalous rise of ENPEMF intensity in the VLF band (
kHz) 13 days up to the earthquake may be an activation sign of its preparation in the lithosphere. Note that the picture of a short-term earthquake precursor in the ENPEMF variation given in [
4,
5], which looks like the vanishing of the characteristic diurnal cycle and the emergence of an intensity burst just near the earthquake, does correspond to our data.
According to [
7,
8,
9], if the ratio between the useful signal and the noise is low, a special data processing technique is required to reveal electromagnetic anomalies among the ENPEMF intensity. However, as our present study has shown, in the case of the close location of measuring equipment to the epicenter of the
earthquake, the application of any additional special methods for extracting the electromagnetic signal of earthquake preparation is not necessarily needed.
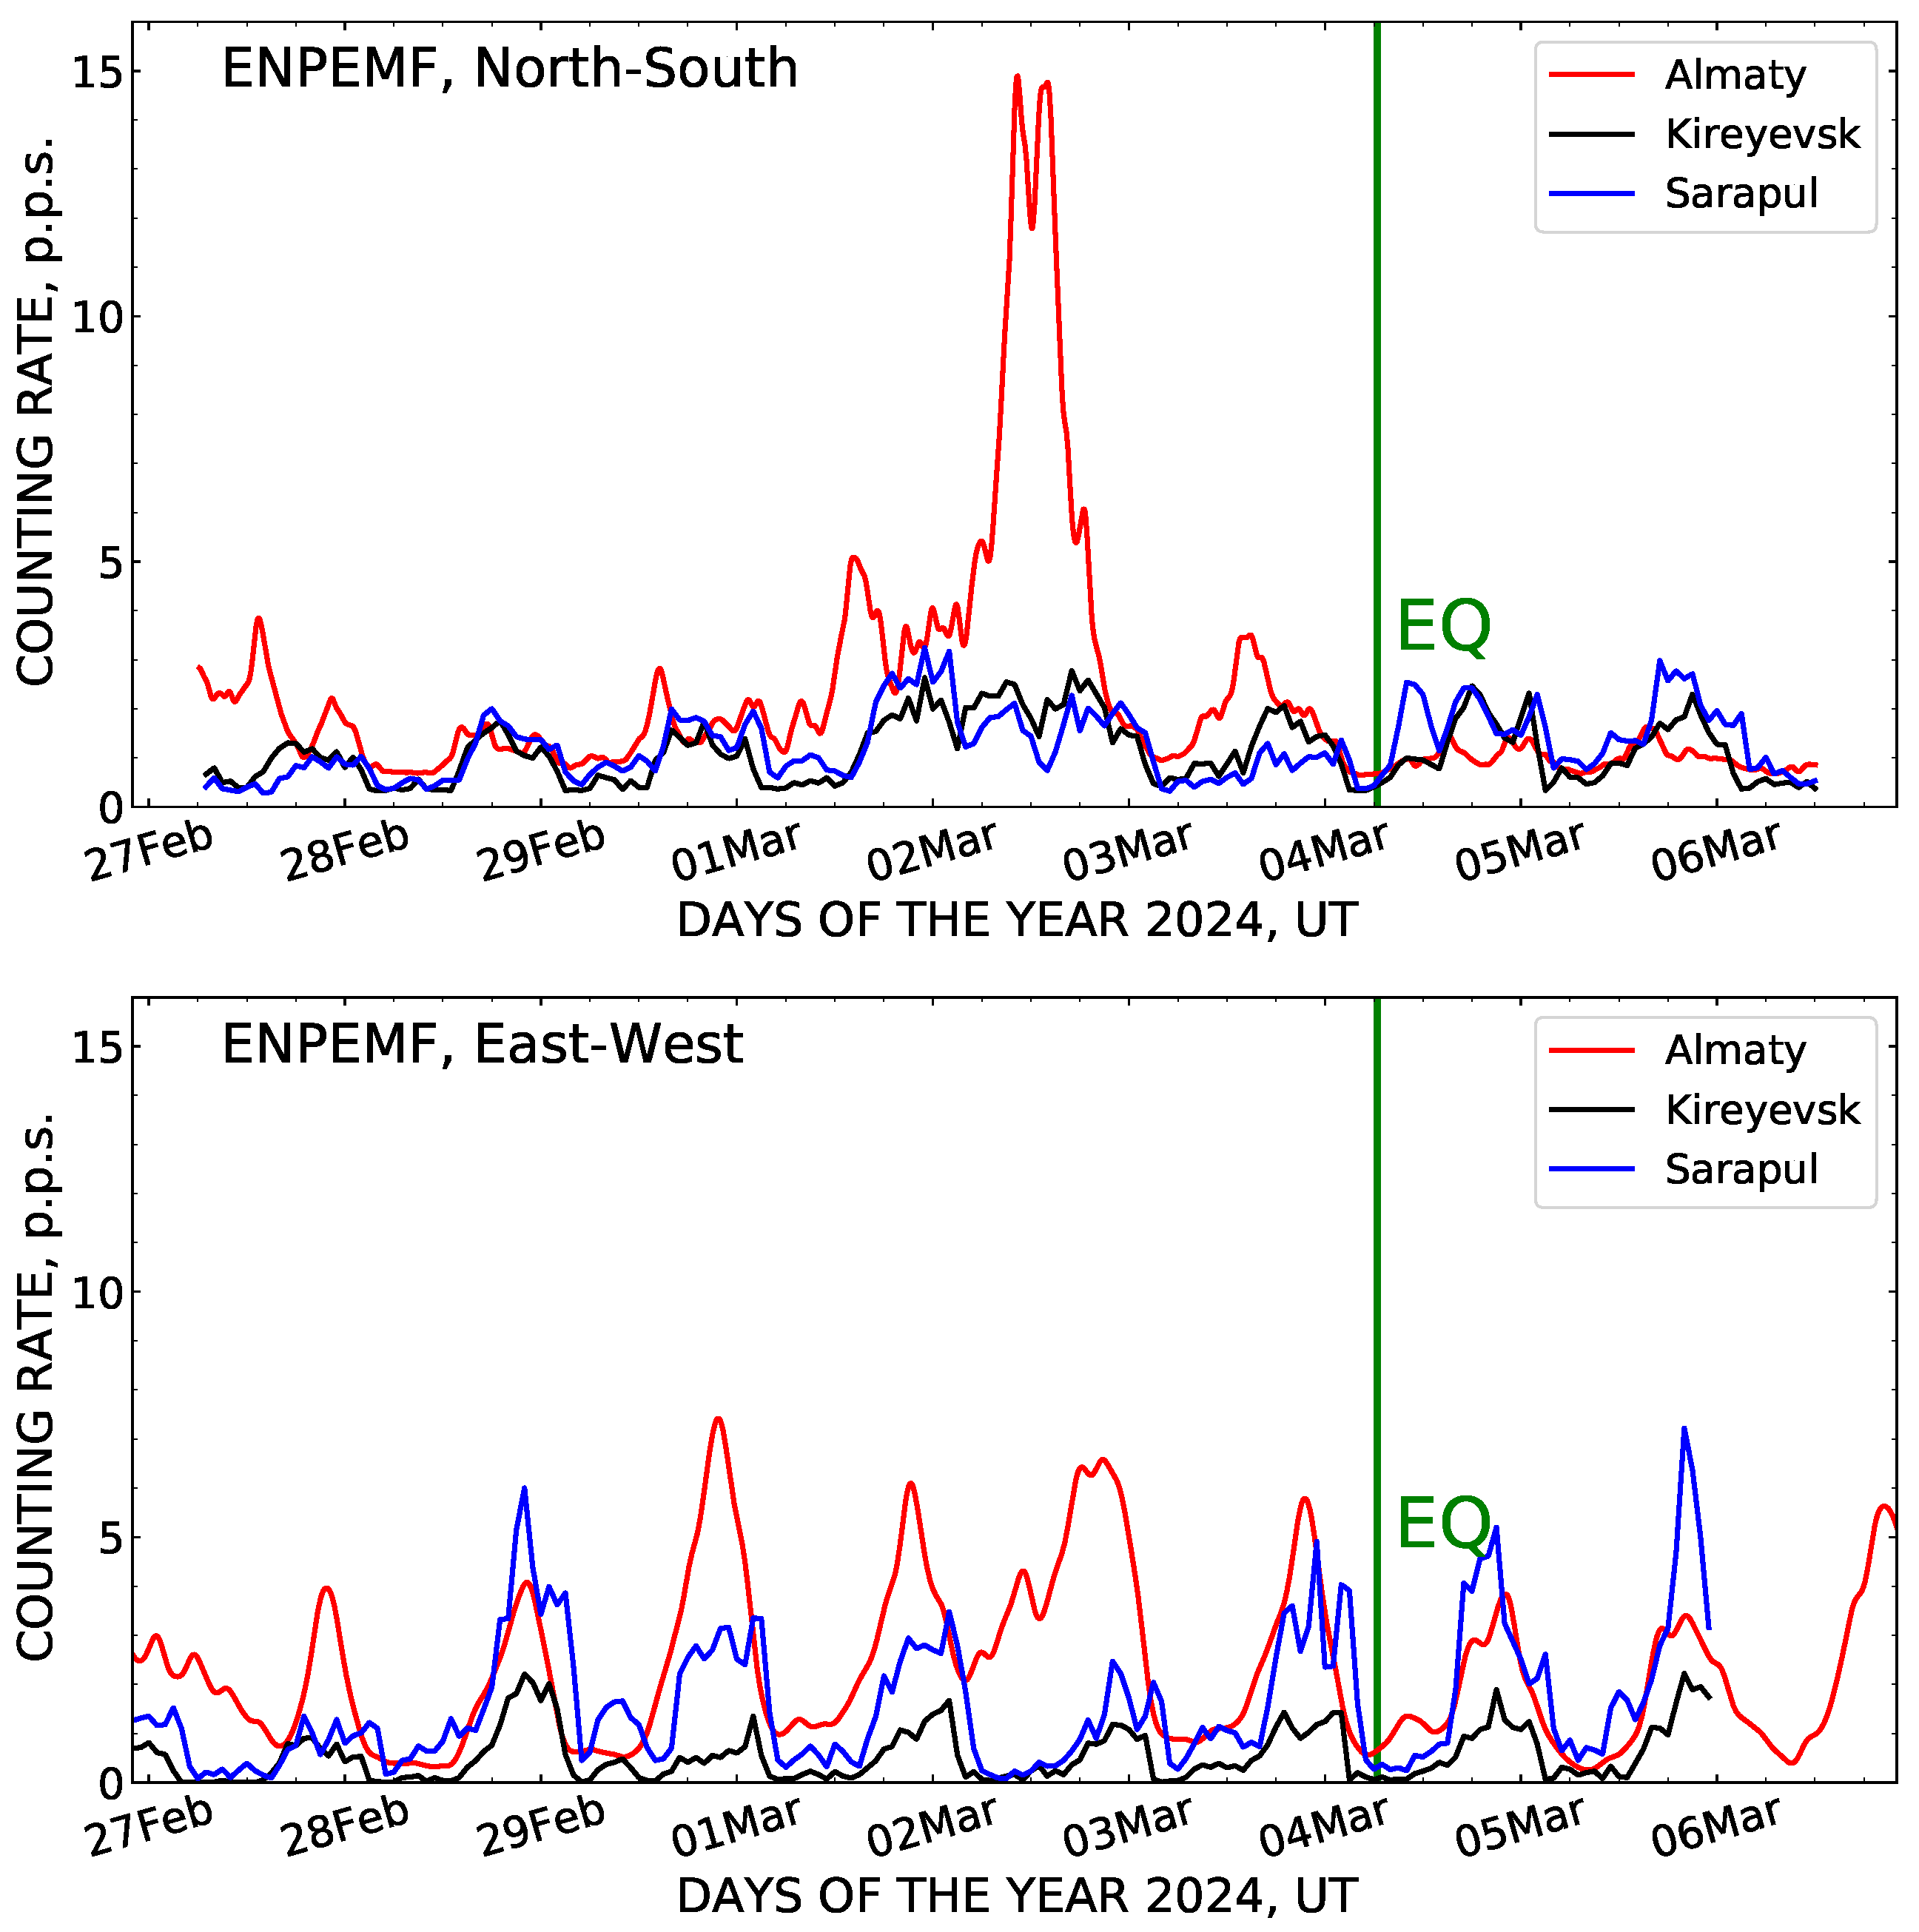
3.3. Intensity of ENPEMF at Different Distances from the Epicenter
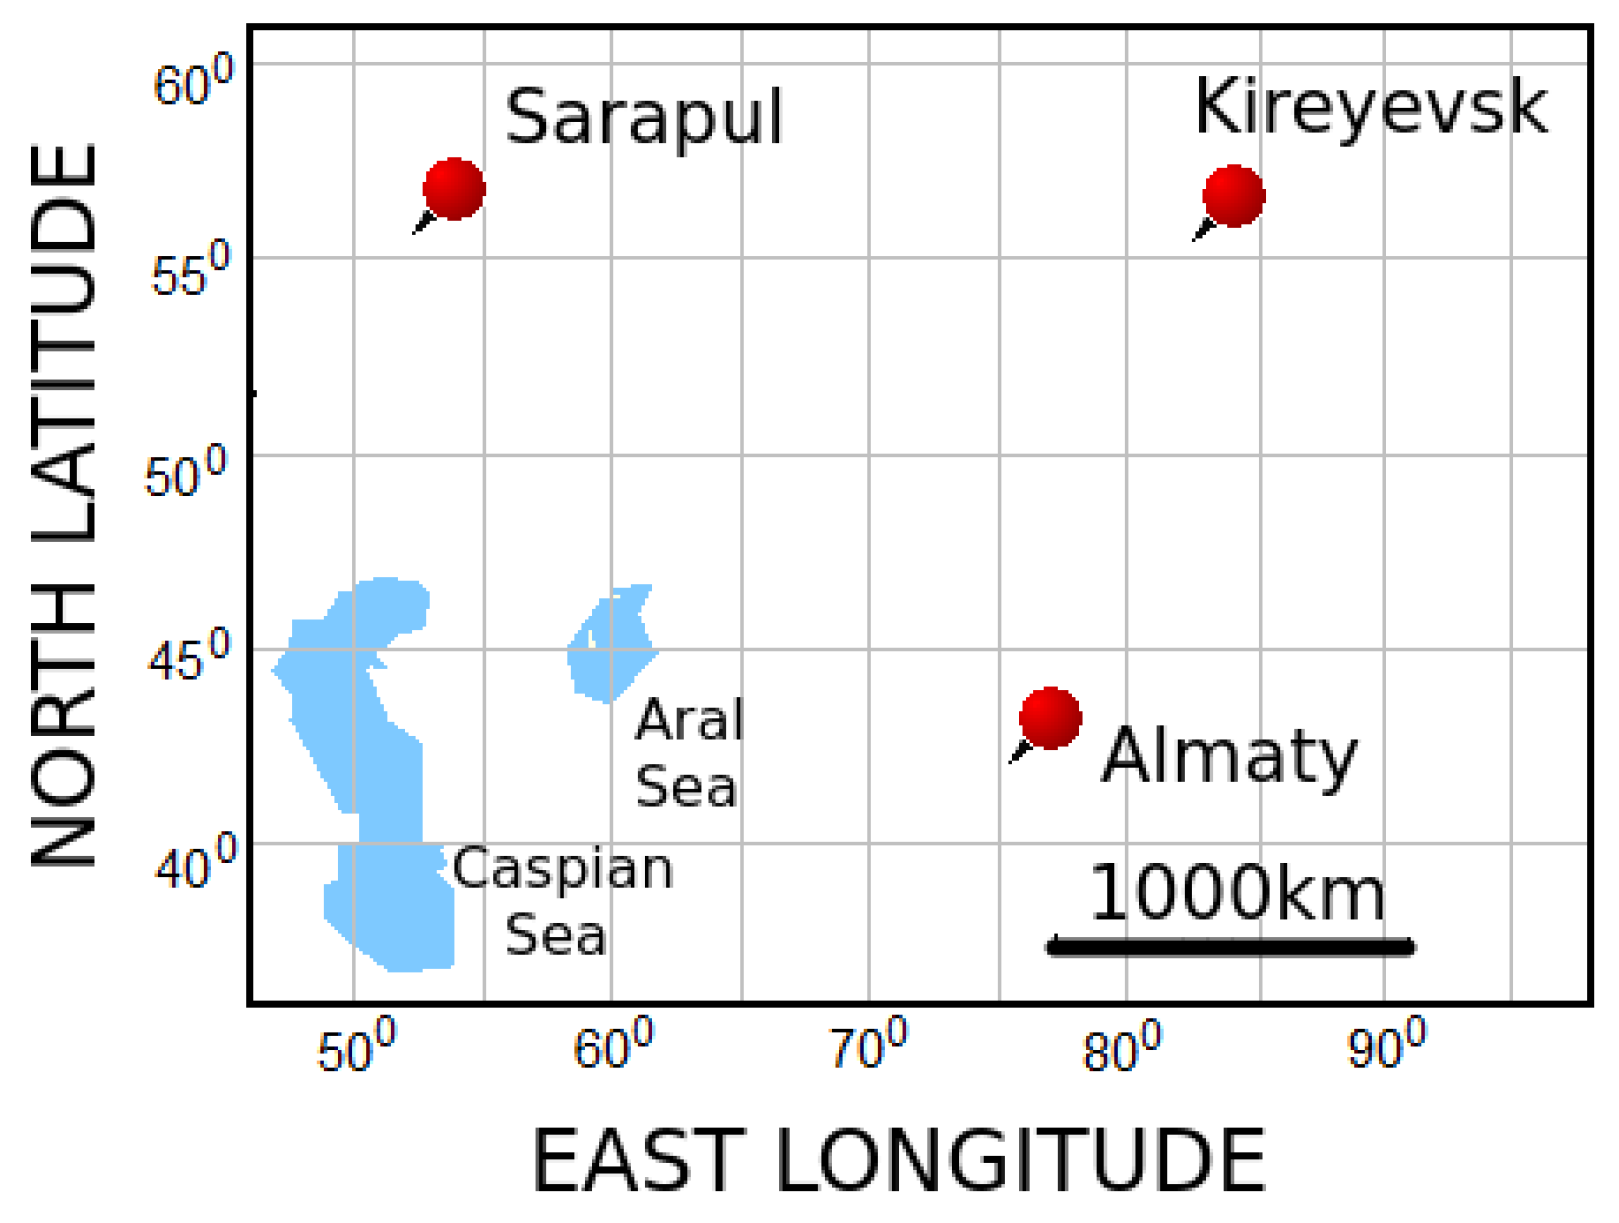
It is important for the reliable identification of seismogenic effects in a VLF record to exclude the disturbances caused by magnetic storms. This is why our task was also to check for the possible influence of the geomagnetic storm, which happened on 3 March 2024 and preceded the earthquake, in addition to investigating the diurnal periodicity of the VLF signal.
A comparative analysis was made of the results of ENPEMF monitoring synchronously obtained with the recorders of the same MGR-02-16 type but situated in different locations: at Geophysical Observatory near Almaty, Kazakhstan (
kHz and 10 kHz), and at the points Kireyevsk (
kHz) and Sarapul (
kHz) in Russia. At all stations, the magnetic antennas of the MGR-02-16 recorder were set both north–south (
-component) and East–West (
-component). The mutual disposition of the registration points is plotted in
Figure 4. The Russian MGR-02-16 registry data, with hourly time resolution, were provided by the Institute of Monitoring of Climatic and Ecological Systems, Siberian Branch of the Russian Academy of Sciences, Tomsk.
It was assumed that in the case of global influence from the side of geomagnetic disturbance some response in VLF variation would be registered simultaneously at different points, regardless of their position relative to the earthquake epicenter. Thus, the distance from the points Sarapul (
N,
E), Kireyevsk (
N,
E), and Geophysical Observatory (
N,
E) to the epicenter equals, correspondingly, 2224 km, 1573 km, and 12.2 km. The time series of ENPEMF intensity registered at various epicentral distances before the 4 March 2024
earthquake are plotted in
Figure 5.
As discussed above, the distinct burst of ENPEMF intensity was registered at the Geophysical Observatory near Almaty two days previously to the main shock, when the ferrite antenna of the north–south recording channel was pointing to the epicenter of the earthquake, and due to favorable chance, the epicenter was only 12 km apart from the measuring equipment. At the peak of the burst, the counting rate of ENPEMF signals was almost five times above its background.
The prominent burst of ENPEMF detected at the Geophysical Observatory with the north–south oriented antenna is clearly seen in the upper plot of
Figure 5. However, the ENPEMF intensities measured in the same north–south registration channel at both remote sites, Sarapul and Kireyevsk, remained at background level.
As seen in the bottom panel of
Figure 5, in the case of East–West antenna orientation, any increase in ENPEMF before the earthquake was not observed in all registration points. This confirms that the magnetic storm of level
, which occurred on 3 March 2024, practically had no effect on the ENPEMF intensity. Also, it follows from the data presented that any response in a variation of VLF electromagnetic signals to the process of earthquake preparation should be expected only at a short distance and with the favorable orientation of the receiving antenna towards the epicenter.
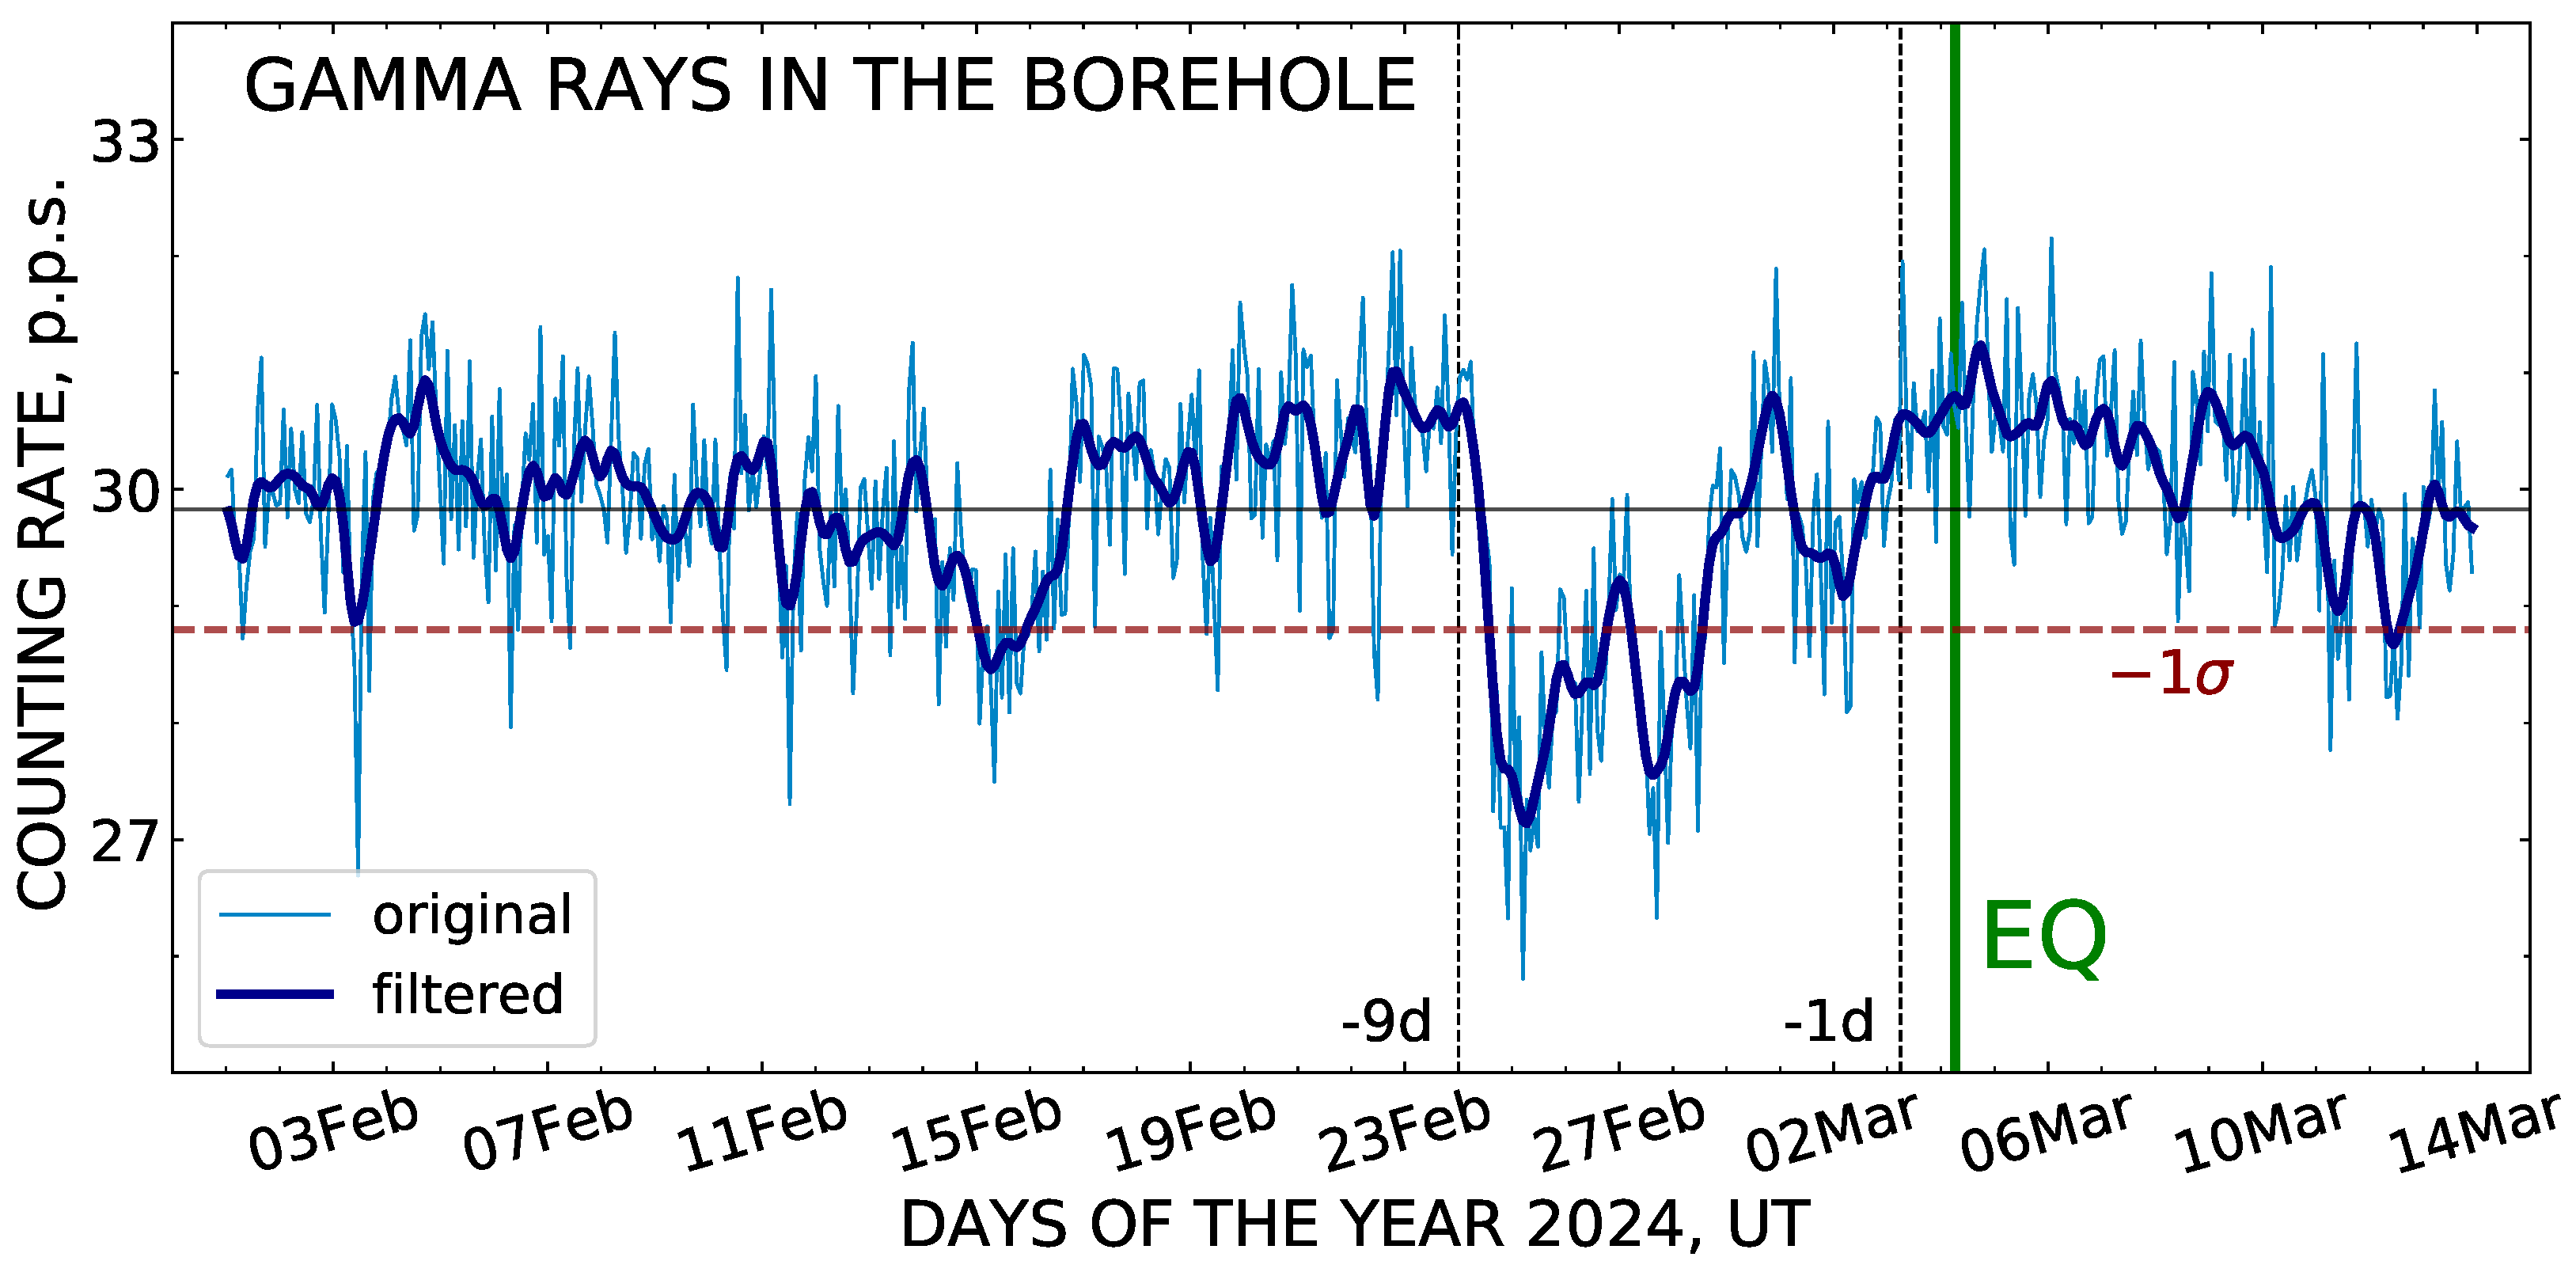
3.4. Intensity of Gamma Rays Underground
Besides the ENPEMF measurement, the gamma-ray flux was also monitored at the Geophysical Observatory with the gamma detector placed about 100 m underground in the borehole. Inside the borehole, the flux of gamma rays does not depend on weather conditions and possesses the necessary stability for revealing the anomalies caused by an earthquake preparation process. This explains the essential advantage of borehole radiation monitoring over on-surface measurements. Our studies [
33,
37] have shown that precipitations, such as rain, snow, and hail, together with other meteorological factors, can significantly impact gamma-ray flux in the near-surface atmosphere [
38,
39,
40].
Monitoring of gamma radiation in the energy range of 250–500 keV was carried out for the period starting from 1 February and up to 13 March 2024, and the result is presented in
Figure 6. In the measurement, the output pulse signals coming from the gamma detector were continuously counted during succeeding 10 s long time intervals, and then the momentary counting rate was defined as the number of pulses arriving per second (p.p.s.).
It is clearly seen in the plot of
Figure 6 that 9 days before the 4 March 2024 earthquake, a cove-like depression has appeared in the variation record, such that the gamma flux has returned to its background only one day till the main shock. The peak discrepancy between the values of the counting rate at the minimum of gamma radiation intensity and the level of average background exceeded one standard deviation.
Statistical significance of the observed cove-like effect may be estimated through a comparison of the background record of gamma-ray flux registered in the time from 1 February up to 24 February with the data corresponding to the period of the anomalous effect between 24 February and 4 March. Using the means and standard deviations for these two-time series, the value of the Student criterion was deduced. This corresponds to a high statistical confidence () of the difference between the background intensity and the effect that appeared in the gamma-ray flux before the earthquake.
Earlier, similar cove-like depressions of gamma ray intensity in the borehole have been repeatedly observed prior to
–
earthquakes within the limits of the Dobrovolsky radius [
33]. Presumably, this effect may be related to the emanation dynamics of radon and its gamma-radioactive daughter products, which depend on the change in the load on the rock massif and on the modification of the stress–strain state of the environment before a seismic event.
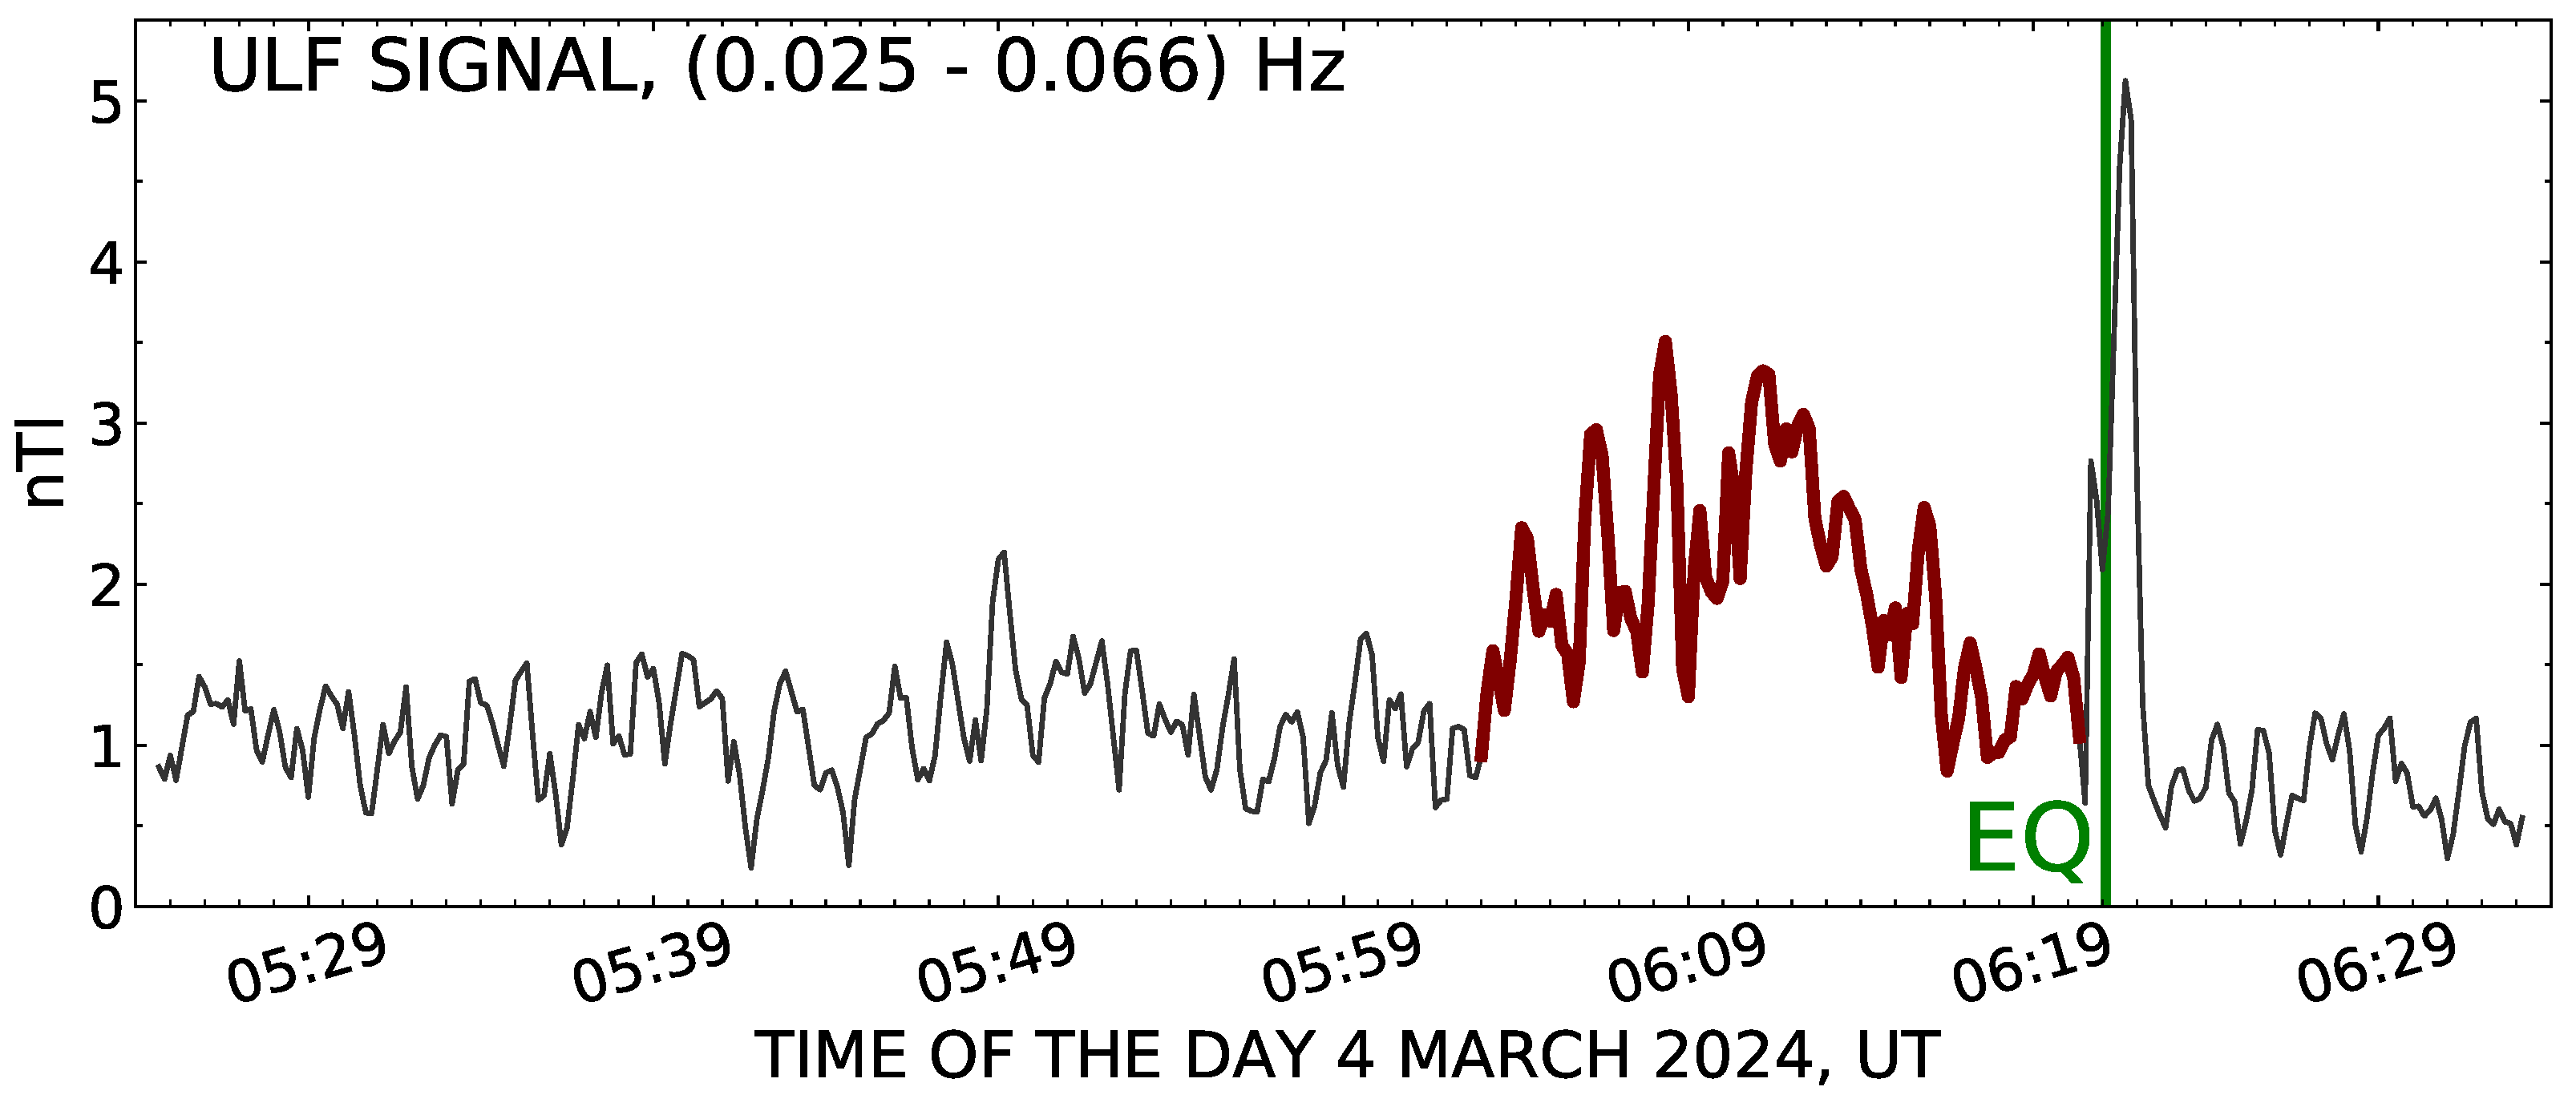
3.5. The ULF Magnetic Variation
Simultaneously with the study of ENPEMF intensity, continuous monitoring of ULF electromagnetic waves is carried out at the Geophysical Observatory. A highly sensitive inductive magnetic sensor of IMS-008 type is used for the purpose, installed with a north–south orientation, similarly to the ferrite antenna of the geophysical recorder MGR-02-16. At the time of the 4 March 2024 earthquake, the sensor was pointing to the earthquake epicenter.
Investigation of electromagnetic phenomena in the 0.001–5 Hz ULF band, as a direct signal from the lithosphere, is mostly perspective for revealing short-term earthquake precursors. The main advantage of such a study is that ULF waves may propagate beneath the surface without significant attenuation. Generally, the immediate electromagnetic emission from the lithosphere is concentrated around the frequency
Hz [
10]. As the authors [
10] believe, the achievement of encouraging predictive results is associated with the local ULF monitoring near the epicenter of large earthquakes having a magnitude
M above 6.
The criteria of objective analysis of seismogenic anomalies in the ULF variation correspond to the conditions of our observation when the magnetic sensor occurred at 12.2 km from the epicenter of a
earthquake, and registration of ULF waves was performed in the 0.0001–20 Hz band. For identification of the effects connected with preparation for the earthquake on 4 March 2024, a dynamic amplitude spectrum of the ULF signal calculated in the range of 0.025–0.066 Hz is shown in
Figure 7.
As seen in
Figure 7, on the day of the earthquake, 18.23 min (1094 s) prior to the main shock, a noticeable increment up to more than 2 nT took place in the spectrum amplitude (which is highlighted in the plot with a bold colored line). This value is close to the conclusion of theoretical studies [
14,
15], where it was shown that magnetic disturbances of the order of
nT may occur at an epicentral distance of 10–50 km before an
earthquake.
Further on, at the coming of the seismic wave to the registration point, a sharp outburst occurred in the ULF signal intensity, which resulted from mechanical shaking of the inductive sensor in the magnetic field of the Earth.
Similar observations of an electromagnetic signal in the band of 0–5 Hz, a few seconds up to several minutes before a seismic event, were considered in [
41] on an example of 10 catastrophic earthquakes that happened in Japan, China, Romania, and other seismically active regions.
3.6. Variation of Doppler Signal
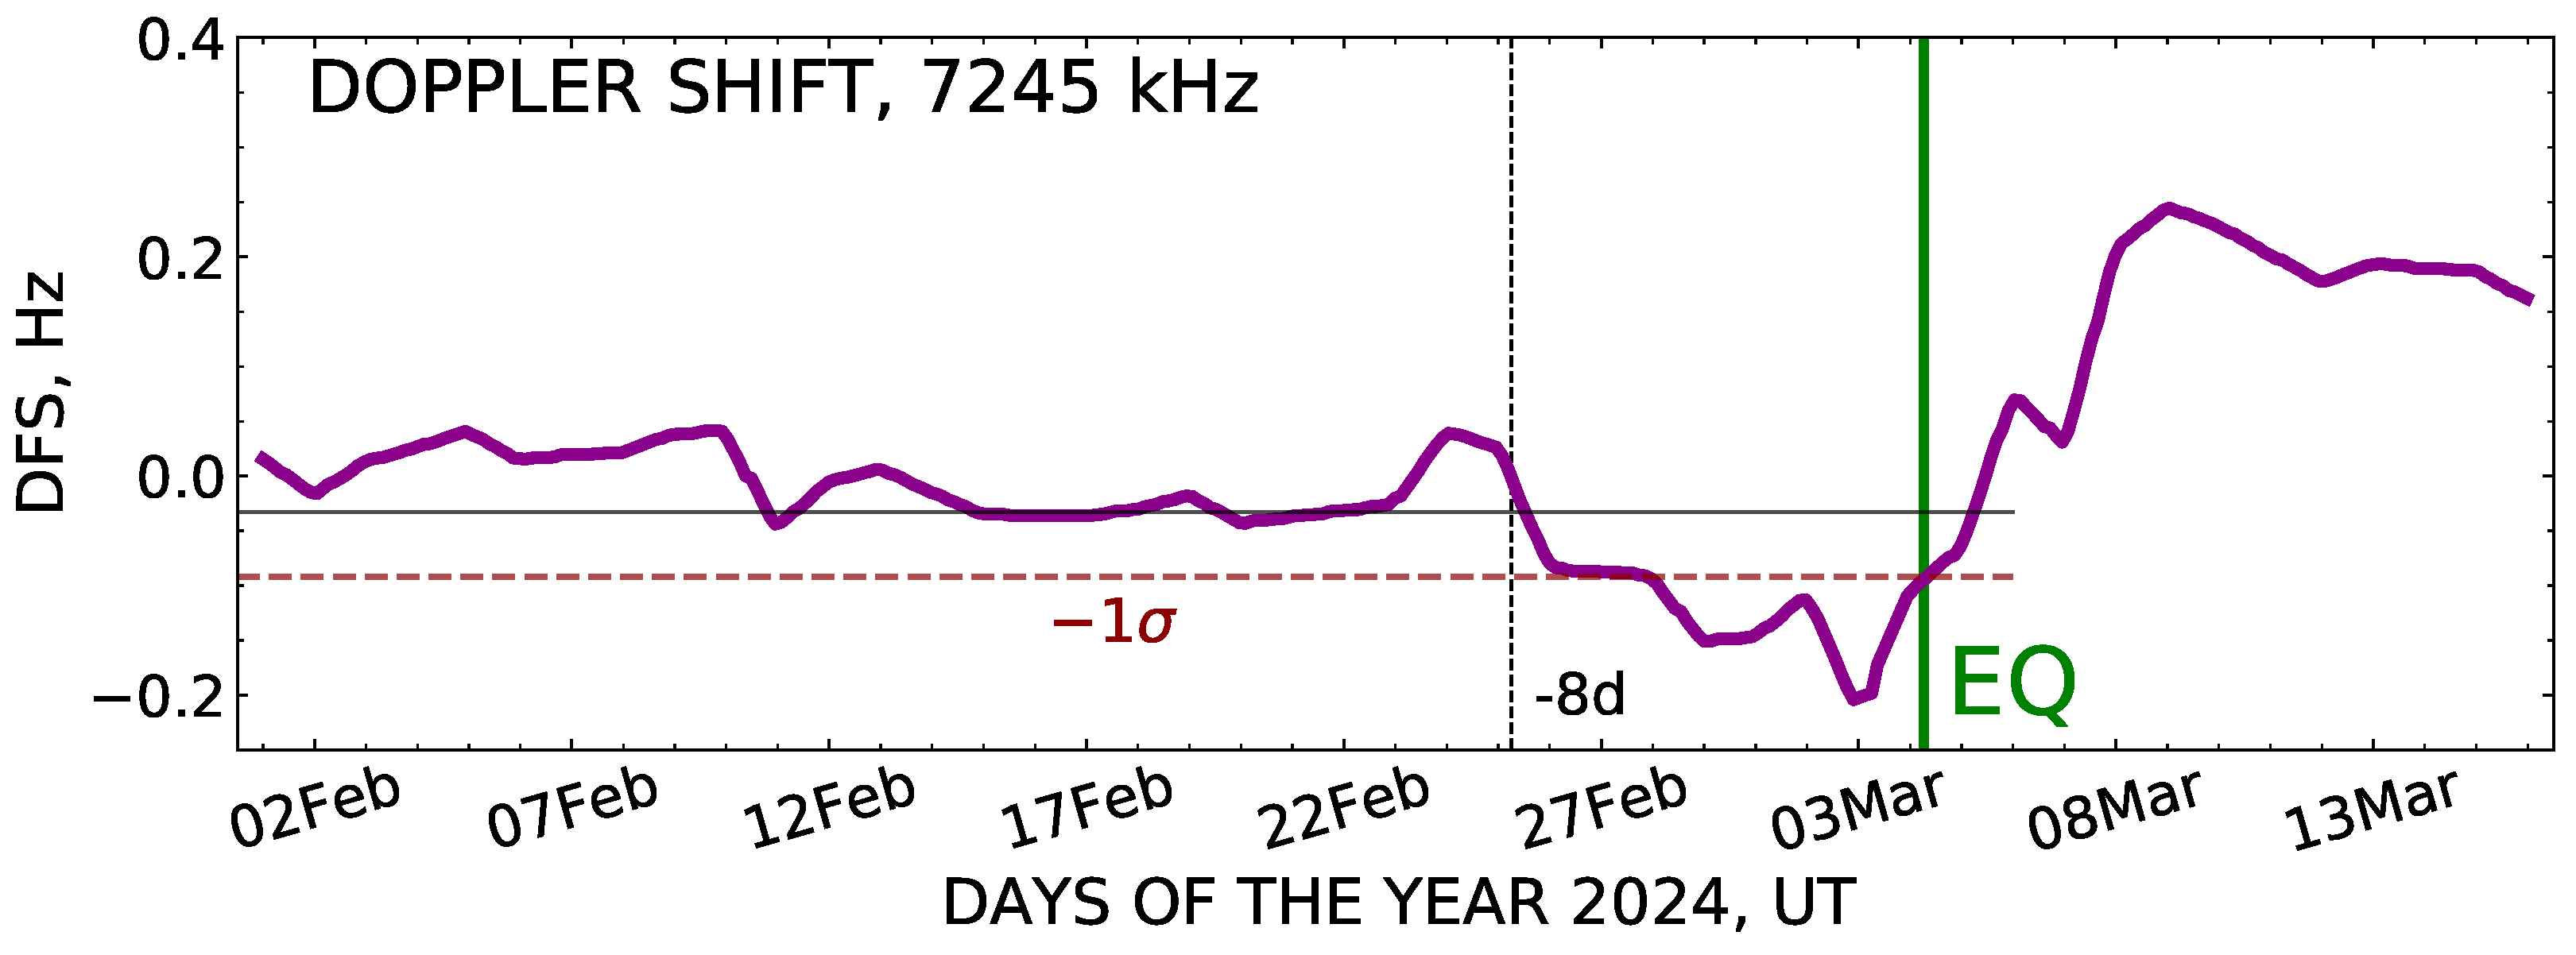
This section presents the data on DFS of ionospheric signals, which were obtained at the Geophysical Observatory, together with the measurements of ULF/VLF electromagnetic fields and gamma radiation background, during the period from 1 February up to 15 March 2024, i.e., both previously and later the 4 March 2024 earthquake.
For the purpose, a hardware and software complex for Doppler measurements was applied, which uses the technique of phase-locked loop (PLL) to estimate the DFS of a larger amplitude beam at multipath signal propagation. A detailed description of the method may be found in [
32], and the results of its application were published in [
33].
Monitoring of DFS variation was carried out on an inclined, 970 km long radio path “Dushanbe-orzu—Institute of Ionosphere (Almaty)”. For DFS measurement, the radio transmitter (TX) of the Dushanbe-orzu broadcasting radio station (Tajikistan,
N,
E) operates at a frequency of
kHz. At such a distance, reflection of radio waves occurs gradually, as a wave passes a sufficiently large section of its path in the ionosphere. In this case, a big reflection area of sounding radio waves is formed, which determines the magnitude of DFS. Selection of the optimal radio frequency was made in accordance with the BBC Frequencies and Sites Catalog of the British Broadcasting Corporation [
42].
The receiver part (RX) of the Doppler radio installation is located at a research station of the Institute of Ionosphere in Almaty (
N,
E). The location diagram of the 4 March 2024
earthquake epicenter relative to the radio path of the Doppler ionosonde is presented in
Figure 8.
As shown in
Figure 8, the Dobrovolsky radius for an
earthquake is
km. (The Dobrovolsky radius limits the area of lithospheric deformations at the preparation of an earthquake and depends on its magnitude
M,
km [
34]). The distance from the epicenter to the sub-ionospheric point in the middle of the radio path (indicated with a red ellipse in
Figure 8) equals 452 km. Thus, the sub-ionospheric point was situated outside the Dobrovolsky zone.
However, as seen in
Figure 8, half of the region of radio wave reflection is shifted by 250 km from the median point towards the earthquake epicenter and thus still hits inside the Dobrovolsky circle. Such a disposition allows us to assume that deformation processes in the lithosphere should find a response in the variation of DFS.
To determine the size of the radio wave reflection region and its height in the ionosphere, a calculation was made of the electron concentration profile and of the propagation trajectory of the sounding radio wave.
3.6.1. The Profile of Electron Concentration
The profile of electron concentration (
) was evaluated each day, starting from 28 February 2024 and up to 4 March 2024, for the time between 05:00 and 13:00 UT, with a step of 2 h. Note that such a time span corresponds to daytime solar time, which is defined as UT+5. The calculation was made immediately at the website [
43] for the median point on the radio path and in accordance with the model IRI2020. An example of the calculation result obtained for the date of 28 February 2024 is shown in the left plot of
Figure 9.
The
profile presented in
Figure 9 indicates that over the course of 8 h, during the time interval of 5:00–13:00 UT on 28 February, the maximum electron concentration in the ionosphere was changing from
to
. On another day, 4 March 2024, the electron concentration in the same daytime period have varied from
to
, which is 2.2% above the
value seen on 28 February.
3.6.2. The Propagation Trajectory of Sounding Radio Wave
Next, based on the profile of electron concentration determined in the previous step, the propagation of the sounding radio wave was considered, taking into account the Earth’s magnetic field and using the IGRF16 model for the ordinary component [
44]. As an illustration, the trajectories of radio waves calculated for daytime (5 h, 9 h, 12 h, and 13 h UT) on the date 28 February 2024 are presented in
Figure 9, right panel. It is seen in this plot that in the time interval from 5:00 to 13:00 UT, the height of reflection has varied from 129 km to 208 km.
As mentioned above, monitoring of DFS was fulfilled at an extended inclined radio path of 970 km in length. This stipulated a specific reflection of the sounding radio wave from within a low-altitude but fairly large domain in the ionosphere, of about ±250 km in size relative to the middle of the radio path (
Figure 9, right frame). In
Figure 8, the region of radio wave reflection is schematically limited by a black ellipse. As it is seen there, nearly half of this region falls inside the Dobrovolsky circle of the 4 March 2024 earthquake.
At higher altitudes, the reflection region covers a significantly smaller area in the ionosphere.
3.6.3. The Doppler Frequency Shift Measurement Data
The DFS measurements on the inclined radio pass “Dushanbe-orzu—Institute of Ionosphere (Almaty)” at the frequency
kHz were made during the period from 1 February up to 15 March 2024. The data obtained every day in the daytime between 5:00 and 17:00 UT were used for the calculation of the mean DFS value for the corresponding date. These data are presented in
Figure 10, after additional smoothing of the distribution of DFS daily means with a four-point running average filter.
As a result, a cove-like decrease in DFS variation is seen in the plot of
Figure 10, which starts on 25 February, 8 days before the earthquake, and reaches maximum on 2–3 March, just on the eve of it.
To evaluate the statistical significance of the observed anomaly, the time series of DFS data gained since 25 February and up to 4 March, i.e., during the appearance of the anomalous effect before the earthquake, was compared against the background record made in the foregoing period, 1–25 January 2024. For comparison, the mean values and standard deviations were defined for both datasets. Then, based on the calculated Student criterion , a high level of statistical confidence was estimated for the difference between the background time series and the effect observed in DFS before the earthquake.
The appearance moment of the anomaly in DFS, 8 days before the earthquake on 4 March 2024, agrees well with the times when ionospheric disturbances preceding major earthquakes were reported by other ground-based and satellite observations [
21,
23,
45,
46].
3.7. The Lithosphere–Ionosphere Coupling
The observations accomplished in time of the 4 March 2024
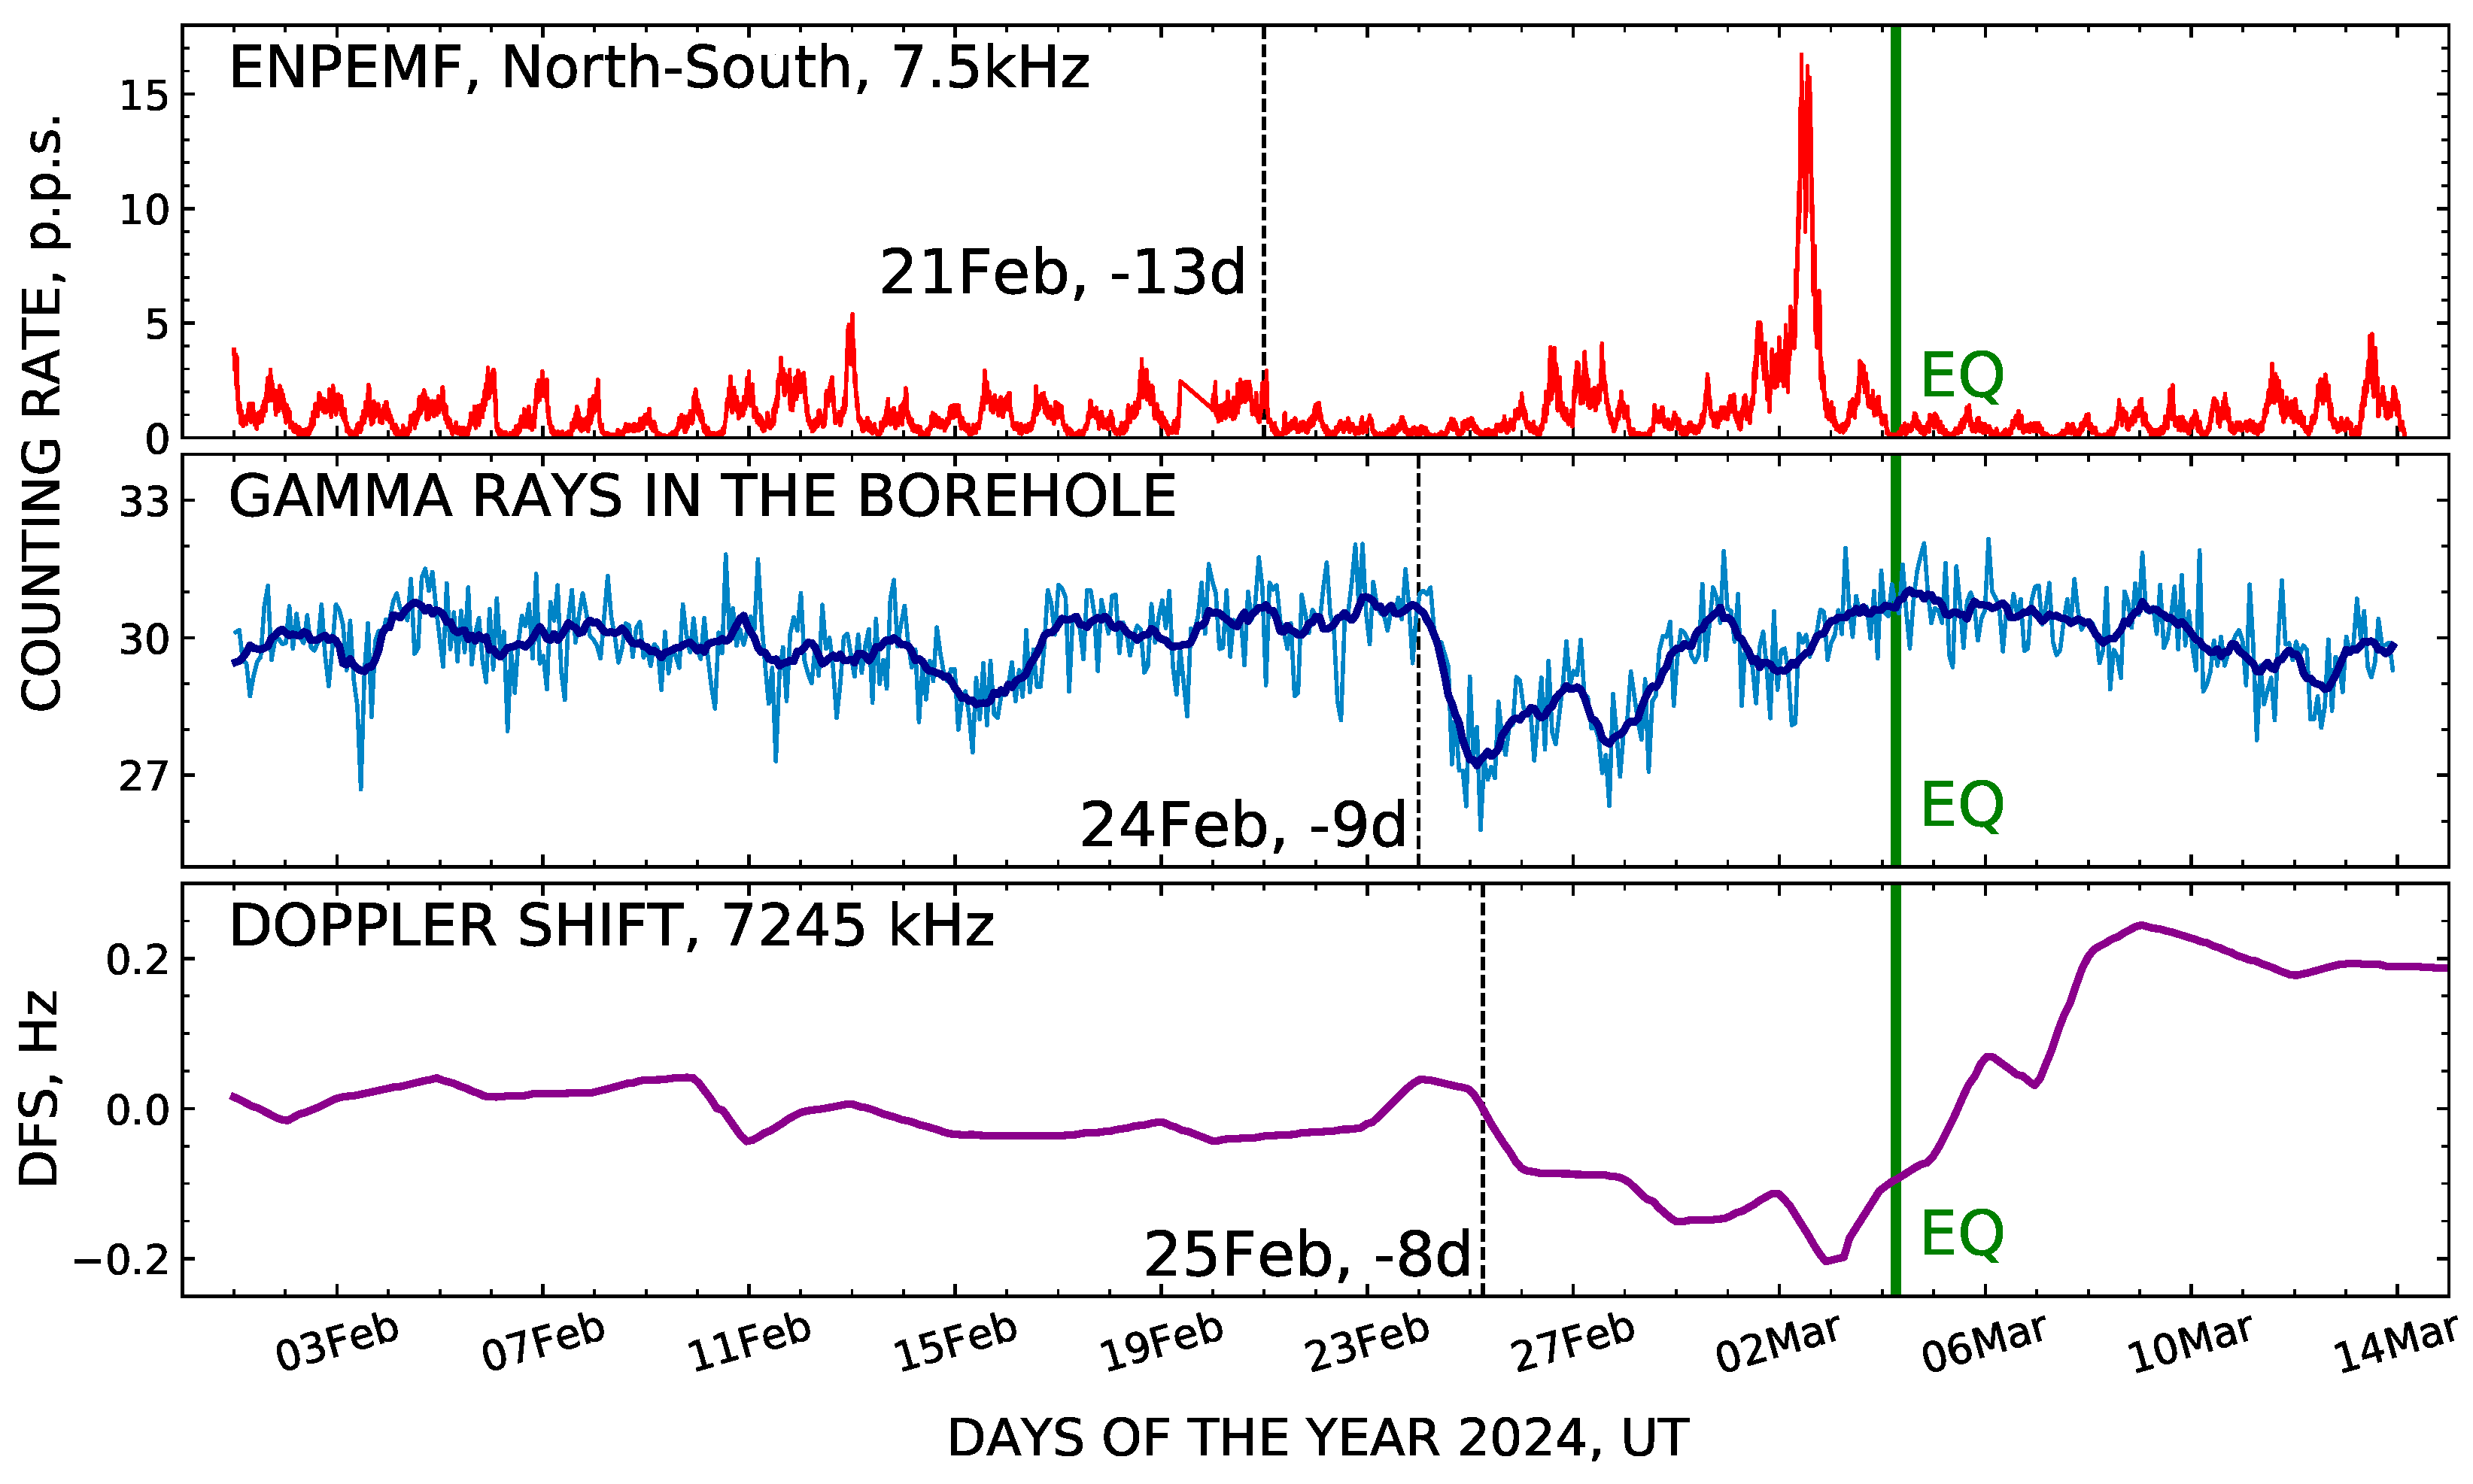
earthquake allowed us to draw a comprehensive analysis, which significantly extends the possibility of interpreting the data obtained as mutually confirming seismogenic anomalies accompanying the earthquake preparation. For the convenience of the analysis, a comparison is made in
Figure 11 between the time series considered above on ENPEMF data, underground gamma rays, and DFS of ionospheric signal during the earthquake preparation period. In the figure, it is clearly seen sequential order of disturbance appearance: first in the intensity of ENPEMF (21 February), then in the subsurface gamma-ray flux (24 February), and then in the DFS (25 February).
After the suppression of the characteristic diurnal ENPEMF cycle (upper graph), electromagnetic pulses reach their maximum intensity on the eve of the main shock. Apparently, this variation reflects the dynamics of deformation and destruction processes in rocks in the earthquake focus [
2,
3,
4].
In turn, the stress load and the change in the volume of porous space impact the emanation process of radon and its gamma-radioactive daughter products. This is revealed as a cove-like decrease in the intensity of gamma rays (middle graph). Consequently, the anomalies detected may carry information about mechanical processes that proceeded in the lithosphere in the short-term preparation period before the earthquake.
Propagation of the seismogenic disturbance up to the ionosphere, as detected by the Doppler ionosonde, can be explained in the frame of the lithosphere–ionosphere coupling [
27,
28]. The initial link in this process could be the varying ionization of the atmospheric boundary layer, which depends on the penetration speed of subsurface radioactive gases onto the Earth’s surface. Actually, as seen in
Figure 11, the negative anomaly in Doppler frequency follows, with a small delay, the anomalous cove-like depression in the gamma-ray background as measured at a depth of subsoil rocks.
4. Conclusions
On 4 March 2024, an earthquake () occurred, with the epicenter at a distance of 12.2 km only from the complex of measuring equipment of the Geophysical Observatory. In the Almaty city, 30 km from the epicenter, this earthquake was felt with an intensity of 5–6 points on the MSK-64 scale.
In preparation for this seismic event, we detected in real time, 8 days before the main shock, when a characteristic cove-like depression appeared in the gamma-ray flux measured at a depth of 100 m, which effect indicated an approaching earthquake with high probability. A decrease (or sometimes increase) in the intensity of gamma rays underground is determined by peculiarities of the emanation dynamics of radon and radioactive products of its decay, which serves as an indicator of change in the stress–strain state of rocks during the activation of the seismic process.
With regard to attention paid to ULF/VLF signals as potential precursors of earthquakes, an analysis was performed of the intensity of ENPEMF at the very low frequencies kHz and kHz and of the ULF waves in the band of 0.001–3 Hz.
In order to study the possibility of disturbance transmission from the lithosphere to the ionosphere, the monitoring data on the DFS of ionospheric signal were involved in consideration.
Summarizing the results of the present study, the following may be concluded:
1. Seismogenic disturbances were detected among the ENPEMF signals registered at the frequency kHz when the ferrite antenna of the recorder was directed toward the epicenter of the earthquake. An amplitude decrease of the ENPEMF background variation with violation of the characteristic diurnal rhythm was revealed 13 days before the main shock, succeeded by a distinct, five times above the background level, burst, which occurred 2 days before the shock.
2. It was shown that the class geomagnetic storm on 3 March 2024 had no impact on the intensity of ENPEMF. This was determined through simultaneous monitoring of the ENPEMF variation with the geophysical recorders of the same type (MGR-02-16), situated at various distances from the earthquake epicenter.
3. An anomalous ULF signal was registered in the variation of the horizontal component of the Earth’s magnetic field by an IMS-008 inductive magnetic sensor when the sensor was oriented in the direction of the epicenter. Noticeable magnification in the amplitude of the dynamic ULF spectrum, surpassing the background level by more than 2 nT, preceded the main shock by 18.23 min.
4. A prolonged cove-like disturbance appeared 8 days before the main shock in the variation of the DFS of the ionospheric signal.
5. It was revealed a sequence of disturbance appearance, first in the variations of the ENPEMF at very low frequencies and of the gamma ray background at rock depth, which reflect the activation dynamic of tectonic processes in the lithosphere, next in the DFS of ionospheric signal.
6. Transmission of the perturbation of seismogenic nature from the lithosphere up to the heights of the ionosphere, as detected by the Doppler ionosonde, can be explained by the concept of lithosphere–ionosphere coupling [
27,
28]. According to the concept, this process may have originated from a change in ionization of the atmospheric boundary layer, caused, in turn, by the exhalation of radioactive gases onto the surface.
7. Observed simultaneity in appearance before the earthquake of the anomalies in various geophysical fields enhances the confidence in the connection of each particular effect with the preparation process of this seismic event.
A comprehensive analysis of the multi-parameter experimental observations has greatly expanded the interpretation possibility of the mutually corroborating data acquired near the epicenter as seismogenic anomalies preceding the earthquake.


 ,
, 

