3. Occurrence Probability of Spectral Anomaly Features
We analyze in this Section the amplitude and phase variations of TBB transmitters as detected by the Graz facility. The distances and the sensitive regions, as derived from the Dobrovolsky preparation area and Fresnel zone, are given in
Section 3.1. An overview of the TBB amplitude and phase variations is given in
Section 3.2, followed by analysis of minima and maxima features in
Section 3.3, and jumps and inflexions, i.e., new anomalies, in
Section 3.4. Both the methods of Hayakawa et al. [
10] and Boudjada et al. [
48] are considered in
Section 3.5. The occurrence probability of the observed spectral anomalies is detailed in
Section 3.6, followed by the estimation of the spectral anomaly time shifts in
Section 3.7. A period of 17 days is analysed in this work, 14 days from 23 January to 5 February, the day of the EQ on 6 February, and 2 days from 7 to 8 February 2023.
3.1. Geographical Location of Turkey–Syria Earthquake
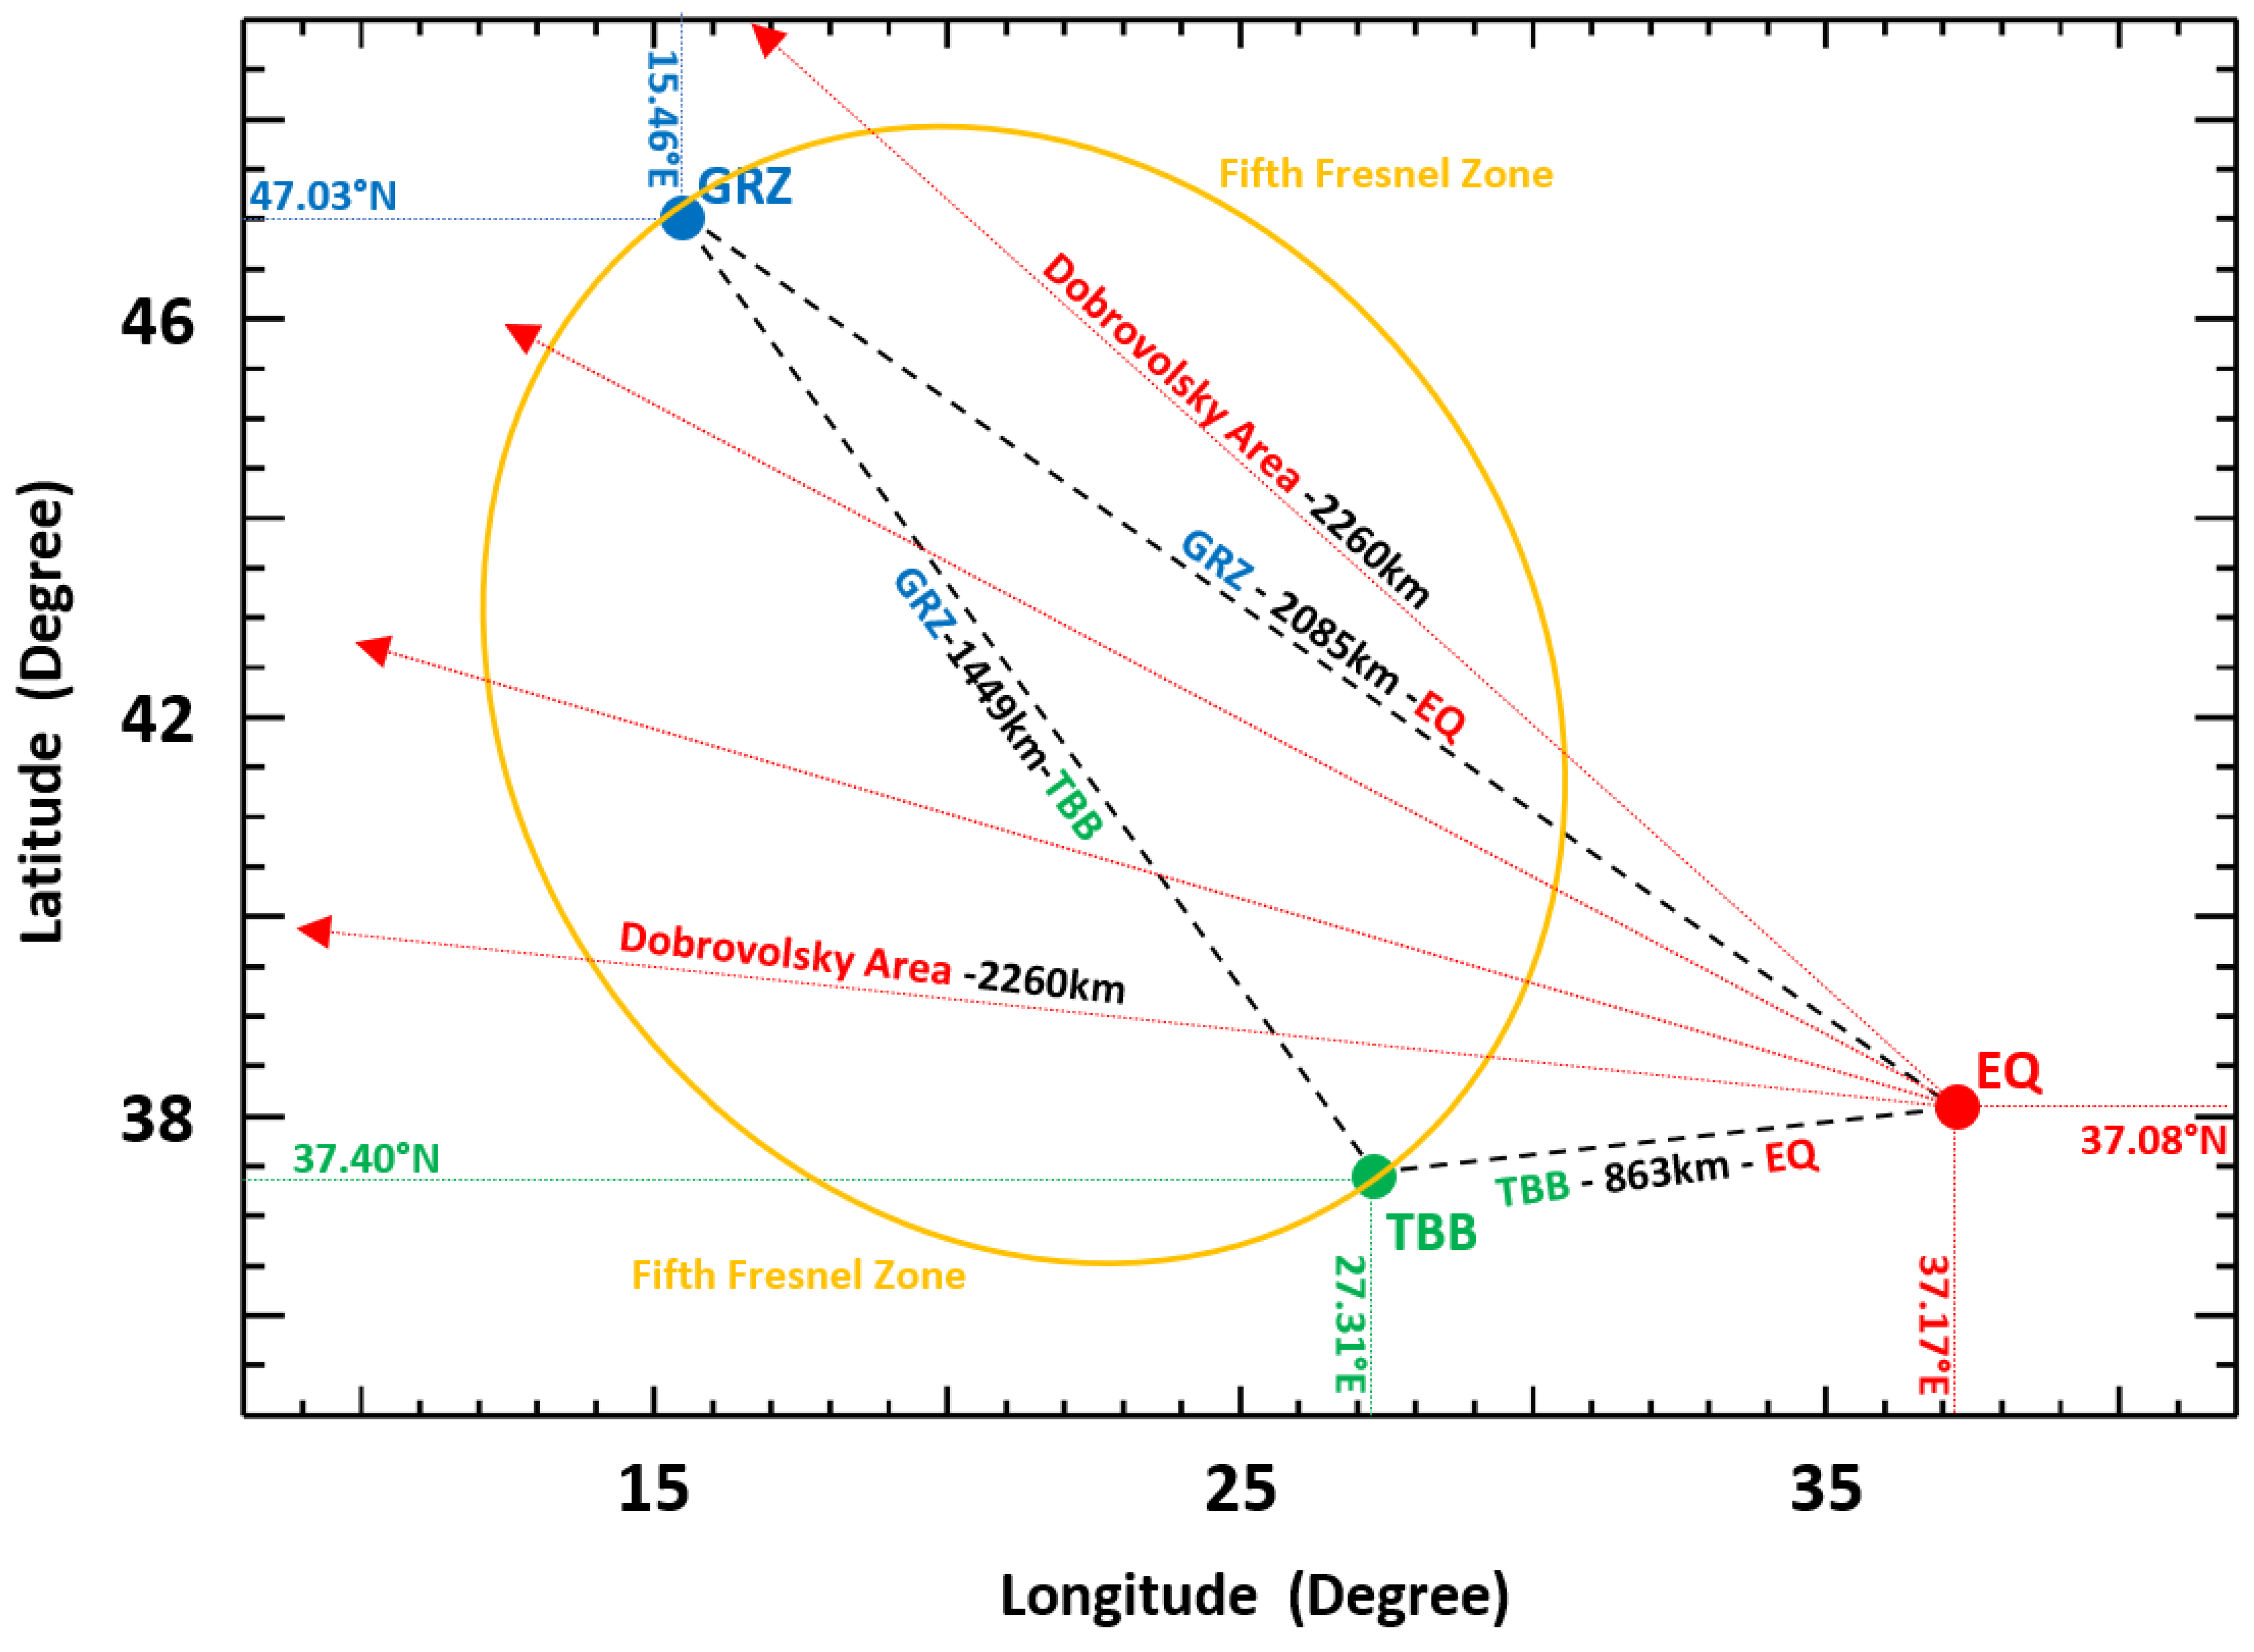
Figure 1 displays the geographical locations of the Graz facility (GRZ, Austria), TBB transmitter station (TBB, Turkey), and earthquake epicenter at Gaziantep (EQ, Turkey). It can be observed that the GRZ facility is localized in the northern part at a latitude of about 47° N, and the TBB station and EQ epicenter in the southern part at a latitude in the order of 37° N. The distances GRZ–EQ, GRZ–TBB and TBB–EQ are, respectively, in the order of 2080 km, 1450 km, and 860 km. We define a pre-seismic sensitive region using two well-known relationships. The Dobrovolsky preparation zone is estimated from
ρ = 10
0.43M, where
M is the EQ magnitude and
ρ is the Dobrovolsky radius shown in
Figure 1 with red line arrows. We find
ρ equal to 2260 km when considering that Mw = 7.8 in the investigated seismic event. The second relationship is the elliptic Fresnel zone, where the minor semi-axis
b is derived from
b ≅ [
λ.
D/2]
0.5 D is the distance between the TBB emitter and GRZ receiver equal to 1449 km, and
λ is the transmitter wavelength of 77 km. In this relationship, we neglect the ratio (
h/
D)
2, which is found to be much smaller than 1, where
h is the average reflection height equal to 80 km. The orange elliptical curve in
Figure 1 defines the fifth Fresnel zone, with
b equal to about 1180 km. The pre-seismic sensitive region is found to be further extended when one takes into consideration the Dobrovolsky preparation zone and limited with regard to the Fresnel elliptic area. Despite the difference between both areas, the ray paths of the TBB transmitter signal are mainly inside the sensitive region, enabling high detection probabilities of precursor anomalies.
3.2. Overview of Amplitude and Phase Variations of TBB Transmitter Signal
Hereafter, we give an overview of the TBB transmitter signal variation. It is important to report that a new reception system (i.e., UltraMSK-2) was installed at the end of 2021 at the Graz facility, tested in the first semester of 2022, and has been in full operation since September 2022. More details about UltraMSK-2 software can be found on
https://www.ultramsk.com (accessed on 18 June 2025). The absence of intense seismic events, since September 2022, did not allow us to consider other EQs. The occurrence of the Turkey–Syria EQ provides us with the first good opportunity to use UltraMSK-2 observations. Only the TBB transmitter signal has been investigated in this work because its ray paths occurred in the Dobrovolsky preparation zone [
50] and its location is not far from the EQ epicenter location. Other transmitters, particularly the ICV and ITS VLF transmitters, have not been included, because their ray paths were outside the Dobrovolsky preparation zone, and their phase variations exhibit several rotations per day, contrary to the TBB phase, which is almost constant during the day and nighttime intervals.
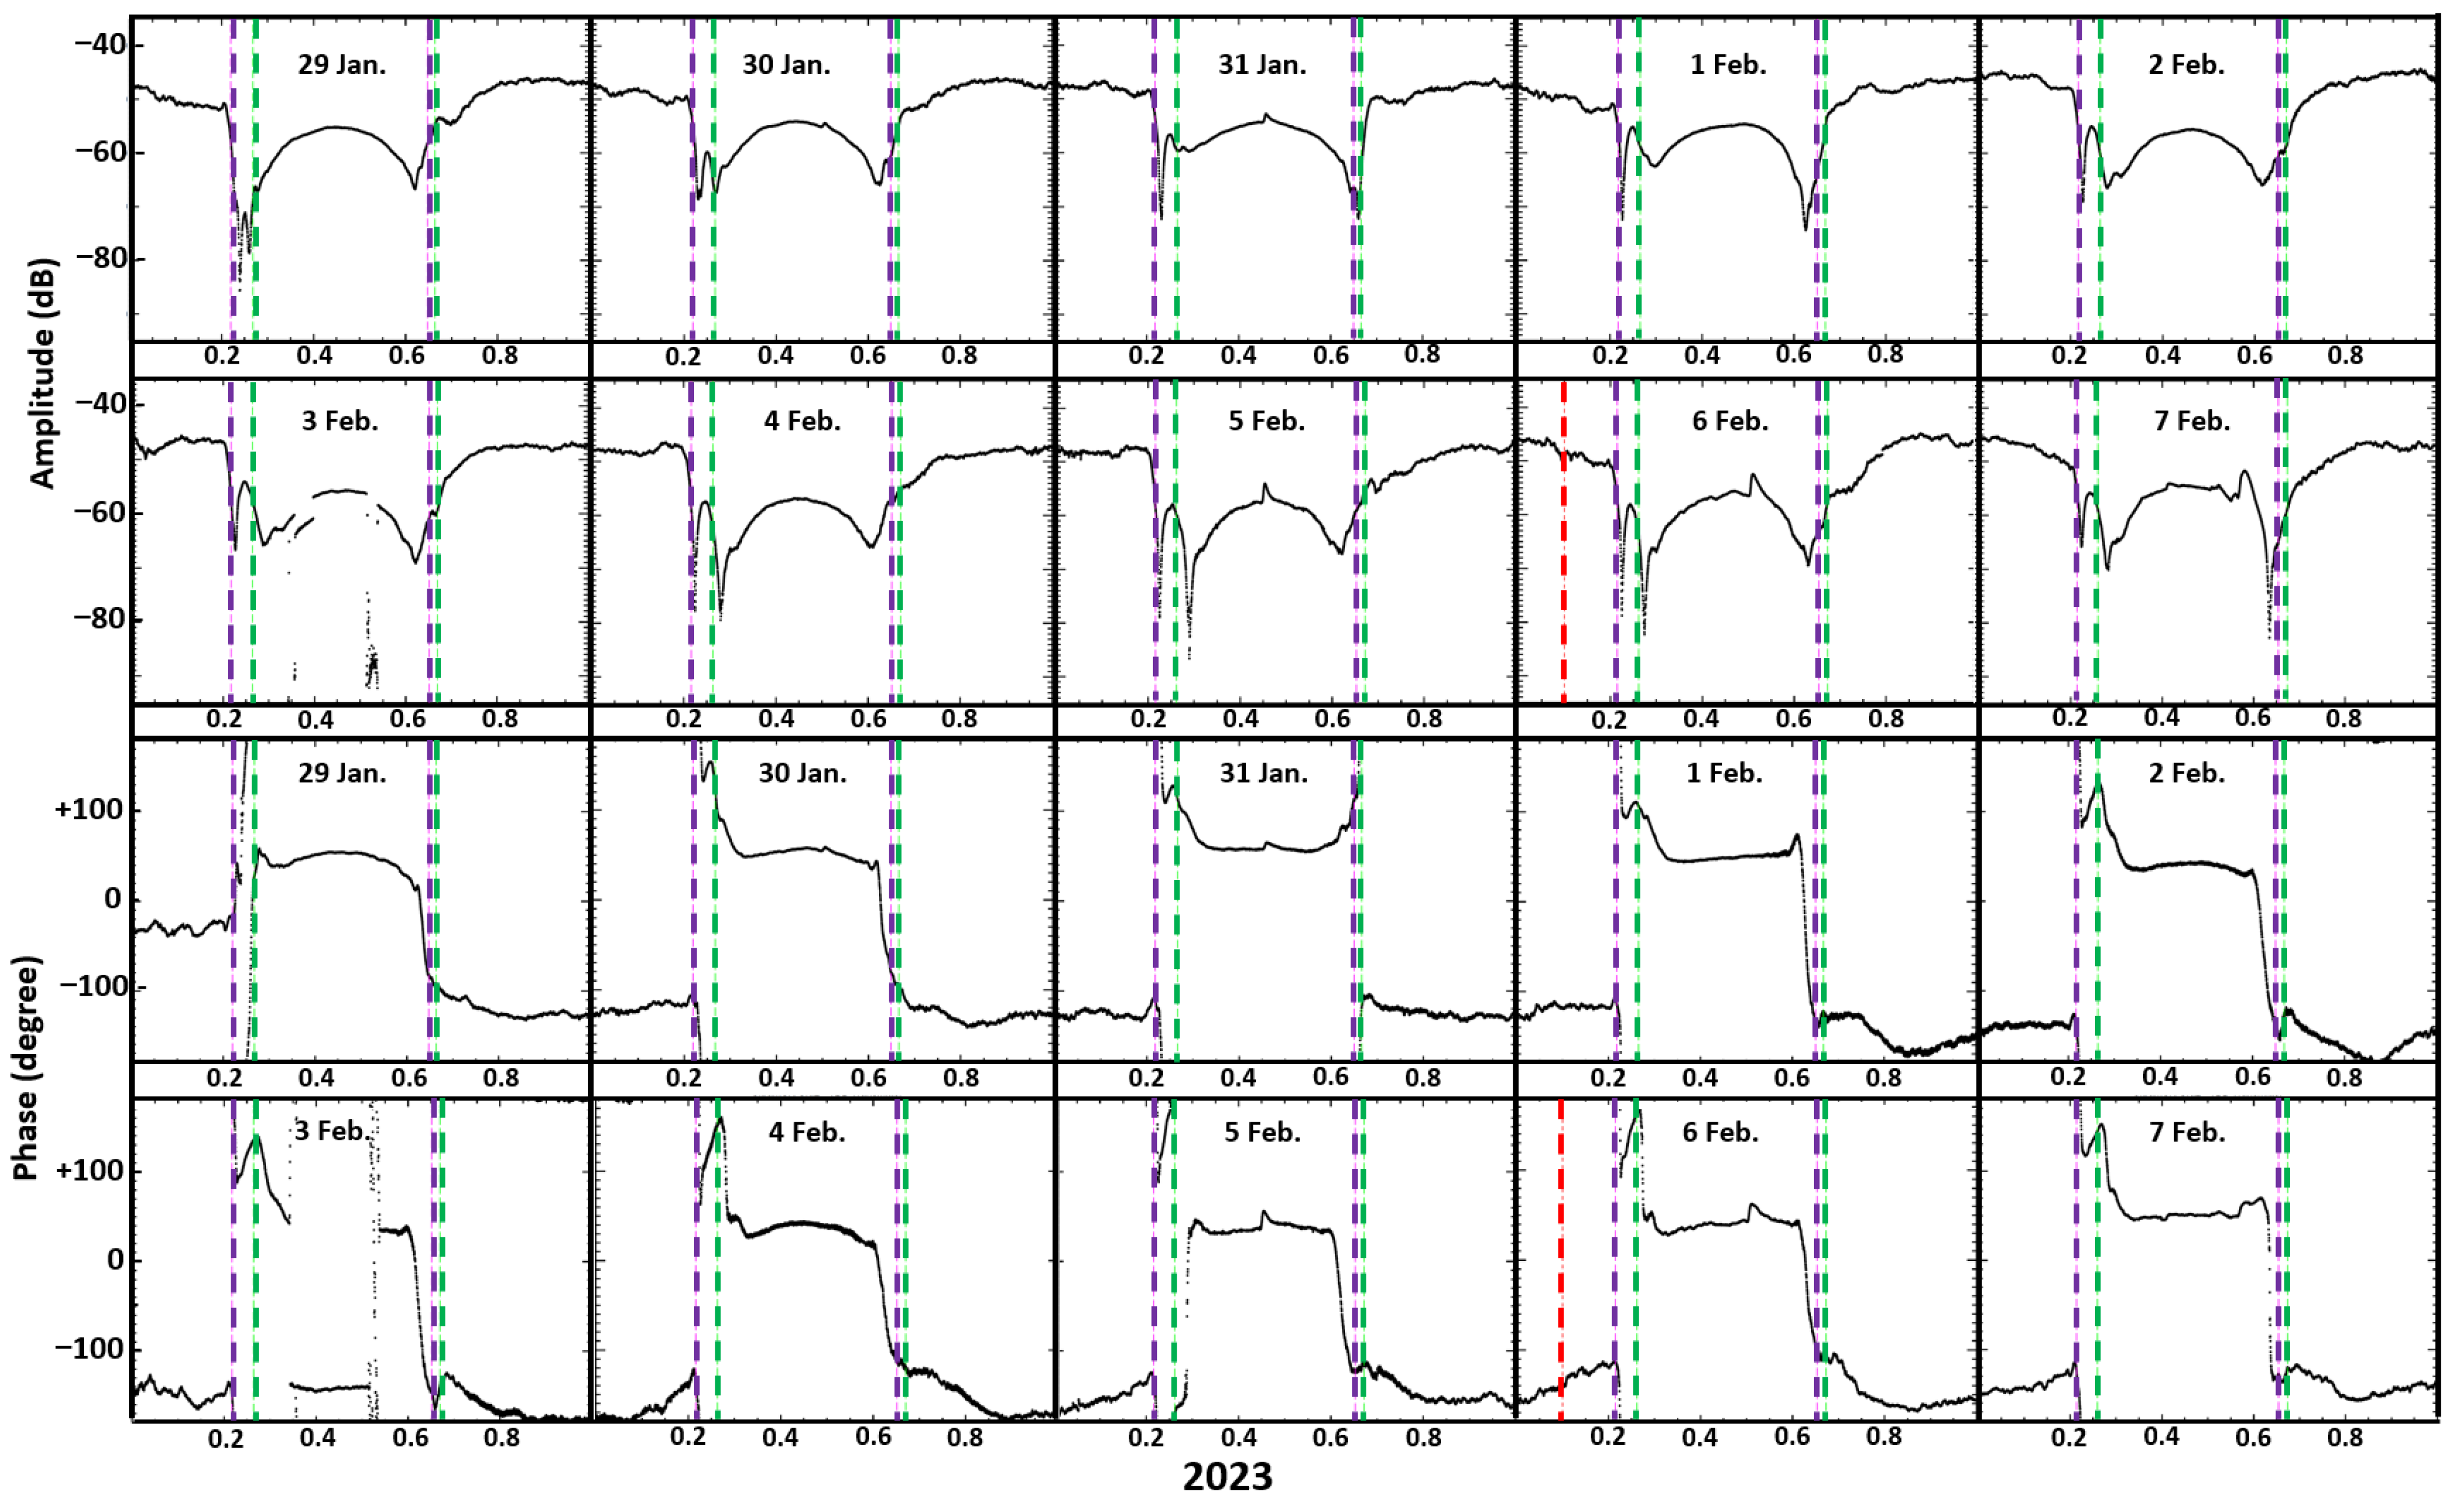
Figure 2 displays the daily recorded TBB signal fluctuations in the period from 29 January (29 DOY (day of the year 2023)) to 7 February (39 DOY) 2023. The time of the earthquake is marked by red vertical dashed lines for the amplitude and the phase signals. The Graz facility and TBB station terminators are indicated, respectively, by magenta and green vertical dashed lines. The two upper panels (i.e., with 10 sub-panels) of
Figure 2 illustrate the amplitude variation, where the beginning and the end of the night fluctuations are marked by the sunset and sunrise time terminators, and vice versa for the day variations. At terminator times, the level of the amplitude is, on average, in the order of −75 dB, very close to the background noise. During the night and day periods, the amplitude signals are, respectively, intense at about −45 dB and decrease to less than −55 dB. The two lower panels of
Figure 2 (i.e., with 10 sub-panels) display the phase variations of the TBB transmitter signal. As in the case of the amplitude fluctuations, magenta, green and red vertical dashed likes indicate, respectively, the TBB terminators, Graz terminator and time of EQ occurrence. Sunrise and sunset terminators separate day and night observations with the particular presence of abrupt variations of phase angle, as detailed in
Section 3.4. During the investigated period, from 23 January 2023 to 8 February 2023, solar and geomagnetic activities were generally low. The value of the mean 3 h-Kp-index is principally found to be lower than 5, corresponding to low geomagnetic activity. The solar effect is mainly associated with solar flares, where the amplitude and phase are intensified during several minutes, mostly during the day, and not during night observations. Only on two occasions were solar flares recorded on four days, at the end of January (i.e., 30 DOY and 31 DOY), and close to the EQ occurrence (i.e., 36 DOY and 37 DOY). It can be seen in
Figure 2, for the previously cited days, the enhancements of the amplitude and the phase at around mid-day.
3.3. Minima and Maxima Anomalies at Sunrise and Sunset Terminators
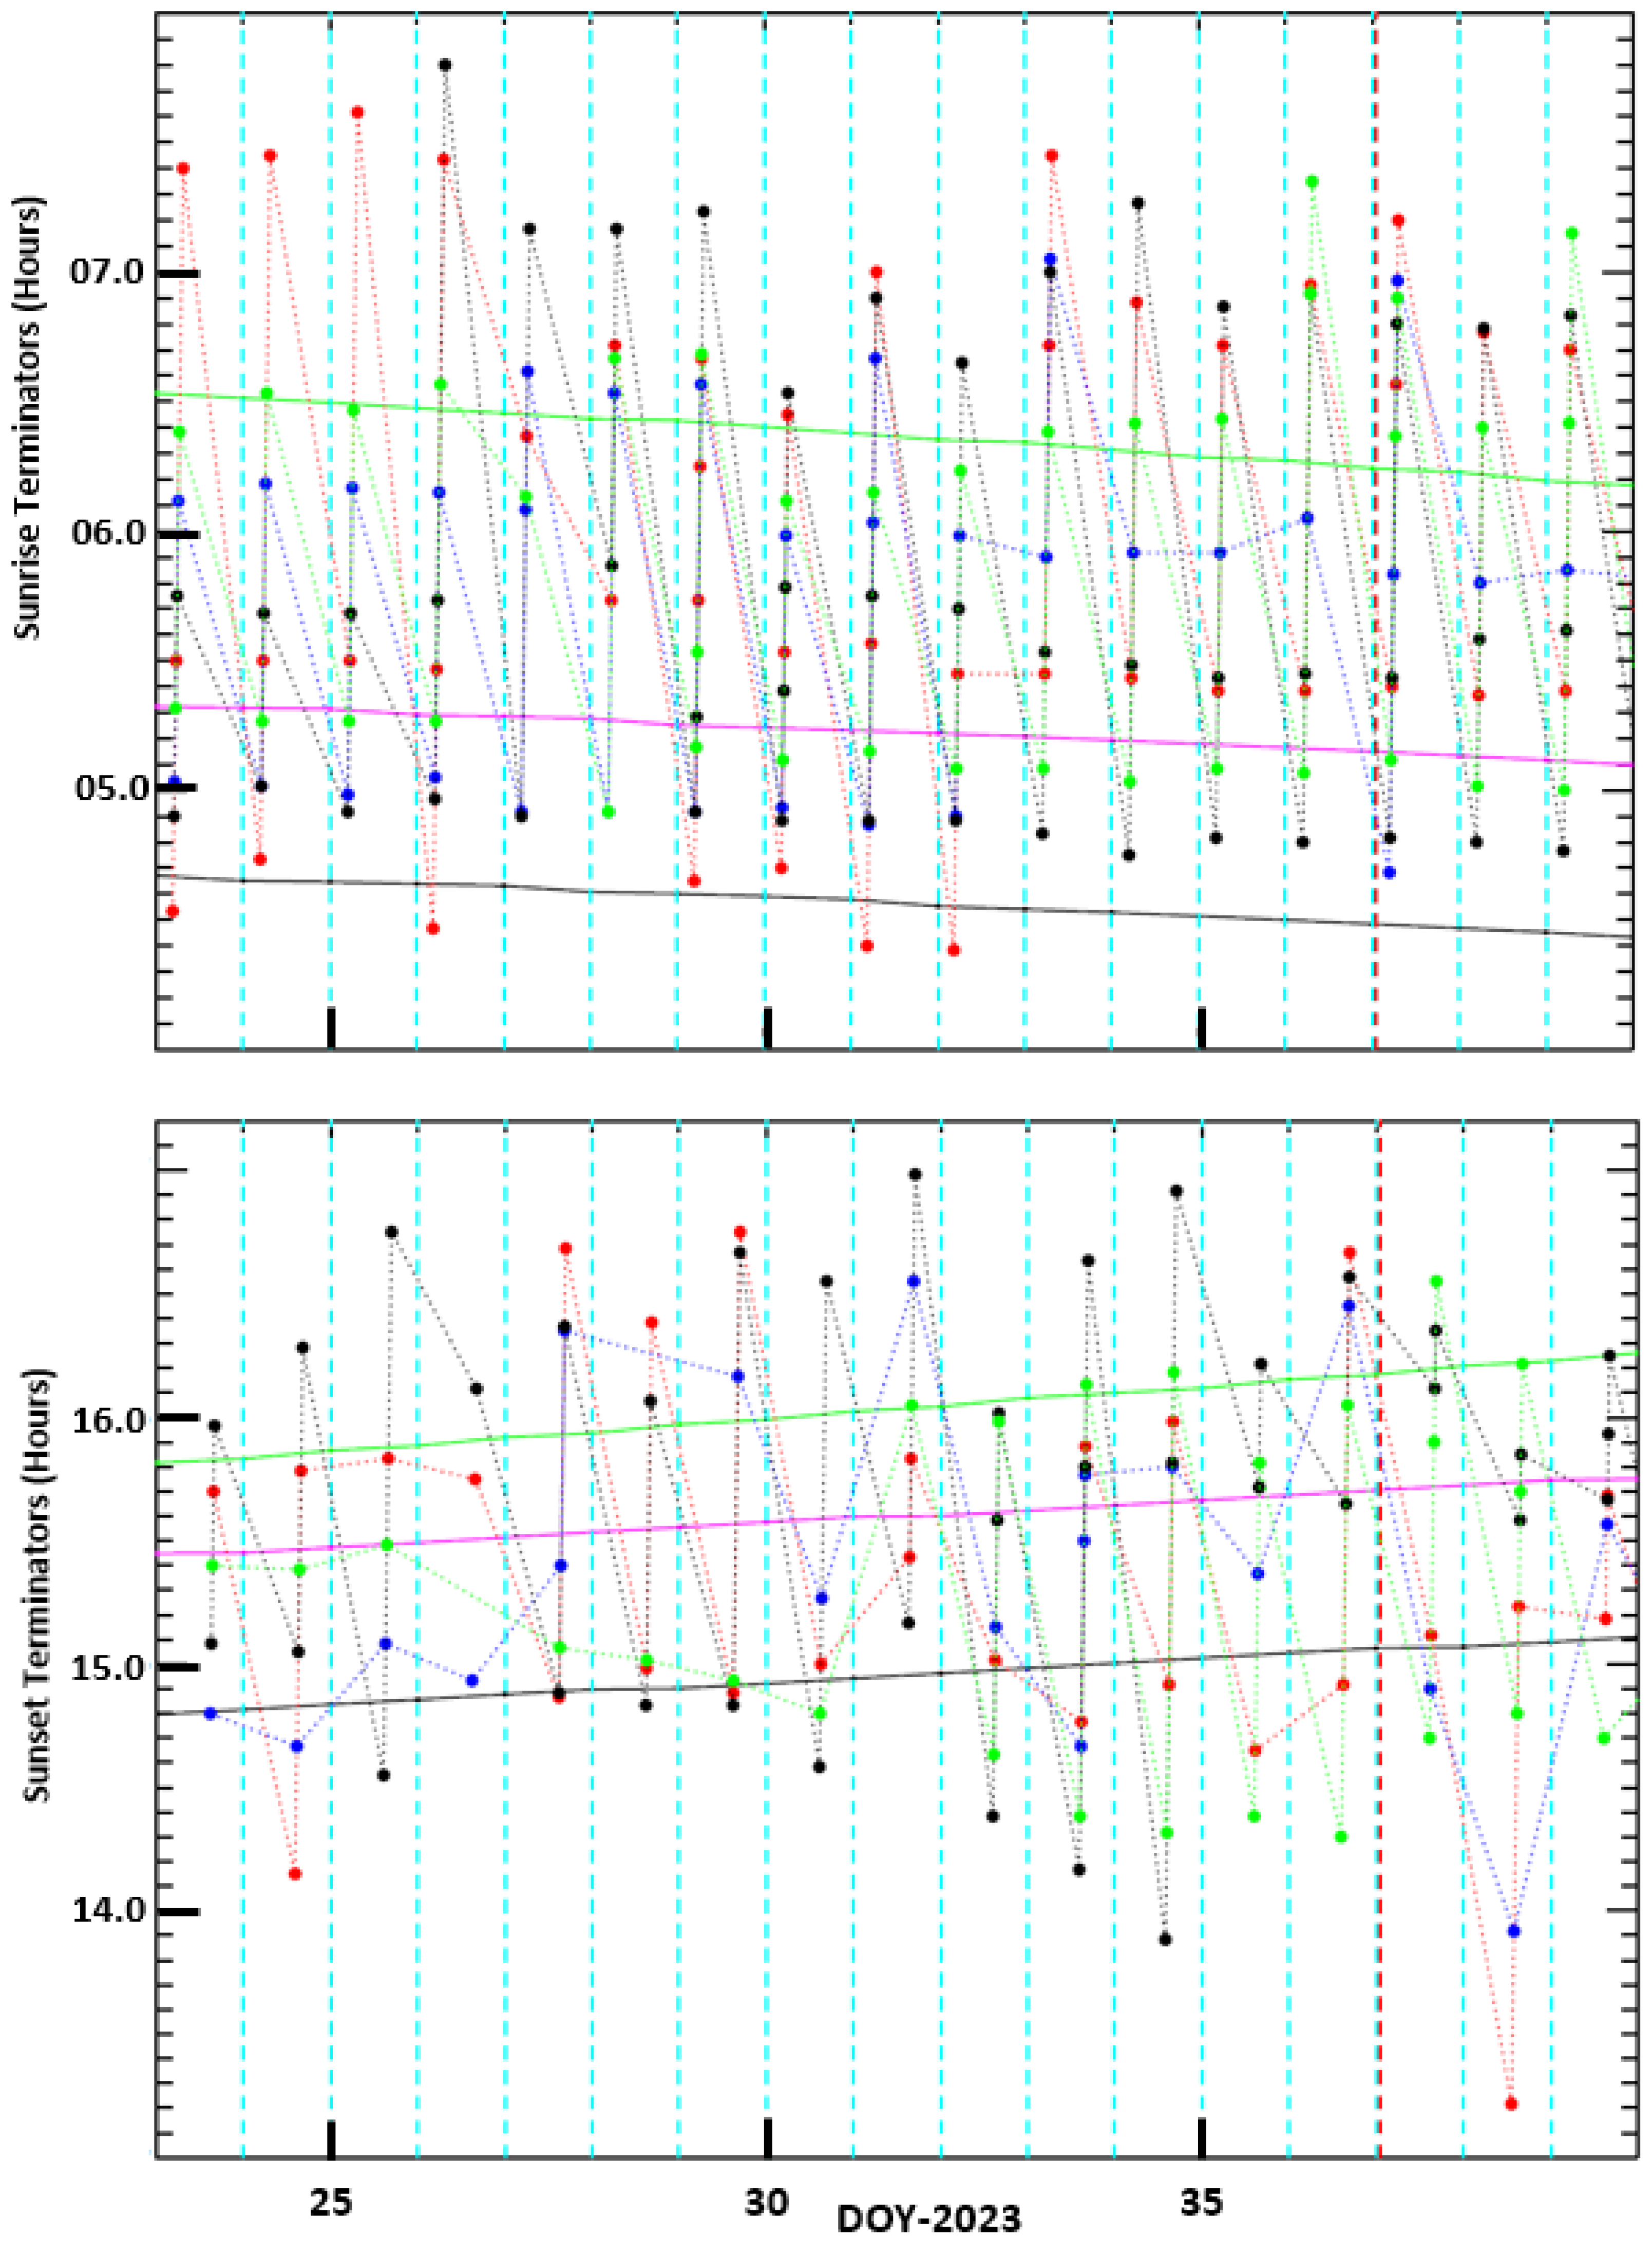
Figure 3 shows the variation of extrema by day of the year (DOY) 2023, as investigated by Boudjada et al. [
48]. The colored circles indicate minima (red) and maxima (blue) for the amplitude, and minima (black) and maxima (green) for the phase. The day of the earthquake (i.e., 6 February 2023—37 DOY) is indicated by a red vertical dashed line. The terminator variations of Graz VLF facility (47.03° N, 15.46° E, Graz, Austria), TBB transmitter station (37.40° N, 27.31° E, Baffa, Turkey) and EQ epicenter (37.17° N, 37.08° E, Gaziantep, Turkey) are signaled, respectively, by green, magenta and black lines. From the 284 extrema recorded in 17 days (i.e., from 23 January to 8 February 2023), 167 extrema were observed at sunrise (upper panel of
Figure 3) and 117 at sunset (lower panel of
Figure 3).
Table 1 lists the number of minima and maxima recorded at sunrise and sunset terminators as derived from the amplitude and the phase of the TBB transmitter signal. These extrema are displayed in Figure 5 and Figure 6 in Boudjada et al. [
48], respectively, for amplitude and phase.
3.4. Jumps and Inflexions as Spectral Features
In Boudjada et al. [
48] only extrema (minima and maxima) have been exploited to study the terminator anomalies as indicated in
Section 3.3 and displayed in
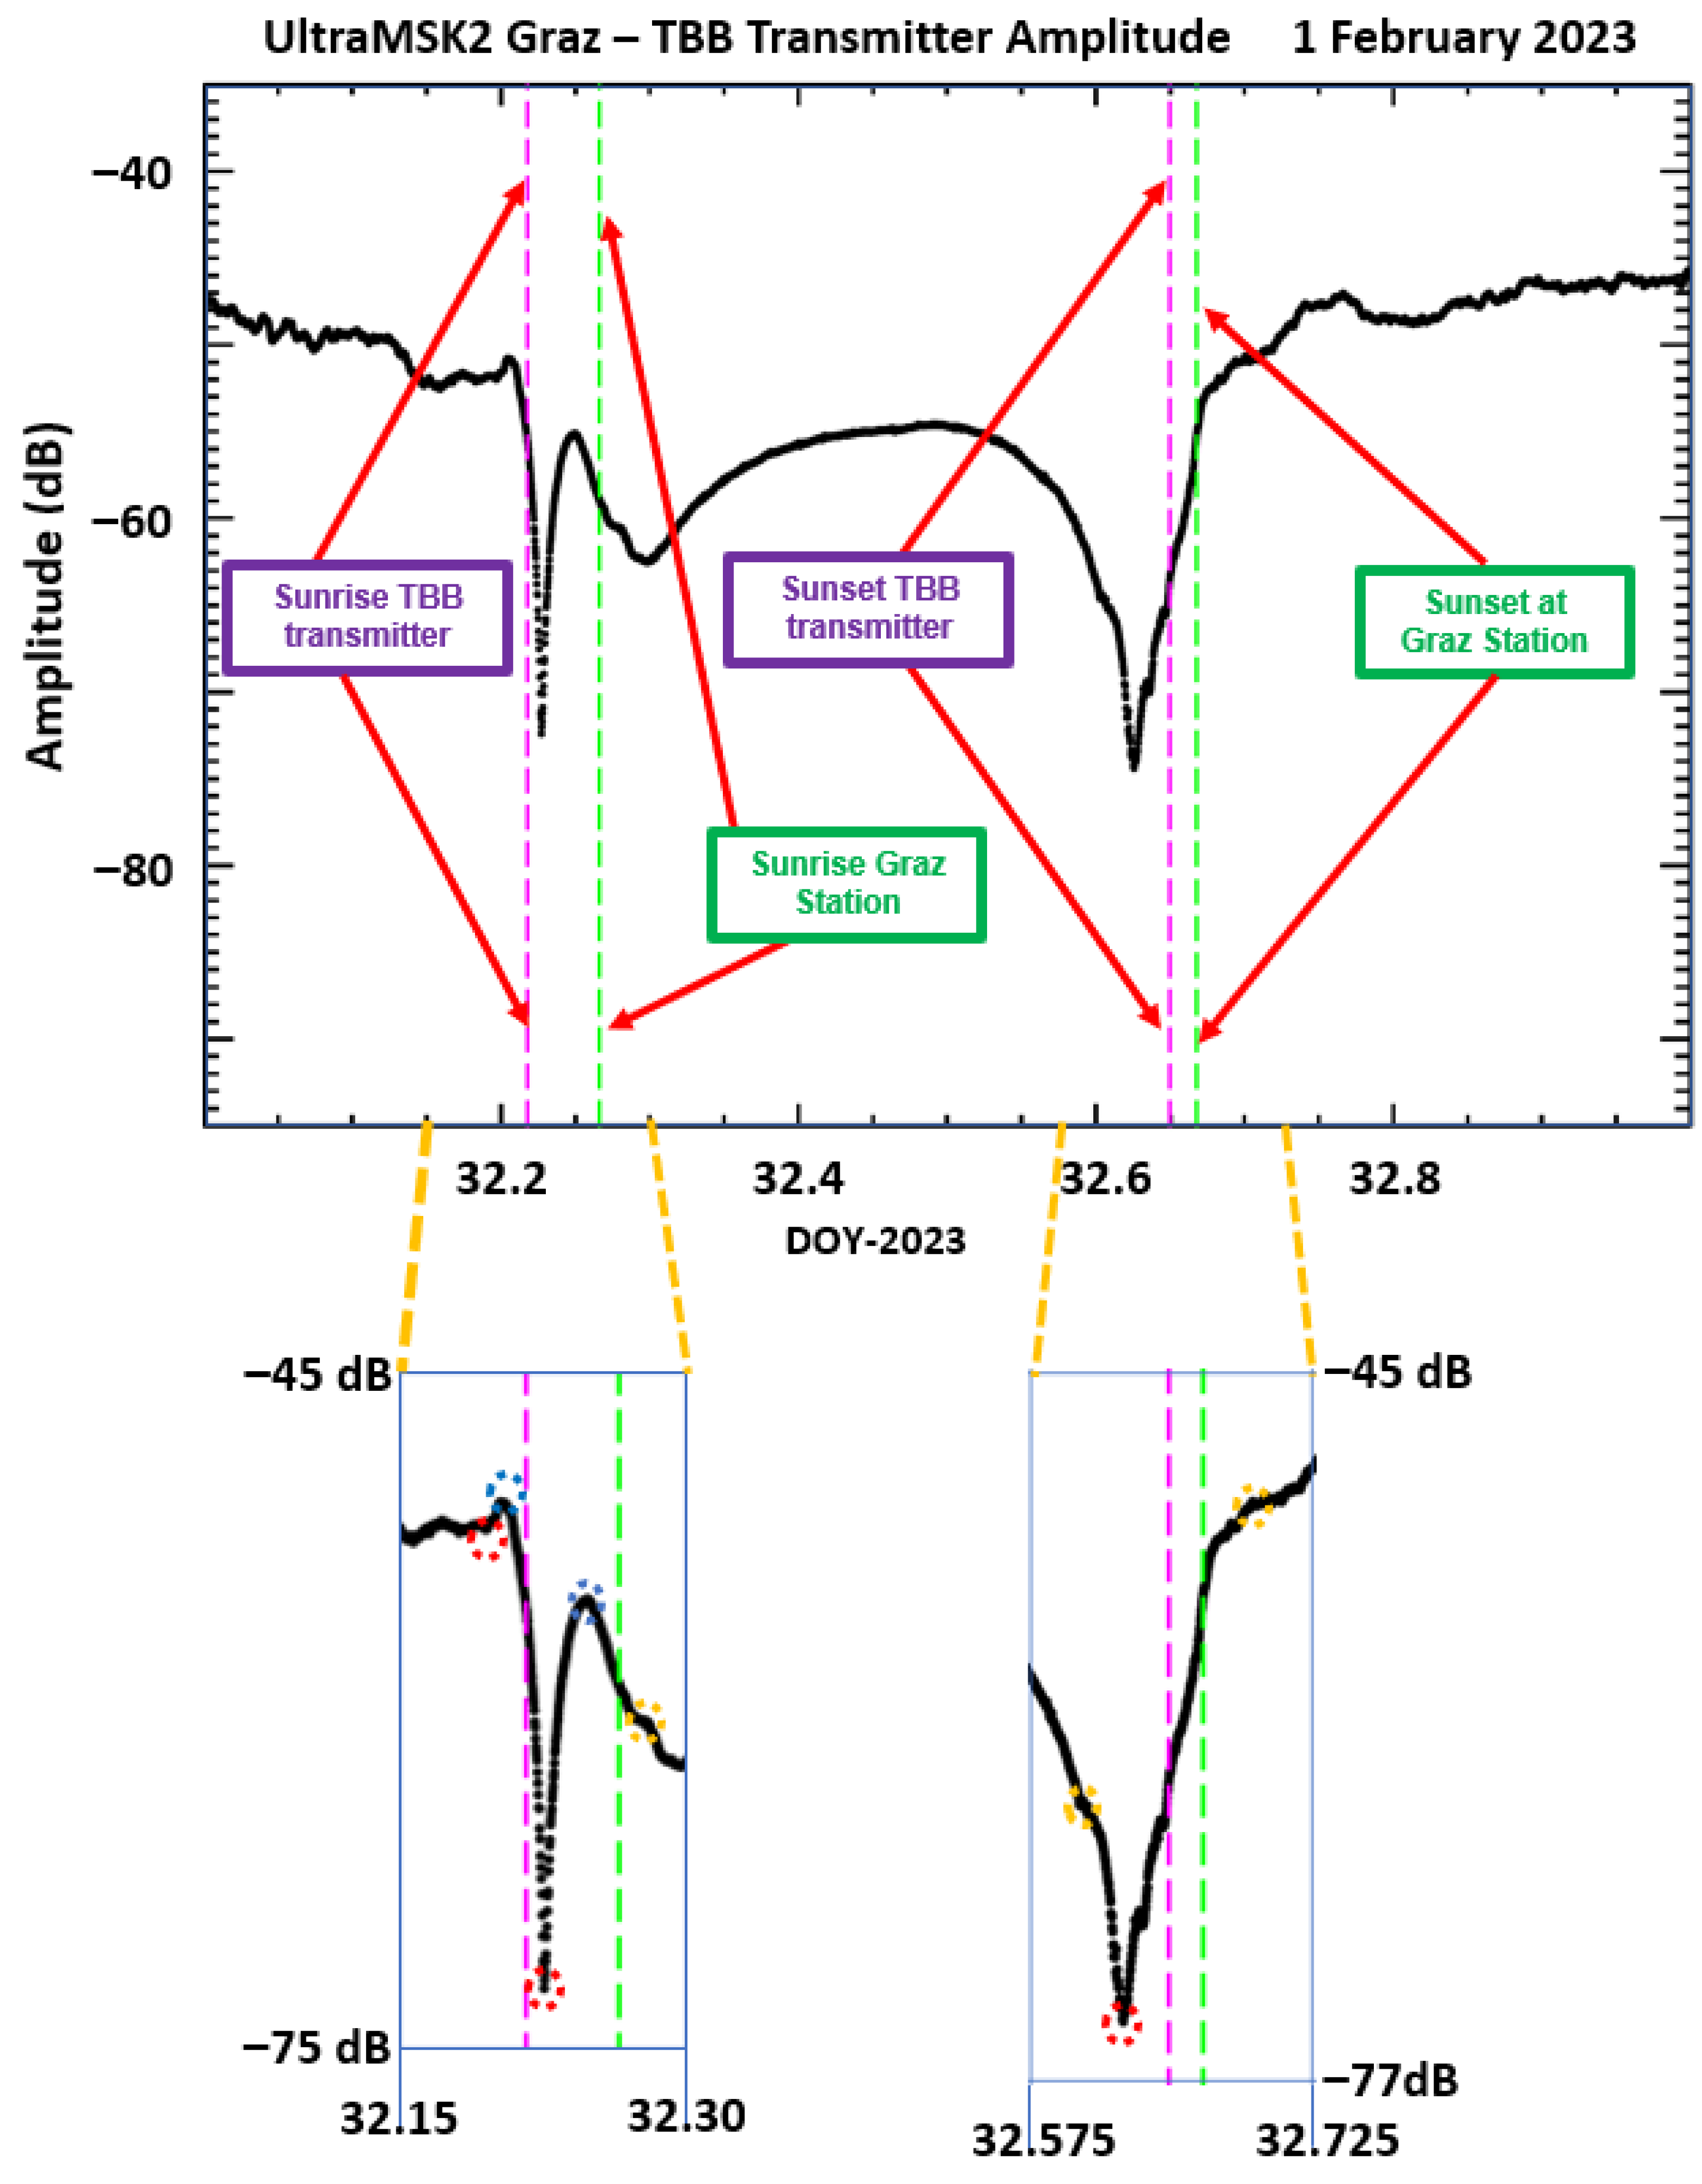
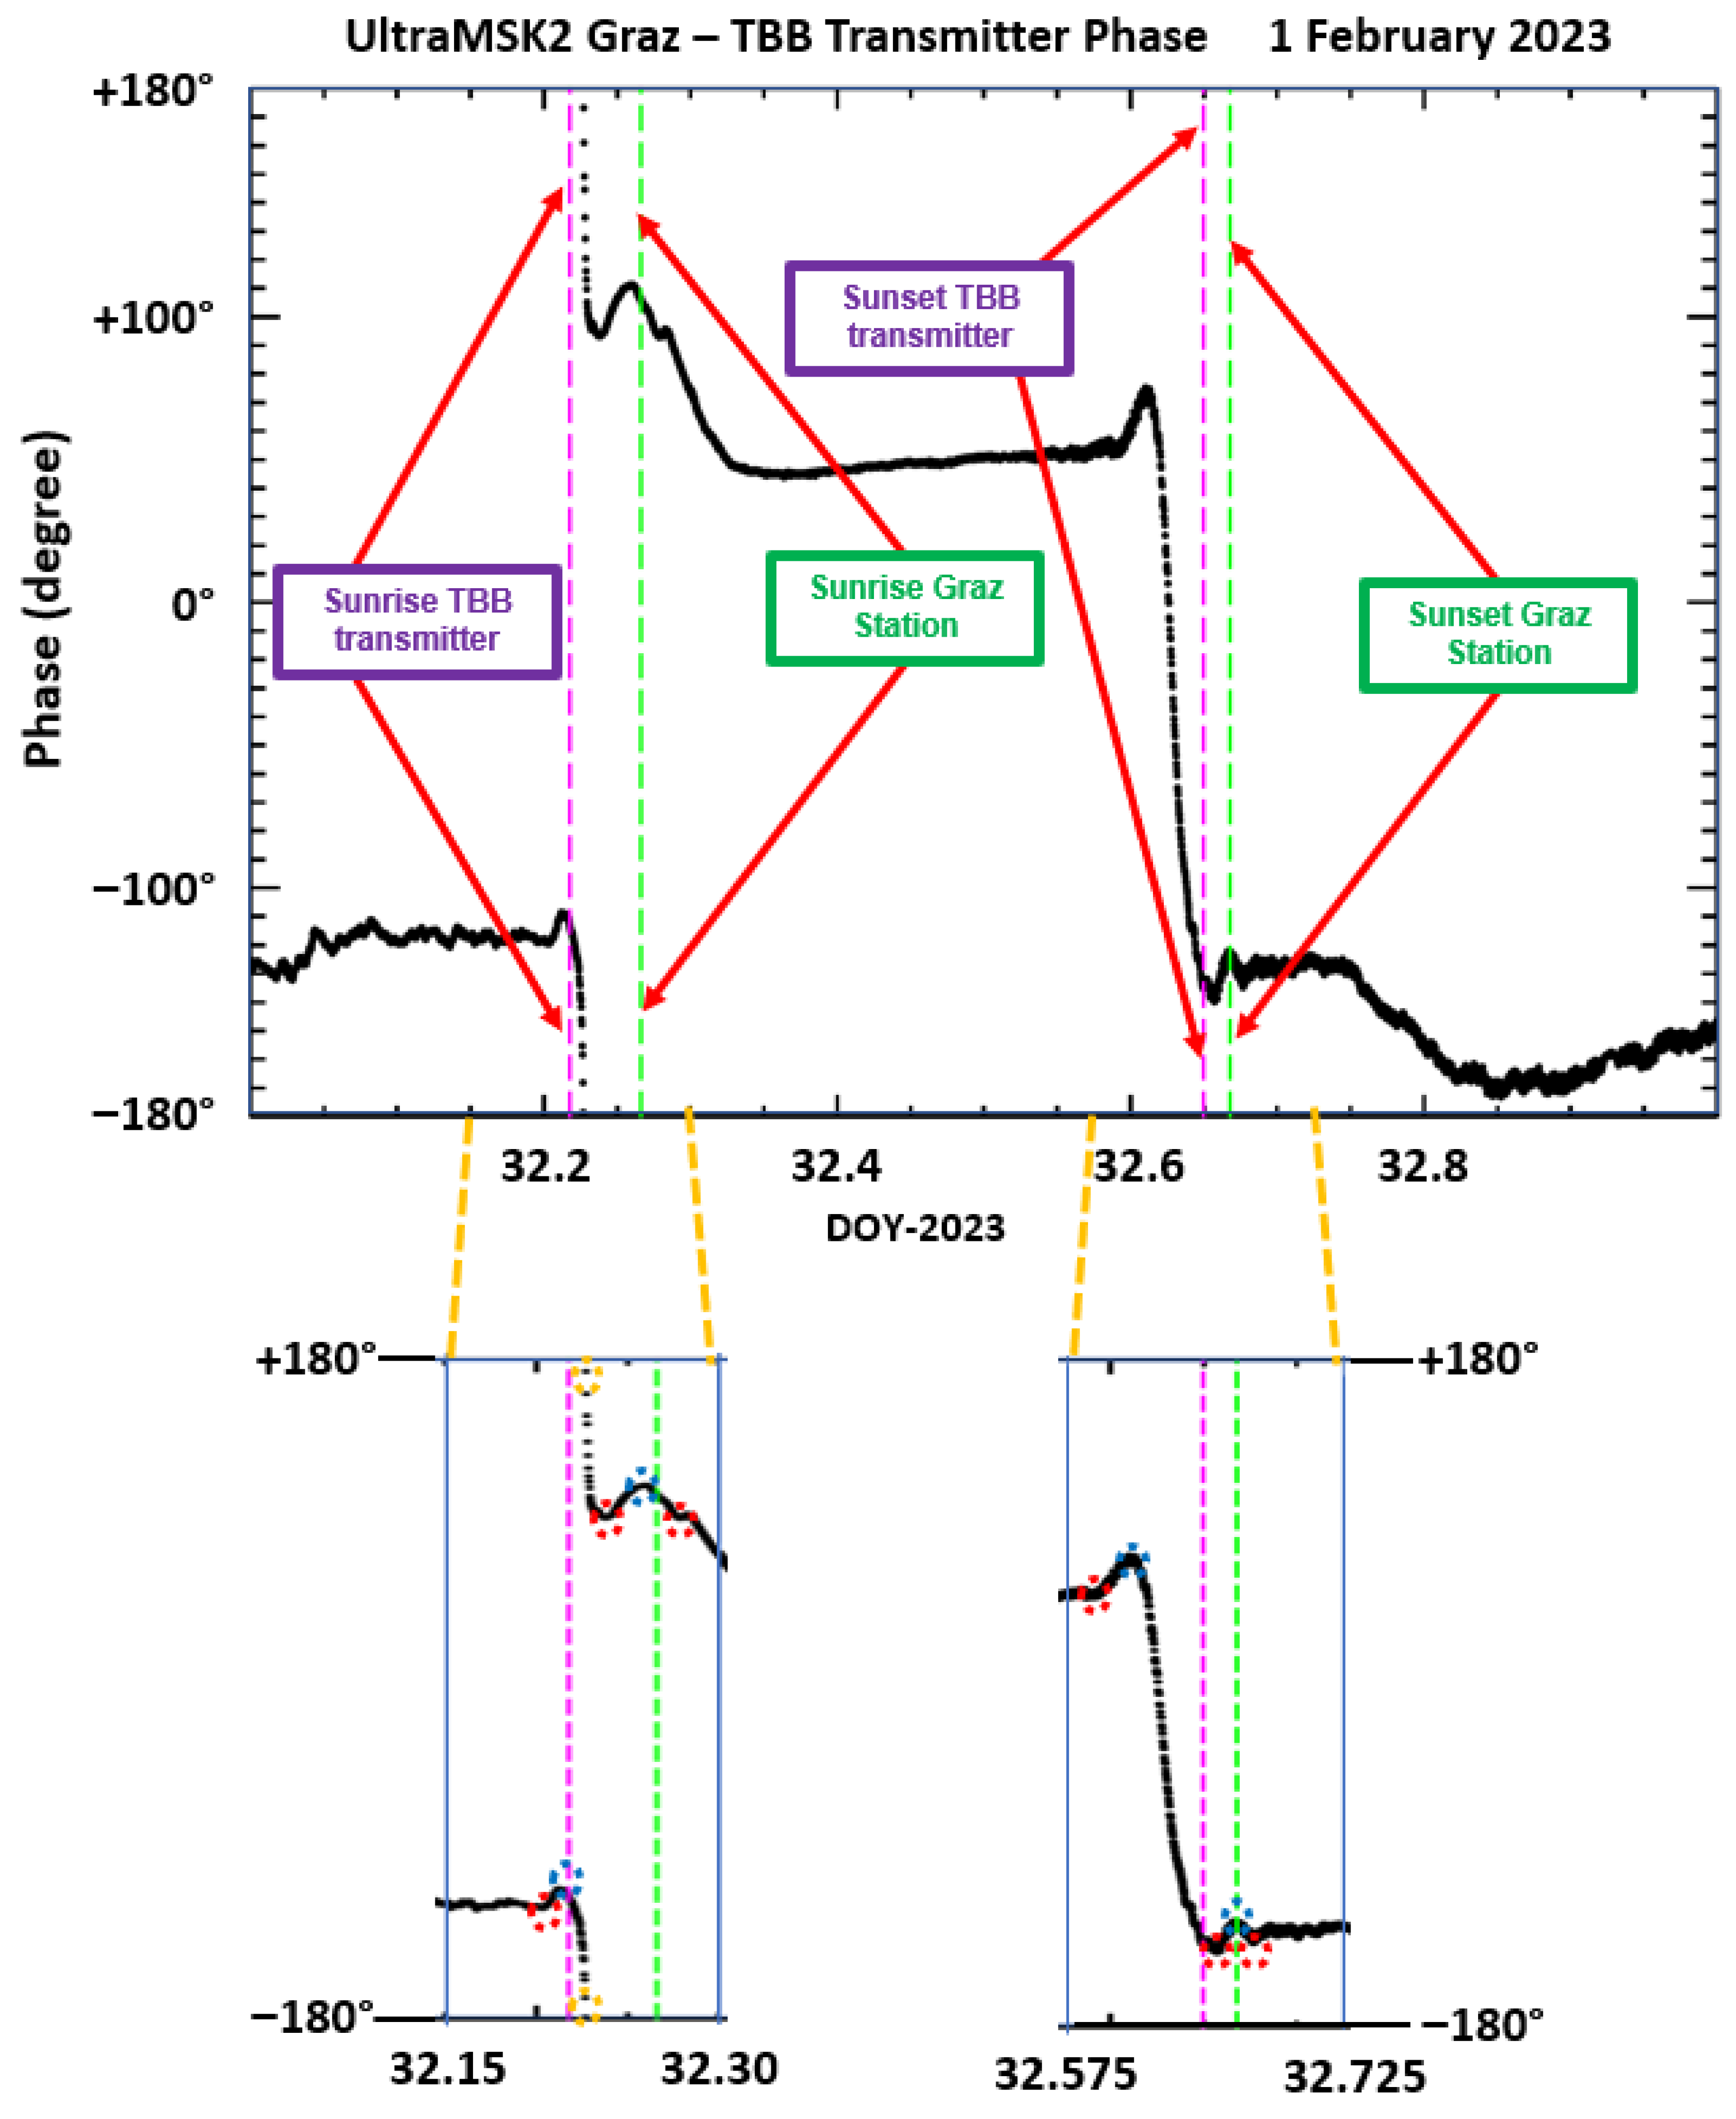
Figure 3. Hereafter, we show zooms of the anomalies recorded on 1 February 2023 around sunrise and sunset terminators to clarify how spectral features are derived from daily amplitude and phase variations. This leads us to introduce two new features, both observed around terminators: the first is of the jump spectral type, which occurs in the TBB phase signal where the phase springs from −180° to +180° in about one minute, and the second is the spectral inflexion, which occurs in the TBB amplitude signal, where one can note a brutal change, in a short time, of the amplitude slope signs, i.e., from positive to negative and vice versa.
Figure 4 and
Figure 5 display amplitude and phase variations, respectively, as recorded on 1 February 2023 (32 DOY). UltraMSK-2 reception leads to the recording of three measurements per minute, one each 20 s, for the amplitude and the phase transmitter signal. The observations in
Figure 4 and
Figure 5 are derived from the 8640 daily measurements. All spectral features occur around TBB and Graz sunrise and sunset terminators. Minima and maxima are indicated by red and blue colored circles and jumps and inflexions, both new anomalies, are designed by orange-colored circles. The jumps appear only in the TBB phase signal, as shown in the zoomed part of
Figure 5, and the inflexions can be seen in the zoomed part of
Figure 4.
Table 2 lists the inflexion spectral features, where the sunrise or sunset terminator (first column), the observation date (second column), the time in UT (third column), the amplitude in dB (fourth column), the phase in degree (fifth column), and finally the drift rate of the inflexion (sixth column) are given. For the investigated period from 23 January to 8 February 2023, the daily inflexion type has been observed 13 times at sunrise and 18 at sunset. Such spectral types are absent on two occasions, i.e., on 26 January and 28 January.
Table 3, similarly to
Table 2, indicates the jump spectral features, where we find that five jumps occur at sunset and twelve at sunrise. As in the case of inflexion type, jumps are missing on two days, 27 and 31 January 2023. It is important to note that the jump type shows mainly a positive slope, i.e., when the time increases, the phase springs from negative to positive values, as shown in the sixth column of
Table 3. Only at three occasions have the slopes been negative: (a) on 29 January at sunrise, with a decline phase from +179.54° to −179.37°; (b) on 31 January at sunset, with a decrease from +176.44° to −177.57°; and (c) one day before the EQ occurrence at sunrise, with a drop from +179.81° to –178.79°.
It is interesting to note that the reported inflexion slopes (see sixth column in
Table 2) exhibit positive and negative maxima at three occasions: (a) 28 January at sunset with a value of −0.510 dB/min; (b) 1 February at sunrise equal to −0.480 dB/min; and (c) 4 February at sunrise with a value of +0.630 dB/min. One day before (5 February) and after (7 February) the EQ, the slopes are equal to −1.86 dB/min and +2.46 dB/min, respectively. Similarly, the drift rates of the jumps (see sixth column in
Table 3) also displays positive and negative maxima: (a) 27 January at sunset with an amount of +1078.44 degree/min; (b) 30 January at sunrise with a value of +1071.75 degree/min’ and (c) 2 February at sunrise with a drift of about +1071.39 degree/min. As for the inflexion slopes, on 5 and 7 February, values equal to −1075.80 degree/min and +1073.04 degree/min were recorded.
3.5. Terminator Method (TM) Versus Multi-Terminator Method (MTM)
The fundamental paper of Hayakawa et al. [
10] provides the method to identify the presence of precursor anomalies in the sub-ionospheric transmitter signal. It is important to note that, for the TM method, the terminator time shifts only concern minima around the local reception station. This method has been improved and advanced by Boudjada et al. [
48] and Boudjada et al. [
49] by including other spectral anomalies at the local reception facility, at the emitter transmitter, and close to the EQ epicenter.
The difference between both methods can be clearly established by considering the spectral anomalies in
Figure 4 and
Figure 5 for the TBB signal observed on 1 February 2023. In
Figure 4, we find that two minima occurred at sunrise and one minimum at sunset, a total of three minima, when applying the TM method and, from
Figure 5, a total of six minima (i.e., three at sunrise and three at sunset). With the MTM method, one needs to add to the number of minima the spectral anomalies, two maxima and three inflections (see lower panels of
Figure 4) and four maxima and two jumps (see lower panels of
Figure 5). Therefore, 9 minima spectral anomalies are derived from the TM method, and 19 anomalies (i.e., 9 minima, 6 maxima, 2 inflections and 2 jumps) from the MTM method.
In this study, we have analyzed 138,240 spectral observations from 23 January to 8 February 2023, where only 349 anomalies have been found, representing 0.25% of the total measurements. The percentage of spectral anomalies are 43% minima, 38.4% maxima, 9.7% jumps, and 8.9% inflections when considering the 349 anomalies.
3.6. Occurrence Probability of Spectral Features Observed at Sunrise and Sunset Terminators
In this sub-section, we intend to compute the anomaly time occurrence times by separating the sunrise and sunset spectral anomalies. A specific time interval, called hereafter bin size, is used to find the anomaly occurrence probability every 12 min in the interval 04.40–07.60 UT for sunrise, and 13.20–16.80 UT for sunset. The bin size of 12 min allows study of the anomaly occurrence 5 times per hour (5 × 12 min = 60 min) corresponding to a ‘longitude bin size’ of about 3° (i.e., for 15°/5). For this, we use the following histogram function
Hv to compute the occurrence probability
P [
52]:
where
Fi is the value of the element of
i index with 0 ≤
i <
n. The number of occurrences is given by
v, as indicated in Equation (1), which depends on the maximum (
Max), the minimum (
Min) and the histogram bin size (
Binsize). The occurrence probability
P is given by the following:
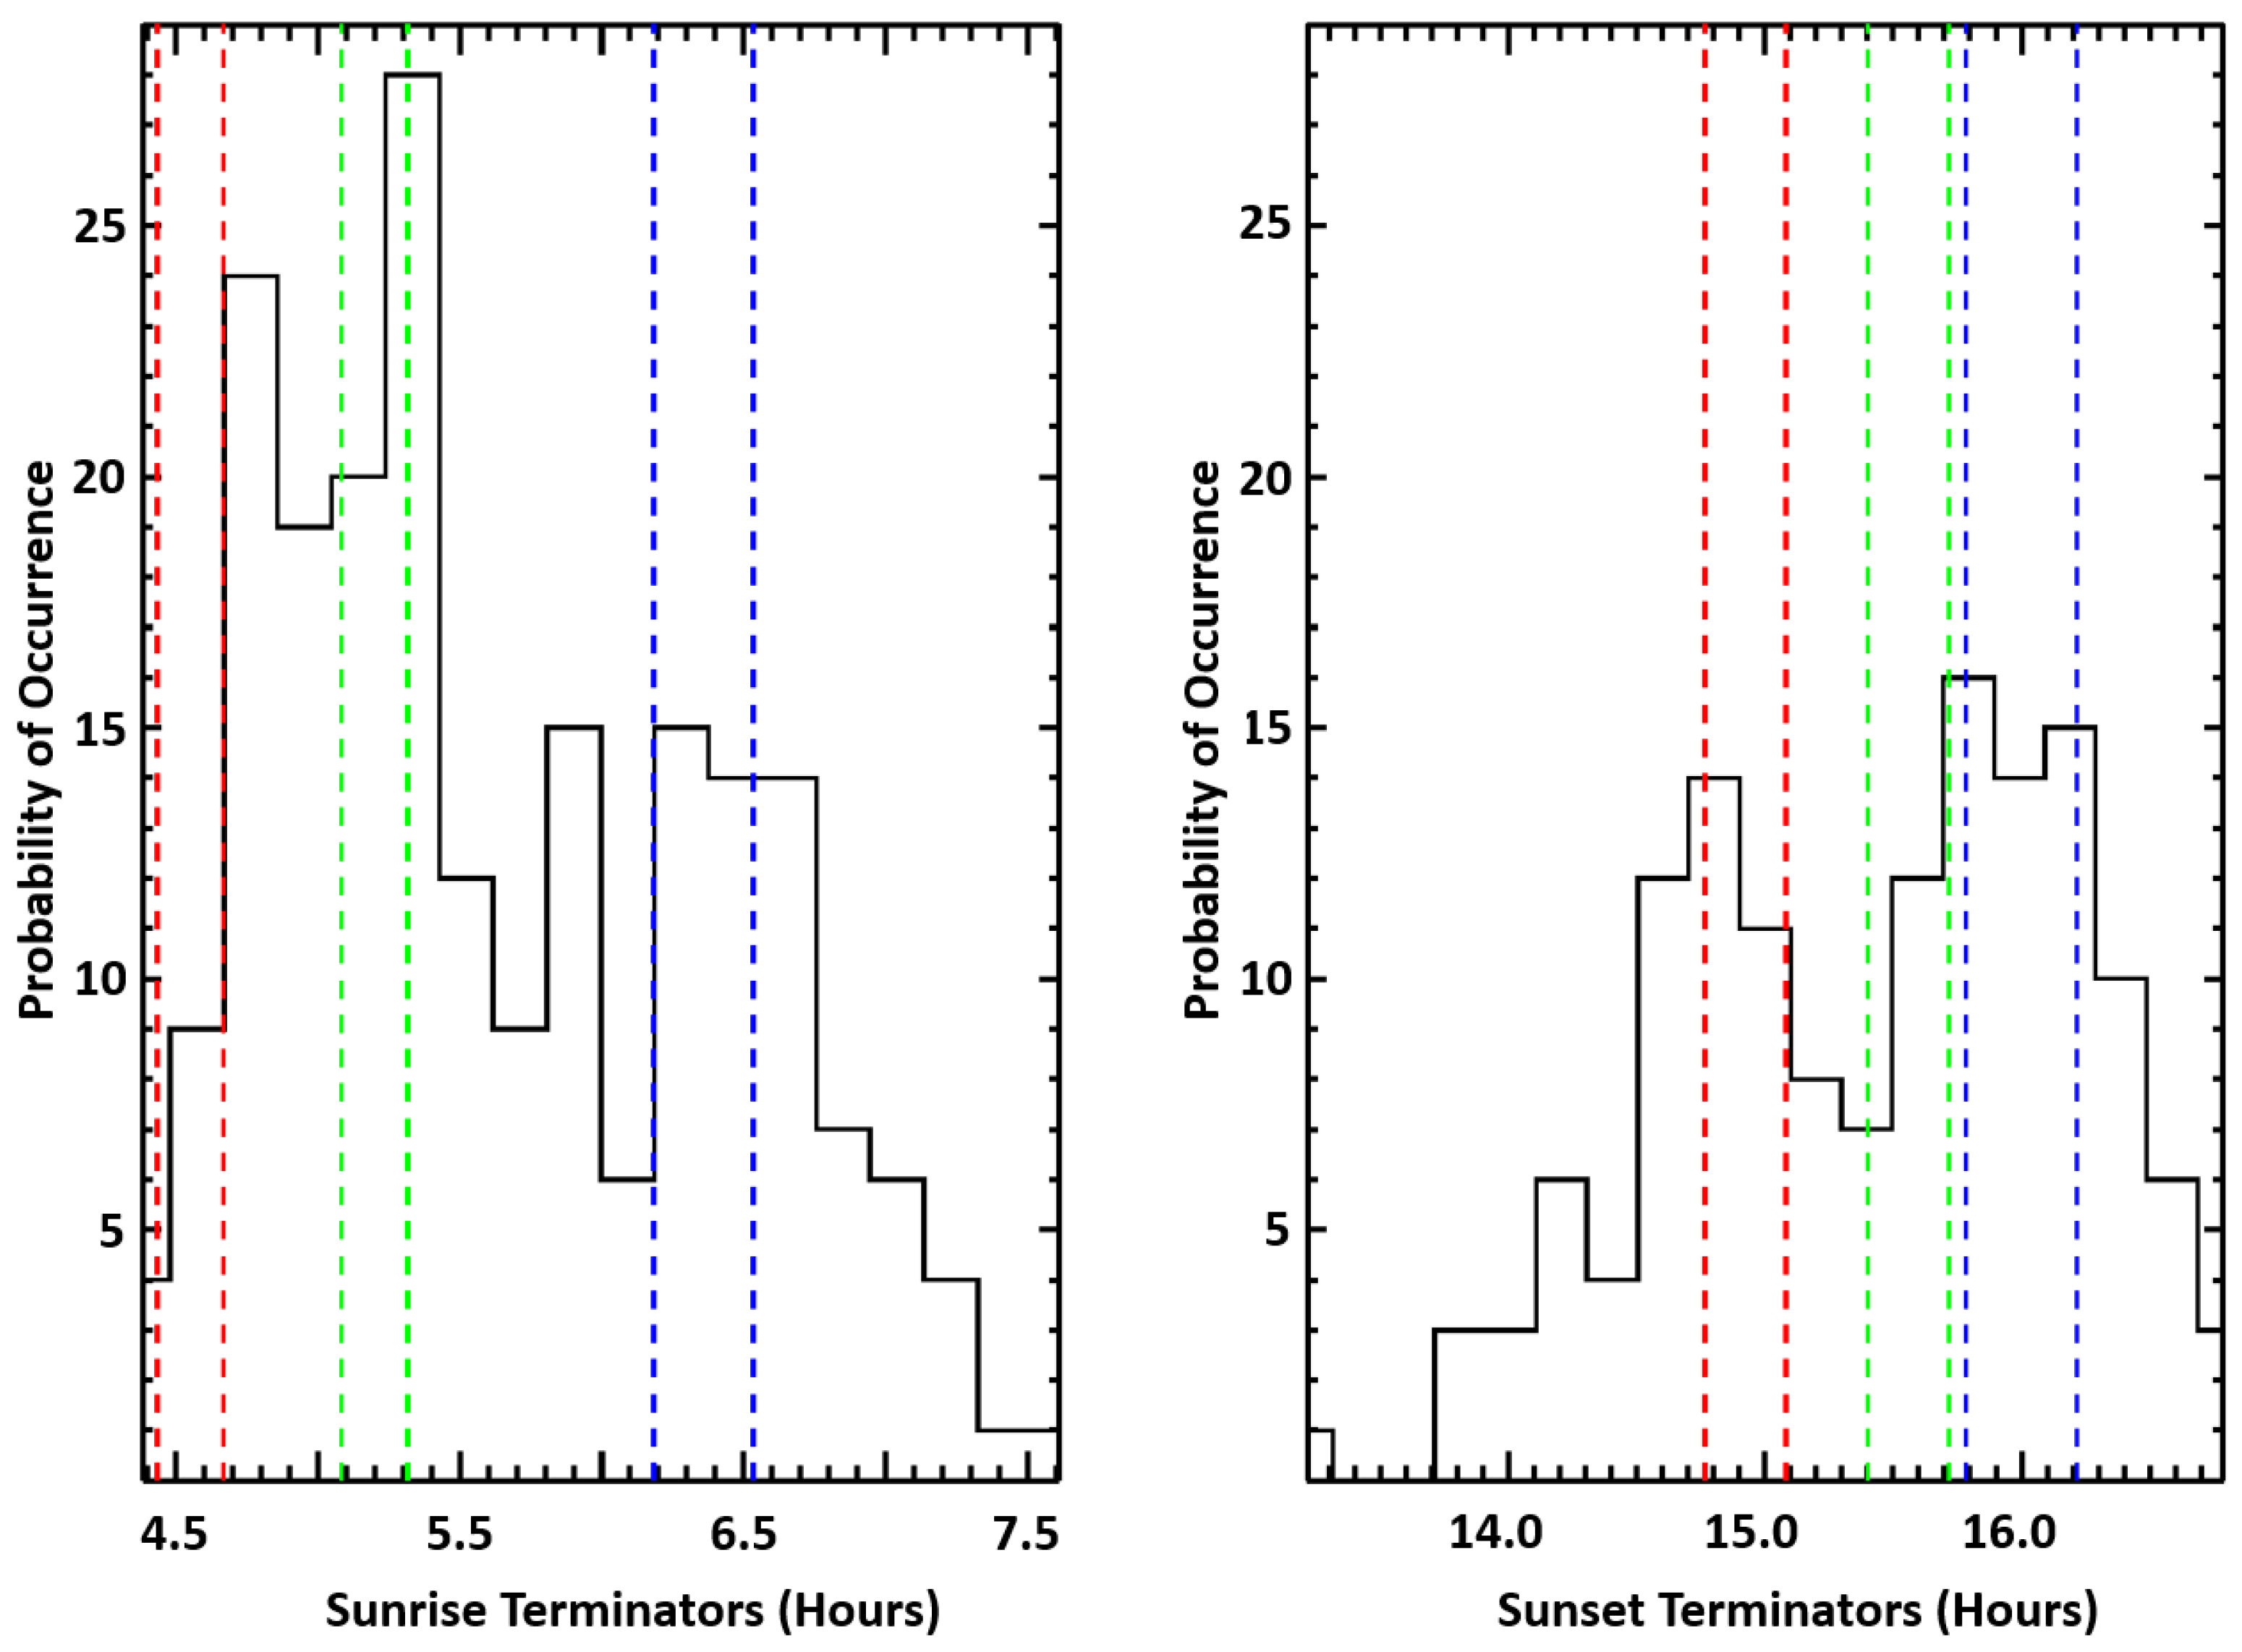
Figure 6 displays the probability of anomaly occurrences derived for the spectral features observed at sunrise and sunset terminators. A total of 349 anomalies have been examined corresponding to 150 minima, 134 maxima, 31 inflexions and 34 jumps. The
Max–
Min interval (expressed in UT hours) is, for the sunrise terminators, [4.38–7.80], corresponding to [04:23–07:48] (left panel in
Figure 6), and, for the sunset terminators [13.21–16.98], corresponding to [13:12–16:59] (right panel in
Figure 6). The bin size has been fixed to 12 min (0.20 in hours) for both histograms.
The three colored rectangles shown in
Figure 6 correspond to the beginning and the end of the terminators at the Graz VLF facility (blue dashed rectangle), TBB transmitter station (green dashed rectangle) and EQ epicenter (red dashed rectangle). For the investigated period from 23 January to 8 February 2023, the terminator time intervals are found as follows:
Graz at sunrise [06.53–06.18] or [06:32–06:11] UT, and at sunset [15.78–16.21] or [15:47–16:13] UT,
TBB transmitter station at sunrise [05.31–05.08] or [05:19–05:05] UT, and at sunset [15.40–15.71] or [15:24–15:43] UT,
EQ epicenter at sunrise [04.66–04.43] or [04:40–04:26] UT, and at sunset [14.76–15.08] or [14:46–15:05] UT.
The probability exhibits three occurrence maxima for the sunrise terminators (left panel in
Figure 6), the first close to the EQ epicenter terminator between [04:45 and 04:57] UT with a value of 24, the second closer to the TBB transmitter terminator [05:20 and 05:31] UT with a value of 28, and the third overlapping the Graz facility terminator [06:17 and 06:28] UT with a value of 15. The second or the third occurrence peak can be assumed to be linked, respectively, to the transmitter station and the Graz facility terminators. However, the first peak with a value of 24 appears earlier when compared to the TBB terminators (green rectangle in the left panel of
Figure 6) and seems to be generated in the preparation EQ zone in the eastern part of the area covered by the transmitter station.
The occurrence in the case of the sunset terminators (right panel of
Figure 6) displays peaks, but with maximum values less than 17. Similarly, to sunrise occurrence, sunset also has three occurrence maxima: (a) between [14:12 and 14:24] UT with a value of 6; (b) half-overlapping the EQ epicenter terminators [14:48–15:00] UT with a value of 14; and (c) partially covering the TBB transmitter and Graz terminators [15:47–15:59] UT with a value of 16. It is interesting to note that the first peak, with a value of 14, is totally related to the EQ preparation zone which seems to be located in the eastern part of the EQ epicenter. Despite the small value of the first peak (i.e., equal to 5), the corresponding terminators are situated in the eastern part of the EQ epicenter. This gives a first idea about the size of this preparation zone, found in the eastern part of the area covered by the TBB station, and which extended from 14:12 UT to 15:15 UT, i.e., to about one hour, corresponding to 16° in geographical longitude.
The occurrence of the spectral feature anomalies, as shown in
Figure 6, leads us to confirm the presence of peaks which can be assumed as precursors, since they arrive approximately at the EQ epicenter terminators. The sunset spectral features show evident precursors, one minor at round 14:18 and another major at around 14:54. For the sunrise occurrence, it is not simple to recognize and distinguish the precursors, since the peak, around 04:51, is found between the TBB station and EQ epicenter sunrise terminators.
3.7. Estimation of Spectral Anomaly Time Shifts
It is clear from
Figure 6 that spectral anomalies derived from the multi-terminators method lead us to reveal time intervals linked to the EQ preparation zone. This can be considered as a first stage towards a better knowledge of the efficiency of this method. A second stage is proposed in this sub-section and which consists in estimating the spectral anomaly time shifts, defined as the time difference (shown hereafter as
Δ) between the Graz sunrise/sunset terminators and the occurrence time of the spectral anomalies. This introduced quantity leads to daily quantification of when the spectral anomalies appear when compared to the daily Graz terminator. Hence, if
Δ time difference is positive or negative, then the spectral features are, respectively, localized in the eastern or western part of the Graz facility. This quantity
Δ is calculated for seven intervals, defined as follows:
Group 1 are anomalies which occur after 06:32 UT at sunrise and after 16:13 at sunset.
Group 2 are close to the Graz terminators, i.e., [06:11–06:32] UT at sunrise and [15:47–16:13] UT at sunset.
Group 3 are between Graz and TBB terminators, i.e., [05:19–06:11] UT at sunrise and [15:43–15:47] UT at sunset.
Group 4 are nearby TBB terminators, i.e., [05:05–05:19] UT at sunrise and [15:24–15:43] UT at sunset.
Group 5 are between TBB and EQ terminators, i.e., [04:40–05:05] UT at sunrise and [15:05–15:24] UT at sunset.
Group 6 are close to EQ epicenter terminators, i.e., [04:26–04:40] UT at sunrise and [14:46–15:05] UT at sunset.
Group 7 are before 04:26 UT at sunrise and before 14:46 UT at sunset.
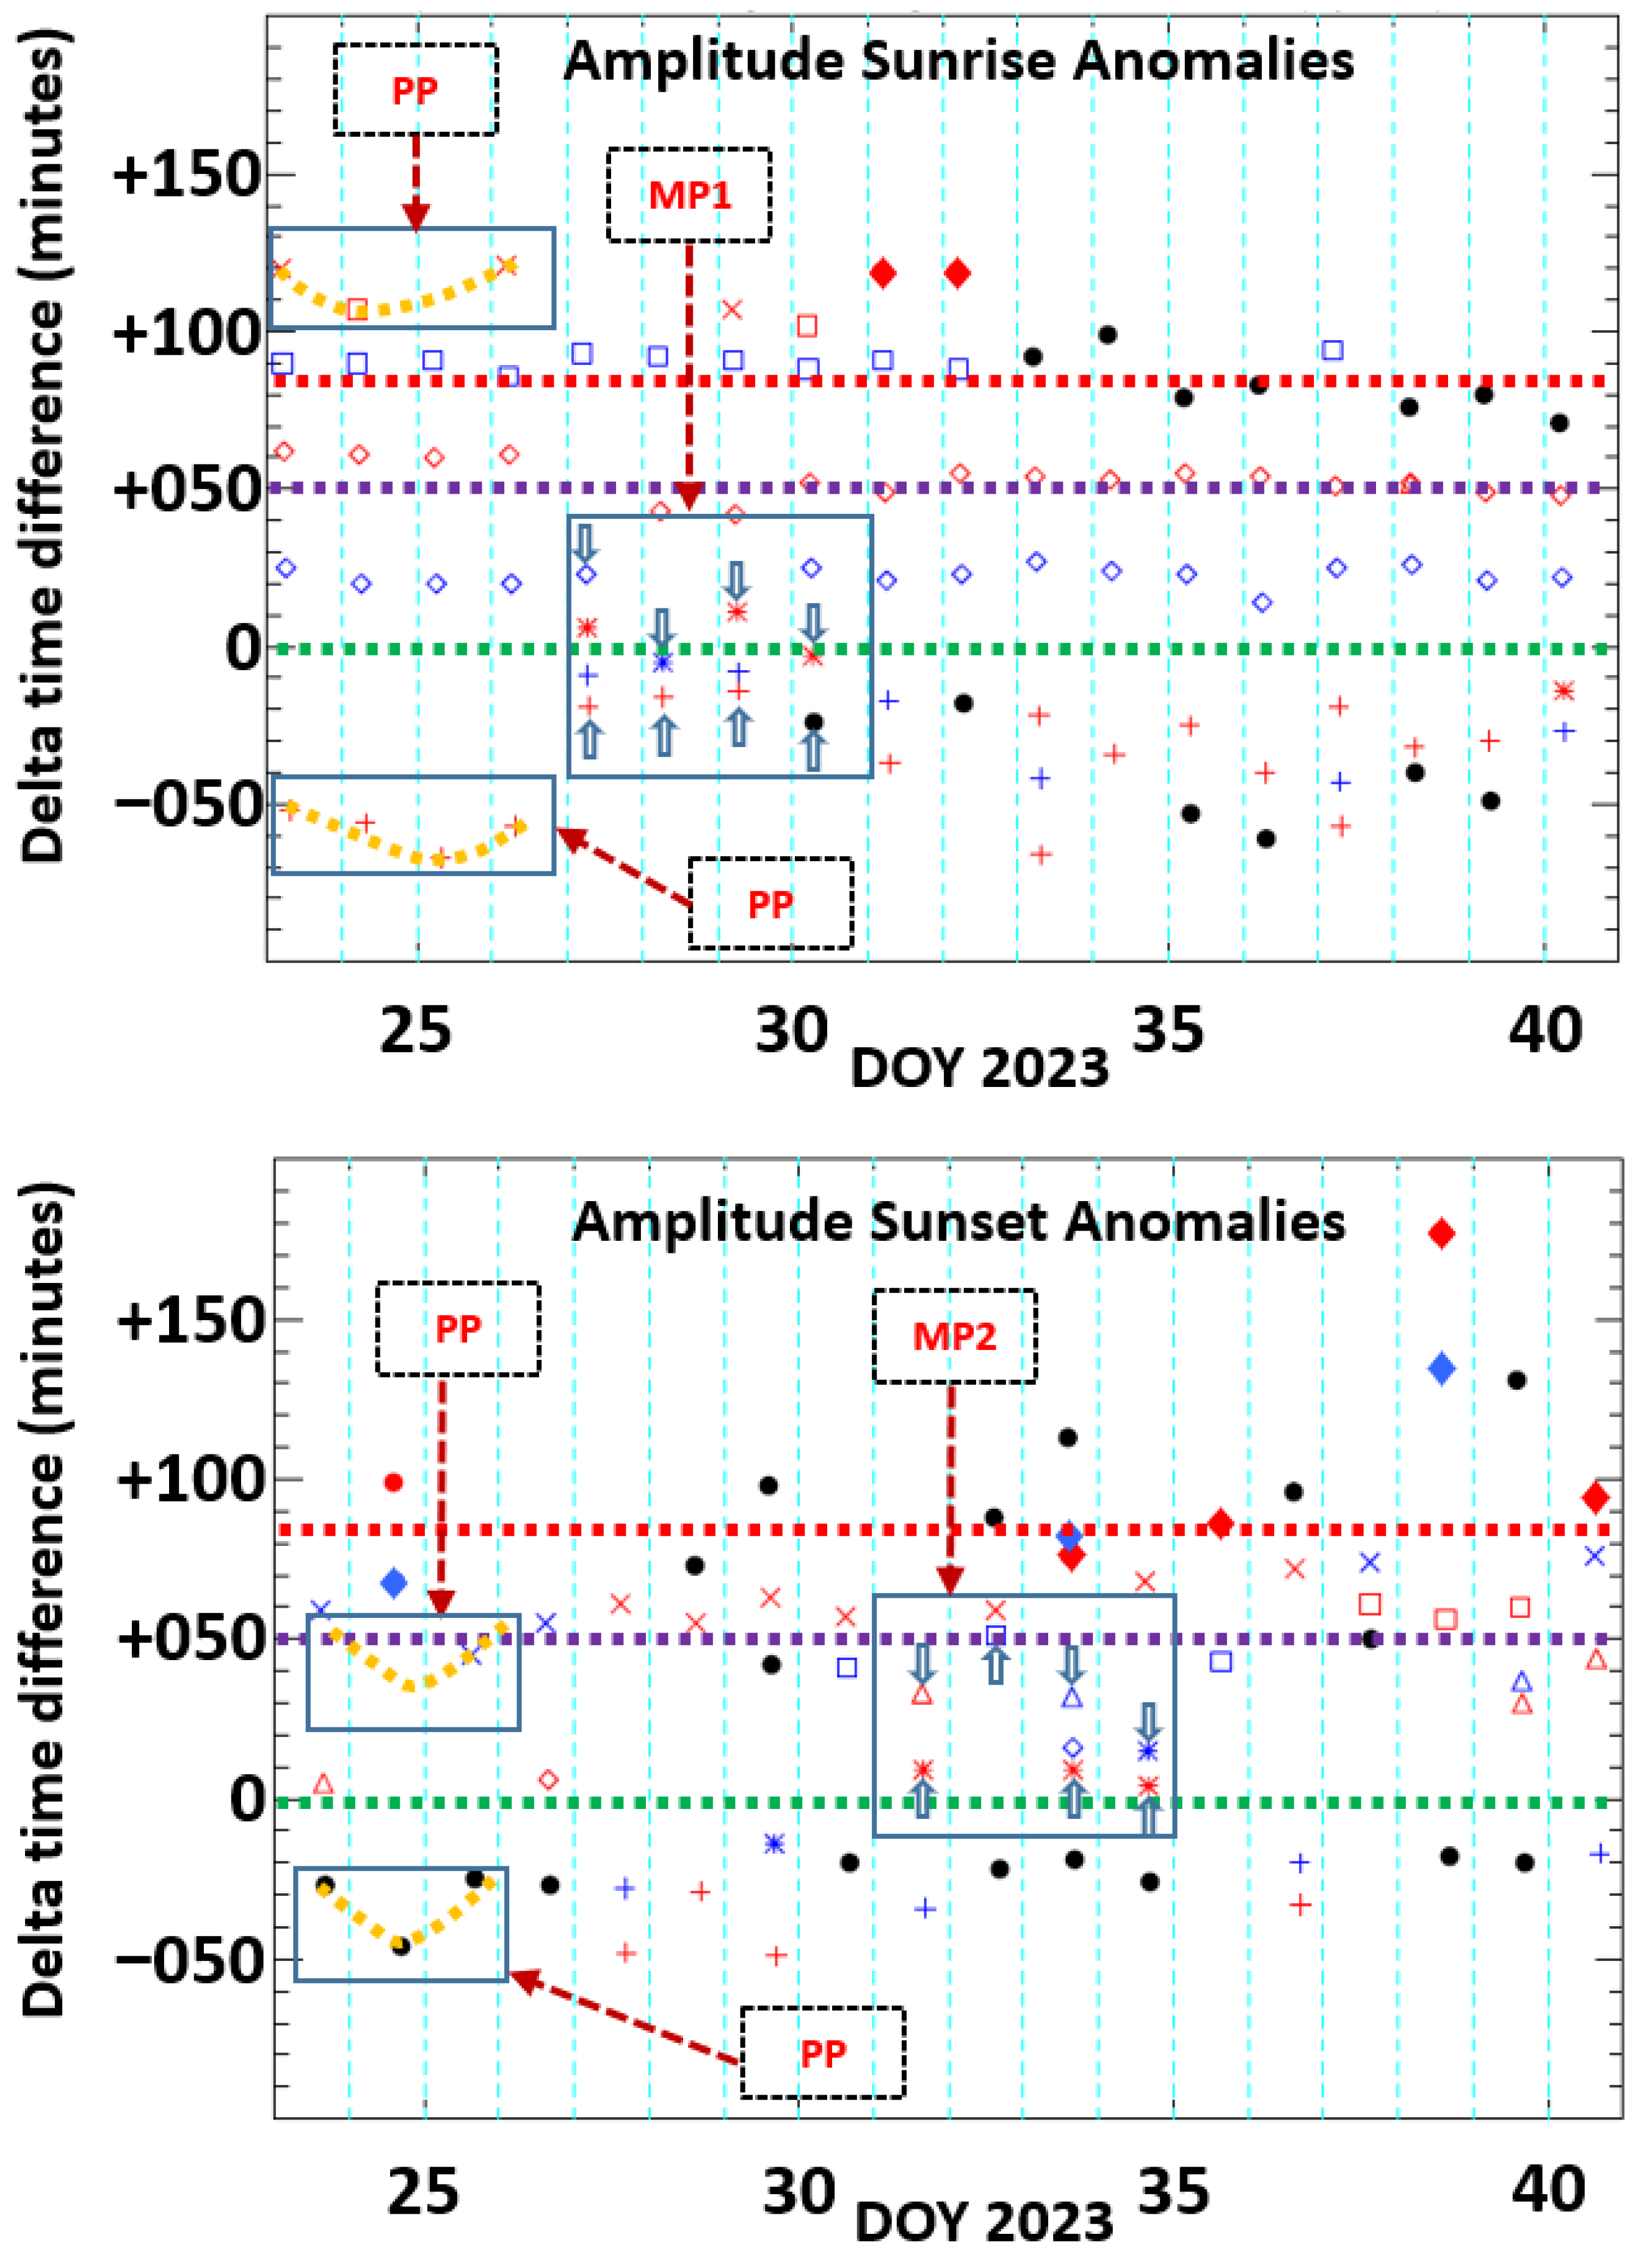
Figure 7 and
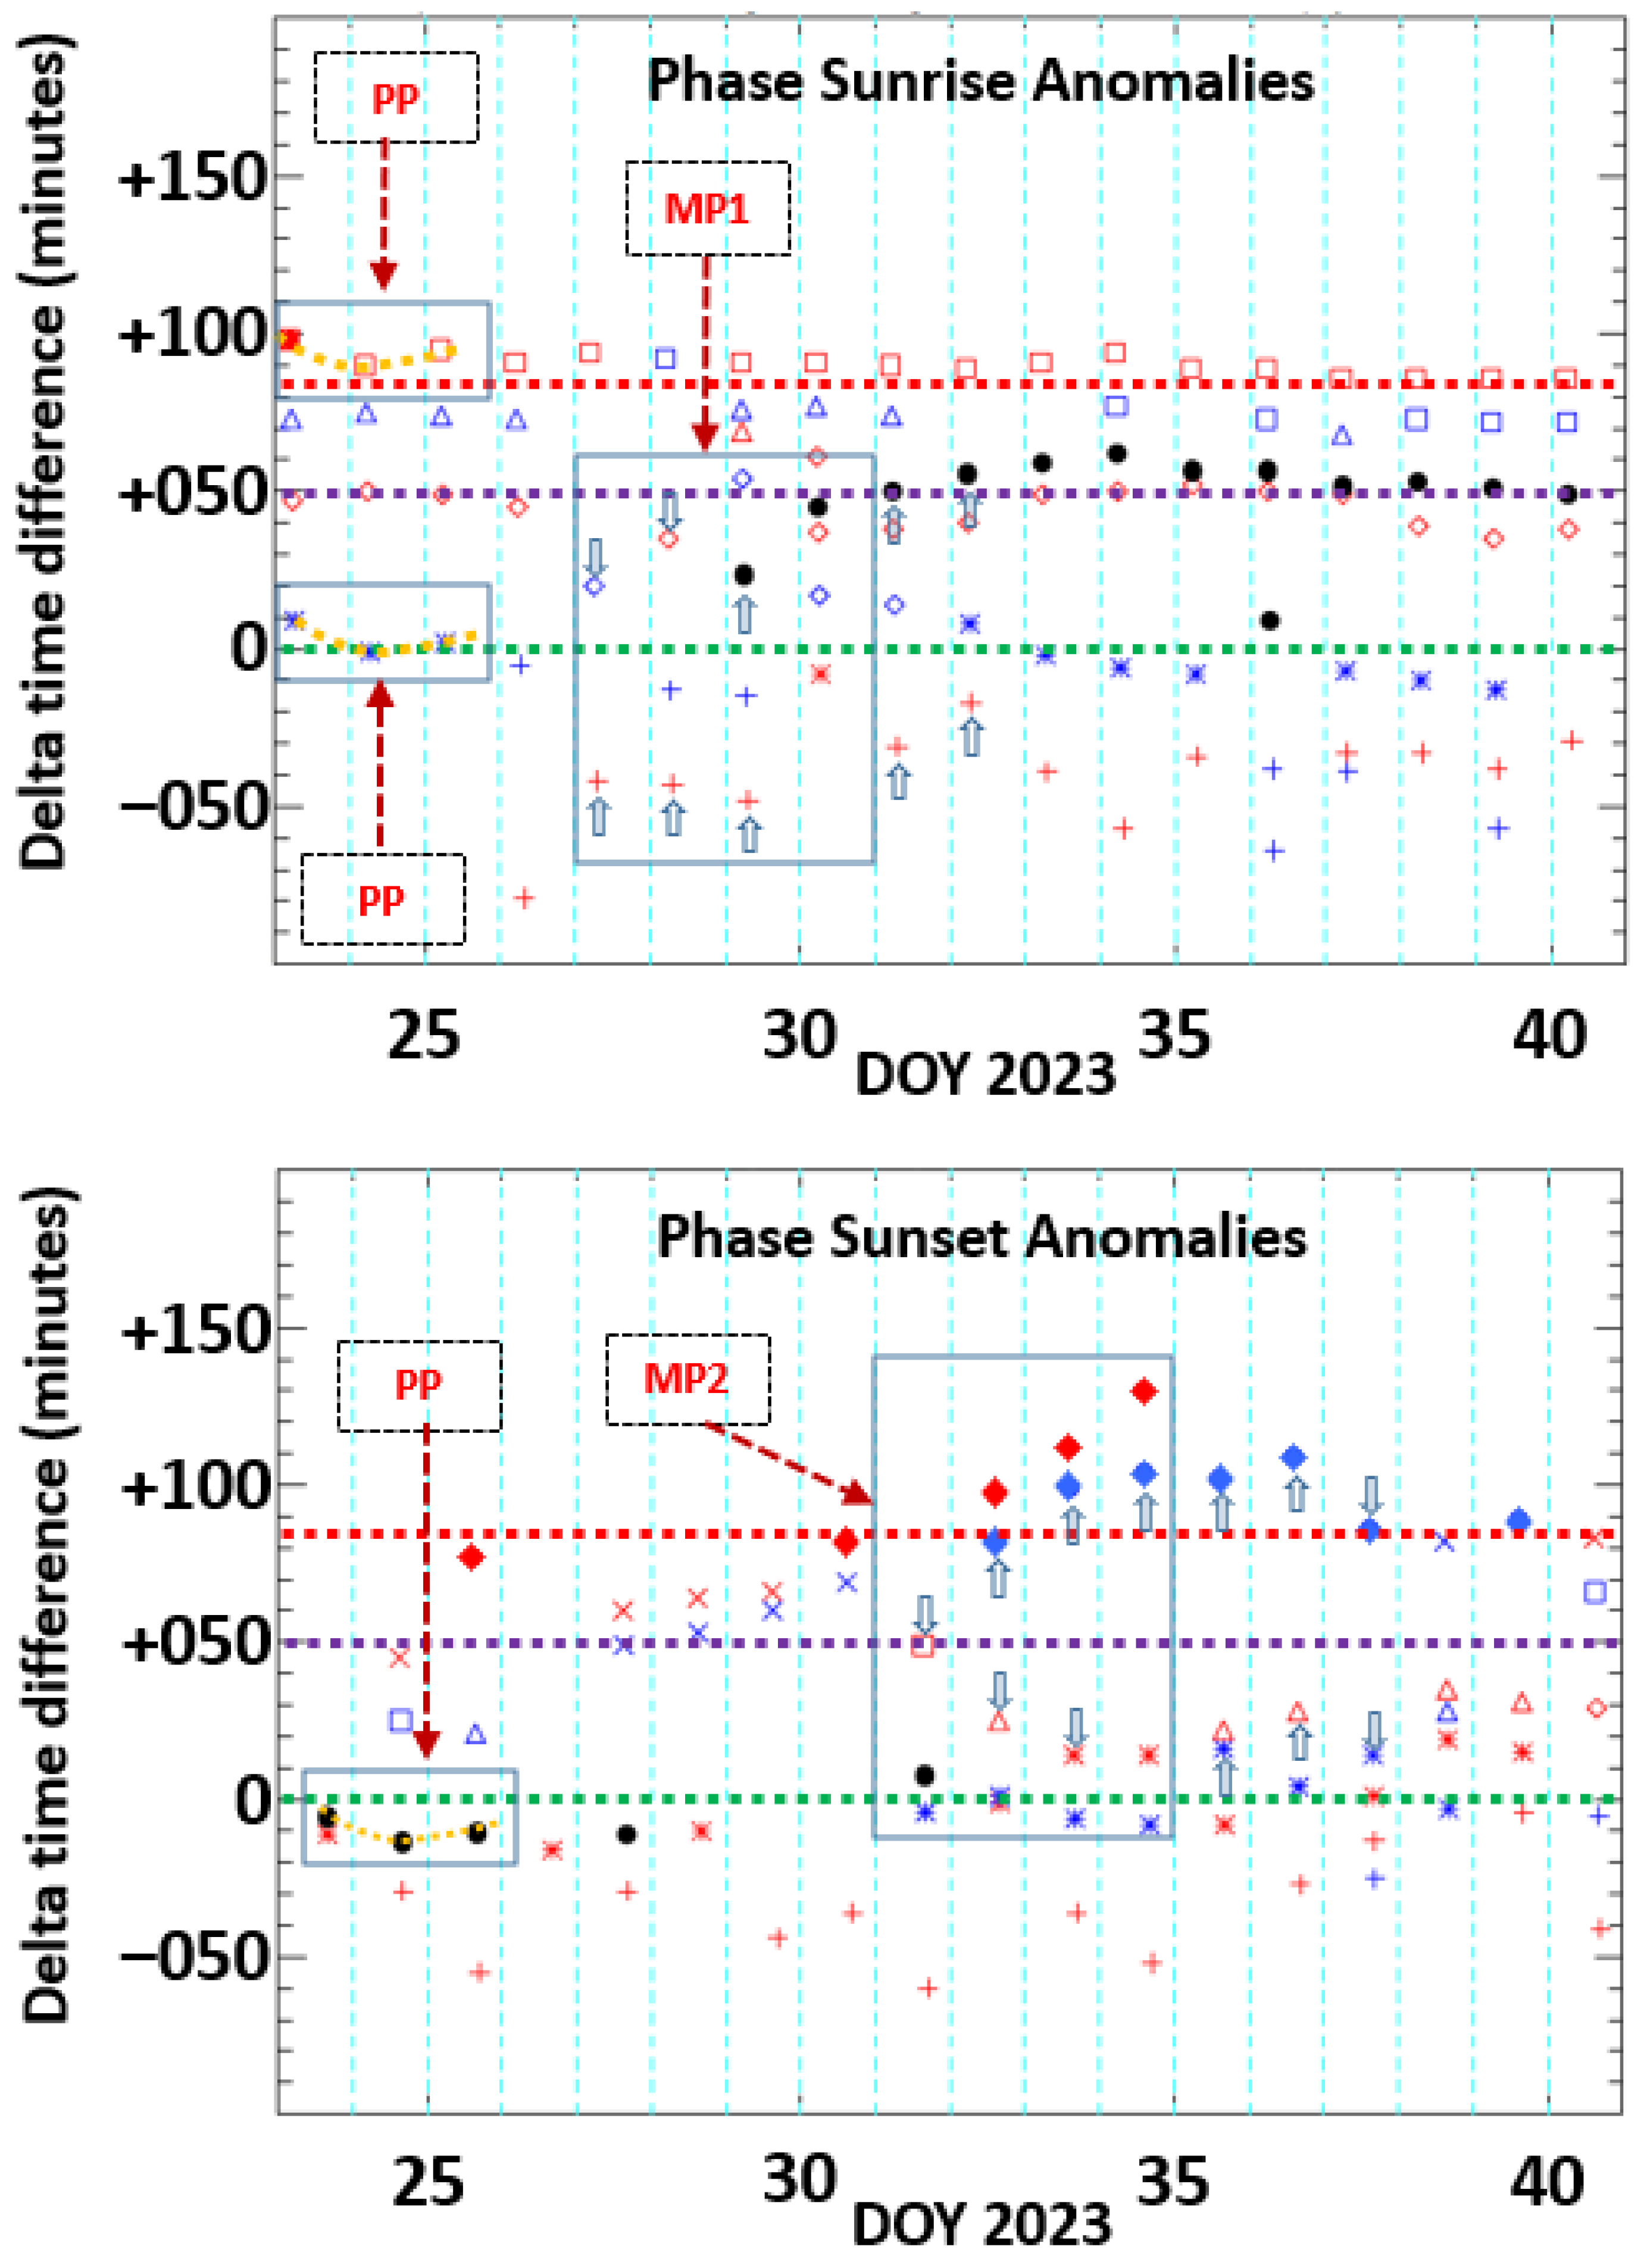
Figure 8 display
Δ time difference (expressed in minutes) versus the day of the year (DOY) from 23 January to 8 February 2023. The amplitude spectral anomalies for sunrise and sunset are shown, respectively, in the upper and lower panels of
Figure 7. Similarly, the sunrise and sunset phase spectral anomalies are illustrated in the upper and lower panels of
Figure 8.
The red and blue colored symbols indicate in both figures the minima and maxima spectral anomalies, respectively. The black colored symbols design the inflexions and jumps spectral anomalies, respectively, in
Figure 7 and
Figure 8. It can be seen that
Δ time difference for the Graz facility is equal to zero (shown by green horizontal dashed line), for the TBB transmitter station
Δ is close to +50 min (designed by magenta horizontal dashed line), and for the EQ epicenter
Δ is about +85 min (indicated by a red horizontal dashed line).
3.7.1. Amplitude Sunrise and Sunset Spectral Anomaly Time Shifts
In the upper panel of
Figure 7, one can see minima anomalies (i.e., red colored symbols) around −50 min, followed by maxima (i.e., blue colored symbols) at about +25 min, and again minima around +50 min, maxima about +70 min, followed by minima around +90 min. These minima and maxima are directly linked to the TBB signal propagation in the waveguide due to the combined effect of the sky and ground waves.
The quasi-parallel lines exhibit significant irregularities, between −50 min and −20 min, starting from 27 January to 31. This is a clear precursor signature which affects sunrise terminators at Graz facility. In the upper panel of
Figure 7 is indicated, in a blue rectangle, the first main precursor MP1. Simultaneously, there is a discontinuity in the maxima line on 27 January (i.e., absence of one maximum) at about
Δ~+50 min close to the TBB transmitter station, and also in the minima line on 28 and 29 January when
Δ is about +25 min. However, maximum anomalies display a regular variation at the EQ epicenter terminators at around +90 min. Lower than
Δ~+10 min, one finds that three groups, i.e., group 1 (‘+’ symbol), group 2 (‘*’ symbol), and inflexion anomalies (‘•’ symbol), have similar fluctuations, with a minimum on 25 January, followed by a maximum on 29 January, and again a minimum on 2 February 2023. In the
Δ interval between [+10 min, +60 min], group 4 (‘◊’ symbol) exhibits nearly a constant variation. Higher than
Δ~+70 min, similar fluctuations concern three groups, i.e., group 5 (‘☐’ symbol), group 6 (‘x’ symbol), and group 7 (‘♦’ symbol). A prior precursor (PP) takes place between 23 January and 26 January, where similar variations are observed at
Δ~−60 min and
Δ~+120 min. This is designated by blue rectangles in the upper panel of
Figure 7.
In the lower panel of
Figure 7, the situation of the amplitude sunset anomalies is different from the previous example because the quasi-parallel lines are found to be a combination of all spectral features (i.e., minima, maxima and inflexions). However, two lines appear around −25 min and +50 min, which merge and combine from 31 January to 3 February. The blue rectangle in the lower panel of
Figure 7 marks the beginning and the end of the second main precursor MP2. This sunset precursor signature is not evident when compared to the previous one, i.e., the sunrise precursor. One notes that, for both cases, sunrise and sunset anomalies, the inflections (black circles in
Figure 7) mainly emerge close to the Graz facility (
Δ~−30 min) and to the EQ epicenter (
Δ~+80 min). The main groups appear at two
Δ intervals: (a) [−50 min, +20 min] with four groups, i.e., group 1 (‘+’ symbol), group 2 (‘*’ symbol), group 3 (‘◊’ symbol), and inflexions (‘•’ symbol), and (b) [+20 min, +180 min] with three groups, i.e., group 4 (‘
Δ’ symbol), group 5 (‘☐’ symbol), group 6 (‘x’ symbol) and group 7 (‘♦’ symbol). From 2 February to 7 February, we notice an abrupt increase of
Δ from +80 min to about~+180 min in the case of group 7 (‘♦’ symbol). As for the amplitude sunrise fluctuations, one notes the presence of a prior precursor (PP) when
Δ~−40 min and
Δ~+40 min. In the lower panel of
Figure 7, the blue rectangles show PP between 23 January and 25 January 2023.
3.7.2. Phase Sunrise and Sunset Spectral Anomaly Time Shifts
The phase sunrise anomalies show minima and maxima quasi-parallel lines, as displayed in the upper panel of
Figure 8. Such lines are similar to those observed for the amplitude sunrise anomalies (upper panel of
Figure 8), with alteration between maxima and minima lines. Irregularities in fluctuations take part in
Δ interval [−180 min, +10 min], and are more organized when
Δ is bigger than +30 min, and particularly at about
Δ~+80 min. Contrary to the inflexion anomalies, the jumps are not at the
Δ edges (i.e., minima and maxima of
Δ) but closer to the central part at around +50 min. The precursor signature occurs between 26 January and 1 February and principally from 27 to 31 January, where one can see that the first jump occurs on 29 January, and not before this date, and appears daily until 9 February. In the upper panel of
Figure 8, the blue rectangle shows the first main precursor (MP1), as found for amplitude sunrise variations. In the period from 26 January to 1 February, one also remarks that, on the same day 30 January, three minima (red colored symbols) occurred, and three maxima (blue colored symbols), where the jump (black colored symbol) may play the role of a maxima. Lower than
Δ~+10 min, only group 1 (‘+’ symbol) and group 2 (‘*’ symbol) are observed with similar fluctuations after 1 February. Two other groups, i.e., group 3 (‘◊’ symbol) and group 7 (‘•’ symbol), are very close to each other, nearly overlapping, from 30 January to 9 February in the
Δ interval [+40 min, +60 min]. Group 4 (‘
Δ’ symbol) materializes for the first time (nearly quasi-absent in the amplitude anomalies of
Figure 7) and corresponds to maxima (blue colored ‘
Δ’). This group has nearly quasi-parallel variations when compared to group 5 (‘☐’ symbol), which is found to contain only minima (red colored ‘☐’) anomalies. Both groups are confined to the
Δ interval [+70 min, +100 min]. As for the amplitude sunrise fluctuations, on notes the presence of a prior precursor (PP) when
Δ~0 min and
Δ~+80 min. In the upper panel of
Figure 8, the blue rectangles show where PP occurred.
The phase sunset anomalies exhibit a variation confined to Graz terminators, at about
Δ~0 min, as shown in the lower panel of
Figure 8. Jumps take place at the beginning, from 23 January to 31 January, when maximum anomalies appear from 31 January to 9 February. The second main precursor (MP2) occurs between 31 January and 3 February, as indicated by the blue rectangle in the lower panel of
Figure 8. Above the TBB terminators (i.e.,
Δ bigger than +50 min), one can see a clear progressive increase of
Δ from 45 min on 24 January, reaching a maximum of about 130 min on 3 February and ending at +90 min 6 days later. Group 1 (i.e., ‘+’ symbol), group 2 (i.e., ‘*’ symbol), group 4 (i.e., ‘
Δ’ symbol) and jumps anomalies (‘•’ symbol) are mainly discovered around the Graz terminators between −10 min and +20 min. Group 5 (i.e., ‘☐’ symbol) is quasi-absent around TBB terminators at about +50 min, and only group 6 (i.e., ‘
x’ symbol) and group 7 (i.e., ‘♦’ symbol) principally emerge above +70 min and up to 130 min. In the time interval 23 January to 25 January, one notes a similar variation as found for the phase sunrise anomalies. The prior precursor (PP) happens when
Δ~−10 min and is shown in a blue rectangle in the lower panel of
Figure 8.
4. Results and Analysis of VLF Sub-Ionospheric Spectral Anomalies
The main outcomes of our analysis are emphasized in this Section, where we insist on the efficiency of the multi-terminators method. Four aspects are highlighted: (a) the new spectral feature anomalies as the first stage; (b) the presence of the quasi-parallel lines as a second stage to justify further research into the approaching earthquake; (c) the role of jumps and inflexions as spectral anomalies as a third stage to enhance the prior precursor detections; and (d) the physical processes behind the reported precursors.
4.1. Minima, Maxima, Inflexions and Jumps as Spectral Feature Anomalies
Detailed analysis of the TBB amplitude and phase signal around the terminators is essential. The daily variations of the transmitter are well-known to be subject to the Earth’s rotation, with an alternation between day and night. The crucial transition from night-to-day and day-to-night defines the terminators, respectively, for sunrise and sunset. Enlarging the time window around the terminators has allowed the monitoring of new spectral features, like maxima, inflections and jumps, beside minima features. All these spectral anomalies are the basic ingredients with which to extricate and distinguish between real/authentic and wrong/false precursor(s). Hence a total number of 349 anomalies have been derived from the TBB signal, 204 at sunrise and 145 at sunset, in the period from 23 January to 8 February 2023, i.e., 17 days. It is appropriate with such a high number of anomalies to use the statistical tool approach. This can be foreseen as a first stage in improving the efficiency of the multi-terminators method.
The anomaly occurrence probability quickly brings to light peaks not related to the Graz or TBB terminators but to the EQ epicenter region, as shown in
Figure 6. Further, we have introduced groups, which leads to characterization of how the VLF signal propagates among two fundamental geographical points, the emitter (TBB transmitter) and the reception (Graz facility) stations. For this, we have distinguished the anomalies which appear: (a) before (i.e., group 1) and close to Graz terminator (i.e., group 2); (b) between the Graz and TBB terminators (i.e., group 3) and nearby TBB terminators (i.e., group 4); (c) between the TBB and EQ epicenter terminators (i.e., group 5) and near the TBB terminators (i.e., group 5); and (d) finally, before the EQ epicenter terminators (i.e., group 7). Group time intervals have been derived from occurrence probability in
Figure 6, which makes evident when precursors start to be noticeable and visible. The
Δ time difference linked to each group provided an opportunity to characterize the TBB signal propagation in the Earth’s waveguide.
4.2. Seismic and Non-Seismic Disturbances of TBB Radio Signal
One needs to insist on the role of the TBB transmitter signal in this analysis. First, the VLF emitted signal is subject to pre-seismic ionospheric disturbances before its detection by the Graz facility. Such disturbances are used as a marker and a tracer to characterize the precursor features. Hence, the reported spectral anomalies are directly linked to these ionospheric disturbances. Second, the TBB transmitter cannot provide information on seismic precursors, despite its close distance to the epicenter. Such powerful emitters are exclusively used for navigation and communication services [
3,
8], and not for seismic studies. The emitted radio wave is only subject to pre-seismic disturbances when it propagates in the ionospheric waveguide. However, space observations may allow investigation the radio emission beam [
53] of the transmitter station and its variability before EQ occurrence. Unfortunately, the altitudes and trajectories of satellites (e.g., DEMETER micro-satellite) cannot lead to continuous and exclusive observations above the transmitter station.
The following steps have been respected to distinguish and separate seismic and non-seismic disturbances of the TBB transmitter signal. Primarily, we have examined the solar and geomagnetic activities from the beginning of January to the end of February 2023, which have been found to be quiet and moderate. Then, we have investigated a shorter period of 10 days (28 January to 6 February) to check if anomalies occurred before the EQ. We found that two precursors are evident, on 30–31 January and 2–3 February. Then, we agreed to examine the time evolutions of the anomalies before 28 January and after 6 February We have extended the investigated time interval from 10 days (28 January to 6 February) to 17 days (23 January to 8 February 2023), enabling discovery of the following: (a) the prior precursor (23–25 January) which exhibits weaker signal disturbances when compared to those of the main precursor, and (b) the post-evolution (6 February to 8 February) of the anomalies, which were reduced but continued after the EQ occurrence. This denotes that the selected period of 17 days may be ideal. because it provides details on the main precursor phase and how it grows (23 January–25/26 January), develops (27 January–3 February), and progressively attenuates (3 February to 8 February).
We find that the variation in the Δ time difference versus the observation days exhibits the presence of quasi-regular parallel lines with inherent minima and maxima spectral features. This may be expected as a second stage in improving the efficiency of the multi-terminators method. Hence, one notes, particularly, lines for the amplitude and phase sunrise anomalies when, respectively, Δ is on average at about +35 min and +80 min. Such spectral features seem to be not related to seismic disturbances but to the usual and ordinary TBB wave propagation. However, on some occasions, in the parallel lines, irregularities occur, like drops in minima and absence of maxima. This is the case for the amplitude and phase sunrise anomalies between 27 January and 30 January. Simultaneously and on the same day interval, an increase and decrease in extrema are evident around the Graz terminators in the amplitude sunrise at Δ~±20 min, and for the phase sunrise at Δ~+30 min. The sunset anomalies also show clear irregularities four days later, i.e., 31 January to 3 February. The time difference is about Δ~−25 min and −50 min, respectively, for amplitude and phase anomalies.
Those two consecutive precursors on 27/28 January and 31 January/1 February take place, respectively, 8 days and 4 days before the earthquake occurrence. However, it is necessary to examine whether earlier precursors exist, and how they are linked to specific geographic location(s). This may be comparable to the analysis of Boudjada et al. [
48], but using the
Δ time difference. A more precise analysis of the spectral anomalies leads to the discovery of similar variations from 23 to 25/26 January: (a) in the amplitude sunrise at Graz (i.e.,
Δ~[−70 min, −50 min]) and the EQ epicenter (i.e.,
Δ~[+105 min, +120 min]), (b) in the phase sunrise at Graz (i.e.,
Δ~[0 min, +10 min]) and the EQ epicenter (i.e.,
Δ~[+90 min, +100 min]). This indicates the possibility of further investigation of observations which may be considered as of the prior percussors appearing on 23 January, earlier than the main precursors on 27/28 January and 31 January/1 February Such prior percussors occurring 12-days before the EQ can be assumed as indicators which support extra investigation of an approaching seismic event.
4.3. Inflexion and Jump Spectral Features as Prior Precursor Parameters
Inflexion and jump anomalies have been observed in the amplitude and phase spectral features, respectively. We remark that only two inflexions occurred on one day, on 31 January, and the other on 1 February, in the amplitude sunset anomalies (i.e., lower panel of
Figure 7). We also notice that jumps have only been found to be negative on two occasions, on 29 and 31 January. All these dates belong to the main precursors previously reported, i.e., 8 days and 4 days before the EQ occurrence. The inflexions and jump anomalies also display similar behaviors, i.e., daily occurrence from 23 to 25 January, as in the prior precursor period 23 to 25/26 January.
We have reported in sub-
Section 3.4 the absences of inflexions and jump anomalies, respectively, on 27 and 31 January (
Table 2), and 26 and 28 January (
Table 3). We note that the inflexion amplitude anomalies occurred in the prior precursor period (23–26 Jan at sunset), and disappeared on 27 January at the beginning of the main precursor (e.g., MP1), and again vanished on 31 January (i.e., marking the end of the first main precursor phase). In both cases, we find that maxima occurred on 27 January and 31 January near the Graz facility (around −30 min), when inflexions were not observed. In the case of the jump phase anomalies, and as for inflexions, they occurred in the prior precursor period (23–26 January), vanished on 26 January, came back on 27 January, and again disappeared on 28 January All these jumps were observed at sunset. With the beginning of the first main precursor, after 28 January, all jumps continuously occurred at sunrise until 8 February. The combination of the presence and the absence of anomalies (inflexions and jumps) leads us to conclude that a precursor process affecting the amplitude and phase reveals different behavior during the prior (e.g., PP) and main precursors (e.g., MP1 and MP2).
The analysis of the slopes for inflexions (sixth column in
Table 2) and jumps (sixth column in
Table 3) leads us to insist on common behavior. Hence at three occasions, 28 January, 1 February and 4 February for the inflexion slopes, and 27 January, 30 January and 2 February for the jump drifts, maxima have been recorded. We note that the maxima jump drifts occurred earlier with a difference of one/two day(s). These maxima can also be presumed as pointers of the end of the prior precursor (i.e., 25/26), the beginning of the first main precursor (i.e., on 27 January), and finally the end of the second main precursor (i.e., on 3 February).
It is possible to guess that both spectral features, the inflexions and the jumps, are originally minima or maxima anomalies. The inflection anomaly seems to be the result of a minimum, which in a very short time transforms to a maximum, and vice versa, with a difference in intensity level of less than 1 dB. Conversely, the jump anomaly appears as the consequence of the addition of ±180° to a minimum/maximum phase. These spectral features, like the irregular minima and maxima, are all signatures of the seismically disturbed ionosphere, which perturbates TBB transmitter propagation along its ray path before the EQ.
4.4. Physical Processes Behind the Prior and Main Precursors
The main precursors reported at the end of January and beginning of February are linked to distinct disturbances of the amplitude and the phase of the TBB signal due to ionospheric instabilities 10 days to one week before the EQ occurrence. These precursors have been reported by other studies (see
Section 1.4). The prior precursors, as shown in
Figure 7 and
Figure 8, occur 15 days before the seismic event. We believe that both the prior precursor and the main precursors are generated by the LAIC mechanism, with an increased growth rate starting two weeks before the EQ and reaching a maximum at the end of January 2023, i.e., about one week before the EQ.
However, we note the existence of non-seismic phases corresponding to
Δ time intervals close to zero. This is the case for the following specific days for the following: (a) the amplitude sunrise in the upper panel of
Figure 7: 27 DOY and 30 DOY; (b) the amplitude sunset in the lower panel of
Figure 7: 23 DOY and 34 DOY; (c) the phase sunrise in the upper panel of
Figure 8: 24 DOY and 25 DOY; and (d) the phase sunset in the lower panel of
Figure 8: 23 DOY and 32 DOY. The presence of non-seismic and seismic days in the investigated period suggests a particular phase process in the LAIC mechanism.
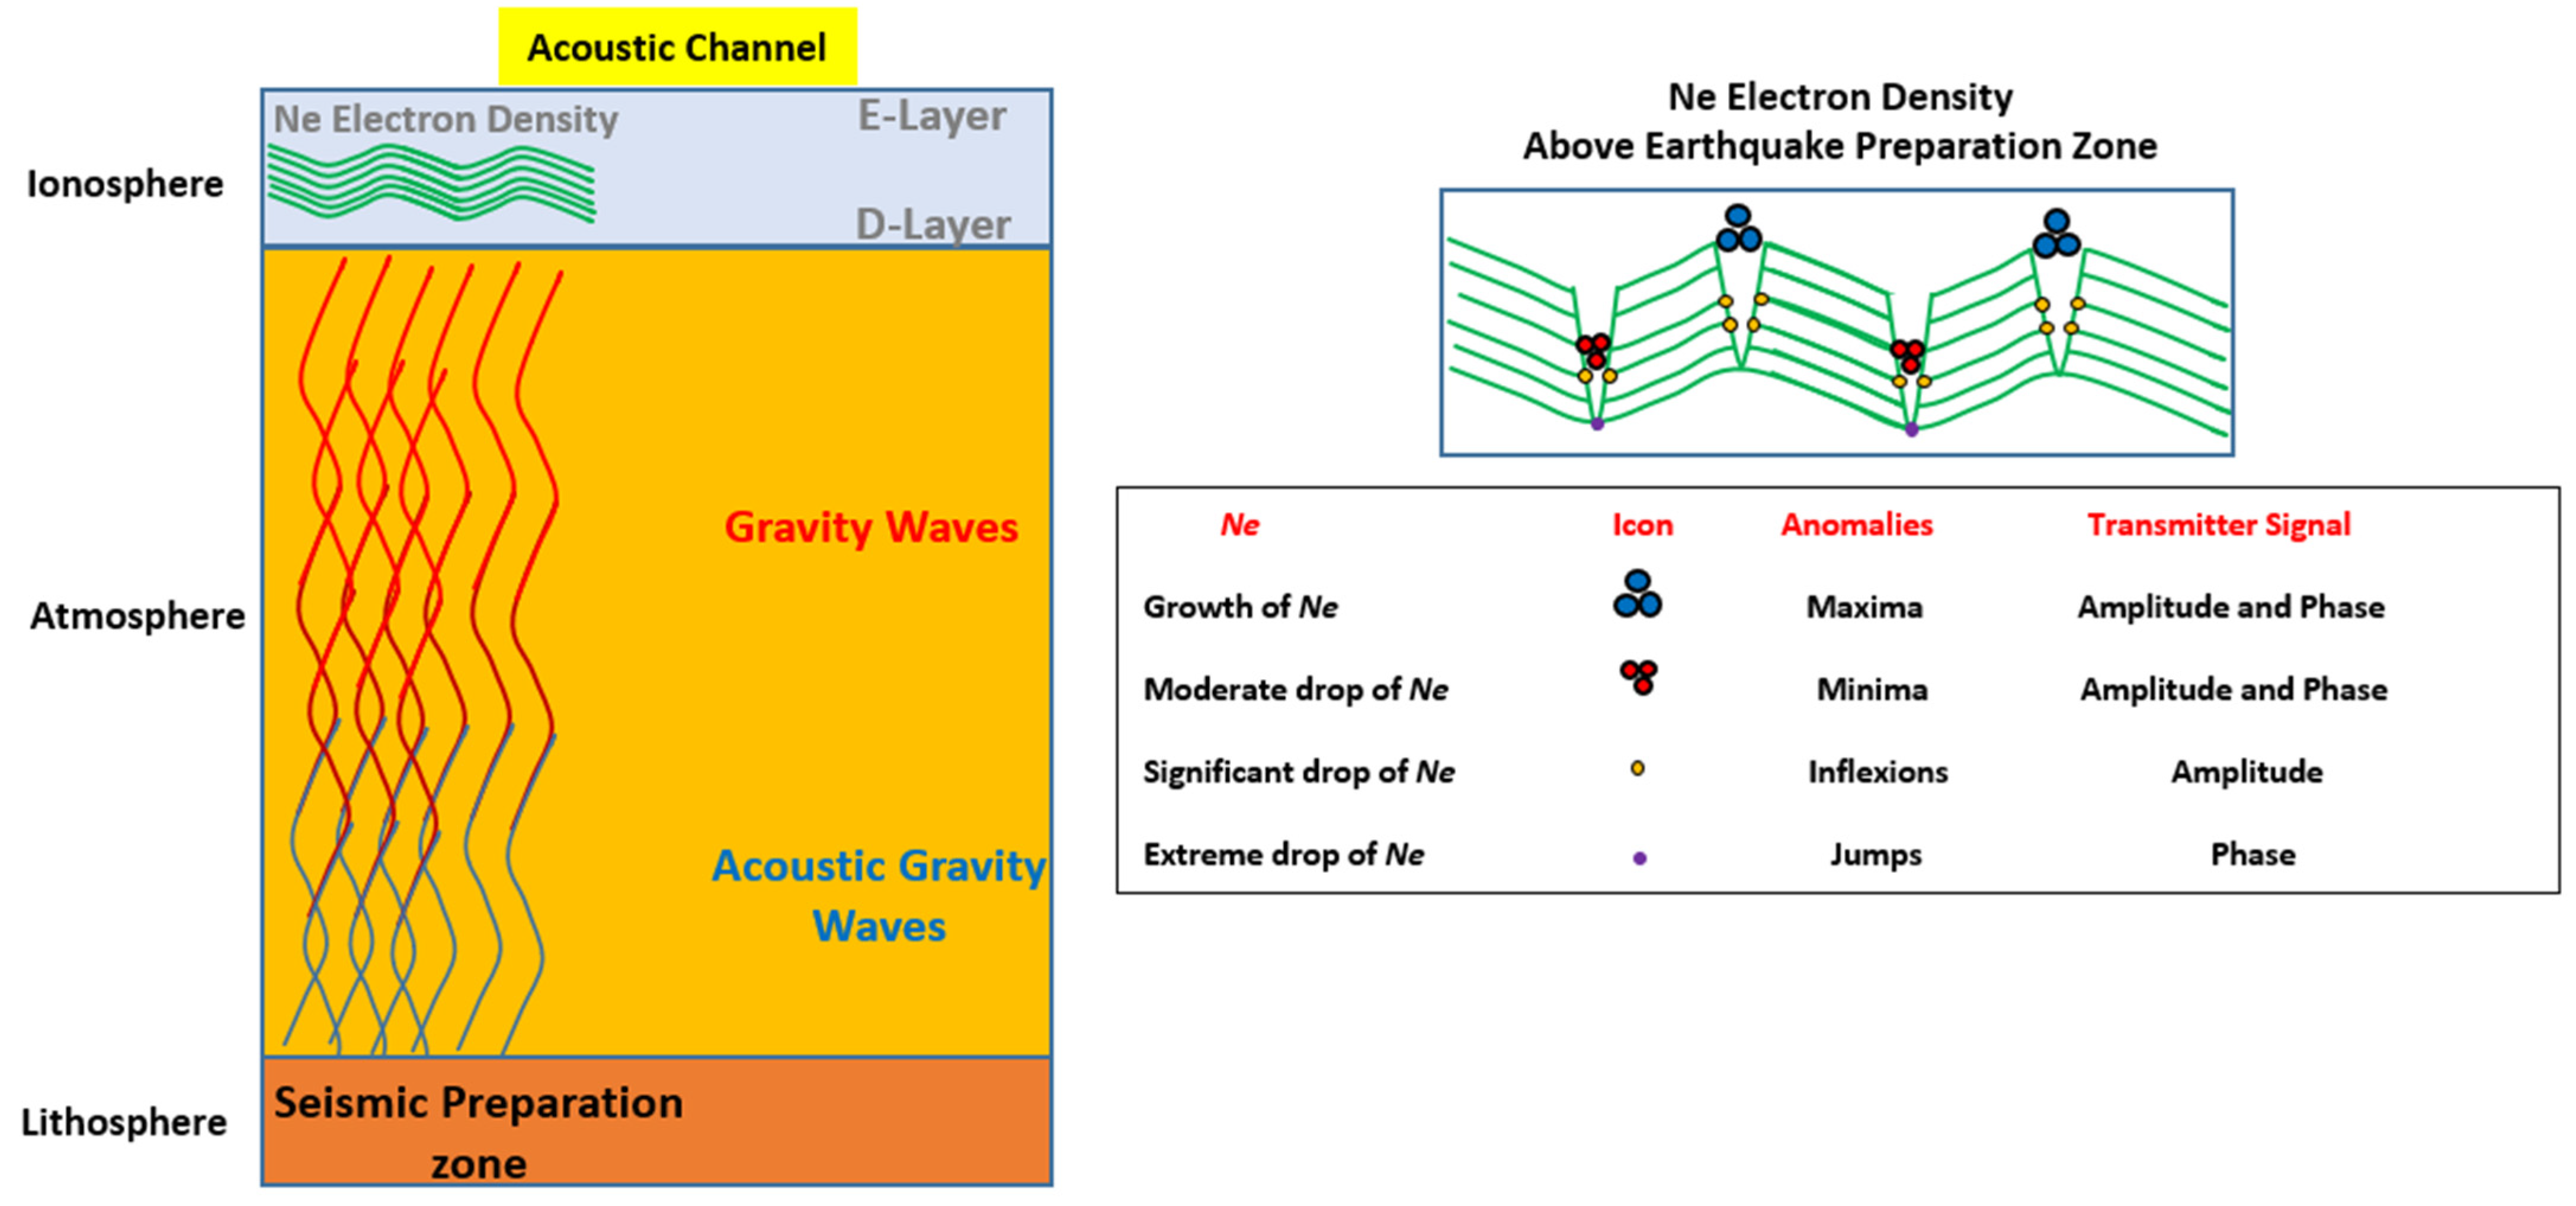
Figure 9 displays the acoustic channel of the LAIC mechanism, where we refer to the model of Yoshida et al. [
36] on the relationship between minima/maxima spectral anomalies linked to a drop in/growth of the ionosphere electron density. The left right panel shows the main physical processes in the atmosphere (i.e., AGWs and GWs), which occur at the origin of the ionosphere pre-seismic disturbances. The right panel provides a connection between the variations in the ionospheric electron density
Ne and the observed anomalies. In this context, the maxima and the jumps can be the results, respectively, of the growth and the extreme drops in
Ne. Moderate and significant drop in
Ne may be the consequence of the minima and inflexion anomalies.
We conclude that, as shown in
Figure 9, the features of the Turkey Syria precursors are as follows:
the seismic preparation zone exhibits a coupling between the lithosphere, the atmosphere and the ionosphere.
the atmospheric gravity waves amplify with altitude because of air density reduction.
the disturbances of the ionosphere electron density by GWs generates anomalies in the transmitter signal detected by the ground-based facility.
The low/high decrease/increase in ionospheric density produced the reported anomalies, principally extrema (~80%, i.e., 43% minima and 38% maxima). which are explained by Yoshida et al. [
36].
The inflexions and jumps (~20%) are clearly inherent in the same model [
36].
5. Conclusions
In this study, we attempt to investigate the utility, the realism and the accuracy of this method. We have computed the anomaly occurrences by separating sunrise and sunset spectral anomalies. The characterization of the efficiency of the multi-terminators method leads to forecast of the sunrise and sunset terminators linked to the EQ preparation zone. This method enables estimation of the time difference
Δ between the sunrise/sunset terminators of the reception station (e.g., Graz facility) and the occurrence time of the spectral anomalies generated by the pre-seismic areas. The time interval
Δ, when converted into geographical longitude, indicates the probable location of the EQ preparation zone. In the case of the Turkey–Syria EQ, we have applied the MTM method and found the prior and main precursors, respectively, 11 days and 5 days before seismic activity in the Anatolian region, well-known as predisposed to seismic activity. We have used the TBB transmitter signal because of its ray path in the pre-seismic sensitive region. principally defined by the Dobrovolsky preparation zone and the fifth Fresnel elliptic area. Ray paths of other European transmitters, like the ITS and ICV Italian transmitters, are found outside this sensitive region. Besides minima and maxima spectral anomalies reported in Boudjada et al. [
48], we have added two new features, inflections and jumps, appearing, respectively, in the amplitude and phase of the TBB transmitter signal.
Hence, a total of 349 anomalies have been derived from the MTM method, where 43.0% are minima, 38.4% maxima, 9.7% jumps, and 8.9% inflections. Such spectral anomalies provide a more precise idea of the ways the transmitter signal is perturbated before the EQ occurrence. These pre-seismic anomalies have been recorded in the time interval from 23 January to 8 February 2023. This has allowed us to use the statistical tool approach, where anomaly occurrence probability peaks are a first stage in restricting the location of the preparation EQ zone. The occurrence probability quickly brings to light peaks not related to the Graz or TBB terminators but to the EQ preparation zone. The computed occurrence has been estimated each 12 min, corresponding to a longitude interval of about 3° when sunrise and sunset terminators vary at 04.40–07.60 UT and 13.20–16.80 UT, respectively. The presence of several occurrence peaks provides the possibility of analyzing the performances of spectral anomalies in defined zones. Seven groups have been considered, taking into account the terminator time intervals. For this. we have distinguished anomalies which appear as follows: (a) before (i.e., group 1) and close to the Graz terminator (i.e., group 2); (b) between the Graz and TBB terminators (i.e., group 3) and near the TBB terminators (i.e., group 4); (c) between the TBB and EQ epicenter terminators (i.e., group 5) and near the TBB terminators (i.e., group 6); and (d) finally, before the EQ epicenter terminators (i.e., group 7). This second stage details the behavior of the anomalies in each group versus the investigated time interval, and the estimation of Δ time difference between the Graz terminators and the anomaly time occurrence. The enlarge of the observation time window around the Graz terminators have allowed us to recognize an increase the number of spectral anomalies and to provide an overview of the VLF wave propagation between the emitter station and the reception facility.
This stage has provided the possibility of studying the propagation effects which occur in the detected transmitter signal, where alternance of minima and maxima above the TBB station and the EQ epicenter region, have been observed. These extrema bring an overview of the combined effect of the sky and ground waves along ray paths. However, irregularities (like absence of extrema, or change in anomaly Δ time difference) reveal the presence of two main precursors, from 27 January to 30 January (e.g., MP1), and from 31 January–3 February (e.g., MP2). More important is the prior precursor (e.g., PP) detected from 23 January to 25/26 January, where anomaly fluctuations around the Graz terminators are found to be similar to those approximately situated at the EQ epicenter area. The investigation of the maximum slopes related to the inflexions and the jumps leads us to consider that such drifts are markers of the end of the prior precursor (i.e., 25/26), the beginning of the first main precursor (i.e., on 27 January), and finally the end of the second main precursor (i.e., on 3 February).
A forecasting model can be suggested within the frame of this work, where the following steps can be observed: (a) a choice of a powerful VLF transmitter with a preferable constant phase variation; (b) transmitter ray paths included in the pre-seismic sensitive region defined by the Dobrovolsky preparation zone and Fresnel elliptic area; (c) a daily analysis of spectral features (minima, maxima, inflexions and jumps), particularly those with
Δ time difference more than ±12 min; (d) an anomaly occurrence probability based on sunrise and sunset terminators of the transmitter station and the VLF reception facility; (e) A study of
Δ time difference versus day of the year where transmitter and reception terminators are indicated. These steps can provide, in the presence of spectral anomalies, first hints on the longitudinal locations of the seismic preparation zone, particularly when simultaneous anomalies like prior precursors (as shown in
Figure 7 and
Figure 8) occur in the amplitude sunrise and sunset, and also in the phase sunrise and sunset. The daily change in the jump drift rates, from positive to negative is a good indicator for the near-future start of the main precursors.
Future perspectives will be devoted to the comprehension of the relationship between the prior and the main precursors. This can only be achieved by applying the multi-terminator method to other EQs. Of course, the new reception system (i.e., UltraMSK-2) used for this investigation and the powerful transmitter signal (i.e., TBB transmitter) play a crucial role in the spectral anomaly detection. All these ingredients may provide a clear hint on the origin of seismic precursors, and a possibility of earthquake forecast by radio observations in the very low frequency band. In the near future, new UltraMSK-2 stations are planned to be installed in Guyancourt (France), Reunion and Sri Lanka as reported by Galopeau et al. [
51] permitting an enlargement of the VLF network. New collaborations are also intended with other networks, like AWESOME, SAVNET, teams in Japan and in India, and VLF communities like lightning location network (i.e., WWLLN). The synergy between the VLF ground-based networks (e.g., INFREP network) and space-based satellites (e.g., CSES1, CSES2, Swarm) can lead to a better comprehension of the ionospheric pre-seismic perturbation behaviors, particularly when simultaneous observations can be performed.
