Article

Effects of CO2 on the Mechanical Properties of Hanna Sandstone

Department of Civil and Architectural Engineering and Construction Management, 1000 E. University Ave, University of Wyoming, Laramie, WY 82071, USA
*
Author to whom correspondence should be addressed.
Geosciences 2024, 14(10), 279; https://doi.org/10.3390/geosciences14100279
Submission received: 27 August 2024 / Revised: 11 October 2024 / Accepted: 16 October 2024 / Published: 21 October 2024
(This article belongs to the Special Issue Computational Geodynamic, Geotechnics and Geomechanics)

Abstract

:
Possible deterioration of a rock’s structure and mechanical properties due to chemical reactions between the host rock, formation water, and CO2 requires due attention. In this study, cylindrical sandstone specimens obtained from the Hanna Formation, Wyoming, were prepared under three treatment conditions: dry, submerged in water, and treated with water + CO2 for one week at a pressure of 5 MPa and room temperature. Specimens were subjected to three effective confining pressures of 5, 15, and 25 MPa. The mechanical test results show that water + CO2 treatment, on average, decreases the peak strength and elastic modulus of the specimens by 36% and 20%, respectively, compared to dry specimens. For all three effective confining pressures, the dry specimens exhibited higher compressive strengths, larger Young’s moduli, and more brittle behavior. CO2-treated specimens showed significantly lower calcite contents.

1. Introduction

The demand for energy has increased with the growth in the world’s population. This has necessitated the use of fossil fuels, which created the global warming problem. With the global warming situation worsening in the past decades, scientists have always been seeking ways to reduce the emission of greenhouse gases like carbon dioxide (CO2). One of the most promising technologies to alleviate this environmental crisis is carbon capture, utilization, and storage (CCUS). In this method, CO2 is captured from an emitting source and injected into an underground formation to be stored for an almost infinite time. According to the Intergovernmental Panel on Climate Change (IPCC) sixth assessment report (AR6) in 2021, CCUS is one of the major technologies assisting in achieving the net-zero carbon dioxide emissions goal by 2050 [1,2,3]. However, CO2 geological sequestration is not without challenges. Possible chemical reactions between the host rock, CO2, and the Formation- water can alter the rock’s mineralogy and pore structure. For instance, the reaction between water and CO2 [4] can release hydrogen cations in the medium, which creates an acidic environment. This, in turn, can cause the dissolution of other minerals such as calcite, dolomite, feldspar, and kaolinite [5,6,7,8]. These changes can affect the mechanical and elastic properties of rock, which, in turn, can influence the stability and applicability of the formation for CCUS [9,10,11].
An extensive literature review has shown that CO2 can indeed cause significant alterations in the mineral composition of rocks [12]. For instance, when Hawkesbury sandstone samples were subjected to water + CO2 treatment under a pressure of 8 MPa at 32 °C for four months, the concentration of Ca+ increased by 422%, attributed to carbonate dissolution [13]. Similarly, Pecos sandstone samples exposed to CO2 treatment (7.5–21.5 MPa, 22 °C, 62 h) exhibited higher levels of various cations such as Na+, Ca2+, K+, and Si4+. However, the evolution of cation and anion concentrations varied over the treatment period. In the case of Pecos sandstone samples under 13.6 MPa and 80 °C, cations initially increased up to 14 days due to the dissolution of halite and then declined thereafter because the deposition process had begun [14].
In addition, the pore structure of rock can change as a result of different chemical reactions after the CO2 treatment. Various studies reported higher porosities in sandstone samples following CO2 treatment, attributed to the chemical dissolutions of minerals like carbonates and clays [15,16]. For example, Mt. Simon sandstone samples showed a 2 to 4.3% increase in porosity [17]. The heterogeneity of the rock matrix creates even more complexity. CO2 may migrate more easily along specific pathways depending on the orientation and arrangement of minerals within the rock [18]. Through acoustic velocity and electrical resistivity measurements, Nooraiepour et al. [19] showed that rock-CO2 interactions also affect the volumetric strain, and the permeability of fractured rock was impacted by the pore pressure, stress level, and fluid type. P-wave velocity measurements in carbonate samples showed that the confining pressure has a positive effect on the velocity, and it also decreases the fluctuations in the wave velocity [20]. An experimental study on fractured Niobrara shale cubes showed that strong existing fractures did not affect the fracture propagation, whereas weak existing fractures hindered the fluid flow [21].
Because of changes in the pore structure after the CO2 treatment, samples usually show deterioration in their mechanical properties. Lower bulk moduli in CO2-treated sandstone samples were reported in a few studies [22]. A set of triaxial compression experiments reported 23% lower compressive strength of Weber sandstone samples following CO2 treatment at 36.5 MPa and 90 °C [23]. A higher percentage of decrease in the compressive strength was observed by Foroutan et al. [24], where Pecos sandstone samples showed 48% lower compressive strength when exposed to brine + CO2 under 7.5–21.5 MPa, 22 °C, and 62 h.
The elastic properties of rocks are also affected by rock-CO2 interactions. While Zigong sandstone samples treated with CO2 showed a 41% decrease in their elastic moduli, a higher decrease of 51% was recorded when the treatment fluid was water + CO2 [25]. Similar decreases in elastic modulus were reported in other studies [26,27]. Contradictory results on the effect of CO2 treatment on the Poisson’s ratio of sandstone samples were reported in the literature [28,29]. Ng et al. [23] observed a 17% decrease in Poisson’s ratios from 0.35 to 0.29 of Weber sandstone samples after CO2 treatment at 36.5 MPa and 90 ⁰C from triaxial compression tests. However, Rathnaweera et al. [13] found a 14% increase in Poisson’s ratio from 0.28 to 0.32 of Hawkesbury sandstone water-saturated samples after CO2 treatment at 8 MPa, 32 °C, and for 4 months.
Despite numerous studies examining the chemical reactions in rocks after CO2 injection, the possible changes in the mechanical and elastic properties of rocks have gained less attention. For this study, sandstone samples were gathered from the Hanna Formation. The Hanna Basin is located in Southeast Wyoming, bounded by Laramide-aged uplifts (Figure 1). The formation was formed in the Tertiary period and extends from 0 to 2134 m below the ground level [30]. Conglomeratic sandstone lays at the base of the formation, with conglomerate, sandstone, shale, and coal beds alternating to the top. In a study on a unit from the Hanna Formation, 72.2% of the rock footage was comprised of Calcareous sandstone [31]. The average porosity of Hanna sandstone, determined using the gravimetric method, ranges between 13.8 and 15.4% [32].
This paper describes the effects of water and water + CO2 treatments on the mineralogy, pore matrix, and mechanical and elastic properties of Hanna sandstone. The results of X-ray diffraction (XRD), scanning electron microscope (SEM), and triaxial compression (TC) experiments conducted at different pressures are presented. This is the first time that the geomechanical responses of Hanna sandstone to CO2 treatment have been investigated. Relatively large specimens are used to better represent the geomechanical conditions of the geological formation. This study uses newly installed and uniquely designed high-pressure and high-temperature triaxial compression equipment to determine the effect of CO2 on Hanna sandstone. The results provide scientific evidence of the effect of water and water + CO2 treatments on the engineering properties and failure behavior of Hanna sandstone.

2. Materials and Methods

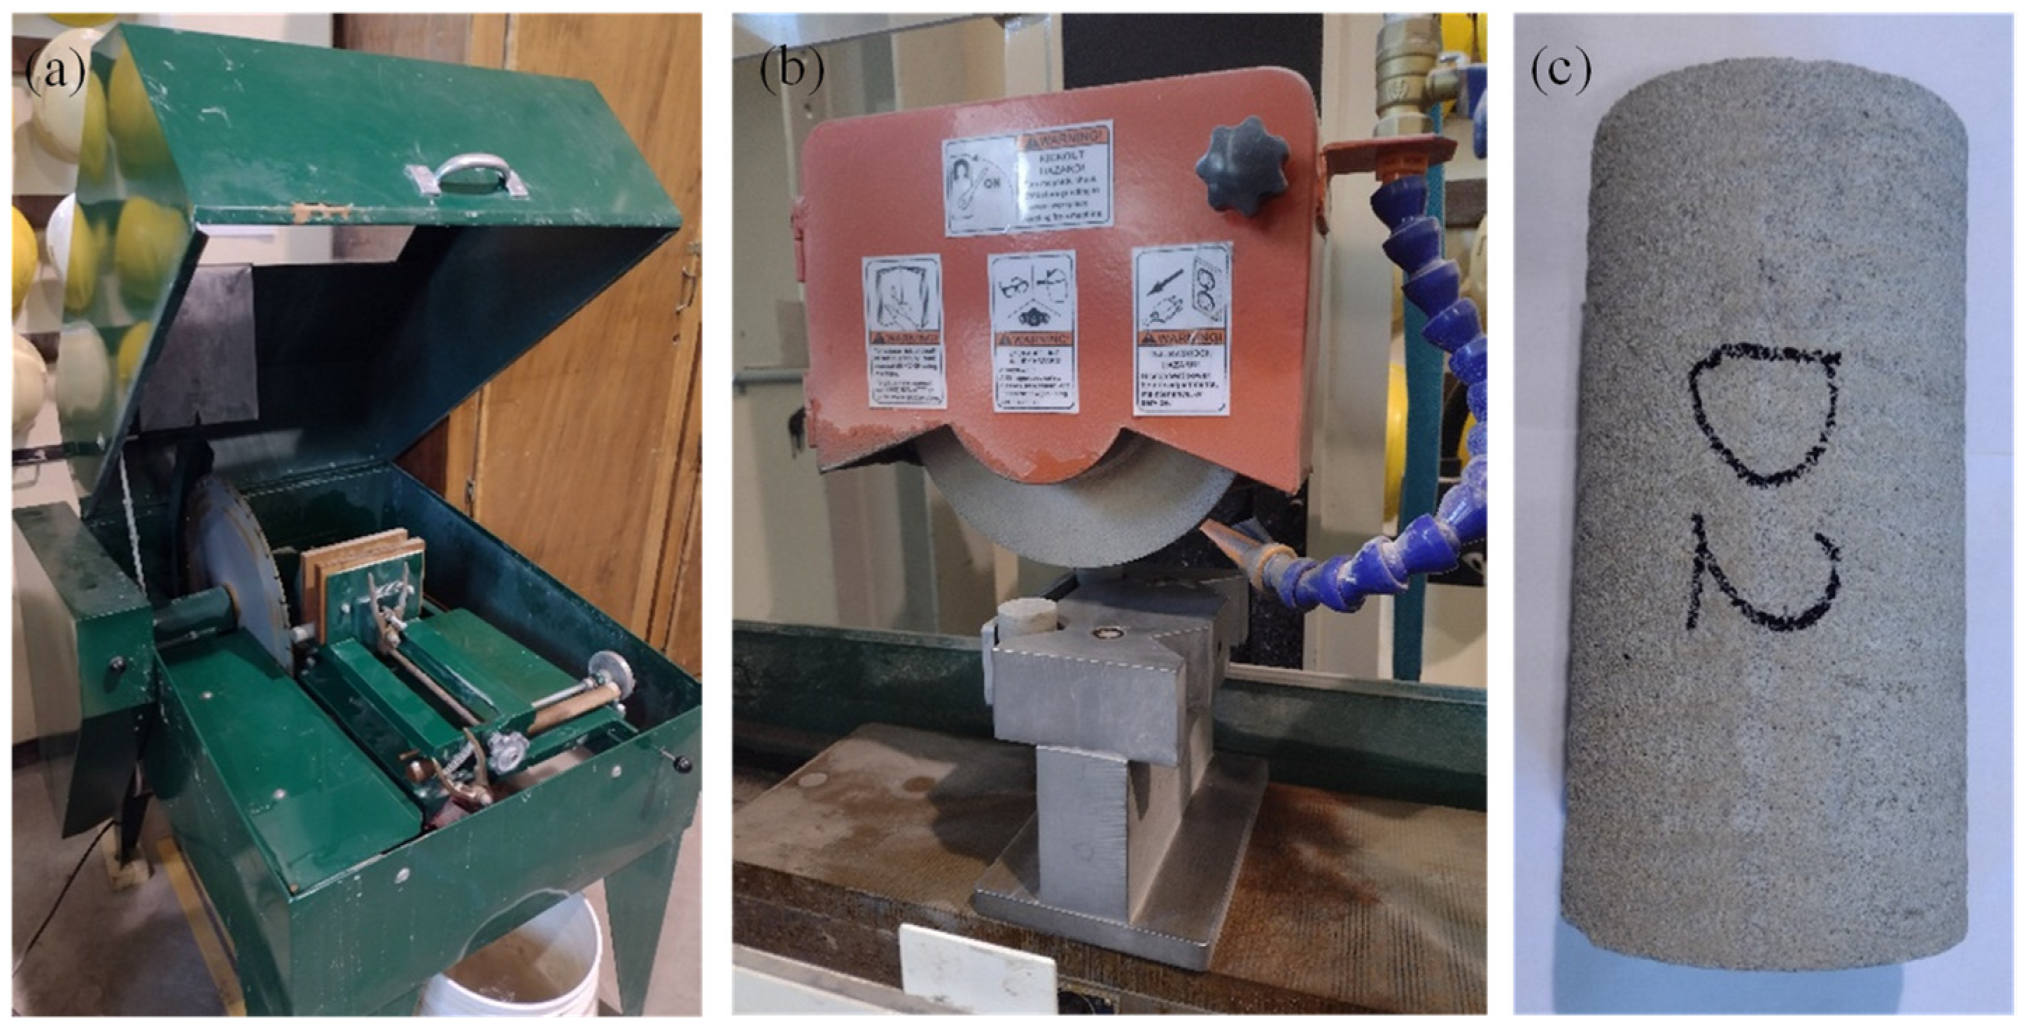
2.1. Specimen Preparation

Rock cores of Hanna sandstone with 76.2 mm diameter were obtained in lengths of 1000 mm from underground coring and then cut using a wet wheel saw (Figure 2a) to 152.4 mm length following ASTM D4543-19 [33]. Using a surface grinder (Figure 2b), both ends of all specimens were polished to ensure that they were smooth and perpendicular to the length. Figure 2c shows one of the specimens prepared for this study. All specimens were then oven-dried at 103 °C for one day.

2.2. Treatment of Rock Specimens

In this study, sandstone specimens were treated in three different conditions. The initial treatment condition, referred to as “Dry”, was the oven-dried specimens described in Section 2.1. The second treatment setting, labeled as “Water”, was to submerge the rock specimens in a vacuum incubator filled with water for one week. The third treatment condition, known as “Water + CO2”, was to first submerge the rock specimens in the vacuum incubator filled with water for one week and then transfer them to an autoclave vessel (MTI HPV10LH), as shown in Figure 3a, containing 180 mm of water. This vessel, with a capacity of 10 L, can support a maximum pressure of 20 MPa and temperatures up to 200 °C [34]. To increase the pressure, a gas booster (Maximator DLE 75) (Figure 3b) was utilized to compress research-grade CO2 (99.999% purity) from a gas cylinder before it was injected into the vessel. After opening the inlet valve, gas injection proceeded until the vessel’s pressure gauge showed a level of 5 MPa. Rock specimens were kept in the vessel at room temperature for 168 h (1 week).

2.3. Rock Characterization via XRD and SEM Analyses

XRD analysis was performed on sandstone specimens (in powder form), covering a 2θ range from 5° to 80° with a scanning rate of 3° per minute. The resulting intensity data were plotted against the 2θ values to identify the minerals present. For SEM analysis, gold-coated flat chips taken from the specimens were examined using FEI Quanta 250 in the University of Wyoming’s material characterization lab. The SEM analysis was carried out at a voltage of 5 kV, with a spot size of 4.5. INCA software v4.15 facilitated the energy dispersive X-ray spectroscopy (EDS) to detect the various elements and minerals in the samples.

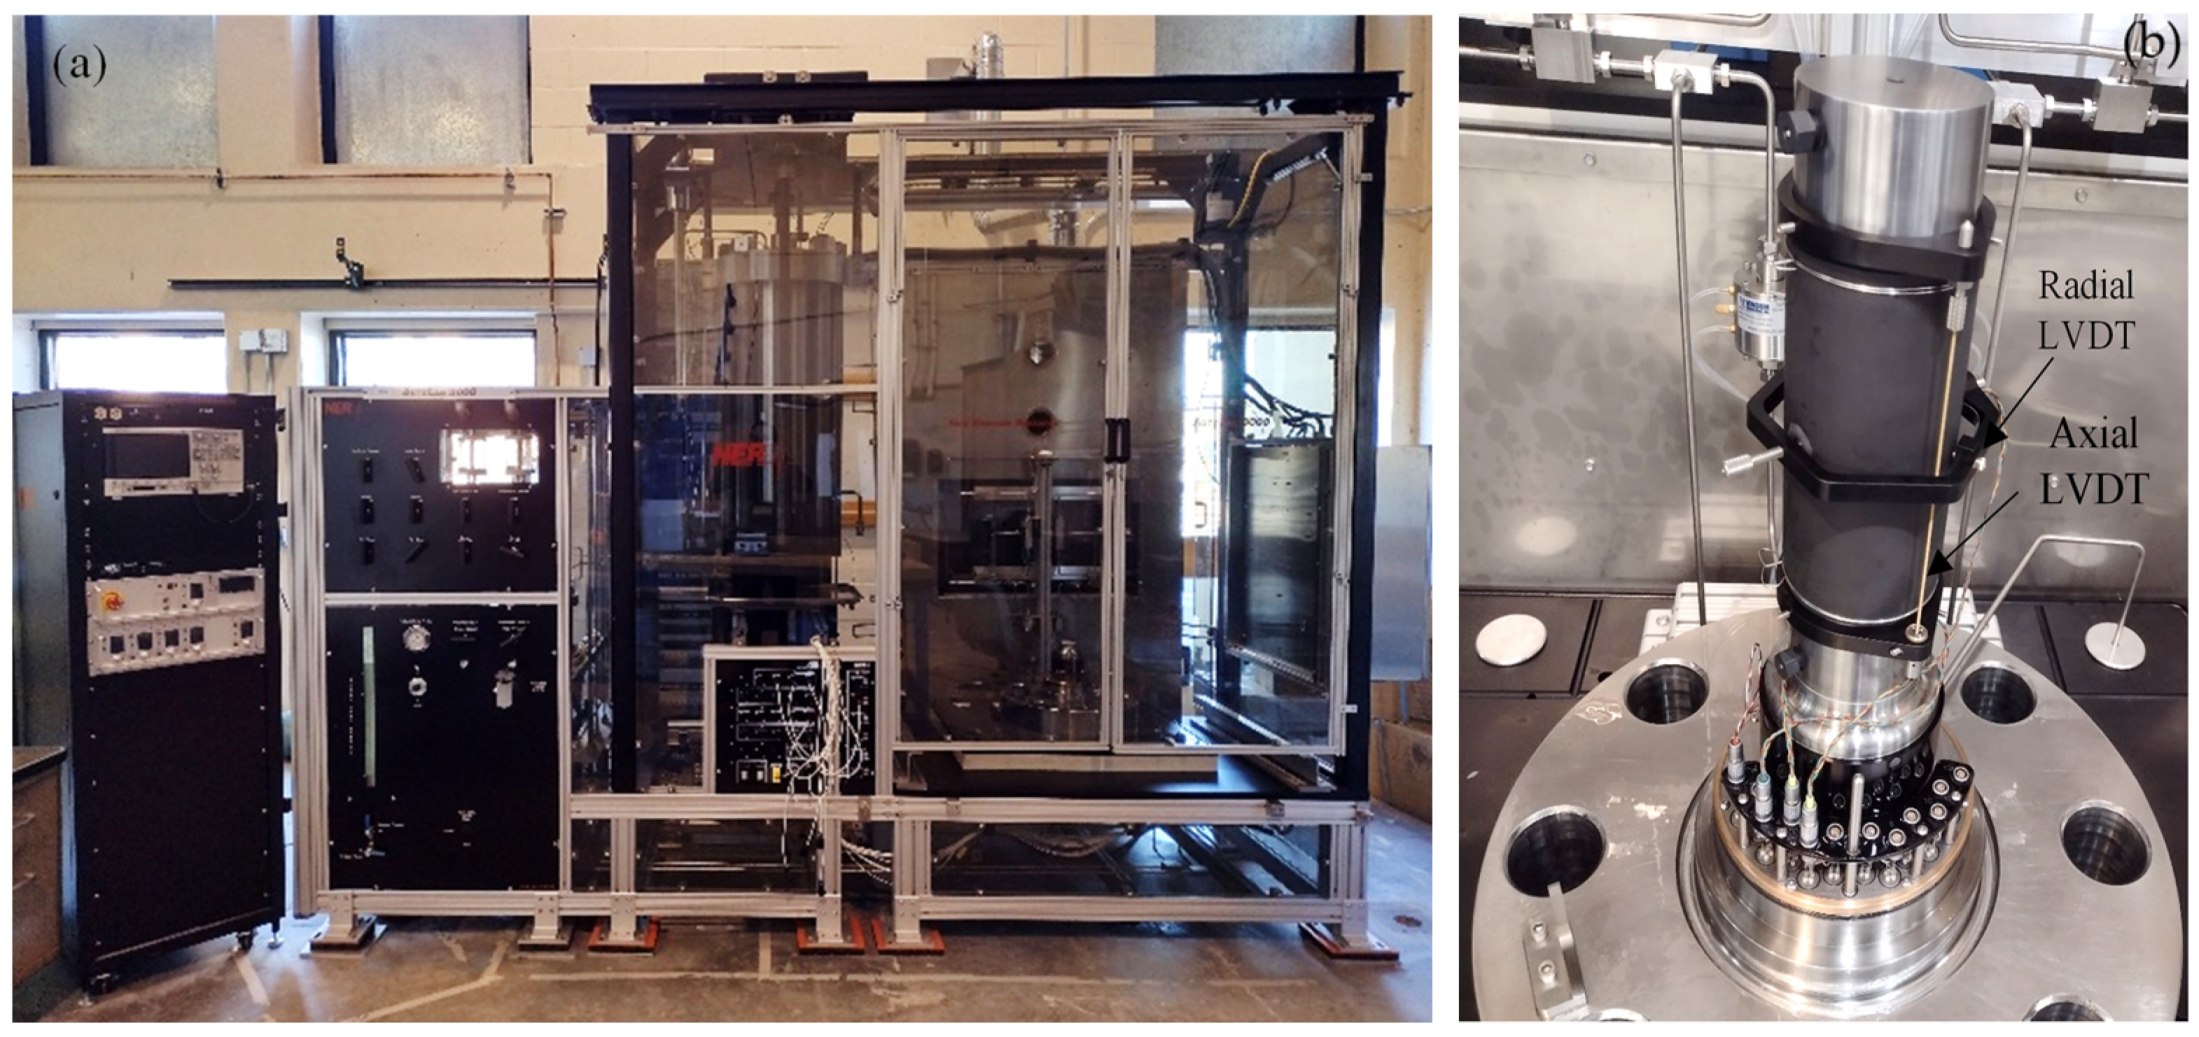
2.4. Rock Strength Determined Using Triaxial Compression (TC) Tests

The specimen identification, treatment specifications, confining pressure (Pc), pore pressure (Pp), and effective confining pressure (Pd) for TC experiments are summarized in Table 1. Three rock specimens were prepared for each treatment condition. For the dry treatment, Pc values of 5, 15, and 25 MPa and no Pp were applied. For the two other treatment conditions, three Pc values of 10, 20, and 30 MPa and a constant 5 MPa Pp were applied. All TC experiments were conducted at room temperature. Specimen IDs consist of two components: (i) the treatment condition—D for dry, W for water treatment, and C for water + CO2 treatment; and (ii) the specimen number—1 for specimen tested under 5 MPa effective confining pressure, 2 for specimen tested under 15 MPa effective confining pressure, and 3 for specimen tested under 25 MPa effective confining pressure.
TC tests were performed using high-pressure and high-temperature polyaxial equipment (NER AutoLab 3000) located at the University of Wyoming [35] (Figure 4a). Prior to performing TC tests, the specimen’s diameter and length were measured. The specimen, covered with a Viton jacket, was then positioned within lower and upper core holders along two axial LVDTs in addition to one radial LVDT. Next, the setup was moved to the equipment and put on top of the base (Figure 4b). Figure 5 illustrates the TC test procedure through the application of Pc, Pp, and axial deviatoric stress. First, the specimen was subjected to a 2 MPa Pc in stage 1. After that, in the case of specimens with dry treatment conditions, the Pc was ramped to the target pressure at a 3 MPa per minute rate. For specimens with water and water + CO2 treatment conditions, the Pc was increased to 5 MPa so that the condition would be ready for injecting the pore water pressure (stage 2). The Pp was created by injecting deaerated water from the bottom of the specimen, setting an initial value of 2 MPa (stage 3), and then ramping at a rate of 3 MPa/min to the desired value along with the Pc (stage 4). Since the confining pressure and pore pressure were raised to their respective target levels at the same rate, the specimen underwent minimal changes in effective stress. At this point, the strength test could begin, in which the axial stress was applied to the specimen with a sitting stress of 2 MPa (stage 5) at a displacement rate of 0.003 mm/s beyond the specimen’s failure to capture pre/post-failure responses (stage 6).

3. Results and Discussion

3.1. Characterisation

3.1.1. Mineral Changes from XRD Analysis

The XRD patterns are displayed in Figure 6, and Table 2 lists the weight percentage of minerals in the dry specimen and the specimen treated with water + CO2. Regardless of treatment conditions, the dominant phase of the sandstone is quartz. Compared to the dry specimen, the results show that water + CO2 treatment increases the quartz, siderite, muscovite, and kaolinite relative contents. The increase in quartz content after CO2 treatment was also observed in other studies [36,37]. On the other hand, a significant reduction in the weight percentage of calcite is observed, which is a sign of mineral dissolution resulting from CO2 treatment. It is worth mentioning that the increase in quartz content does not necessarily mean the precipitation of the mineral, but the relative increase in quartz content can be because of the dissolution of other minerals, such as aegirine [38]. The reduction in aegirine content in the CO2-treated specimen is partially linked to the rise in quartz content. As a pyroxene, aegirine can dissolve, releasing silica, which then contributes to the increased quartz content. We hypothesize that the increase in silica content in the solution could cause the formation of more kaolinite in the presence of Al trace phases [39,40]. Another key point is that XRD has a measurement error of ±3 wt.%, indicating that the observed changes in certain mineral abundances may not be real, but rather a result of instrument-related procedural inaccuracies [41].
The following reaction can occur with the injection of CO2 into water [4]:
C O 2 + H 2 O H + + H C O 3 2 H + + C O 3 2
According to Equation (1), the reaction between CO2 and water releases H+ cations, which make the solution more acidic. The acidity can cause mineral dissolutions (e.g., calcite). The decrease in the calcite content observed from the XRD results is attributed to the reaction described in Equation (2) [42], where calcite dissolves into Ca2+ cations and bicarbonate.
C a C O 3 + 6 H + 2 C a 2 + + 2 H C O 3
After the treatment, the pH values of water and the water + CO2 solutions were measured at 7.8 and 6, respectively. The lower pH confirms the acidic nature of the water + CO2 solution, which can provide the conditions for the dissolution of minerals. Other research on sandstone has also reported calcite dissolution following CO2 treatment [43,44].

3.1.2. Changes in Pore Structure from SEM Analysis

Figure 7a,b show the SEM images of the dry specimen and the specimen treated with water + CO2, respectively. Figure 7a reveals that calcite surrounds the quartz grains, indicating how calcite plays a role in cementing and binding quartz grains. The majority of the pores are less than 25 μm in diameter. Figure 7b shows no trace of calcite, which could have been dissolved during the water + CO2 treatment. Furthermore, compared to the dry specimen, water + CO2 treatment increases the number of pores, and the pores are smaller than 55 μm. Compared to the dry specimen, the grains are more segregated after the water + CO2 treatment. The reduction or dissolution of calcite content due to the CO2 treatment could weaken the cementation between grains and affect the pore structure and mechanical properties of the specimen.

3.2. Experimental Results from the Confinement Stage

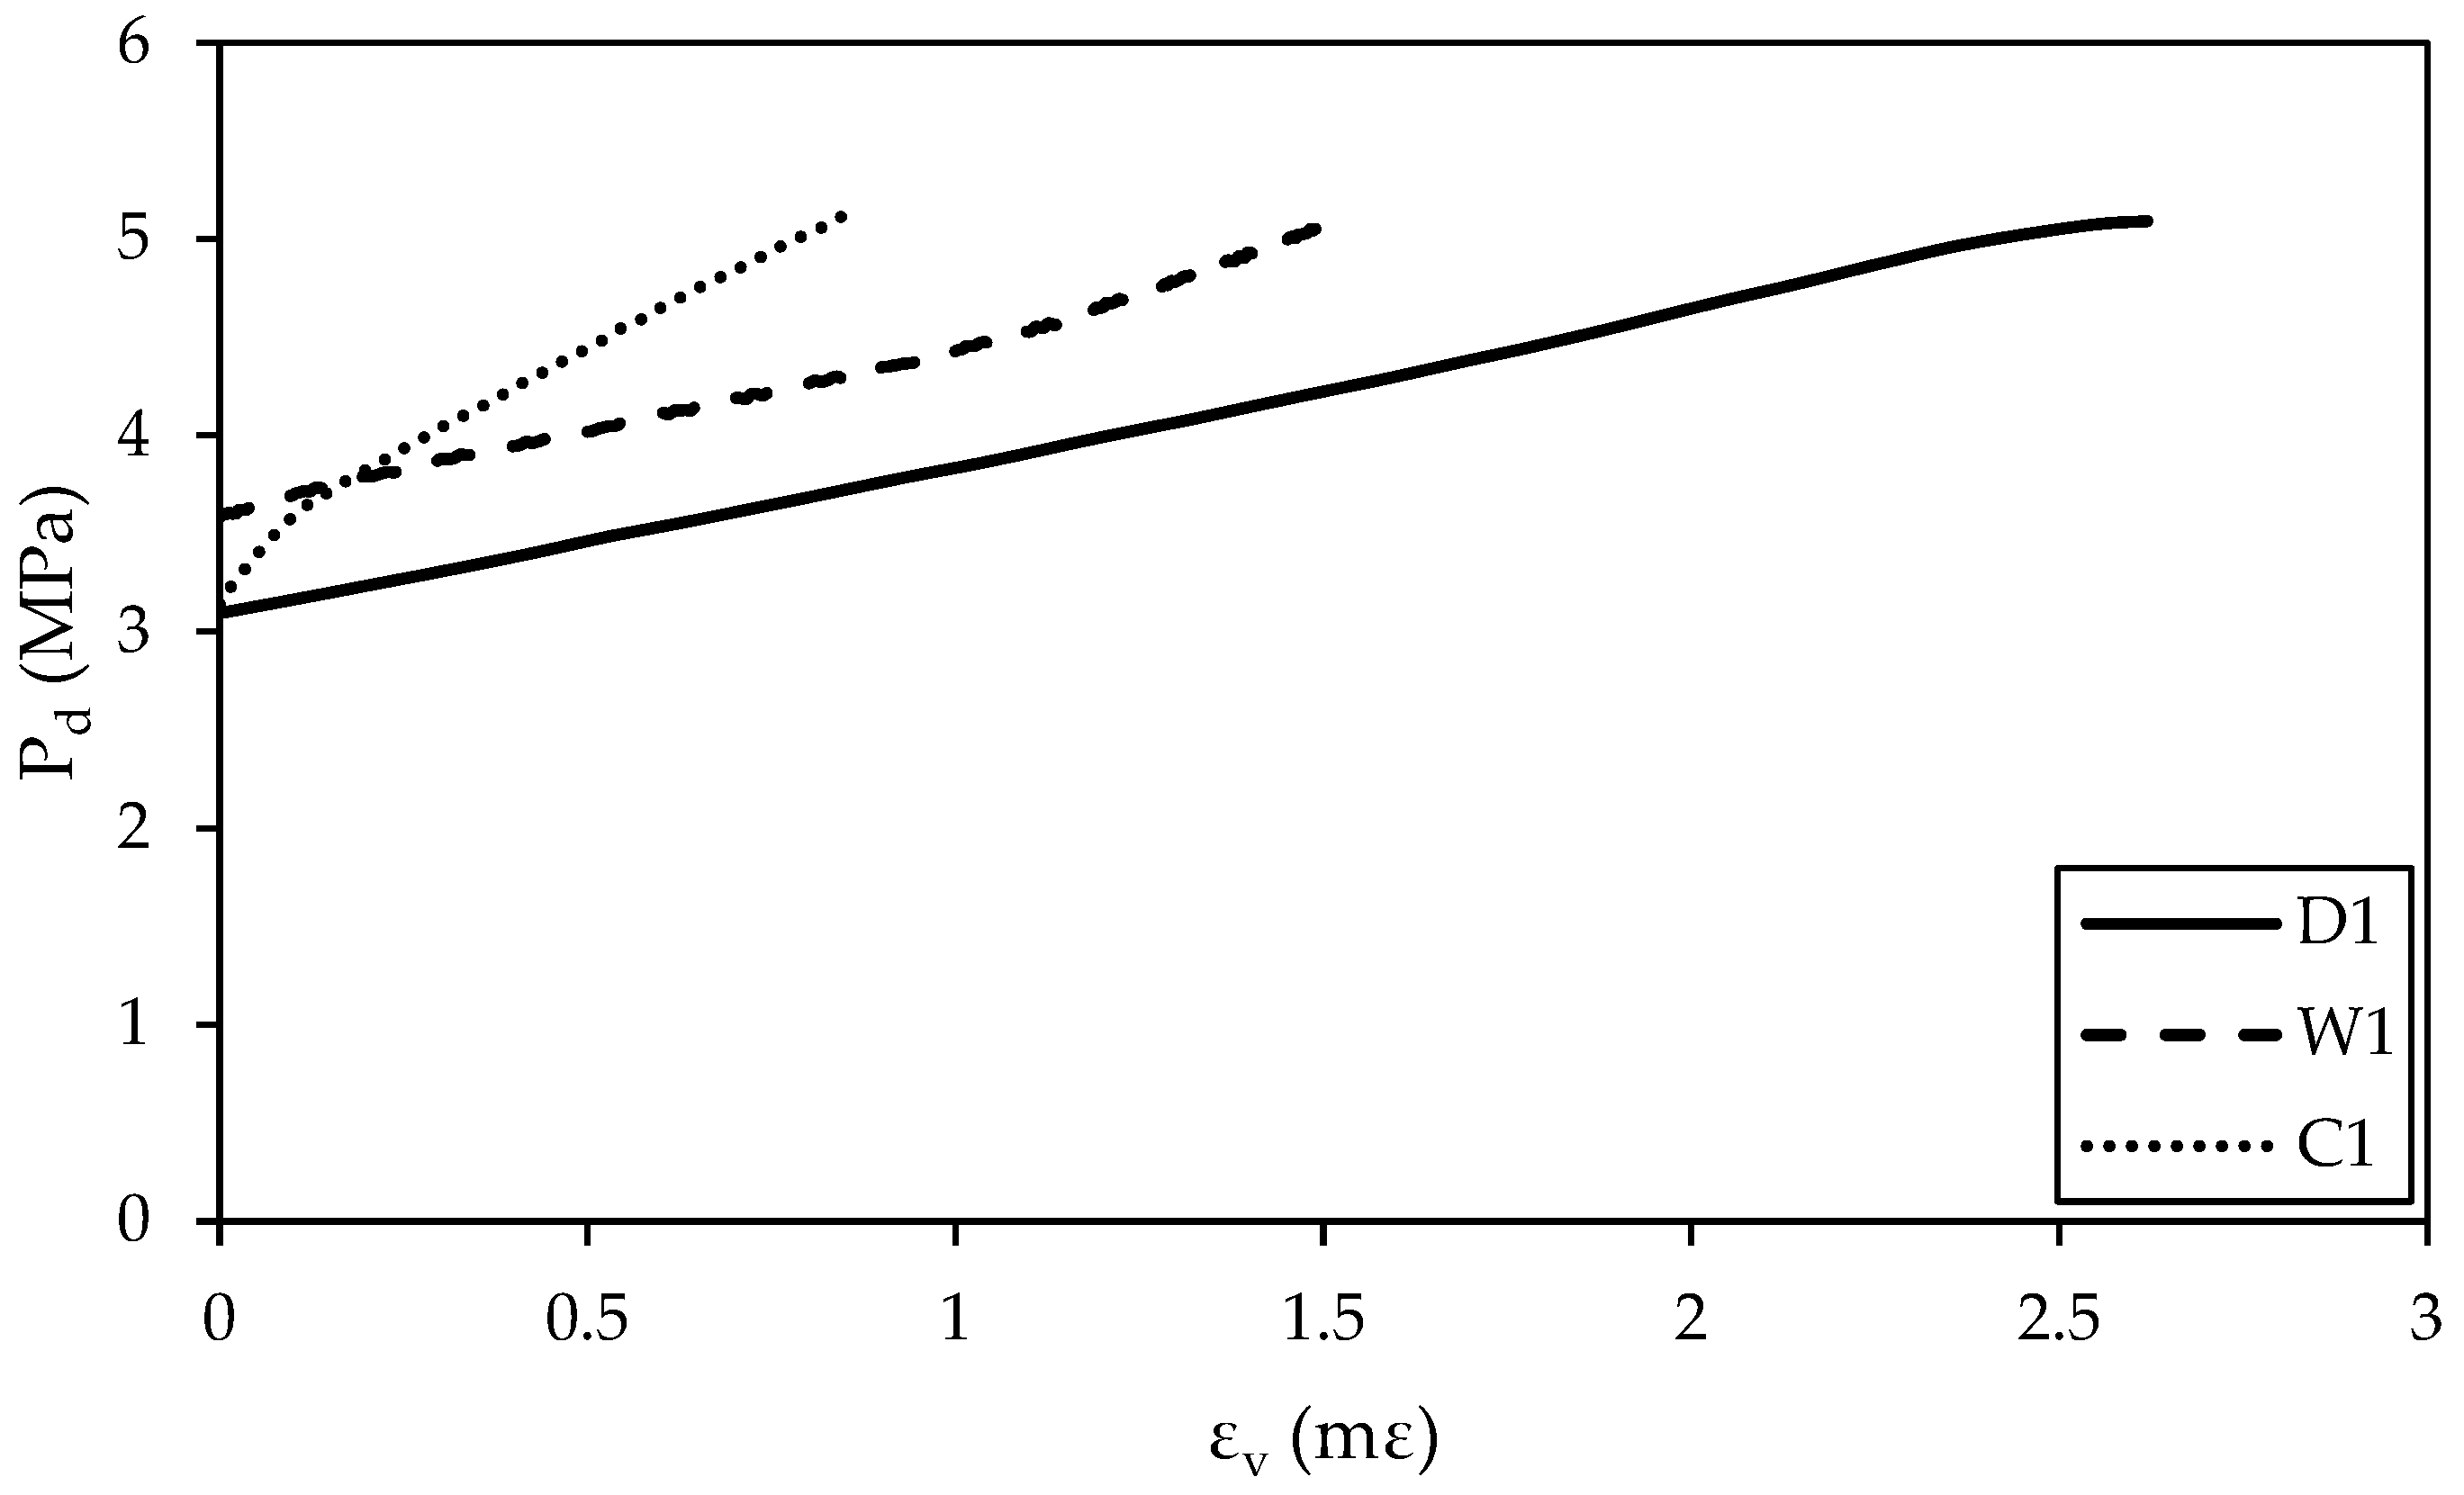
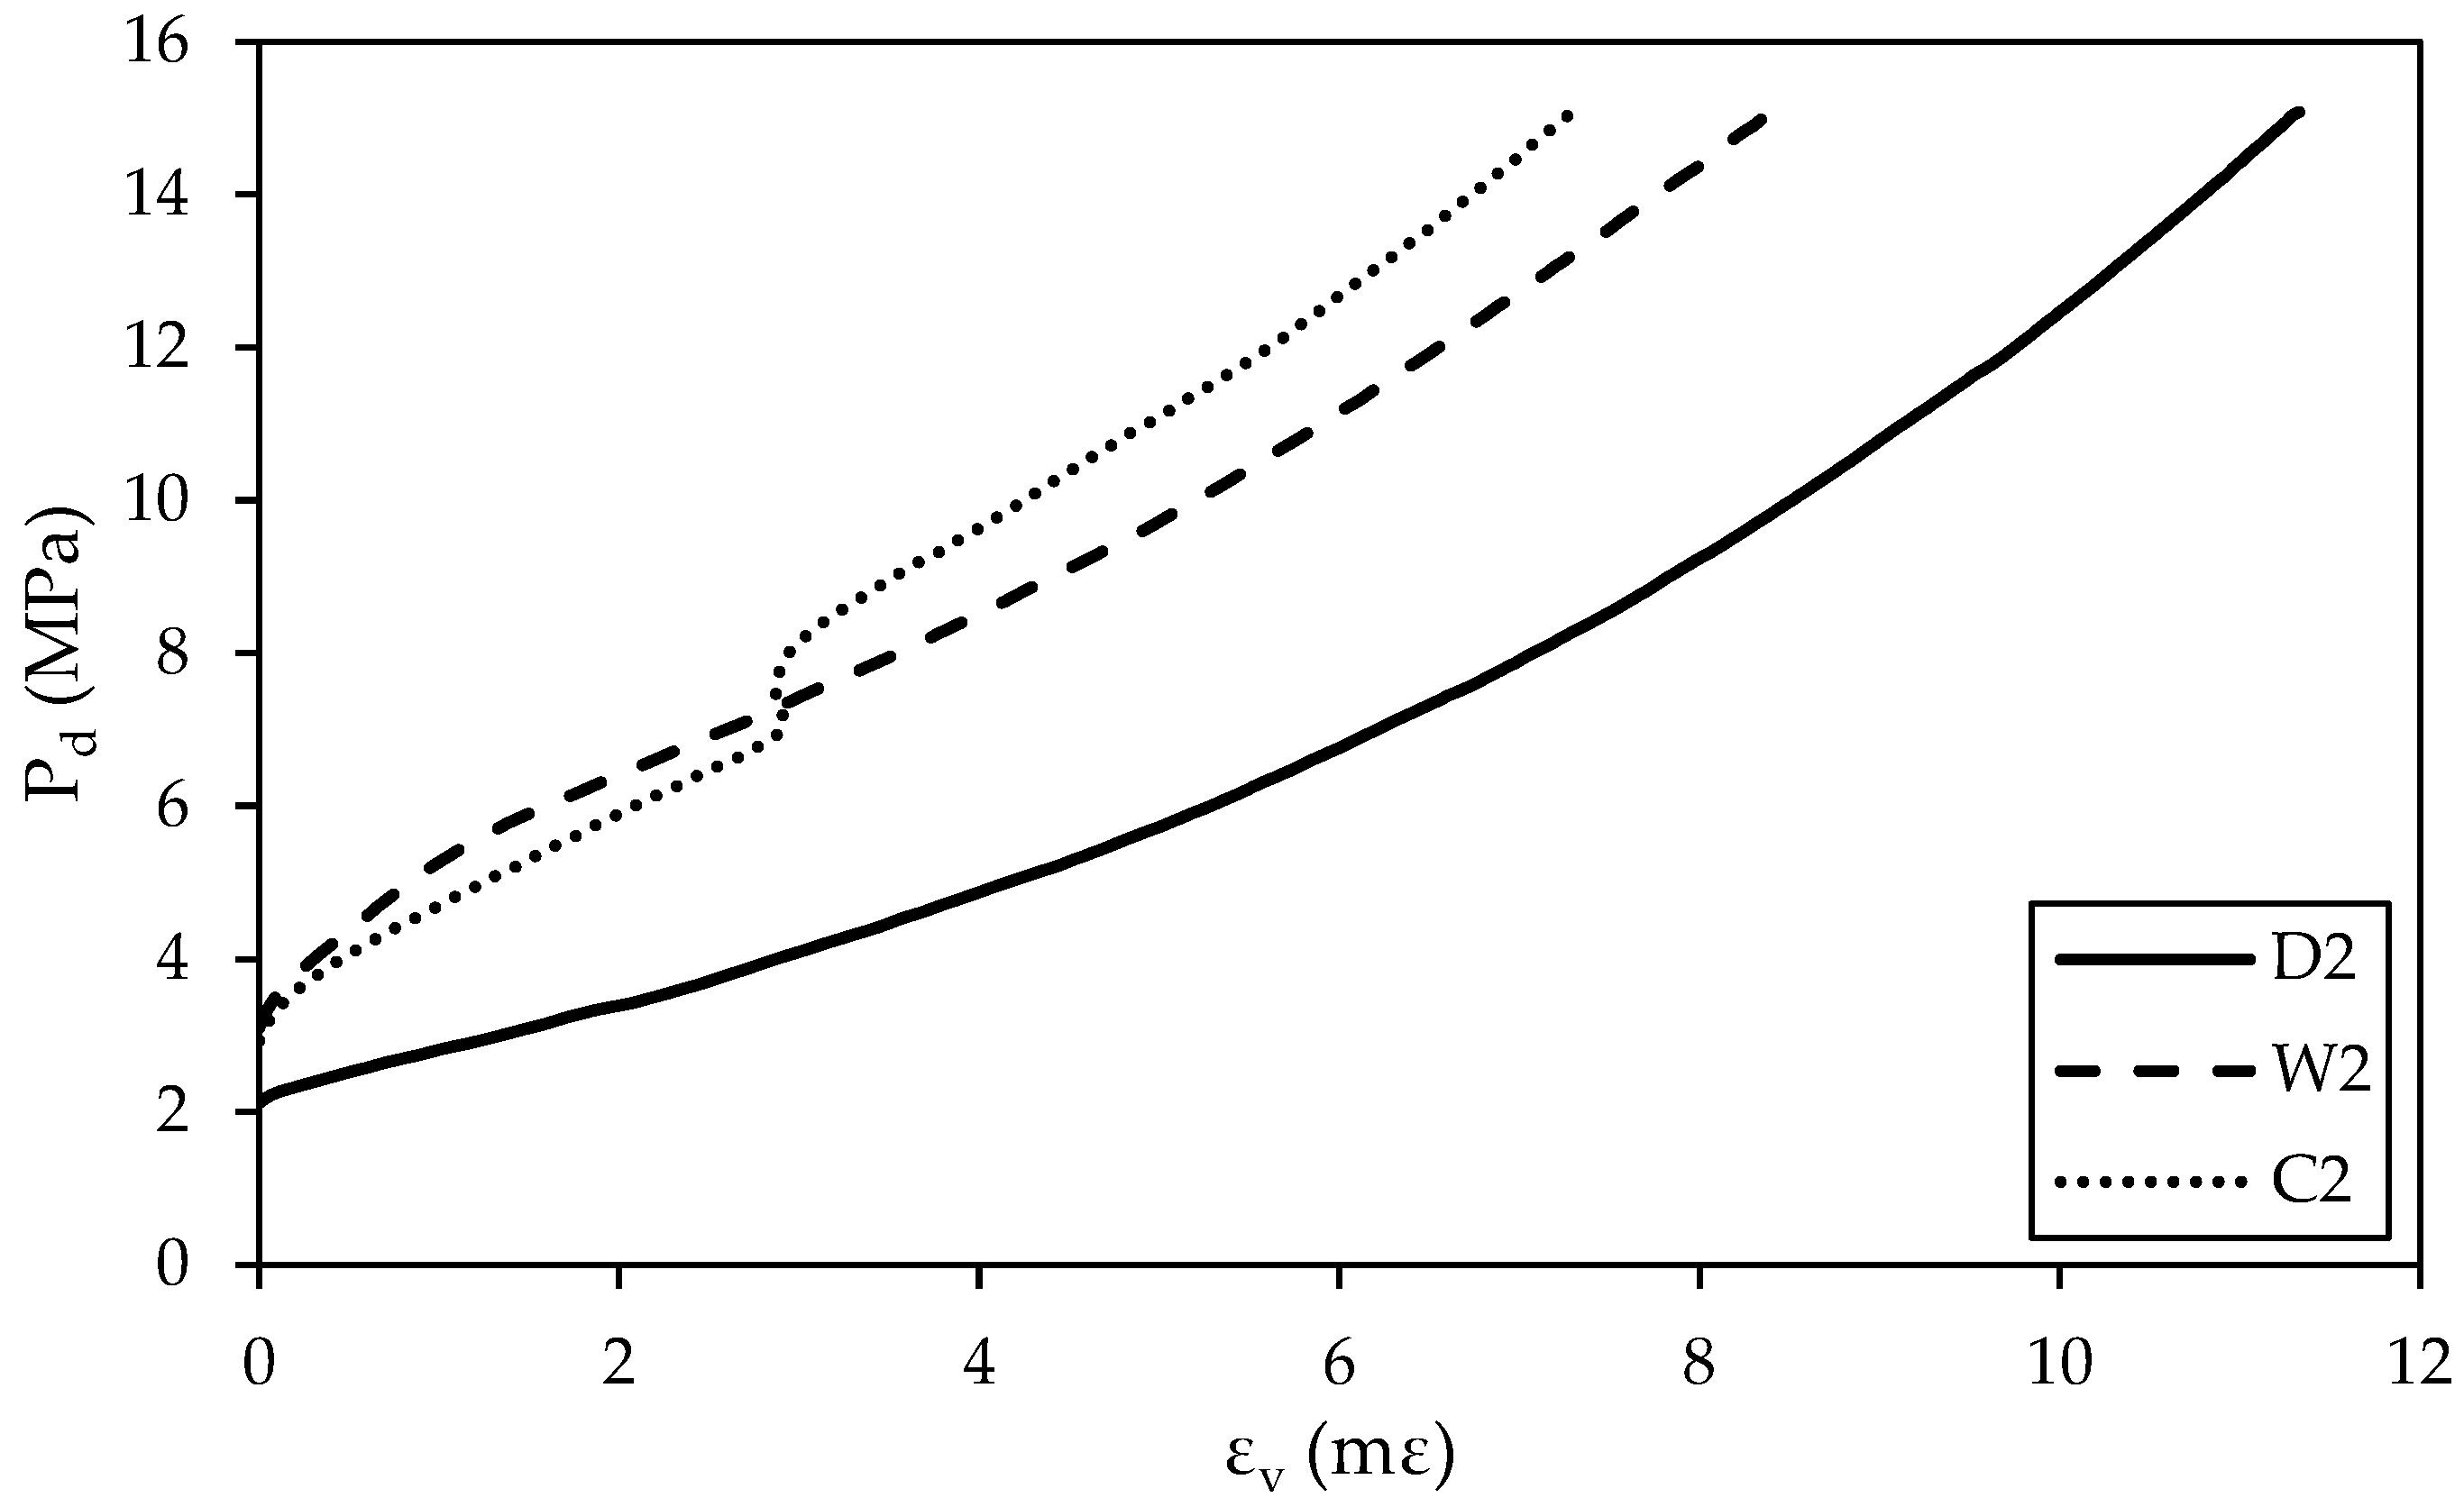
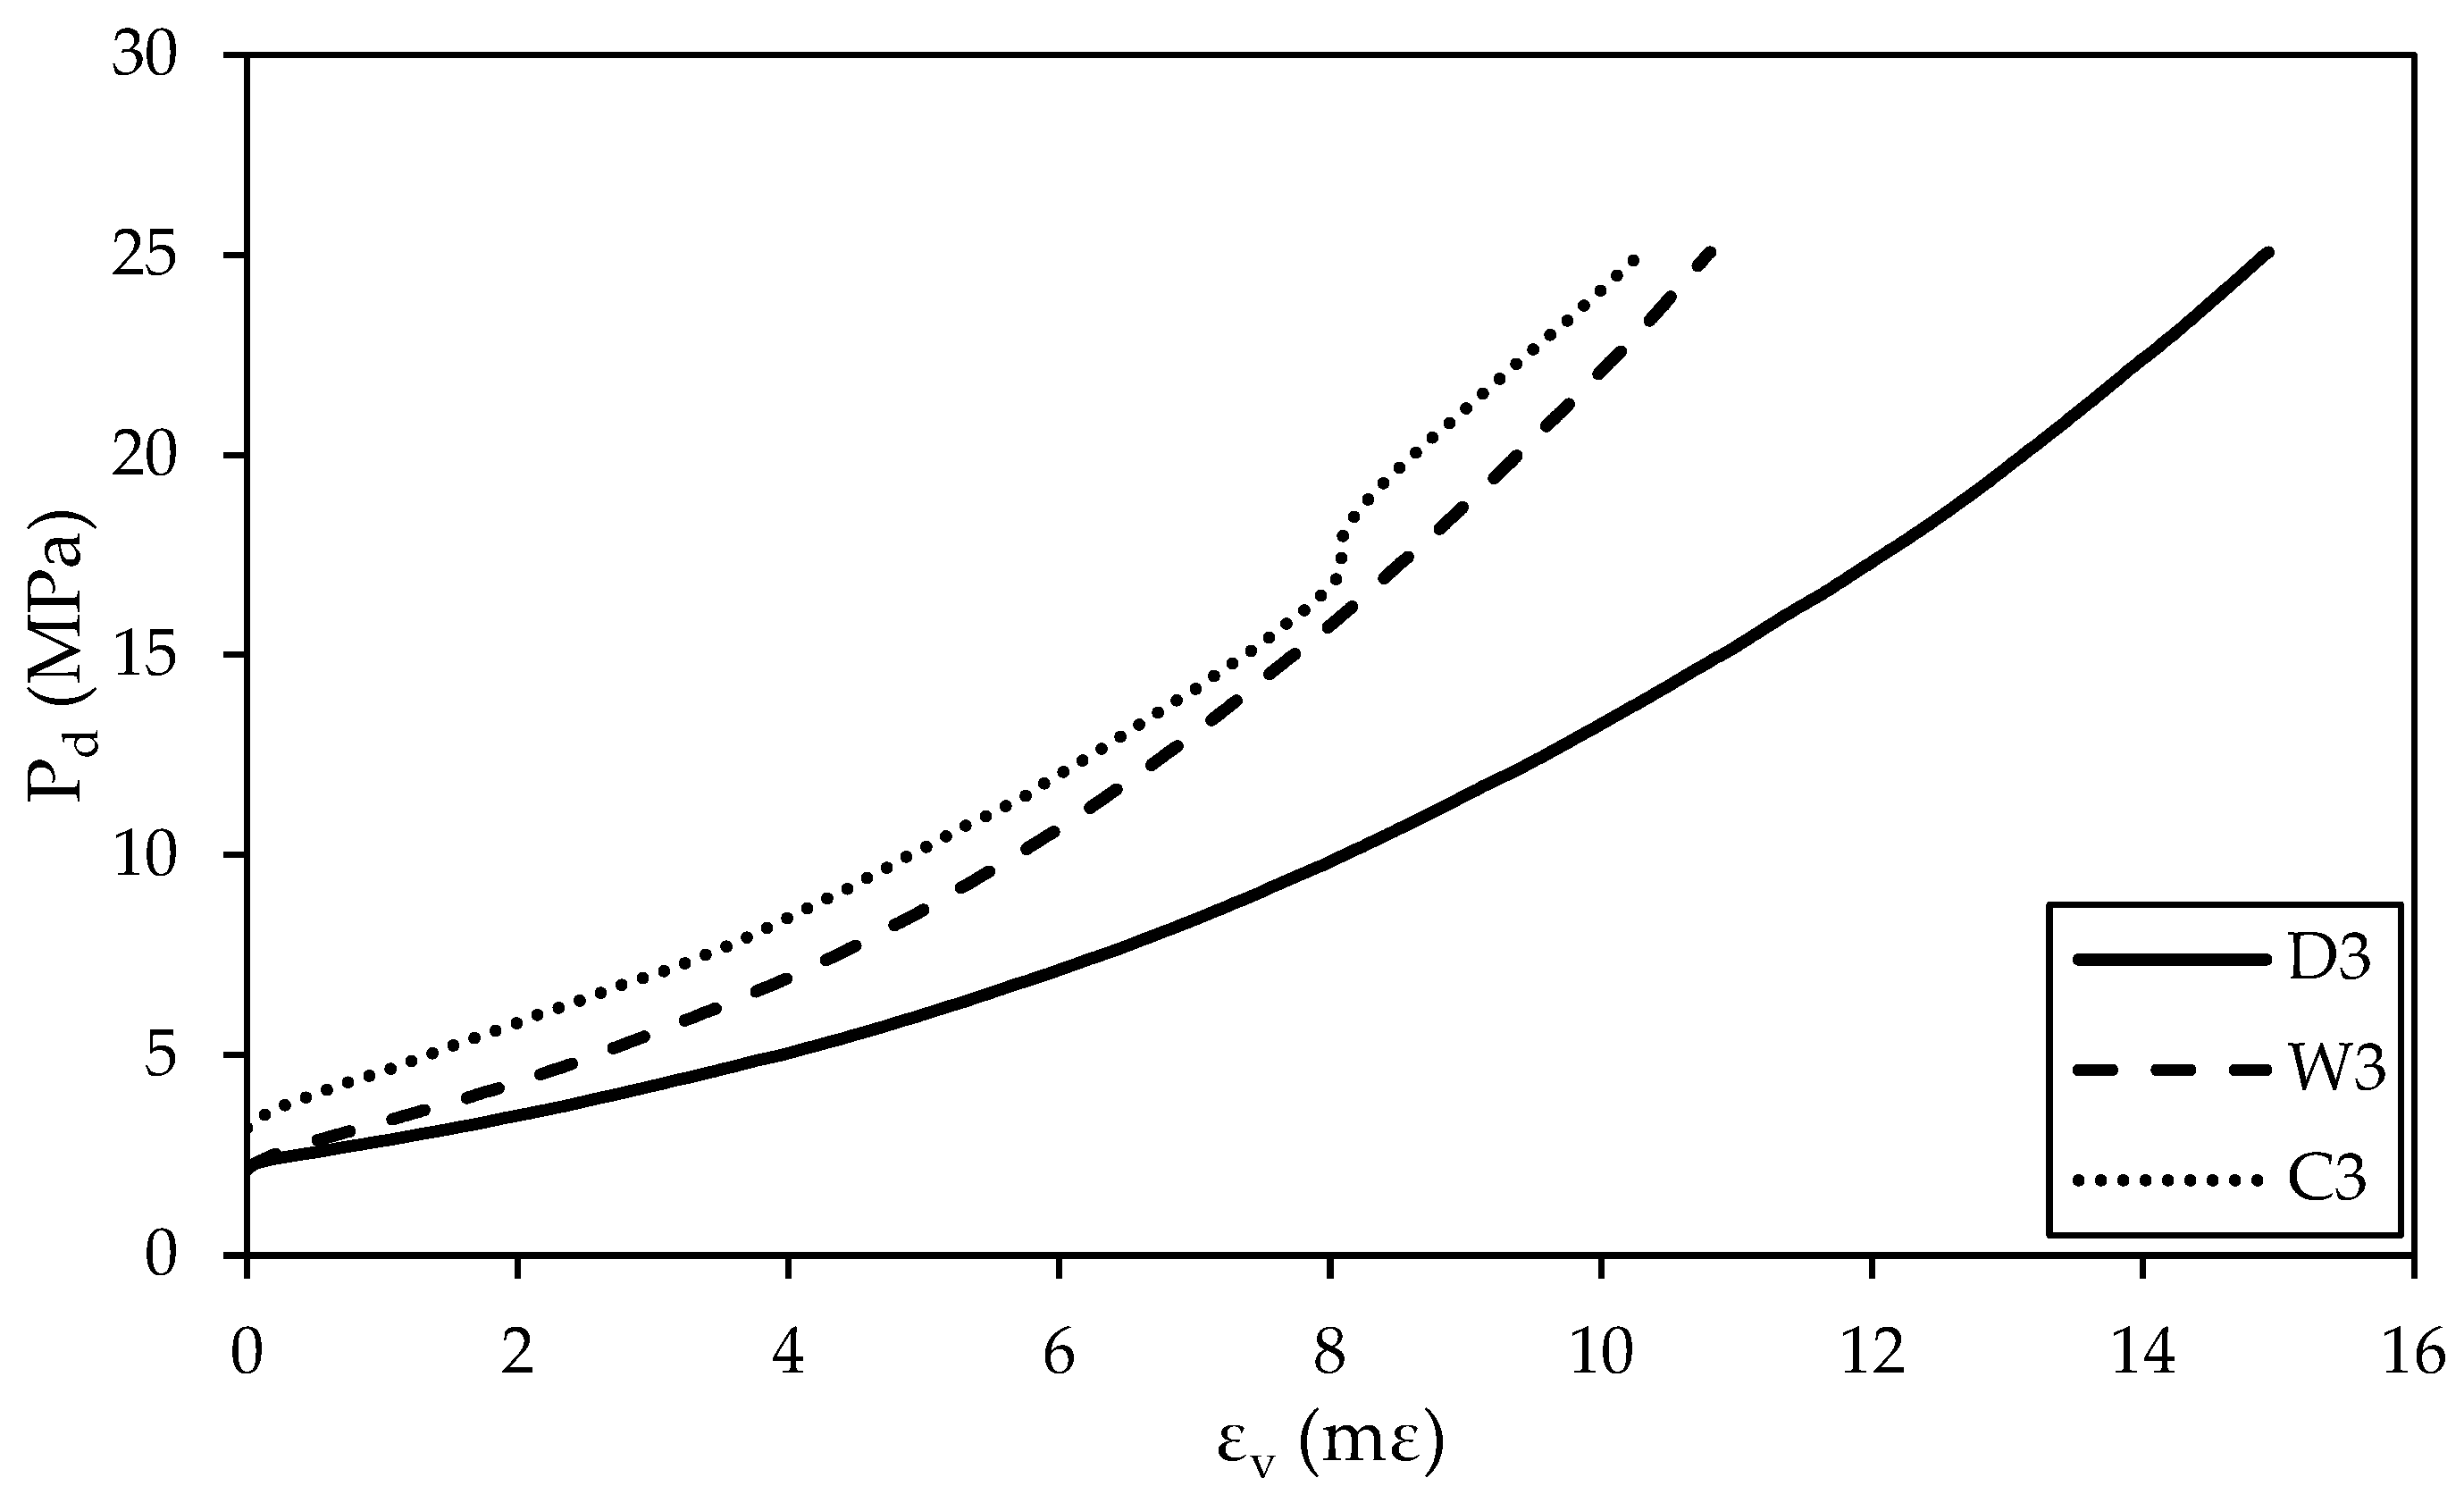
3.2.1. Volumetric Stress–Strain Behavior

The data presented in this section correspond to Figure 5, stage 3. Figure 8 displays how the volumetric strain (εv) varies with the effective confining pressure (Pd) in specimens D1, W1, and C1 with the three treatment conditions at the lowest target Pd of 5 MPa. The calculation of εv involved the axial strain (εa) and radial strain (εr) per Equation (3) [45,46]. Pd was obtained by subtracting Pp from Pc, as shown in Equation (4) [47]:
ε v = 2 ε r + ε a
P d = P c P p
Figure 8 shows that specimen C1 exhibits the lowest maximum εv of 0.87 mε, while specimen D1 shows the highest maximum εv of 2.62 mε. This indicates that CO2 treatment reduces the compressibility of specimen C1, with a 67% decrease in the maximum εv, compared to specimen D1. It is believed that mineral dissolution from CO2 treatment increased the specimen’s connected porosity and hence decreased the εv induced by applying Pc. Specimen W1 shows a slightly lower εv of 1.51 mε, about 42% lower than that of specimen D1. This further supports the hypothesis that the Pp built up inside specimen W1 provided greater resistance against Pc. However, treatment with only water cannot inflict as many mineral and structural changes as treatment with water + CO2. Hence, Pp cannot fully build up in specimen W1, and its maximum εv is higher than that of specimen C1.
Figure 9 illustrates the relationship between εv and Pd of specimens D2, W2, and C2 at a higher target Pd of 15 MPa. Similar to Figure 8, specimen D2 exhibits the highest maximum εv of 11.3 mε, while specimen C2 shows the lowest maximum εv of 7.31 mε with a 35% decrease in εv. Specimen W2 shows a 25% lower maximum εv of 8.44 mε than that of specimen D1 and 15% higher εv than that of specimen C2. It is believed that mineral dissolution from CO2 treatment increased the connected pores of specimen C2, facilitated Pp build-up, and exhibited more resistance to εv from Pc.
Figure 10 shows the relationship between εv and Pd of specimens D3, W3, and C3 with the three treatment conditions at the highest target Pd of 25 MPa. A similar trend between maximum εv and treatment condition was observed. Specimen D3 exhibits the highest maximum εv of 14.92 mε, and specimen C3 exhibits the lowest maximum εv of 10.3 mε, 31% lower than that of specimen D3. Specimen W3 shows a maximum εv of 10.8 mε, which is 5% higher than that of specimen C3 and 28% lower than that of specimen D3.
A summary of the maximum εv values is presented in Table 3. When Pd is increased from 5 MPa to 25 MPa, the maximum εv 2.62 mε in specimen D1 rises to 14.92 mε in specimen D3 (or 469%). Likewise, raising the Pd from 5 to 25 MPa elevates the maximum εv 1.51 mε in specimen W1 to 10.8 mε in specimen W3 (or 615%) and the maximum εv 0.87 mε in specimen C1 to 10.32 mε in specimen C3 (or 1086%). It is believed that the mineral dissolution from CO2 treatment induces a higher sensitivity of the change in maximum εv to Pd. The percent reduction in the maximum εv values resulting from dry treatment to CO2 treatment at three Pd values of 5, 15, and 25 MPa are 67%, 35%, and 31%, respectively. This suggests that higher Pd may have reduced the connected pores and minimized the effect of mineral dissolution on pores that govern the maximum εv. Comparing the percentage increases in the maximum εv of specimens with different treatment conditions reveals three trends: (1) for all the treatment conditions, an increase in Pd from 5 to 15 MPa yields a much higher increase in the maximum εv than those for Pd increasing from 15 to 25 MPa; (2) for both increments in Pd (from 5 to 15 MPa and from 15 to 25 MPa), specimens treated with water + CO2 show a higher reduction in the maximum εv than those of dry and water-saturated specimens; and (3) the percent reduction in the maximum εv values of specimens under three treatment conditions decreases with the increase in Pd. In addition, higher Pd increases the nonlinearity of the εv and Pd behavior of all specimens. Figure 8 shows a more linear behavior under a target Pd of 5 MPa. However, the εv and Pd behavior of all specimens becomes more nonlinear at higher target Pd values, as illustrated in Figure 9 and Figure 10. Under the higher effective confining pressures, because of the larger stress range, pore closure and microcrack development within the specimens are likely the cause of their nonlinear εv and Pd behavior.

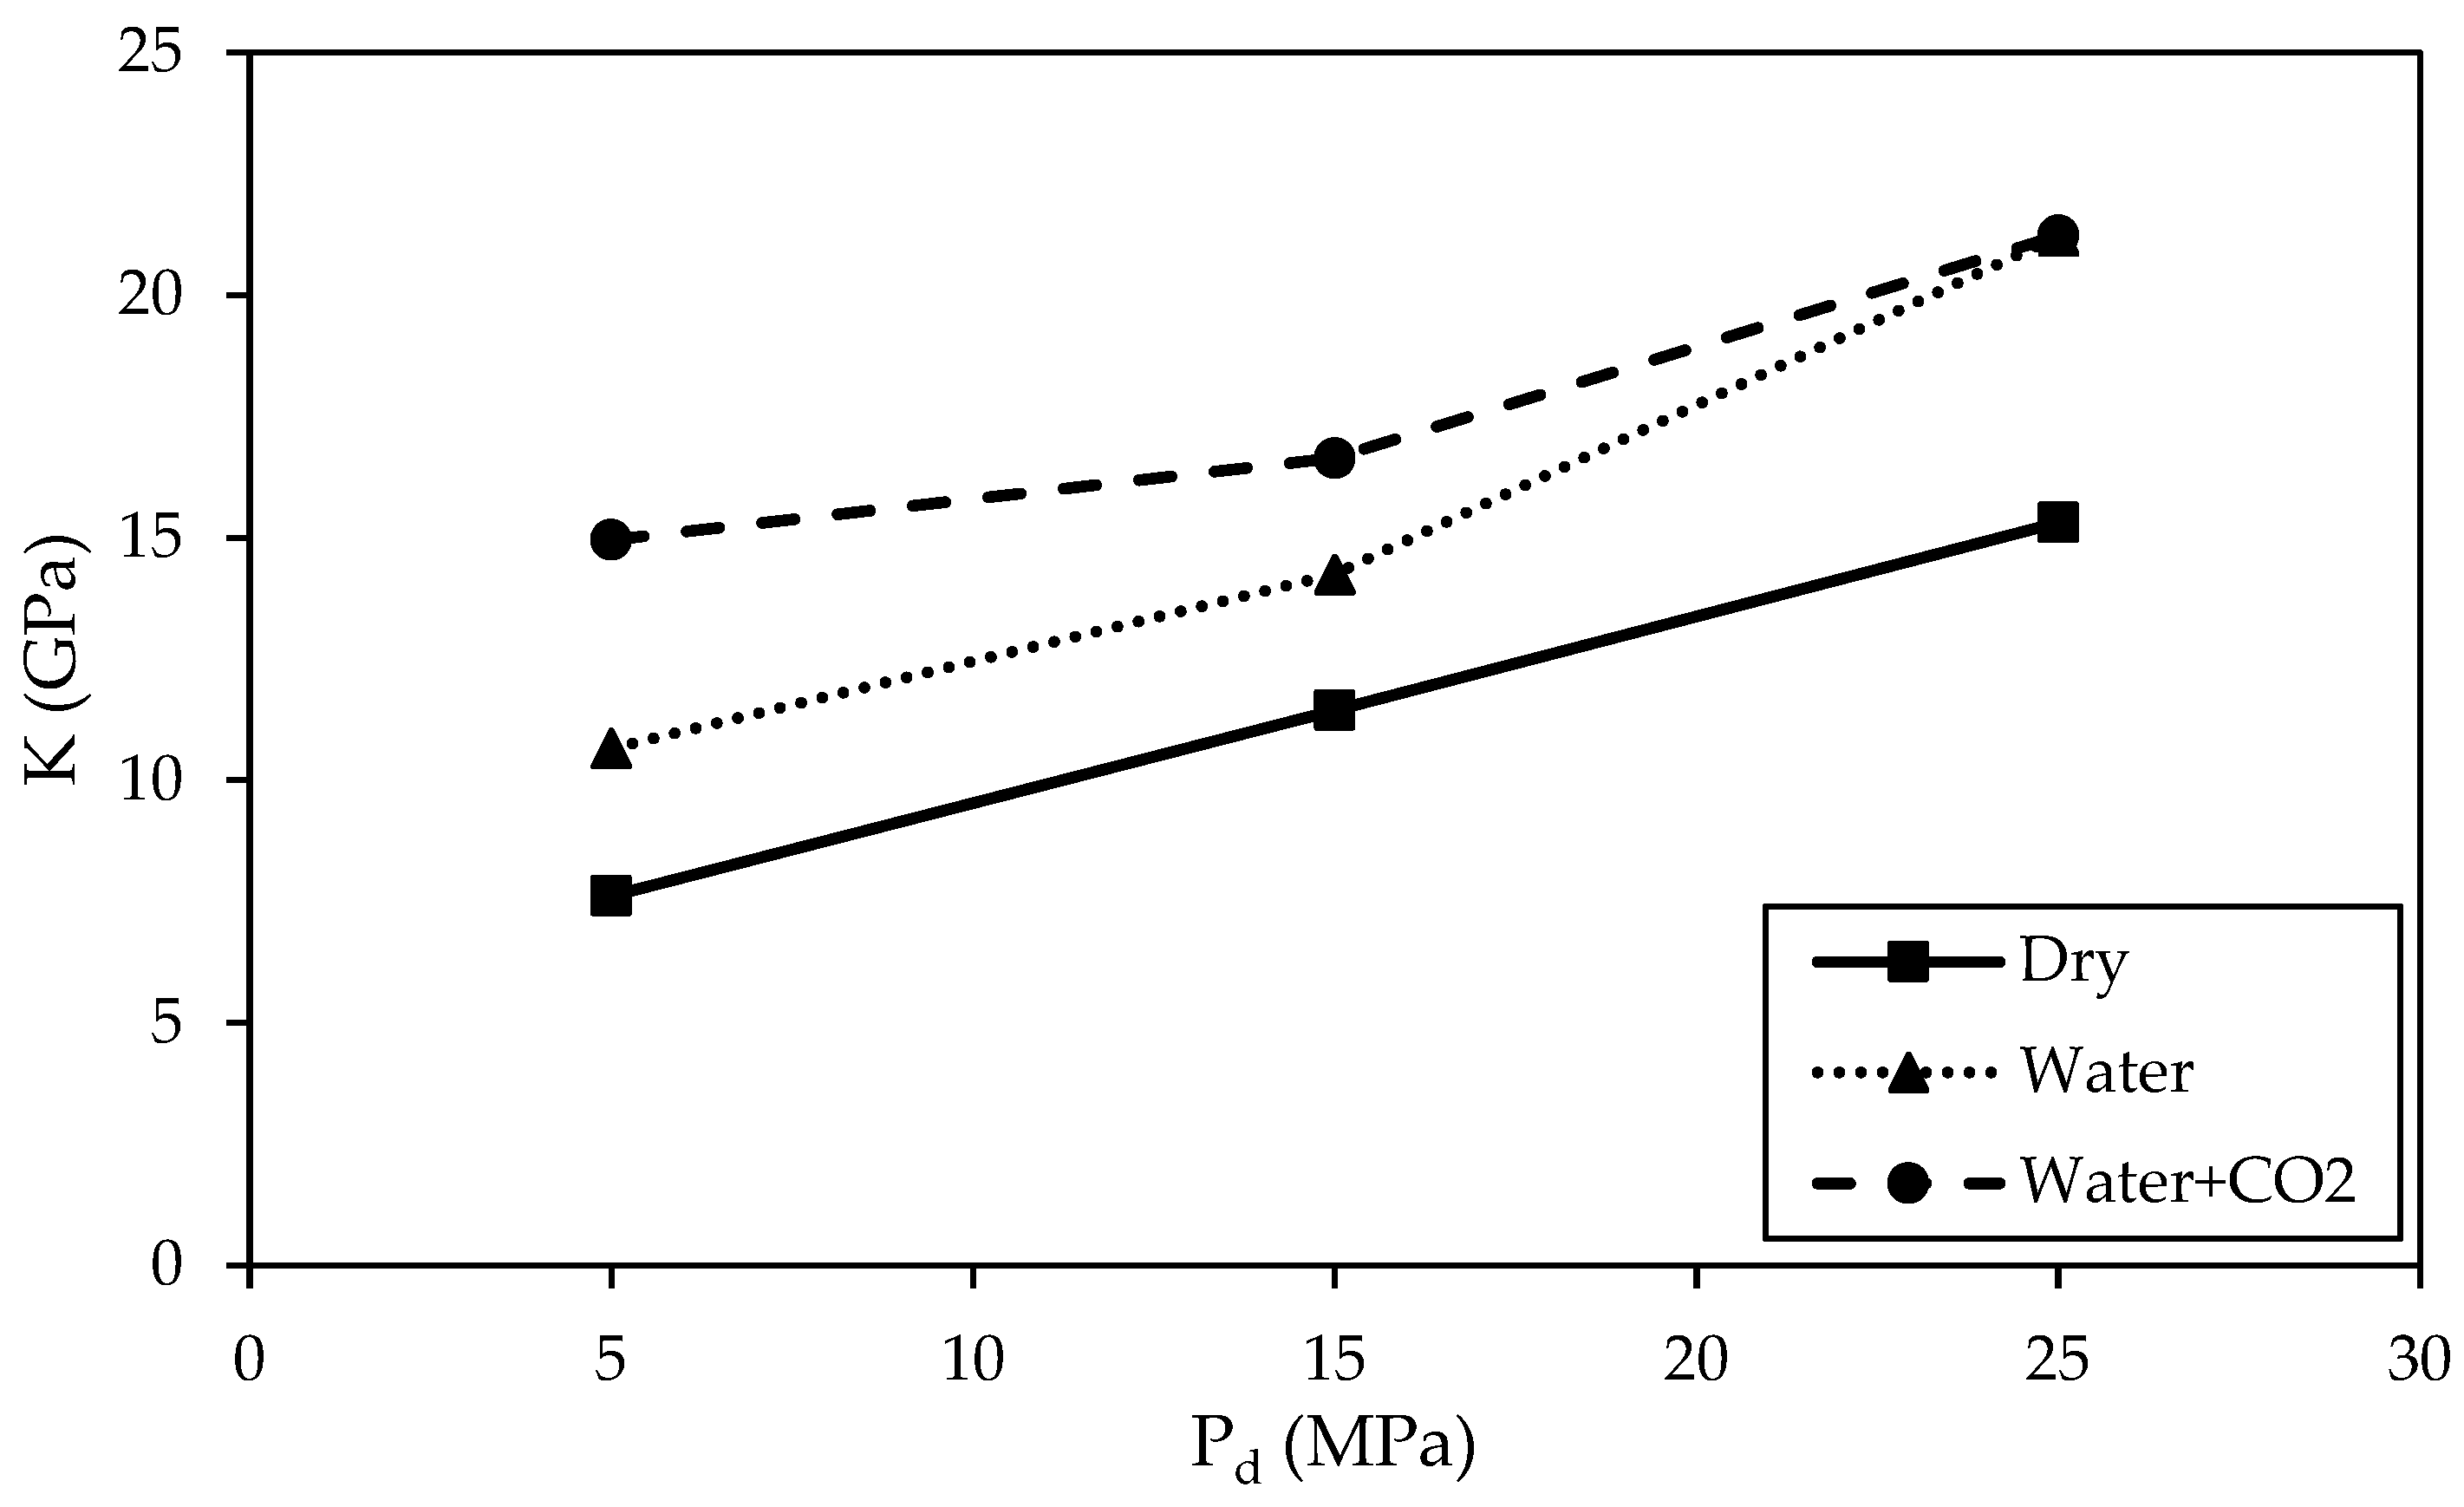
3.2.2. Comparison of Bulk Modulus

The bulk modulus (K), which describes the volumetric changes of specimens during the confining stage, can be computed using Equation (5) [48]:
K = P d Δ ε v
Here, ΔPd denotes Pd variations, and Δεv represents εv changes. The final values of Pd and εv of each specimen were used to calculate K values. Table 3 summarizes the K values of all the specimens, and Figure 11 illustrates the rise in K with increasing Pd across three treatment conditions throughout the confinement process. When Pd is increased from 5 MPa to 15 MPa, K values increase by 50% in dry conditions, 33% in water conditions, and 11% in water + CO2 conditions. Raising Pd from 15 to 25 MPa further enhances the K values of the specimens by 34%, 49%, and 28% under dry, water, and water + CO2 treatment conditions, respectively. The comparison shows that the K values of specimens treated with water + CO2 are less sensitive to the changes in Pd. In addition, the increase in Pd from 15 to 25 MPa exhibits a greater effect on the K values than those due to the increase in Pd from 5 to 15 MPa. The K values of specimens treated with water + CO2 are generally higher than those of dry and water-treated specimens. This agrees with the results shown in Figure 8, Figure 9 and Figure 10 with specimens treated with water + CO2, showing the lowest maximum εv at the highest Pd. At Pd = 5 MPa, the specimen treated with water + CO2 has a K = 15 GPa, about 40% and 97% higher than those of the dry and water-treated specimens, respectively. At Pd = 15 MPa, the differences in K values reduce where the specimen treated with water + CO2 has a K = 16.6 GPa, 17% and 46% higher than those of the dry and water-treated specimens, respectively. At Pd = 25 MPa, the K values of the two specimens treated with water and water + CO2 are about 21 GPa, 39% higher than that of the dry specimen. The difference in K values between water and water + CO2 specimens diminishes at a higher Pd, and the Pd is the primary factor determining the volumetric behavior of the specimens. This is in contrast with a previous study on Pecos sandstone, where a 22.7–26.8% decrease in bulk modulus was reported after brine + CO2 injection (7.5–21.5 MPa, 22 °C, 62 h) [24].

3.3. Experimental Results from Axial Loading Stage

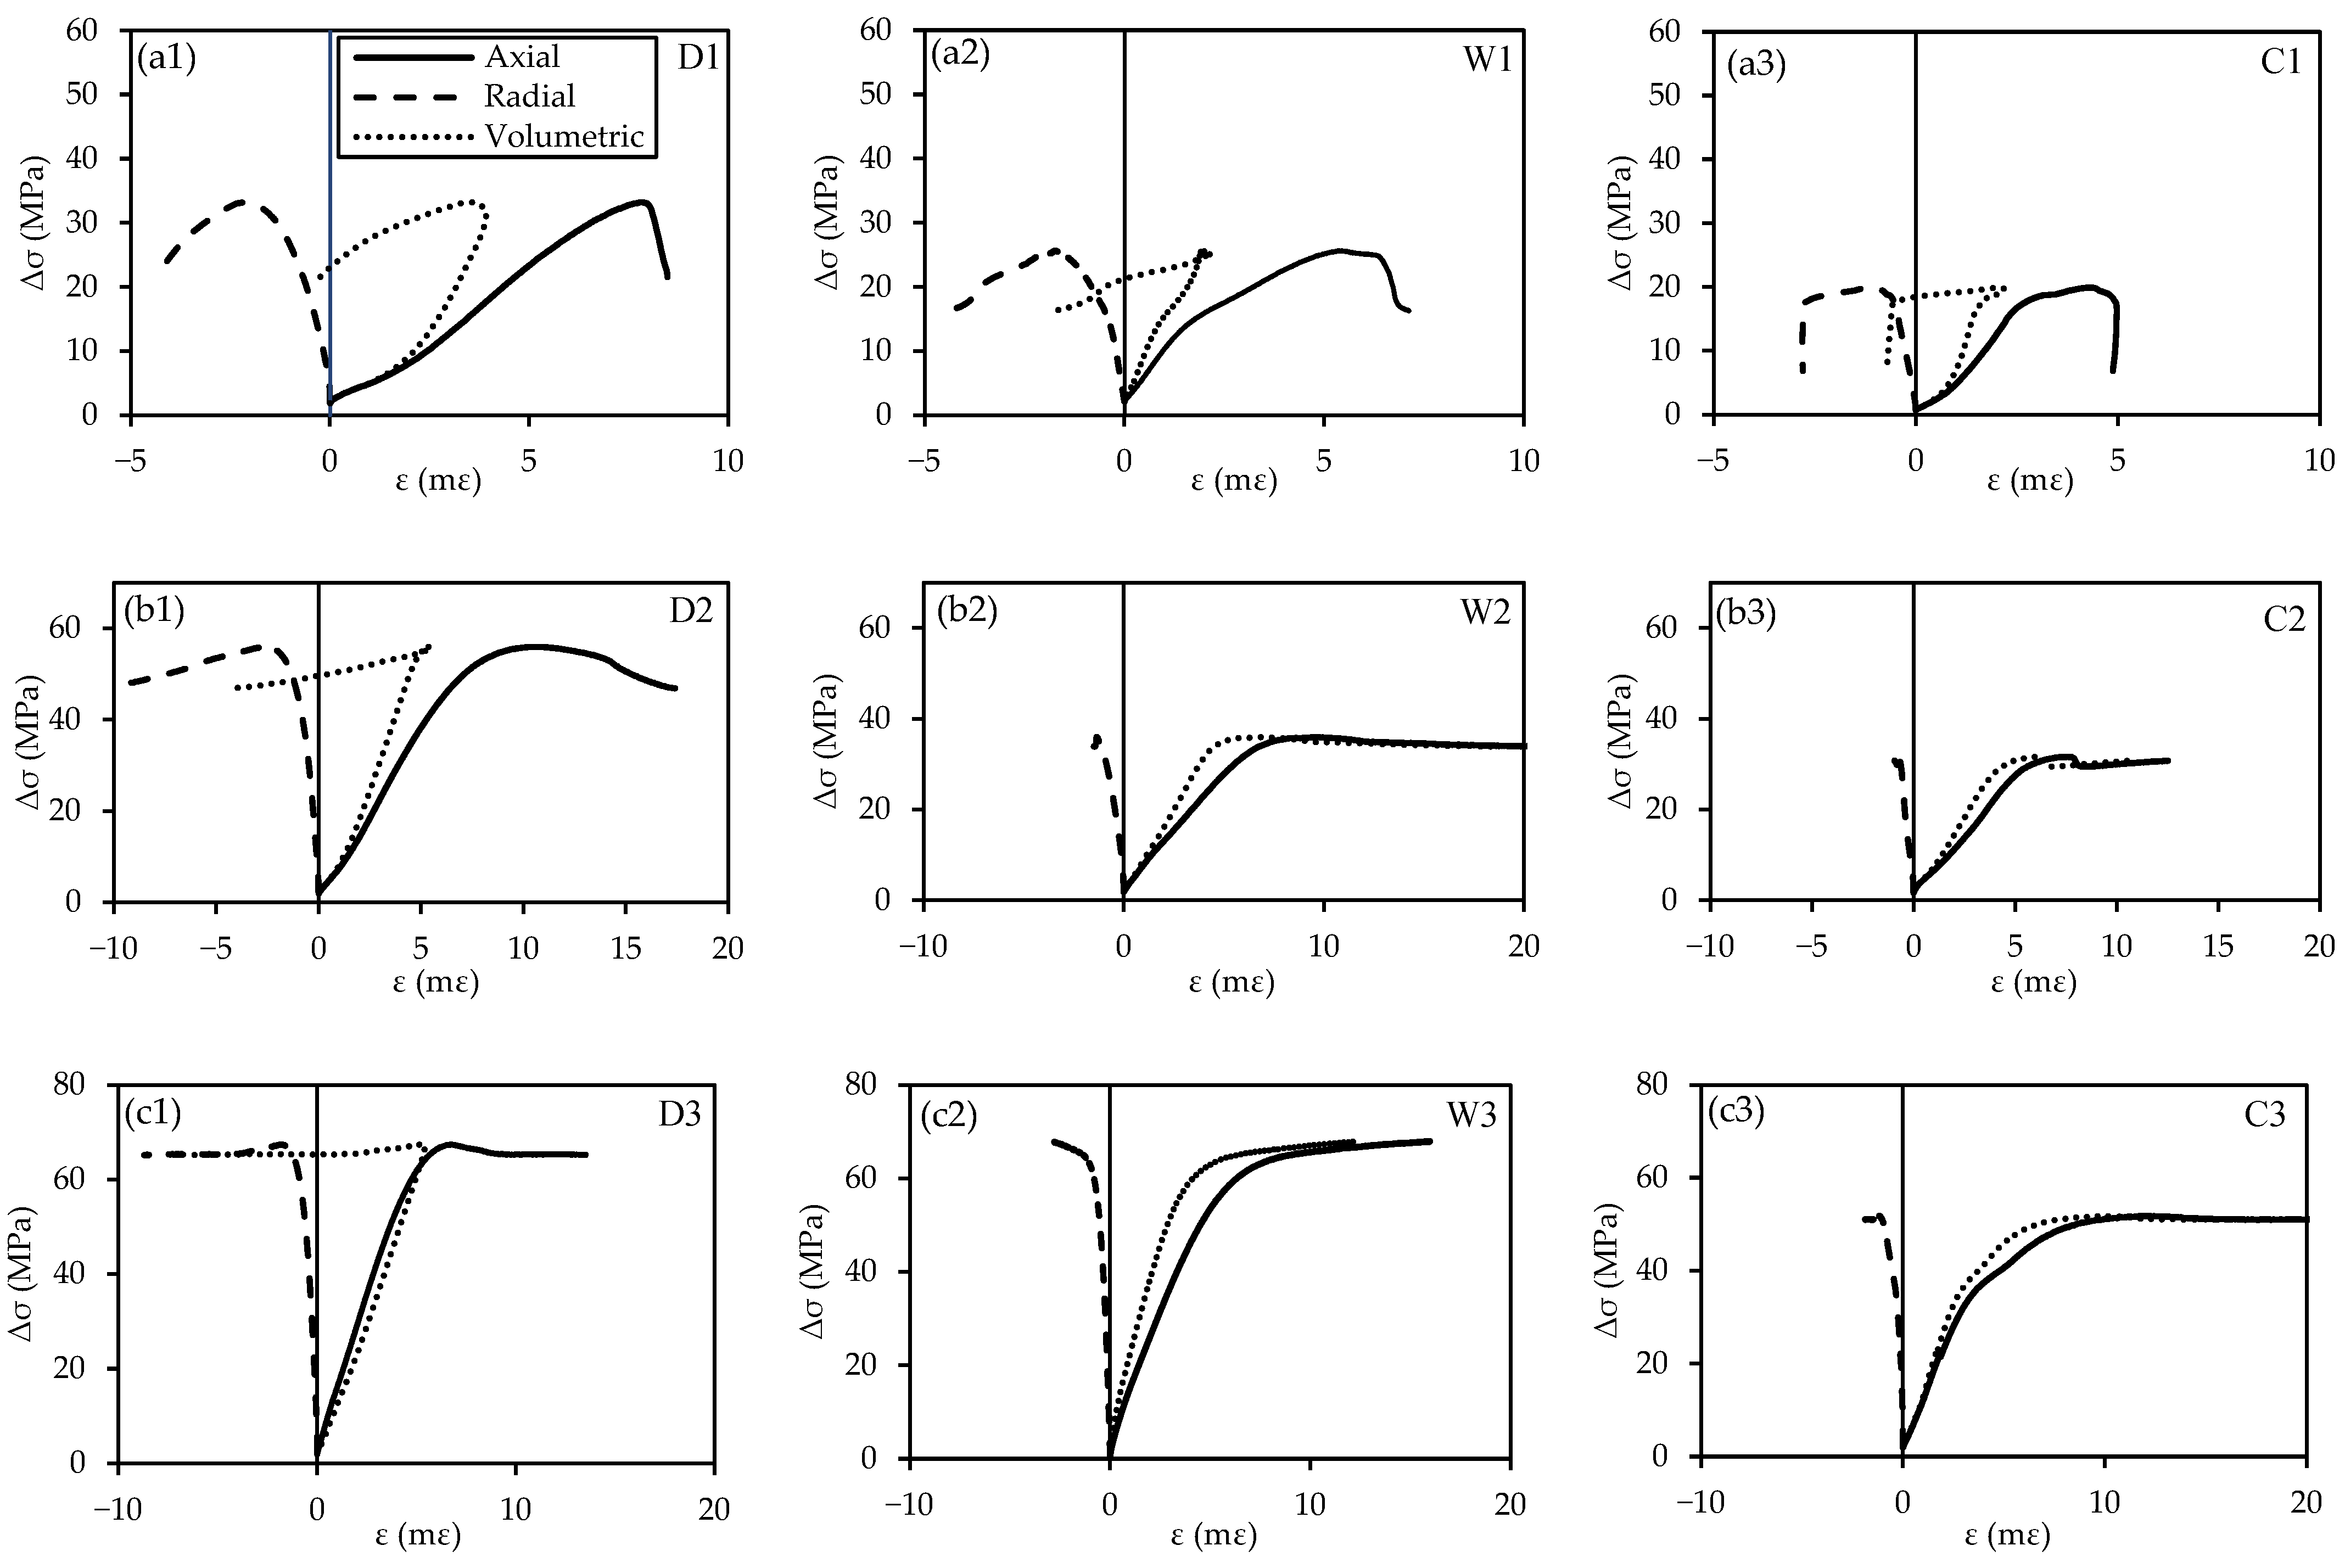
3.3.1. Axial Stress–Strain Behavior

Table 3 summarizes the peak deviatoric stress values, and Figure 12a1–a3 shows the plots of the deviatoric stress (Δσ) versus the axial (εa), radial (εr), and volumetric (εv) strains from the TC tests under the lowest Pd = 5 MPa. Specimen D1 exhibits the highest stress–strain response (33 MPa), followed by specimens W1 and C1. The maximum Δσ values or peak compressive strength of specimens W1 and C1 are 23% and 40% lower than that of specimen D1. Furthermore, the maximum Δσ value of specimen C1 (20 MPa) is 24% lower than that of specimen W1. Specimen D1 fails at a higher εa of 7.8 mε than 5.4 mε of specimen W1 and 4.8 mε of specimen C1. All specimens show a comparable brittle post-failure behavior, characterized by a sharp decline in axial stress.
Figure 12b1–b3 shows the Δσ-εarv results for the tests performed under a higher Pd = 15 MPa. Specimen D2 similarly exhibits the highest stress–strain responses or peak compressive strength at about 56 MPa, followed by 36 MPa of specimen W2 and 32 MPa of specimen C2. The peak strength of specimen C2 is 43% lower than that of specimen D2 and 12% lower than that of specimen W2. The εa values corresponding to the peak strength are quite comparable among all three specimens, about 8 mε for W2 and C2 and about 10.7 mε for D2. Increasing the Pd from 5 MPa to 15 MPa causes all three specimens to fail in a more ductile behavior with no sudden drop in Δσ after failure, as seen in Figure 12a1–a3. Specimens W2 and C2 exhibit a more ductile behavior with a lower post-failure slope than that of specimen D2. The comparison suggests that CO2 treatment reduces the compressive strength but does not have much effect on the post-failure behavior.
Figure 12c1–c3 shows the Δσ-εarv results from the TC tests under the highest Pd = 25 MPa. Specimen D3 shows the highest peak strength of about 67 MPa, followed by about 60 MPa of specimen W3 and 52 MPa of specimen C3. The Δσ-εar results of specimens D3 and W3 show a 10% difference in the peak strength. Conversely, the CO2 treatment impact remains significant under a relatively high Pd, and the peak compressive strength of specimen C3 reduces by about 23% compared to specimen D3. Comparing the slope of post-failure stages, specimens W3 and C3 seem to exhibit a more ductile behavior than specimen D3.
Specimens treated with water + CO2 exhibit the minimum peak strengths at all Pd levels. This lowest compressive strength can be related to the significant reduction or almost dissolution of calcite content resulting from CO2 treatment, as summarized in Table 2. The calcite dissolution causes weaker cementation between quartz particles, makes crack propagation easier [49], and hence reduces the resistance against shearing during the TC tests. Xujiahe sandstone samples showed decreased compressive strength values by 23.01%, 27.65%, and 15.37% under the effective confining pressures of 10, 30, and 50 MPa, respectively. The comparison suggests that at higher effective confining stress, the effect of the saturation fluid diminishes [50].

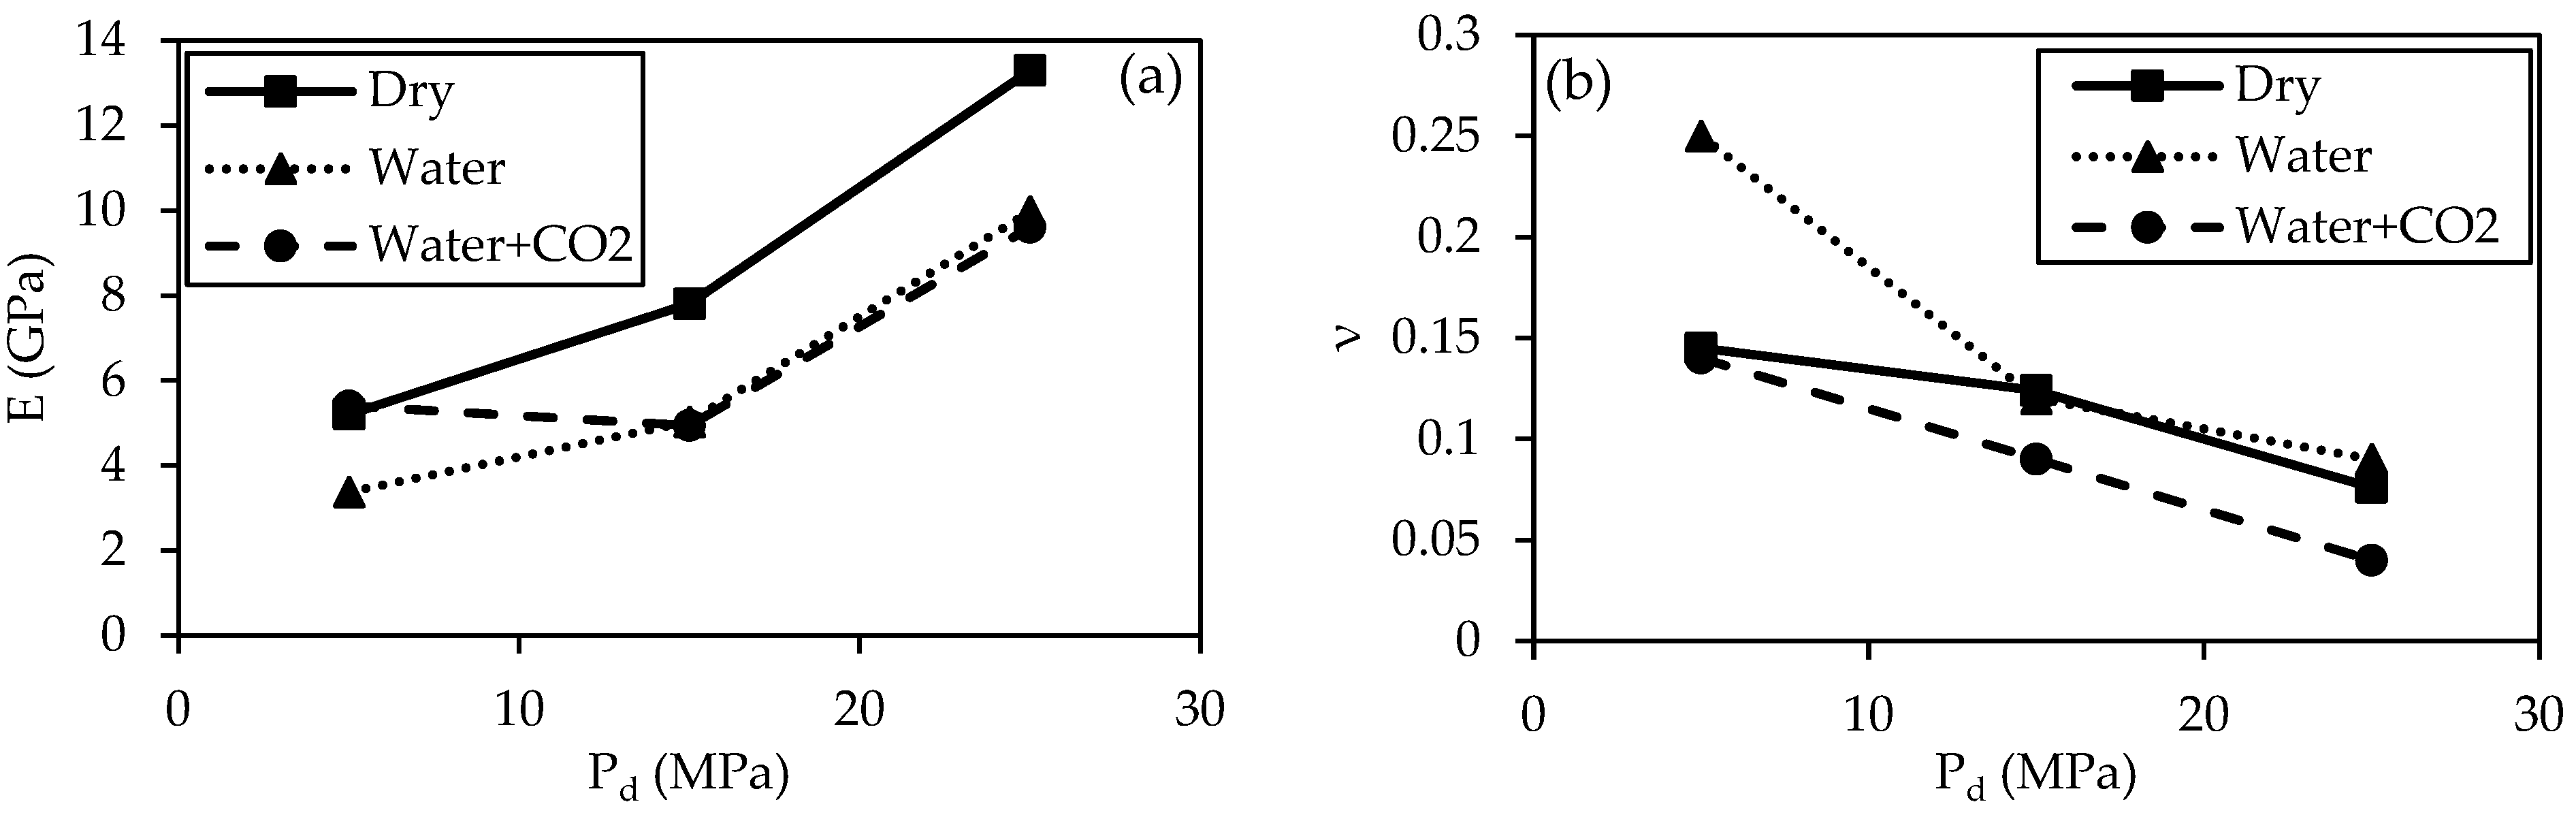
3.3.2. Elastic Properties

Figure 13a,b depict how the elastic modulus (E) and Poisson’s ratio (ν) vary with Pd. In individual stress–strain plots (Figure 12a1–c3), a linear portion was determined by fitting a line to each graph, and E was calculated from the linear segment’s slope. The ν was computed as the ratio of εr to εa within the same linear segment. E and ν values for all specimens are summarized in Table 3.
Figure 13a shows that E generally increases with the increase in Pd. Dry specimens have the highest E values, while those treated with water and water + CO2 have comparable E values, except at Pd = 5 MPa. At Pd = 5 MPa, specimens D1 and C1 exhibit E = 5.4 GPa, and specimen W1 has the lowest E value of 3.4 GPa. At Pd = 15 MPa, specimens W2 and C2 show the same E of 5 GPa, about 36% lower than the highest E = 7.8 GPa of specimen D2. Similarly, at Pd = 25 MPa, specimens W3 and C3 show the same E of 9.6 GPa, about 28% lower than the highest E = 13.3 GPa of specimen D3. This comparison suggests that CO2 treatment does not have a significant effect on the E of specimens. This means that the change in the grains’ distribution was not enough to change the stiffness of the CO2-treated specimens. Hangx et al. [43] similarly found no notable changes in the elastic modulus of Captain sandstone specimens following CO2 exposure.
Figure 13b shows a decreasing trend in ν of specimens with respect to Pd. Higher Pd provides better restrain for the specimens and decreases the ν values. Water-treated specimens seem to exhibit higher ν values or experience higher compressibility at every Pd value, and specimens treated with water + CO2 have the lowest ν values or are less compressible. At the lowest Pd = 5 MPa, specimen W1 has the highest ν value of 0.25, which is 79% higher than 0.14 of specimens D1 and C1. At a higher Pd = 15 MPa, specimens D2 and W2 have a similar ν = 0.12, but specimen C2 shows a 25% lower ν of 0.09. At the highest Pd = 25 MPa, specimens D3 and W3 show a similar ν = 0.09, while specimen C3 shows a 56% decrease in ν of 0.04. The comparison suggests that CO2 treatment decreases the ν of the specimens for all Pd. The reduced ν values observed following the water + CO2 treatment align with the increased brittleness of the specimens. The more brittle behavior of the CO2-treated specimens can be attributed to the higher quartz content. The low ν values such as 0.05 were also reported in a study on Captain sandstone under Pd = 22.8 MPa [43].

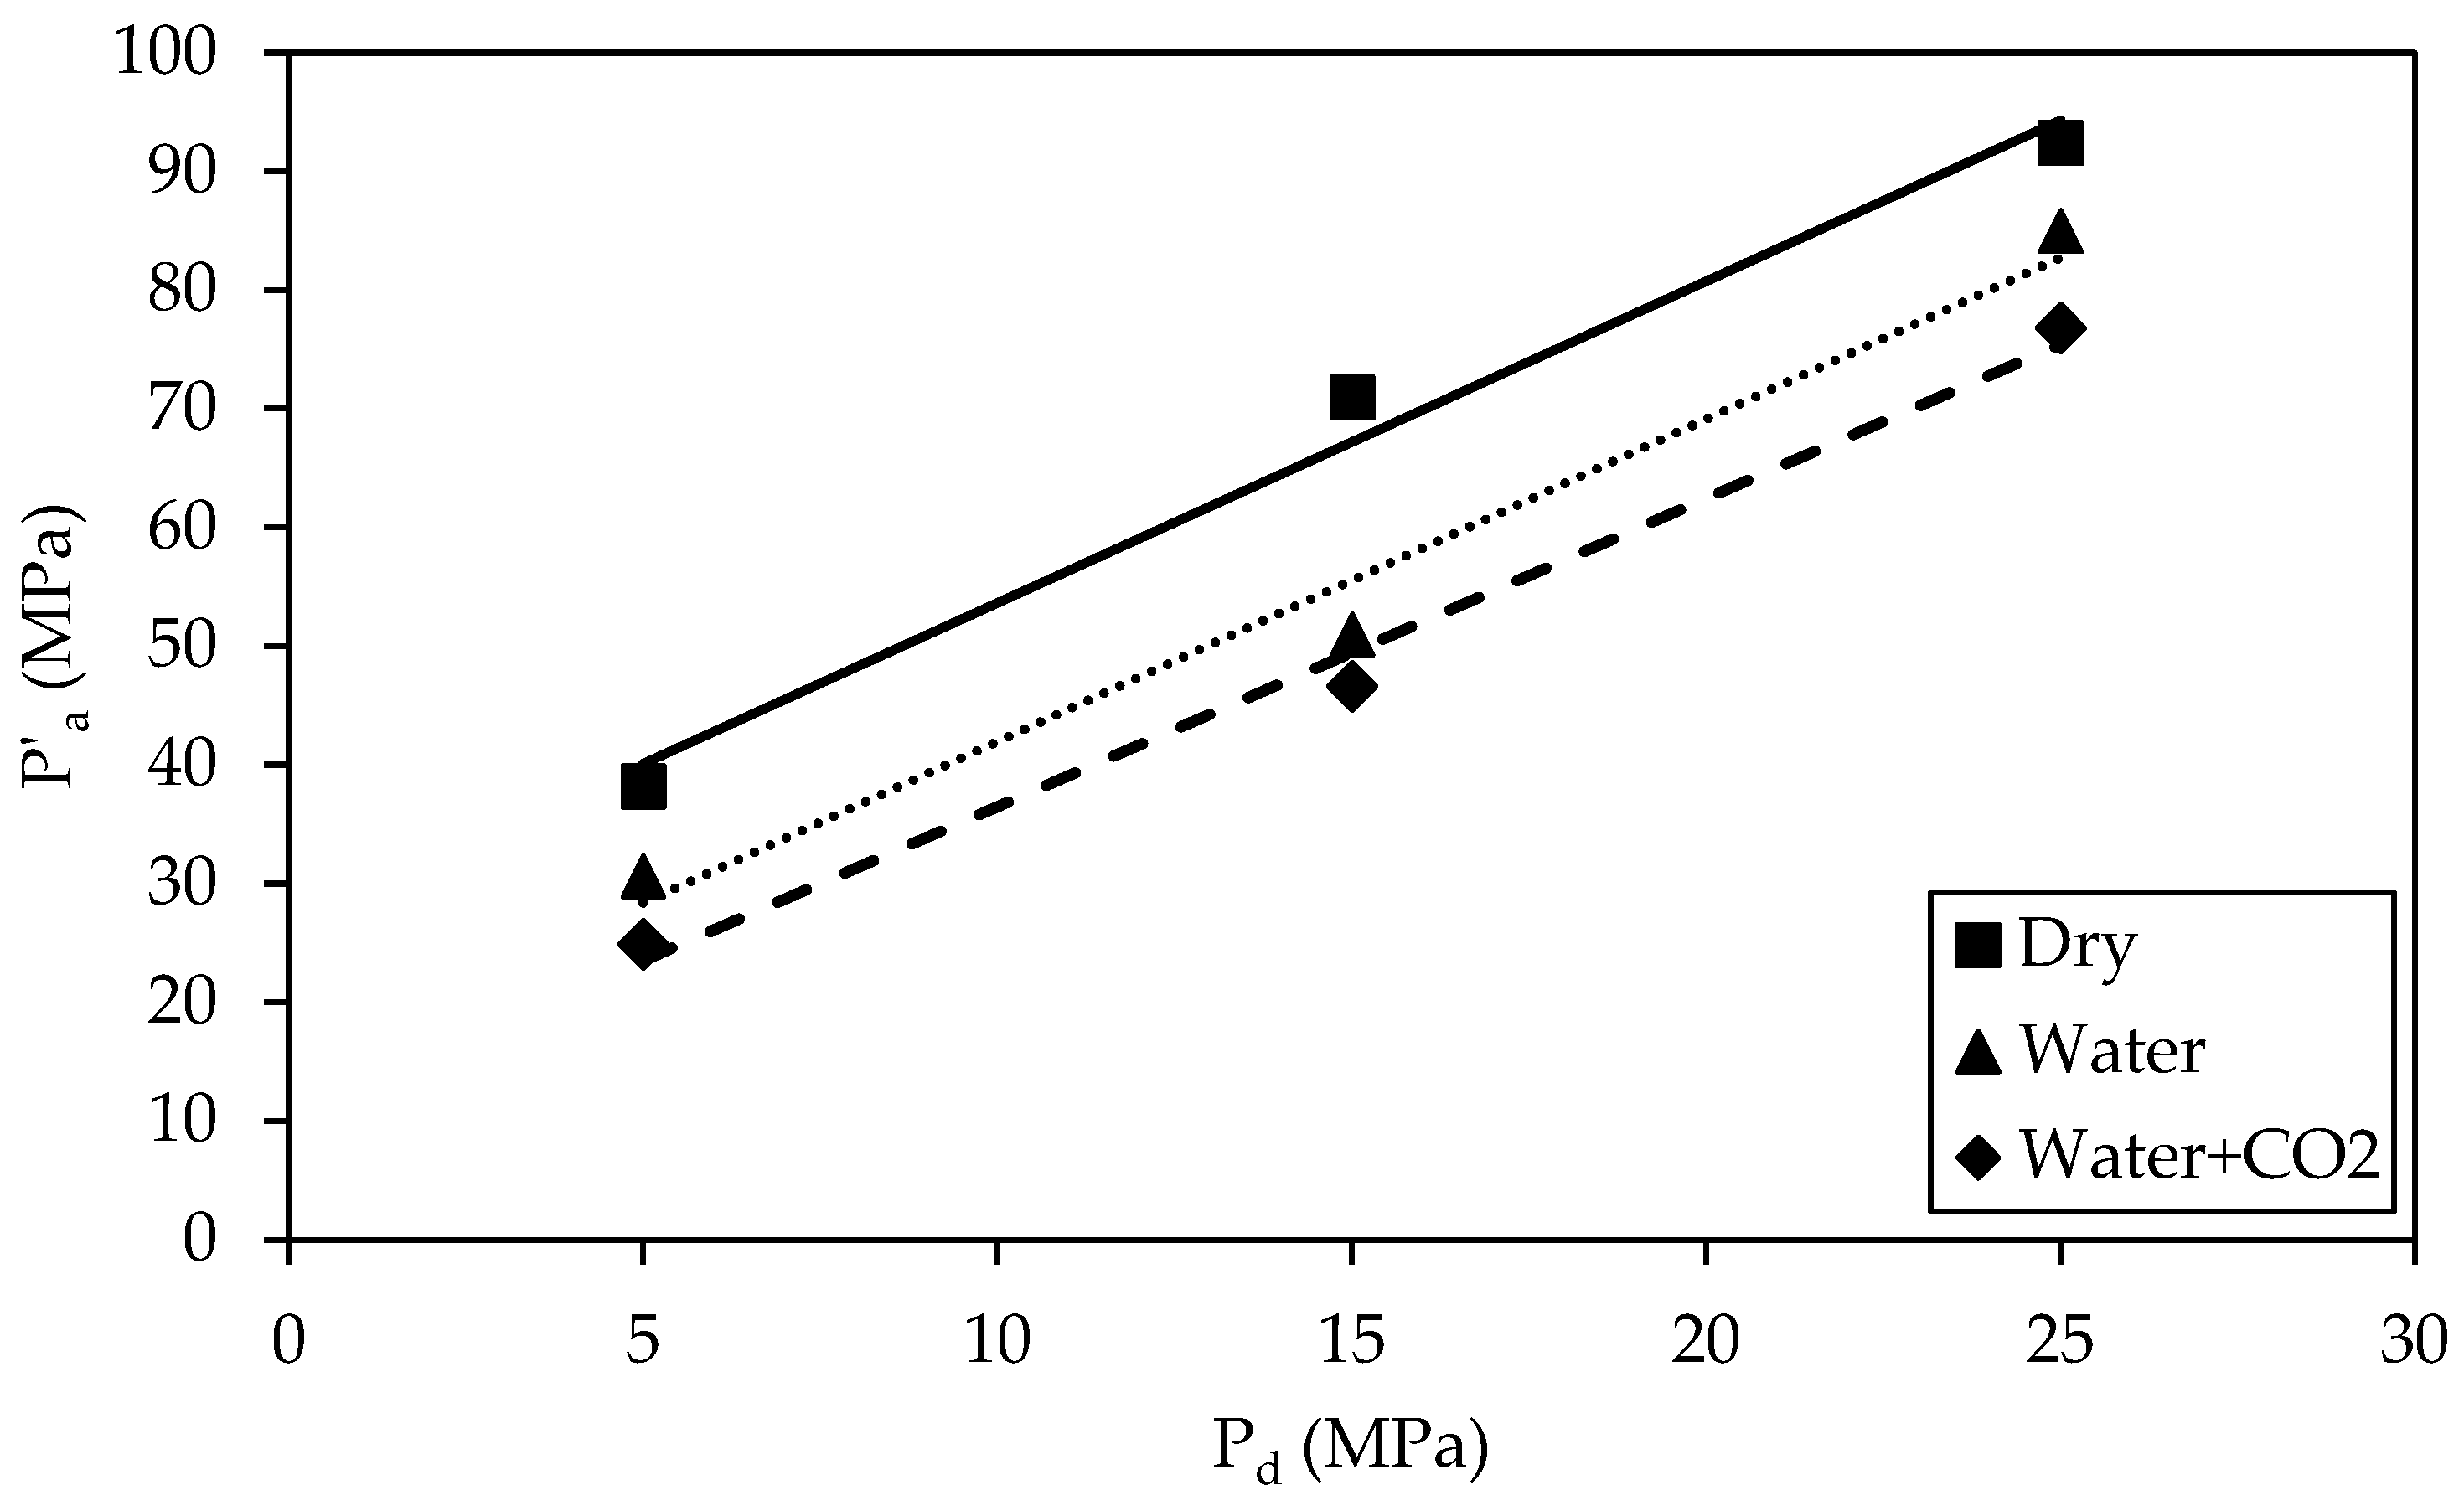
3.3.3. Major Effective Principal Stress

Figure 14 shows the relationship between the major effective principal stress (P′a), given by Equation (6) [51], and the Pd for all specimens.
P a = P d + σ P e a k
Table 3 summarizes the P′a values for all the specimens. P′a values of all specimens increase when Pd increases from 5 to 25 MPa. The P′a value increases from 38 MPa of specimen D1 to 71 MPa of specimen D2 or 87% with a rise in Pd from 5 to 15 MPa. Increasing the Pd from 15 to 25 MPa increases the P′a value from 71 MPa to 92 MPa of specimen D3 or 30%. In water-treated specimens, P′a increases from 31 MPa in specimen W1 to 51 MPa in specimen W2, or by 65%, as Pd is increased from 5 MPa to 15 MPa. The P′a value continues to increase to 85 MPa of specimen W3 with a rise in Pd from 15 to 25 MPa, a 67% increase compared to specimen W2. For specimens treated with water + CO2, the P′a value increases from 25 MPa to 47 MPa, or 88%, with a rise in Pd from 5 to 15 MPa, and the P′a value continues to increase to 77 MPa, or 64%, as Pd elevates from 15 to 25 MPa. Specimens under all treatment conditions show similar percentage increases in P′a with respect to Pd. Compared with the P′a values of dry specimens, the P′a values of specimens treated with water reduce by 8 to 28%, and the P′a values of specimens treated with water + CO2 reduce at higher percentages by 17 to 35%. This comparison confirms that CO2 treatment adversely affects the Hanna sandstone specimens’ compressive strength, with the impact being more pronounced at lower Pd values. At higher confinements, the compressive strength is mostly controlled by the confining pressure [50], whereas at lower confinements, the intrinsic properties of rock specimens (such as the pore structure) play a dominant role in influencing the mechanical behavior. Hence, CO2 treatment has a greater impact on specimen strength at lower confinement levels. Similar results of the effect of Pd on the strength of CO2-treated sandstone specimens from the North Germany Basin were reported by Marbler et al. [52].

3.3.4. Shear Strength Parameters

Figure 15 compares the effective cohesion (c′) and the effective friction angle (φ′) values for specimens across various treatments. These shear strength parameter values are summarized in Table 3. Equation (7) [53] was utilized to calculate φ′ by analyzing the gradient (a) of the linear regression line applied to the data points in the P′a–Pd plots in Figure 14. Meanwhile, utilizing Equation (8) [53], c′ values were determined, which involved the Y-intercept of the linear regression line that was fitted to the data points in the P′a–Pd plots.
φ = sin 1 a 1 a + 1
c = b ( 1 sin φ ) 2 cos φ
Figure 15 shows that dry and water-treated specimens exhibit a slightly higher φ′ of 27.5° than 26° of water + CO2 specimens. Comparable φ′ values suggest that saturation with water and treatment with water + CO2 has a minimal effect on the friction angle of the specimens. On the other hand, dry specimens exhibit the highest c′ of 8.1 MPa, and the c′ values significantly reduce to 4.5 MPa and 3.1 MPa due to treatment with water and water + CO2, respectively. Weaker cementation of quartz particles due to the lubrication effect of water in water-treated specimens and the calcite dissolution in specimens treated with water + CO2 could have contributed to the reduction in c′. The negative effect of water and CO2 on the shear strength parameters of sandstone was similarly reported in other studies [50,54].

3.4. Study Evaluation

The mechanical responses of Hanna sandstone provided here can be used in geomechanical modeling to predict the stress and deformation changes for CO2 geological storage. The reduced peak strength in specimens treated with water + CO2 shows the significant impact of CO2 on the microstructure of the rock. A more than 40% decrease in strength after just one week of CO₂ exposure underscores the importance of considering long-term changes when planning CO₂ storage in this Formation. These considerations are pivotal for ensuring the storage capacity and structural integrity of the formation. The literature has reported different trends in the strength of the various rocks following CO2 exposure. For instance, while Hardenberg anhydrite samples showed no changes in strength after the CO2 treatment [55], Mancos shale samples exhibited higher strength and stiffness [56]. Similar to the present study, CO2-treated Tashan coal samples showed lower strength than the untreated ones [57]. Hence, it is important to understand the effect of CO2 on sandstone consisting of mostly non-reactive quartz in this study. One limitation of this study could be the number of tests due to the difficulty in acquiring an adequate number of large specimens.

4. Conclusions

The following conclusions are drawn based on the characterization and triaxial compression experiments conducted on 76.2 mm diameter Hanna sandstone specimens under dry, water, and water + CO2 treatment conditions:
  • XRD results show that the CO2 treatment significantly reduces the calcite content. SEM images show the dissolution of calcite and the increase in the number and size of pores in the CO2 treatment.
  • Regardless of the treatment conditions, an increase in the effective confining pressure (Pd) increases the maximum volumetric strain (εv). For the same Pd, dry specimens exhibit the largest maximum εv, followed by water-treated specimens and CO2-treated specimens. CO2 treatment decreases the maximum εv and reduces the compressibility of Hanna sandstone specimens during the confining stage.
  • Bulk modulus (K) values increase with the increase in Pd. Specimens treated with water + CO2 exhibit large K values, and the difference in K values of the specimens at three treatment conditions diminishes at the largest Pd of 25 MPa.
  • At three Pd values, dry specimens exhibit the highest compressive strength, followed by specimens treated with water, while specimens treated with water + CO2 exhibit the lowest compressive strength. Compared to dry specimens, the compressive strengths of specimens treated with water + CO2 are 40, 43, and 23% lower at Pd = 5, 15, and 25 MPa, respectively. At the lowest Pd = 5 MPa, all specimens exhibit a similar brittle post-failure behavior. Increasing the Pd to 15 and 25 MPa induces a more ductile failure behavior of specimens.
  • Young’s modulus (E) values generally increase with the increase in Pd, while Poisson’s ratio (ν) values of specimens decrease at higher Pd. Dry specimens have the highest E values, while the E values of specimens treated with water and water + CO2 are comparable except at Pd = 5 MPa. CO2 treatment does not have much effect on the E of specimens, and the effect of treatment conditions becomes insignificant at a higher Pd. CO2 treatment decreases the ν of the specimens for all Pd.
  • As Pd rises from 5 MPa to 25 MPa, the major principal effective stress (P′a) values for all specimens increase. Specimens treated with CO2 show reduced P′a values.
  • Compared to that of dry specimens, CO2 treatment reduces the effective friction angle (φ′) value by 4% and the effective cohesion (c′) value by 62%.

Author Contributions

Conceptualization, E.D. and K.N.; investigation, E.D.; writing—original draft preparation, E.D.; writing—review and editing, K.N.; supervision, K.N.; funding acquisition, K.N. All authors have read and agreed to the published version of the manuscript.

Funding

This research received no external funding.

Data Availability Statement

The data are available from the corresponding author upon reasonable request.

Acknowledgments

The authors express their gratitude to the National Science Foundation for supporting the purchase of high-pressure and high-temperature true triaxial testing equipment with a multiphase fluid flow system under Award #2017874. The authors wish to express their gratitude to the Materials Characterization Laboratory at the University of Wyoming for their services.

Conflicts of Interest

The authors declare no conflicts of interest. The funders had no role in the design of the study; in the collection, analyses, or interpretation of data; in the writing of the manuscript; or in the decision to publish the results.

References

  1. Abedi, B.; Orujov, A.; Dabbaghi, E.; Ng, K.; Ackerman, J.; Aryana, S.A. Containment Strategy for Subsurface H2 Storage Based on Time-Dependent Soft Solids. Int. J. Hydrogen Energy 2024, 82, 1001–1014. [Google Scholar] [CrossRef]
  2. Peter, A.; Yang, D.; Eshiet, K.I.-I.I.; Sheng, Y. A Review of the Studies on CO2–Brine–Rock Interaction in Geological Storage Process. Geosciences 2022, 12, 168. [Google Scholar] [CrossRef]
  3. Dabbaghi, E.; Ng, K.; Kou, Z.; Copeland, G.; Alvarado, V. Experimental Investigation to Understand the Effect of Fracturing Fluid on the Geomechanical Behavior of Mowry Shale. J. Pet. Explor. Prod. Technol. 2024, 14, 1505–1519. [Google Scholar] [CrossRef]
  4. Zhao, D.; Yin, D. Effect of Fluid/Rock Interactions on Physical Character of Tight Sandstone Reservoirs during CO2 Flooding. Geofluids 2021, 2021, 1–14. [Google Scholar] [CrossRef]
  5. Cheng, P.; Zhang, C.P.; Ma, Z.Y.; Zhou, J.P.; Zhang, D.C.; Liu, X.F.; Chen, H.; Ranjith, P.G. Experimental Study of Micromechanical Properties Alterations of Shale Matrix Treated by ScCO2-Water Saturation Using Nanoindentation Tests. Energy 2022, 242, 122965. [Google Scholar] [CrossRef]
  6. Li, S.; Zhang, S.; Xing, H.; Zou, Y. CO2–Brine–Rock Interactions Altering the Mineralogical, Physical, and Mechanical Properties of Carbonate-Rich Shale Oil Reservoirs. Energy 2022, 256, 124608. [Google Scholar] [CrossRef]
  7. Emberley, S.; Hutcheon, I.; Shevalier, M.; Durocher, K.; Gunter, W.D.; Perkins, E.H. Geochemical Monitoring of Fluid-Rock Interaction and CO2 Storage at the Weyburn CO2-Injection Enhanced Oil Recovery Site, Saskatchewan, Canada. Energy 2004, 29, 1393–1401. [Google Scholar] [CrossRef]
  8. He, Y.; Ji, B.; Yang, S.; Liu, X.; Zhao, S.; Zhou, Y. Water–Rock–CO2 Interactions and CO2 Storage of Honghe Tight Oil Reservoirs: An Experimental and Simulation Study. Greenh. Gases Sci. Technol. 2019, 9, 703–718. [Google Scholar] [CrossRef]
  9. An, Q.; Zhang, Q.; Li, X.; Yu, H.; Yin, Z.; Zhang, X. Accounting for Dynamic Alteration Effect of SC-CO2 to Assess Role of Pore Structure on Rock Strength: A Comparative Study. Energy 2022, 260, 125125. [Google Scholar] [CrossRef]
  10. Kim, K.; Makhnenko, R.Y. Short- and Long-Term Responses of Reservoir Rock Induced by CO2 Injection. Rock. Mech. Rock. Eng. 2022, 55, 6605–6625. [Google Scholar] [CrossRef]
  11. Prakash, R.; Mahgoub, S.A.; Abedi, S. Chemo-Mechanical Alteration of Silicate-Rich Shale Rock after Exposure to CO2-Rich Brine at High Temperature and Pressure. Rock. Mech. Rock. Eng. 2023, 57, 5317–5333. [Google Scholar] [CrossRef]
  12. Dabbaghi, E.; Ng, K. Effects of CO2 on the Mineralogy, Mechanical, and Transport Properties of Rocks. Renew. Sustain. Energy Rev. 2024, 199, 114519. [Google Scholar] [CrossRef]
  13. Rathnaweera, T.D.; Ranjith, P.G.; Perera, M.S.A.; Haque, A.; Lashin, A.; Al Arifi, N.; Chandrasekharam, D.; Yang, S.; Xu, T.; Wang, S.; et al. CO2-Induced Mechanical Behaviour of Hawkesbury Sandstone in the Gosford Basin: An Experimental Study. Mater. Sci. Eng. A 2015, 641, 123–137. [Google Scholar] [CrossRef]
  14. Zandvakili, A.; Rahbar Shahrouzi, J.; Tabatabaei-Nejad, S.A.; Khodapanah, E. Experimental Investigation of CO2–Rock–Brine Interaction for Injection of CO2 in an Iranian Oil Reservoir as an EOR Method. Environ. Earth Sci. 2020, 79, 480. [Google Scholar] [CrossRef]
  15. Huang, Y.-H.; Yang, S.-Q.; Li, W.-P.; Hall, M.R. Influence of Super-Critical CO2 on the Strength and Fracture Behavior of Brine-Saturated Sandstone Specimens. Rock. Mech. Rock. Eng. 2020, 53, 653–670. [Google Scholar] [CrossRef]
  16. Lamy-Chappuis, B.; Angus, D.; Fisher, Q.J.; Yardley, B.W.D. The Effect of CO2-Enriched Brine Injection on the Mechanical Properties of Calcite-Bearing Sandstone. Int. J. Greenh. Gas. Control 2016, 52, 84–95. [Google Scholar] [CrossRef]
  17. Shi, Z.; Sun, L.; Haljasmaa, I.; Harbert, W.; Sanguinito, S.; Tkach, M.; Goodman, A.; Tsotsis, T.T.; Jessen, K. Impact of Brine/CO2 Exposure on the Transport and Mechanical Properties of the Mt Simon Sandstone. J. Pet. Sci. Eng. 2019, 177, 295–305. [Google Scholar] [CrossRef]
  18. Prasad, M.; Glubokovskikh, S.; Daley, T.; Oduwole, S.; Harbert, W. CO2 Messes with Rock Physics. Lead. Edge 2021, 40, 424–432. [Google Scholar] [CrossRef]
  19. Nooraiepour, M.; Bohloli, B.; Park, J.; Sauvin, G.; Skurtveit, E.; Mondol, N.H. Effect of Brine-CO2 Fracture Flow on Velocity and Electrical Resistivity of Naturally Fractured Tight Sandstones. GEOPHYSICS 2018, 83, WA37–WA48. [Google Scholar] [CrossRef]
  20. Vanorio, T.; Nur, A.; Ebert, Y. Rock Physics Analysis and Time-Lapse Rock Imaging of Geochemical Effects Due to the Injection of CO2 into Reservoir Rocks. Geophysics 2011, 76, O23–O33. [Google Scholar] [CrossRef]
  21. Wang, L.; Yao, B.; Xie, H.; Winterfeld, P.H.; Kneafsey, T.J.; Yin, X.; Wu, Y.-S. CO2 Injection-Induced Fracturing in Naturally Fractured Shale Rocks. Energy 2017, 139, 1094–1110. [Google Scholar] [CrossRef]
  22. Rinehart, A.J.; Dewers, T.A.; Broome, S.T.; Eichhubl, P. Effects of CO2 on Mechanical Variability and Constitutive Behavior of the Lower Tuscaloosa Formation, Cranfield Injection Site, USA. Int. J. Greenh. Gas. Control 2016, 53, 305–318. [Google Scholar] [CrossRef]
  23. Ng, K.; Yu, H.; Wang, H.; Kaszuba, J.; Alvarado, V.; Grana, D.; Campbell, E. The Effect of CO2 on the Mechanical Properties of the Reservoir Sandstone under a Low Differential Pressure. In Proceedings of the ARMA US Rock Mechanics/Geomechanics Symposium, ARMA, Seattle, WA, USA, 17–20 June 2018; p. ARMA-2018. [Google Scholar]
  24. Foroutan, M.; Ghazanfari, E.; Amirlatifi, A. Variation of Failure Properties, Creep Response and Ultrasonic Velocities of Sandstone upon Injecting CO2-Enriched Brine. Geomech. Geophys. Geo-Energy Geo-Resour. 2021, 7, 27. [Google Scholar] [CrossRef]
  25. Zhang, Q.; Hu, S.; Li, X.; Shi, L. Preliminary Experimental Study of Effect of CO2-H2O Biphasic Fluid on Mechanical Behavior of Sandstone under True Triaxial Compression. Int. J. Geomech. 2019, 19, 06018036. [Google Scholar] [CrossRef]
  26. Tarokh, A.; Makhnenko, R.Y.; Kim, K.; Zhu, X.; Popovics, J.S.; Segvic, B.; Sweet, D.E. Influence of CO2 Injection on the Poromechanical Response of Berea Sandstone. Int. J. Greenh. Gas. Control 2020, 95, 102959. [Google Scholar] [CrossRef]
  27. Li, H.; Xie, L.; Ren, L.; He, B.; Liu, Y.; Liu, J. Influence of CO2–Water–Rock Interactions on the Fracture Properties of Sandstone from the Triassic Xujiahe Formation, Sichuan Basin. Acta Geophys. 2021, 69, 135–147. [Google Scholar] [CrossRef]
  28. Song, W.; Ni, H.; Tang, P.; Zhang, S.; Gao, J.; Zhang, J.; Shen, B. Simulation of Supercritical Carbon Dioxide Fracturing in Shale Gas Reservoir. J. Therm. Sci. 2021, 30, 1444–1451. [Google Scholar] [CrossRef]
  29. Choi, C.-S.; Song, J.-J. Swelling and Mechanical Property Change of Shale and Sandstone in Supercritical CO2. J. Korean Soc. For. Rock. Mech. 2012, 22, 266–275. [Google Scholar] [CrossRef]
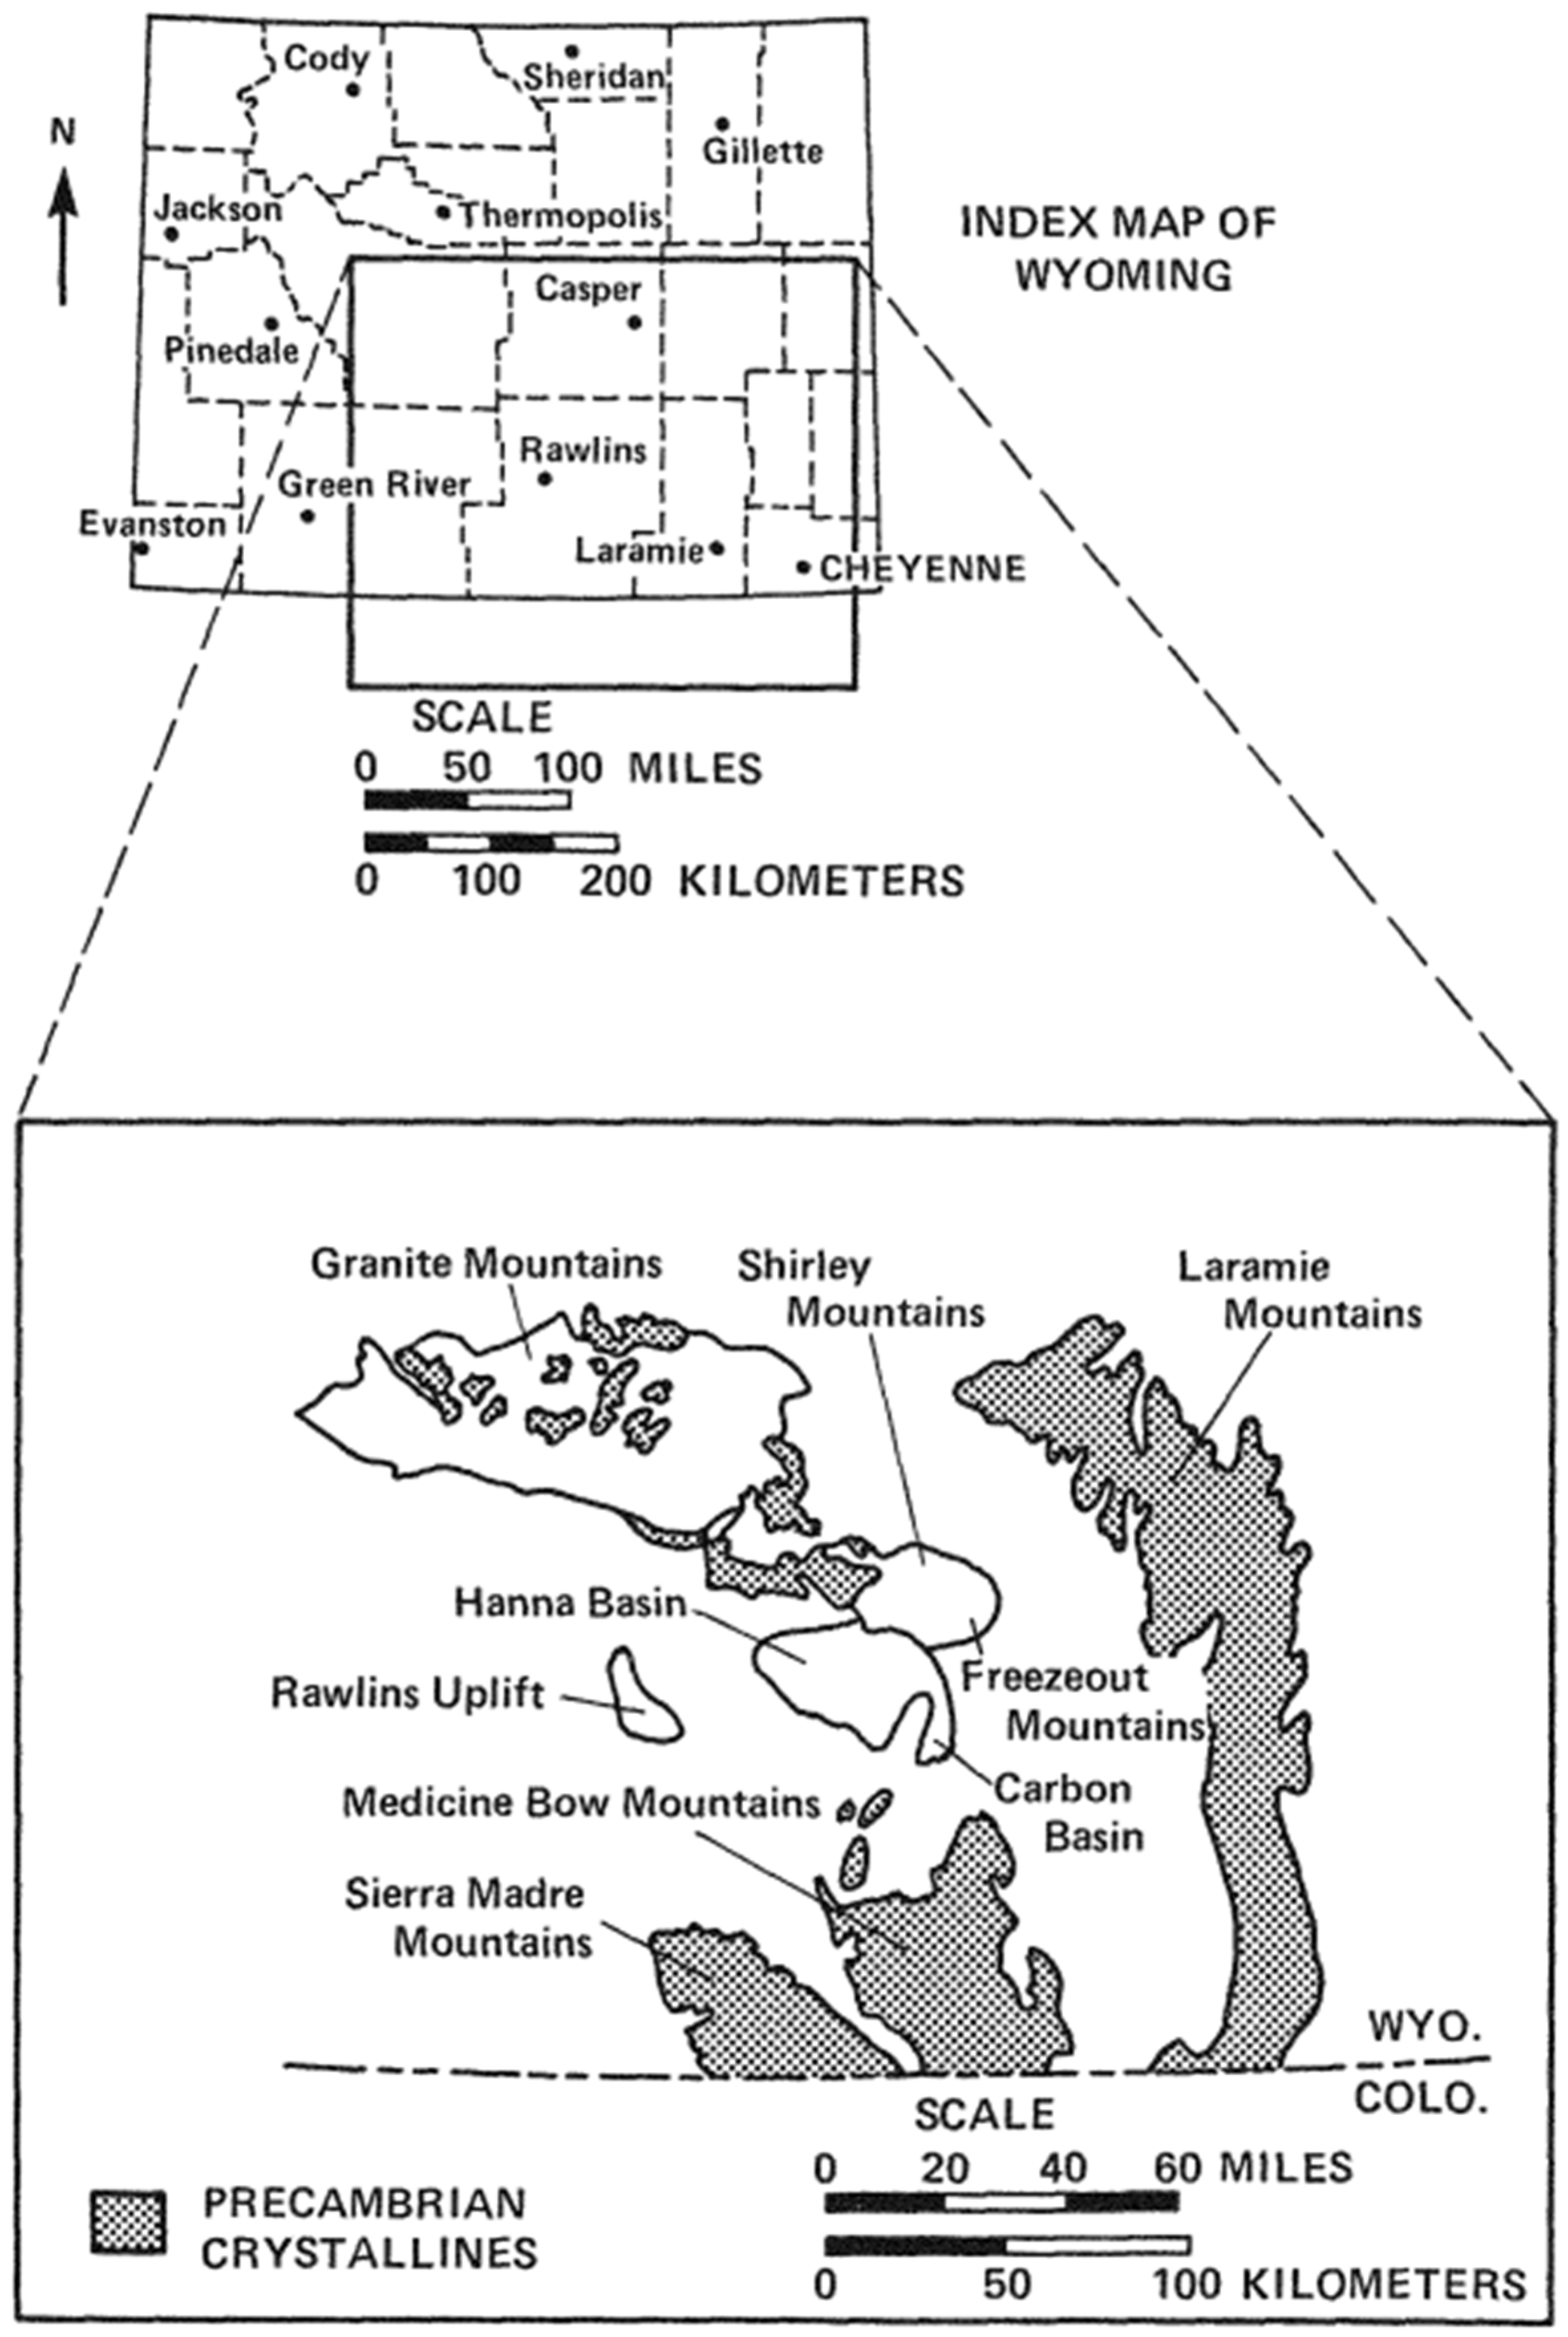
  30. Bowen, C.F. Stratigraphy of the Hanna Basin, Wyoming; US Government Printing Office: Washington, DC, USA, 1918.
  31. Oliver, R.L.; Youngberg, A.D. Geology of the Hanna Formation, Hanna Underground Coal Gasification Site, Hanna, Wyoming; Associated Western Universities, Inc.: Salt Lake, UT, USA, 1984. [Google Scholar]
  32. Alomari, E.M.; Ng, K.W.; Khatri, L.; Wulff, S.S. Effect of Physical Properties on Mechanical Behaviors of Sandstone under Uniaxial and Triaxial Compressions. Materials 2023, 16, 4867. [Google Scholar] [CrossRef]
  33. ASTM. ASTM D4543-19; Standard Practices for Preparing Rock Core as Cylindrical Test Specimens and Verifying Conformance to Dimensional and Shape Tolerances. ASTM International: West Conshohocken, PA, USA, 2019.
  34. Dabbaghi, E.; Ng, K.; Brown, T.C.; Yu, Y. Experimental Study on the Effect of Hydrogen on the Mechanical Properties of Hulett Sandstone. Int. J. Hydrogen Energy 2024, 60, 468–478. [Google Scholar] [CrossRef]
  35. Dabbaghi, E.; Ng, K. Investigation of the Mechanical Properties of Hanna Sandstone Using Newly Installed High Pressure and High Temperature Polyaxial Equipment. In Proceedings of the ARMA US Rock Mechanics/Geomechanics Symposium, ARMA, Atlanta, GA, USA, 25–28 June 2023. [Google Scholar]
  36. Sun, Y.; Wei, L.; Dai, C.; Yu, Z.; Xin, Y. The Carbonic Acid-Rock Reaction in Feldspar/Dolomite-Rich Tightsand and Its Impact on CO2-Water Relative Permeability during Geological Carbon Storage. Chem. Geol. 2021, 584, 120527. [Google Scholar] [CrossRef]
  37. Lin, R.; Yu, Z.; Zhao, J.; Dai, C.; Sun, Y.; Ren, L.; Xie, M. Experimental Evaluation of Tight Sandstones Reservoir Flow Characteristics under CO2–Brine–Rock Multiphase Interactions: A Case Study in the Chang 6 Layer, Ordos Basin, China. Fuel 2022, 309, 122167. [Google Scholar] [CrossRef]
  38. Yang, B.; Wang, H.; Wang, B.; Yi, Y.; Zhao, C.; Tian, G. Effect of Supercritical CO2-Water/Brine-Rock Interaction on Microstructures and Mechanical Properties of Tight Sandstone. Transp. Porous Media 2023, 149, 87–115. [Google Scholar] [CrossRef]
  39. Fauziah, C.A.; Al-Yaseri, A.; Al-Khdheeawi, E.; Jha, N.K.; Abid, H.R.; Iglauer, S.; Lagat, C.; Barifcani, A. Effect of CO2 Flooding on the Wettability Evolution of Sand-Stone. Energies 2021, 14, 5542. [Google Scholar] [CrossRef]
  40. Zhang, X.; Ge, J.; Kamali, F.; Othman, F.; Wang, Y.; Le-Hussain, F. Wettability of Sandstone Rocks and Their Mineral Components during CO2 Injection in Aquifers: Implications for Fines Migration. J. Nat. Gas. Sci. Eng. 2020, 73, 103050. [Google Scholar] [CrossRef]
  41. Hussain, A.; Haughton, P.D.W.; Shannon, P.M.; Turner, J.N.; Pierce, C.S.; Obradors-Latre, A.; Barker, S.P.; Martinsen, O.J. High-resolution X-ray Fluorescence Profiling of Hybrid Event Beds: Implications for Sediment Gravity Flow Behaviour and Deposit Structure. Sedimentology 2020, 67, 2850–2882. [Google Scholar] [CrossRef]
  42. Cheng, Y.; Zhang, X.; Lu, Z.; Pan, Z.; Zeng, M.; Du, X.; Xiao, S. The Effect of Subcritical and Supercritical CO2 on the Pore Structure of Bituminous Coals. J. Nat. Gas. Sci. Eng. 2021, 94, 104132. [Google Scholar] [CrossRef]
  43. Hangx, S.; van der Linden, A.; Marcelis, F.; Bauer, A. The Effect of CO2 on the Mechanical Properties of the Captain Sandstone: Geological Storage of CO2 at the Goldeneye Field (UK). Int. J. Greenh. Gas. Control 2013, 19, 609–619. [Google Scholar] [CrossRef]
  44. Curtis, M.; Mamoudou, S.; Cruz, F.; Dang, S.T.; Rai, C.; Devegowda, D. Effects of CO2 Exposure on Unconventional Reservoir Rock Microstructure. In Proceedings of the Proceedings of the 11th Unconventional Resources Technology Conference, Online, 13–15 June 2023; American Association of Petroleum Geologists: Tulsa, OK, USA, 2023. [Google Scholar]
  45. Richart, F.E.; Brandtzæg, A.; Brown, R.L. A Study of the Failure of Concrete under Combined Compressive Stresses; University of Illinois, Engineering Experiment Station, Bulletin: Urbana, IL, USA, 1928; No. 185. [Google Scholar]
  46. Cook, N.G.W. An Experiment Proving That Dilatancy Is a Pervasive Volumetric Property of Brittle Rock Loaded to Failure. Rock. Mech. 1970, 2, 181–188. [Google Scholar] [CrossRef]
  47. Zhang, Z.-X. Environmental Effects on Rock Fracture. In Rock Fracture and Blasting; Elsevier: Amsterdam, The Netherlands, 2016; pp. 135–153. [Google Scholar]
  48. Greshnyakov, V.A.; Belenkov, E.A. Technique for Calculating the Bulk Modulus. Russ. Phys. J. 2014, 57, 731–737. [Google Scholar] [CrossRef]
  49. Guo, S.; Pu, H.; Yang, M.; Liu, D.; Sha, Z.; Xu, J. Study of the Influence of Clay Minerals on the Mechanical and Percolation Properties of Weakly Cemented Rocks. Geofluids 2022, 2022, 1712740. [Google Scholar] [CrossRef]
  50. Zhang, Q.; Ye, W.; Chen, Y.; Li, X.; Hu, S. Mechanical Behavior of Sandstone Pressurized with Supercritical CO2 and Water under Different Confining Pressure Conditions. Int. J. Geomech. 2021, 21, 04021100. [Google Scholar] [CrossRef]
  51. Debasis, D.E.B.; Kumar, V.A. Fundamentals and Applications of Rock Mechanics; PHI Learning Pvt. Ltd.: Delhi, India, 2016; ISBN 8120351827. [Google Scholar]
  52. Marbler, H.; Erickson, K.P.; Schmidt, M.; Lempp, C.; Pöllmann, H. Geomechanical and Geochemical Effects on Sandstones Caused by the Reaction with Supercritical CO2: An Experimental Approach to in Situ Conditions in Deep Geological Reservoirs. Environ. Earth Sci. 2013, 69, 1981–1998. [Google Scholar] [CrossRef]
  53. Sivakugan, N.; Das, B.M.; Lovisa, J.; Patra, C.R. Determination of c and φ of Rocks from Indirect Tensile Strength and Uniaxial Compression Tests. Int. J. Geotech. Eng. 2014, 8, 59–65. [Google Scholar] [CrossRef]
  54. Wang, S.R.; Hagan, P.; Li, Y.C.; Zhang, C.G.; Liu, X.L. Experimental Study on Deformation and Strength Characteristics of Sandstone with Different Water Contents. J. Eng. Sci. Technol. Rev. 2017, 10, 199–203. [Google Scholar] [CrossRef]
  55. Hangx, S.J.T.; Spiers, C.J.; Peach, C.J. Mechanical Behavior of Anhydrite Caprock and Implications for CO2 Sealing Capacity. J. Geophys. Res. Solid. Earth 2010, 115, B07402. [Google Scholar] [CrossRef]
  56. Espinoza, D.N.; Jung, H.; Major, J.R.; Sun, Z.; Ramos, M.J.; Eichhubl, P.; Balhoff, M.T.; Choens, R.C.; Dewers, T.A. CO2 Charged Brines Changed Rock Strength and Stiffness at Crystal Geyser, Utah: Implications for Leaking Subsurface CO2 Storage Reservoirs. Int. J. Greenh. Gas. Control 2018, 73, 16–28. [Google Scholar] [CrossRef]
  57. Zhang, X.; Ranjith, P.G.; Lu, Y.; Ranathunga, A.S. Experimental Investigation of the Influence of CO2 and Water Adsorption on Mechanics of Coal under Confining Pressure. Int. J. Coal Geol. 2019, 209, 117–129. [Google Scholar] [CrossRef]
Figure 1. Location map of the Hanna Basin in Wyoming—after [31].
Geosciences 14 00279 g001
Figure 2. Photos show (a) a wheel saw, (b) a surface grinder, and (c) a prepared rock specimen.
Geosciences 14 00279 g002
Figure 3. Images illustrate (a) the rock specimens immersed in water within the vessel prior to treatment and (b) the setup designed for high-pressure and high-temperature CO2 treatment.
Geosciences 14 00279 g003
Figure 4. Photos show (a) the NER Autolab 3000 polyaxial equipment at the University of Wyoming and (b) the completed specimen setup for the triaxial compression experiment.
Geosciences 14 00279 g004
Figure 5. An illustration of an example TC test process and timing.
Geosciences 14 00279 g005
Figure 6. XRD patterns comparing specimens with two varying treatment specifications (Ca = calcite; Ka = kaolinite; Q = quartz).
Geosciences 14 00279 g006
Figure 7. Photos illustrate specimens’ SEM images (a) in dry condition and (b) treated with water + CO2.
Geosciences 14 00279 g007
Figure 8. Variations of volumetric strain (εv) versus the effective confining pressure (Pd) under a target Pd of 5 MPa.
Geosciences 14 00279 g008
Figure 9. Variations of volumetric strain (εv) against the effective confining pressure (Pd) under a target Pd of 15 MPa.
Geosciences 14 00279 g009
Figure 10. Variations of volumetric strain (εv) against the effective confining pressure (Pd) under a target Pd of 25 MPa.
Geosciences 14 00279 g010
Figure 11. The comparison of bulk modulus (K) and the effective confining pressure (Pd) for all specimens.
Geosciences 14 00279 g011
Figure 12. Relationship between the deviatoric stress (Δσ) and axial, radial, and volumetric strains under (a1a3) Pd = 5 MPa, (b1b3) Pd = 15 MPa, and (c1c3) Pd = 25 MPa.
Geosciences 14 00279 g012
Figure 13. Variations of (a) elastic modulus and (b) Poisson’s ratio against the effective confining pressure.
Geosciences 14 00279 g013
Figure 14. Changes in the major effective principal stress (P′a) compared to minor effective principal stress (Pd).
Geosciences 14 00279 g014
Figure 15. The comparison of c′ and φ′ for all specimens in three treatment conditions.
Geosciences 14 00279 g015
Table 1. Specimen identifications, treatment specifications, and triaxial compression conditions.
Specimen IdentificationsTreatment SpecificationsConfining Pressure
(MPa)
Pore Pressure (MPa)Effective Confining Pressure (MPa)
D1Dry505
D215015
D325025
W1Submerged in water for one week1055
W220515
W330525
C1Immersed in water for a week, then subjected to water + CO2 for the following week1055
C220515
C330525
Table 2. Minerals (by weight percentage) of the specimens in different treatment conditions.
TreatmentQuartzCalciteDolomiteSideriteAegirineAlbiteMicroclineMuscoviteKaolinite
Untreated30.614.11.50.72.611.216.65.617.1
Water + CO235.10.61.51.21.911.116.87.624.2
Table 3. Summary of the mechanical, elastic, and shear strength properties.
SpecimenPd (MPa) ε v m a x   ( m ε ) K (GPa) σ p e a k   ( M P a ) E (GPa)νP′a (MPa)φ′ (°)c′ (MPa)
D152.627.633.25.20.1538.227.48.1
D21511.311.4567.80.1271
D32514.9215.367.413.30.0892.4
W151.5110.725.73.40.2530.727.54.5
W2158.4414.23650.1251
W32510.821.260100.0985
C150.871519.95.40.1424.926.43.1
C2157.3116.631.74.90.0946.7
C32510.3221.251.89.60.0476.8
Pd: effective confining pressure, εvmax: maximum volumetric strain in the confining stage, K: bulk modulus, ∆σpeak: peak deviatoric stress, E: Young’s modulus, ν: Poisson’s ratio, P′a: major principal effective stress, φ′: effective friction angle, and c′: effective cohesion.
Disclaimer/Publisher’s Note: The statements, opinions and data contained in all publications are solely those of the individual author(s) and contributor(s) and not of MDPI and/or the editor(s). MDPI and/or the editor(s) disclaim responsibility for any injury to people or property resulting from any ideas, methods, instructions or products referred to in the content.

