Article

Landslide Hazard and Rainfall Threshold Assessment: Incorporating Shallow and Deep-Seated Failure Mechanisms with Physics-Based Models

by
Roberto J. Marin
1,*,
Julián Camilo Marín-Sánchez
1,
Johan Estiben Mira
2,
Edwin F. García
2,
Binru Zhao
3,4 and
Jeannette Zambrano
5
1
LandScient, Landslide Scientific Assessment, Medellín 050032, Colombia
2
Infrastructure Investigation Group (GII), Environmental School, Faculty of Engineering, University of Antioquia, Medellín 050032, Colombia
3
School of Geography, Nanjing Normal University, Nanjing 210023, China
4
Jiangsu Center for Collaborative Innovation in Geographical Information Resource Development and Application, Nanjing 210023, China
5
Department of Civil Engineering, Universidad Nacional de Colombia, Sede Manizales, Manizales 170004, Colombia
*
Author to whom correspondence should be addressed.
Geosciences 2024, 14(10), 280; https://doi.org/10.3390/geosciences14100280
Submission received: 18 September 2024 / Revised: 3 October 2024 / Accepted: 18 October 2024 / Published: 21 October 2024

Abstract

:
Landslides pose a significant threat worldwide, leading to numerous fatalities and severe economic losses. The city of Manizales, located in the Colombian Andes, is particularly vulnerable due to its steep topography and permeable volcanic ash-derived soils. This study aims to assess landslide hazards in Manizales by integrating shallow planar and deep-seated circular failure mechanisms using physics-based models (TRIGRS and Scoops3D). By combining hazard zonation maps with rainfall thresholds calibrated through historical data, we provide a refined approach for early warning systems (EWS) in the region. Our results underscore the significance of the landslide hazard maps, which combine shallow planar and deep-seated circular failure scenarios. By categorizing urban areas into high, medium, and low-risk zones, we offer a practical framework for urban planning. Moreover, we developed physics-based rainfall thresholds for early landslide warning, simplifying their application while aiming to enhance regional predictive accuracy. This comprehensive approach equips local authorities with essential tools to mitigate landslide risks, refine hazard zoning, and strengthen early warning systems, promoting safer urban development in the Andean region and beyond, as the physics-based methods used are well-established and implemented globally.

1. Introduction

Landslides have historically represented a significant global threat, resulting in countless fatalities and substantial economic losses [1,2]. In Colombia, one of the countries most affected by landslides, Aristizábal and Sánchez (2020) [3] documented a catalog of 34,198 fatalities resulting from over 30,000 recorded landslide events between 1900 and 2018. Furthermore, García-Delgado et al. (2022) [4] compiled a catalog of 2351 fatal landslides that collectively accounted for 37,959 fatalities from 1912 to 2020. Driven by a combination of natural and anthropogenic factors, landslides play a critical role in reshaping the surface terrain of the Colombian Andes, with rainfall being a primary natural trigger that influences their occurrence through varying intensities and durations, as well as local soil properties and morphometric characteristics [5].
Manizales, located in the Colombian Andes, is highly susceptible to landslides due to its steep topography and permeable soils derived from volcanic ash, which facilitate rainwater infiltration and accumulation [6]. The city’s unique geographic features, coupled with a bimodal rainfall regime that results in intense, short-duration rainfalls, significantly increase the likelihood of landslide occurrences. This combination of factors underscores the urgent need for effective risk management strategies to mitigate the impacts of these natural hazards on the urban population [7].
Different methodologies have been proposed for assessing landslide hazards [8,9,10,11,12,13] and predicting or forecasting their occurrences in Early Warning Systems (EWS) [14,15,16]. Physics-based models have been utilized to evaluate landslide susceptibility and hazards in various regions around the globe [17,18,19]. New methodologies are emerging, including probabilistic applications [20,21] and the definition of rainfall thresholds [22,23,24]. Although predicting the spatial and temporal occurrence of landslides is very difficult due to significant variability and uncertainty associated with many influencing factors [25], EWS in various regions worldwide have implemented diverse methods in an effort to forecast landslide occurrences [26,27].
A frequently used method involves establishing thresholds, especially rainfall intensity-duration thresholds, cumulative rainfall, antecedent precipitation, and others [28,29,30,31,32] essential for the temporal prediction and forecasting of landslides. Despite significant advancements in defining rainfall thresholds, a substantial challenge persists in accurately determining these thresholds for different scales of study areas. Factors such as soil properties, topography, and land use can greatly influence how rainfall interacts with the landscape, leading to variability in landslide susceptibility [33]. This variability complicates the establishment of universally applicable thresholds, necessitating a more localized approach that considers the unique characteristics of each area. While early warning systems (EWS) typically seek minimum thresholds applicable to entire cities, these thresholds are often based on regional data rather than being specifically tailored to smaller areas, which is typically considered when implementing physics-based models for rainfall threshold definition in the Colombian Andes [34]. In this research, we utilize physics-based models that define these thresholds at a regional scale in a replicable manner, making them useful for early warning systems (EWS) and applicable to smaller areas using the same approach.
Our research aimed to pioneer a comprehensive approach to developing landslide hazard zoning maps for the city of Manizales utilizing advanced physics-based models. Uniquely, we integrated two distinct failure mechanisms—shallow planar failures and deep-seated circular failures—into our hazard zoning maps, establishing a new standard for accuracy in urban planning and early warning systems. The pertinence of the hazard zoning maps was enhanced by calibrating rainfall thresholds using comprehensive landslide inventory and historical rainfall data specific to Manizales. Our study further defined rainfall thresholds for the entire city, focusing on shallow landslide modeling, tailored for incorporation into Manizales’ early warning system.
By employing innovative approaches to rainfall threshold determination, our findings significantly advance landslide risk assessment methodology. This pioneering work provides critical insights for urban planners and disaster management authorities, laying the groundwork for more precise and effective landslide risk mitigation strategies in the region.
The research article is organized to provide a comprehensive overview of the study on landslide hazards in Manizales. Section 1 and Section 2 introduce the study by outlining the background and significance of landslides as a problematic issue, detailing the aim of the research and the specific case study. Section 3 presents the Methods, offering a concise description of the physics-based models TRIGRS and Scoops3D, the probabilistic First Order Second Moment (FOSM) method, and the types of rainfall thresholds utilized, as well as the approach to defining these thresholds. In Section 4, the Results are detailed in two main subsections: the first focuses on the landslide hazard maps, while the second discusses the rainfall thresholds established for the study area. Section 5 is dedicated to the Discussion, addressing the implementation of the thresholds, comparisons with other studies, and the limitations of the research. Finally, Section 6 provides the Conclusions, summarizing the key findings and implications of the study.

2. Case Study

Manizales, with a population of around 450,000, is located in the central region of the Colombian Andes. Figure 1 presents the digital elevation model and the geology of the urban areas of the city, which corresponds to 39.6 km2, considering both the main urban center and its surrounding areas. The digital elevation model (DEM) and geological map used in this study were provided by the Alcaldía de Manizales and the Instituto de Estudios Ambientales (IDEA) at the National University of Colombia, Manizales campus. The DEM has a spatial resolution of 5 m. The elevation ranges between 1558 to 2449 m above sea level. The city has an average temperature of 17 °C and an annual precipitation varying between 2000 to 3000 mm [35].
The city’s steep topography, combined with permeable soils derived from volcanic ash, makes it highly susceptible to landslides [36,37]. These soils facilitate rainwater infiltration and accumulation, further increasing the risk. Additionally, Manizales experiences a bimodal rainfall regime, characterized by intense, short-duration rainfalls, which heighten the likelihood of landslide events. As a result, extensive public infrastructure for land stabilization has been required to address these challenges and protect the urban population [38]. In Manizales, between 1917 and 2007, around 970 landslide events occurred, causing significant loss of life, widespread displacement, extensive damage to infrastructure, and substantial economic losses [6].
The geology of Manizales contains surface formations that represent the materials found on the surface and in many cases do not form consolidated rock of the mountain range. The urban soil of Manizales is composed of the geological units (Figure 1b) of residual soil from the gabbros of Quebrada Olivares (Kgb), residual soil from the Quebradagrande Complex (Kqd), anthropogenic fills (Lle), alluvial soil (Qal), alluvial soil from Maltería (Qam), deposits of pyroclastic fall (Qcp), volcanic ash soils (Qcv), residual soil from the Sancancio Dome (Qdsc), debris flows (Qfe), mudflows (Qfl), residual soils from the lavas of Lusitania (Qll), residual soil from the Casabianca Formation (Tscb), and residual soil from the Manizales Formation (Tsmz).

3. Methods

Physics-based models are computational tools that simulate real-world processes by applying fundamental physical laws, such as the conservation of mass, momentum, and energy. They predict system behavior by incorporating parameters like material properties, boundary conditions, and environmental factors.
In this study, TRIGRS and Scoops3D are used to predict landslides. TRIGRS models rainfall infiltration and its effects on slope stability by calculating changes in pore water pressure, while Scoops3D provides a three-dimensional analysis of slope stability, evaluating forces on potential failure surfaces.
An application of these models was conducted in the city of Manizales, Colombia, using site-specific data, including rainfall, water table levels, and soil characteristics. The models incorporated geotechnical equations for slope stability, with inputs based on hydraulic properties and hydroclimatic conditions. The First-Order Second-Moment (FOSM) method was applied for spatial probabilistic analysis, and a final landslide hazard map was produced by combining the probabilistic results for both circular and planar landslide scenarios.

3.1. TRIGRS

TRIGRS v2.0 [39] is a Fortran program designed to model the temporal and spatial distribution of rainfall-induced surface landslides. It calculates transient changes in pore pressure and their impact on the factor of safety due to rainfall infiltration. Building upon Iverson’s theoretical framework [40], TRIGRS expands to address infiltration in an unsaturated surface layer above the water table. It employs a one-dimensional infinite slope model, neglecting lateral stresses and inter-cell forces. The factor of safety is computed based on Taylor’s method [41]. Detailed information on TRIGRS is available in [39].

3.2. Scoops3D

Scoops3D v1.3.01 is an open-source software developed by the United States Geological Survey (USGS) to assess slope stability by analyzing multiple potential slip surfaces within a digital elevation model (DEM), as outlined in [42]. This program employs a three-dimensional extension of the conventional limit equilibrium method of slices, adapting the simplified Bishop method [43] for calculating the factor of safety (FS). Scoops3D conducts a detailed analysis of the forces acting on the trial surfaces, considering saturation conditions below a defined water table. The FS is calculated using an equation that evaluates cohesion, frictional forces, weight, dip angle, and pore pressure, providing a comprehensive assessment of slope stability in a three-dimensional environment.

3.3. FOSM

The First Order Second Moment (FOSM) method is a probabilistic technique based on truncated Taylor series, according to [44]. This method employs N uncorrelated random variables to represent uncertain soil parameters such as cohesion, friction angle, and unit weight. Using the objective function of the factor of safety (FS), FOSM estimates the failure probability of a geotechnical system. The mean FS and the standard deviation of FS are calculated, σ[FS], considering small variations in the random variables.
V F S = i = 1 N d F S d x i 2   V x i ,
d F S d x i = F x i + Δ x i F x i Δ x i ,
V[FS] is the variance of FS and is obtained from additional FS calculations using small variations of the random input variables (cohesion, friction angle, and soil unit weight). V x i is the variance, x i is the mean, and Δ x i is the increment, assumed as 0.1 x i , of the random variables.
The reliability index (βI) is determined by comparing the expected value of FS with the critical FS, providing a measure of system safety relative to the probability of failure. The probability of failure (Pf) is calculated using the cumulative distribution function of the standard normal variable, function N(x) in Equation (5).
β I = E F S 1 σ F S ,
σ [ F S ] =   V [ F S ] ,
P f = N   ( β I ) = 1 N   ( β I ) ,
This methodology offers an efficient approach to evaluating the reliability of geotechnical structures and engineering systems under conditions of uncertainty.

3.4. Physics-Based Rainfall Thresholds for Landslides

A physics-based methodology [45] is employed to define critical rainfall thresholds for the occurrence of shallow landslides. This approach utilizes the distributed slope stability model known as TRIGRS [39]. Multiple simulations were conducted under varying rainfall conditions, including different mean intensities and durations. The defined thresholds exhibit the following characteristics:
  • They are relatively conservative, given that they are intended for the entire urban area of Manizales, but they aim to optimize a balance between accuracy and false alarms, which is valuable for an early warning system.
  • Stability simulations are conducted considering antecedent rainfall conditions and an assumed initial groundwater level scenario prior to rainfall simulations.
  • Approximately 596 rainfall events were simulated, encompassing a range of intensities and durations. Table 1 presents the simulated rainfall durations (10 durations in total). For events with durations between 1 and 6 h, the time step size is 1 h (1 h, 2 h, 3 h, …, 6 h). For events with durations from 6 to 14 h, the time step size is 2 h (6 h, 8 h, 10 h, …, 14 h). Table 2 details the simulated mean intensities for each duration (55 intensities). Similarly, the simulated rainfall events varied in intensity from 3 to 45 mm/h with a step size of 1 mm/h (3 mm/h, 4 mm/h, 5 mm/h, …, 45 mm/h), and from 45 to 100 mm/h with a step size of 5 mm/h (45 mm/h, 50 mm/h, 55 mm/h, …, 100 mm/h).
A novelty in the calculation of rainfall thresholds was developed in this project. The methodology proposed by [46] utilizes a percentage of critical failure area (ac) to obtain the critical intensity (I) and duration (D) conditions that will be used to construct the threshold curve. However, for Manizales, we directly used an area (associated with the number of cells that fail, FS < 1.0) to obtain these critical values.
For all the factor of safety (FS) maps (approximately 596), the following values were calculated: Cells with FS < 1.0, 1.1, and 1.2, minimum FS, average FS, percentage of area with FS less than 1.0, 1.1, and 1.2. Similarly, the number of cells (and total areas) with FS < 1.0, 1.1, and 1.2 that were initially greater than 1.0, 1.1, and 1.2, respectively, were calculated. This allows for the application of the same methodology for another condition different from the critical equilibrium value (FS < 1.0), whether with 1.1 or 1.2.
For each duration, the results obtained with different intensities (organized in ascending order) allow for finding the intensity values for which the critical failure area is exceeded or reached. Interpolation is performed between the intensity values (with their respective failure areas obtained in the TRIGRS simulation) to find the intensity that would cause a selected critical failure area value. This same process was carried out for different critical failure area values to evaluate the different rainfall thresholds they represent.
The critical intensity (obtained from interpolation) and duration values associated with the critical failure area were used to fit a power curve and obtain the threshold equation, with its parameters α and β (Equation (6)).
I = α D β
where I is the average intensity, D is the duration of the rainfall event, α is a scale parameter (intercept), and β is a shape parameter that defines the slope of the power curve. For this threshold equation, a maximum duration of 10 h was selected.

4. Results

4.1. Landslide Hazard

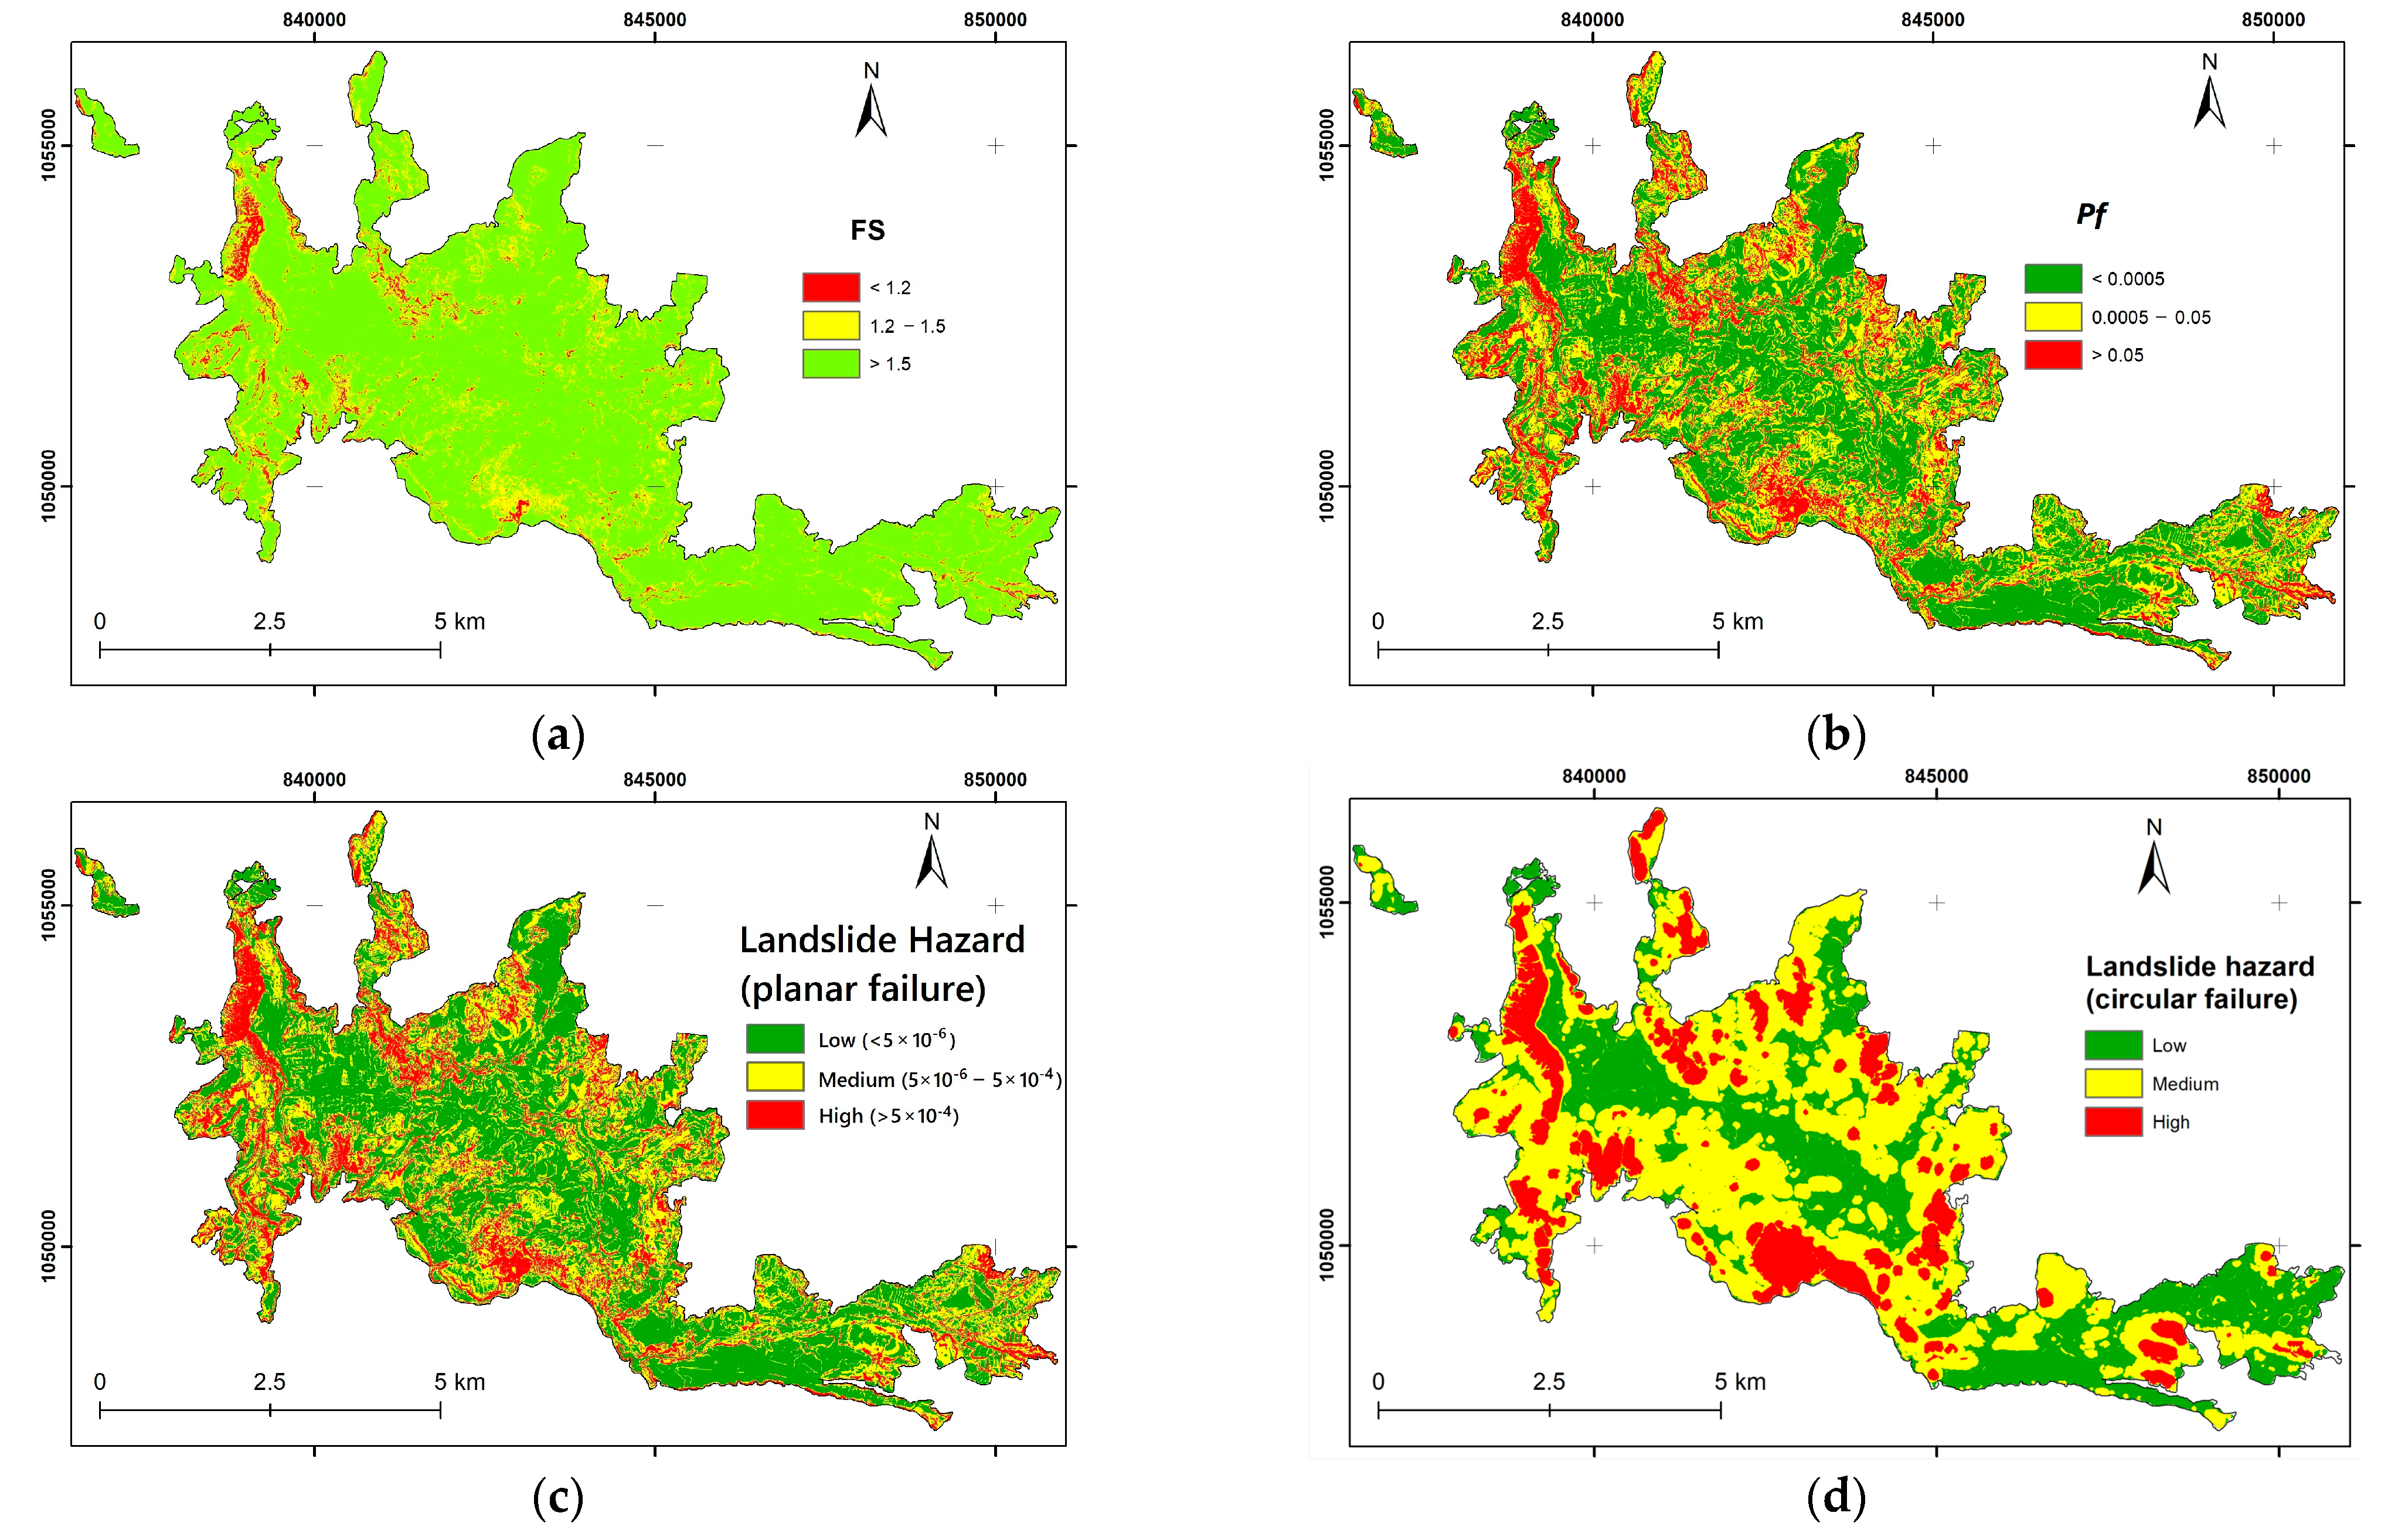
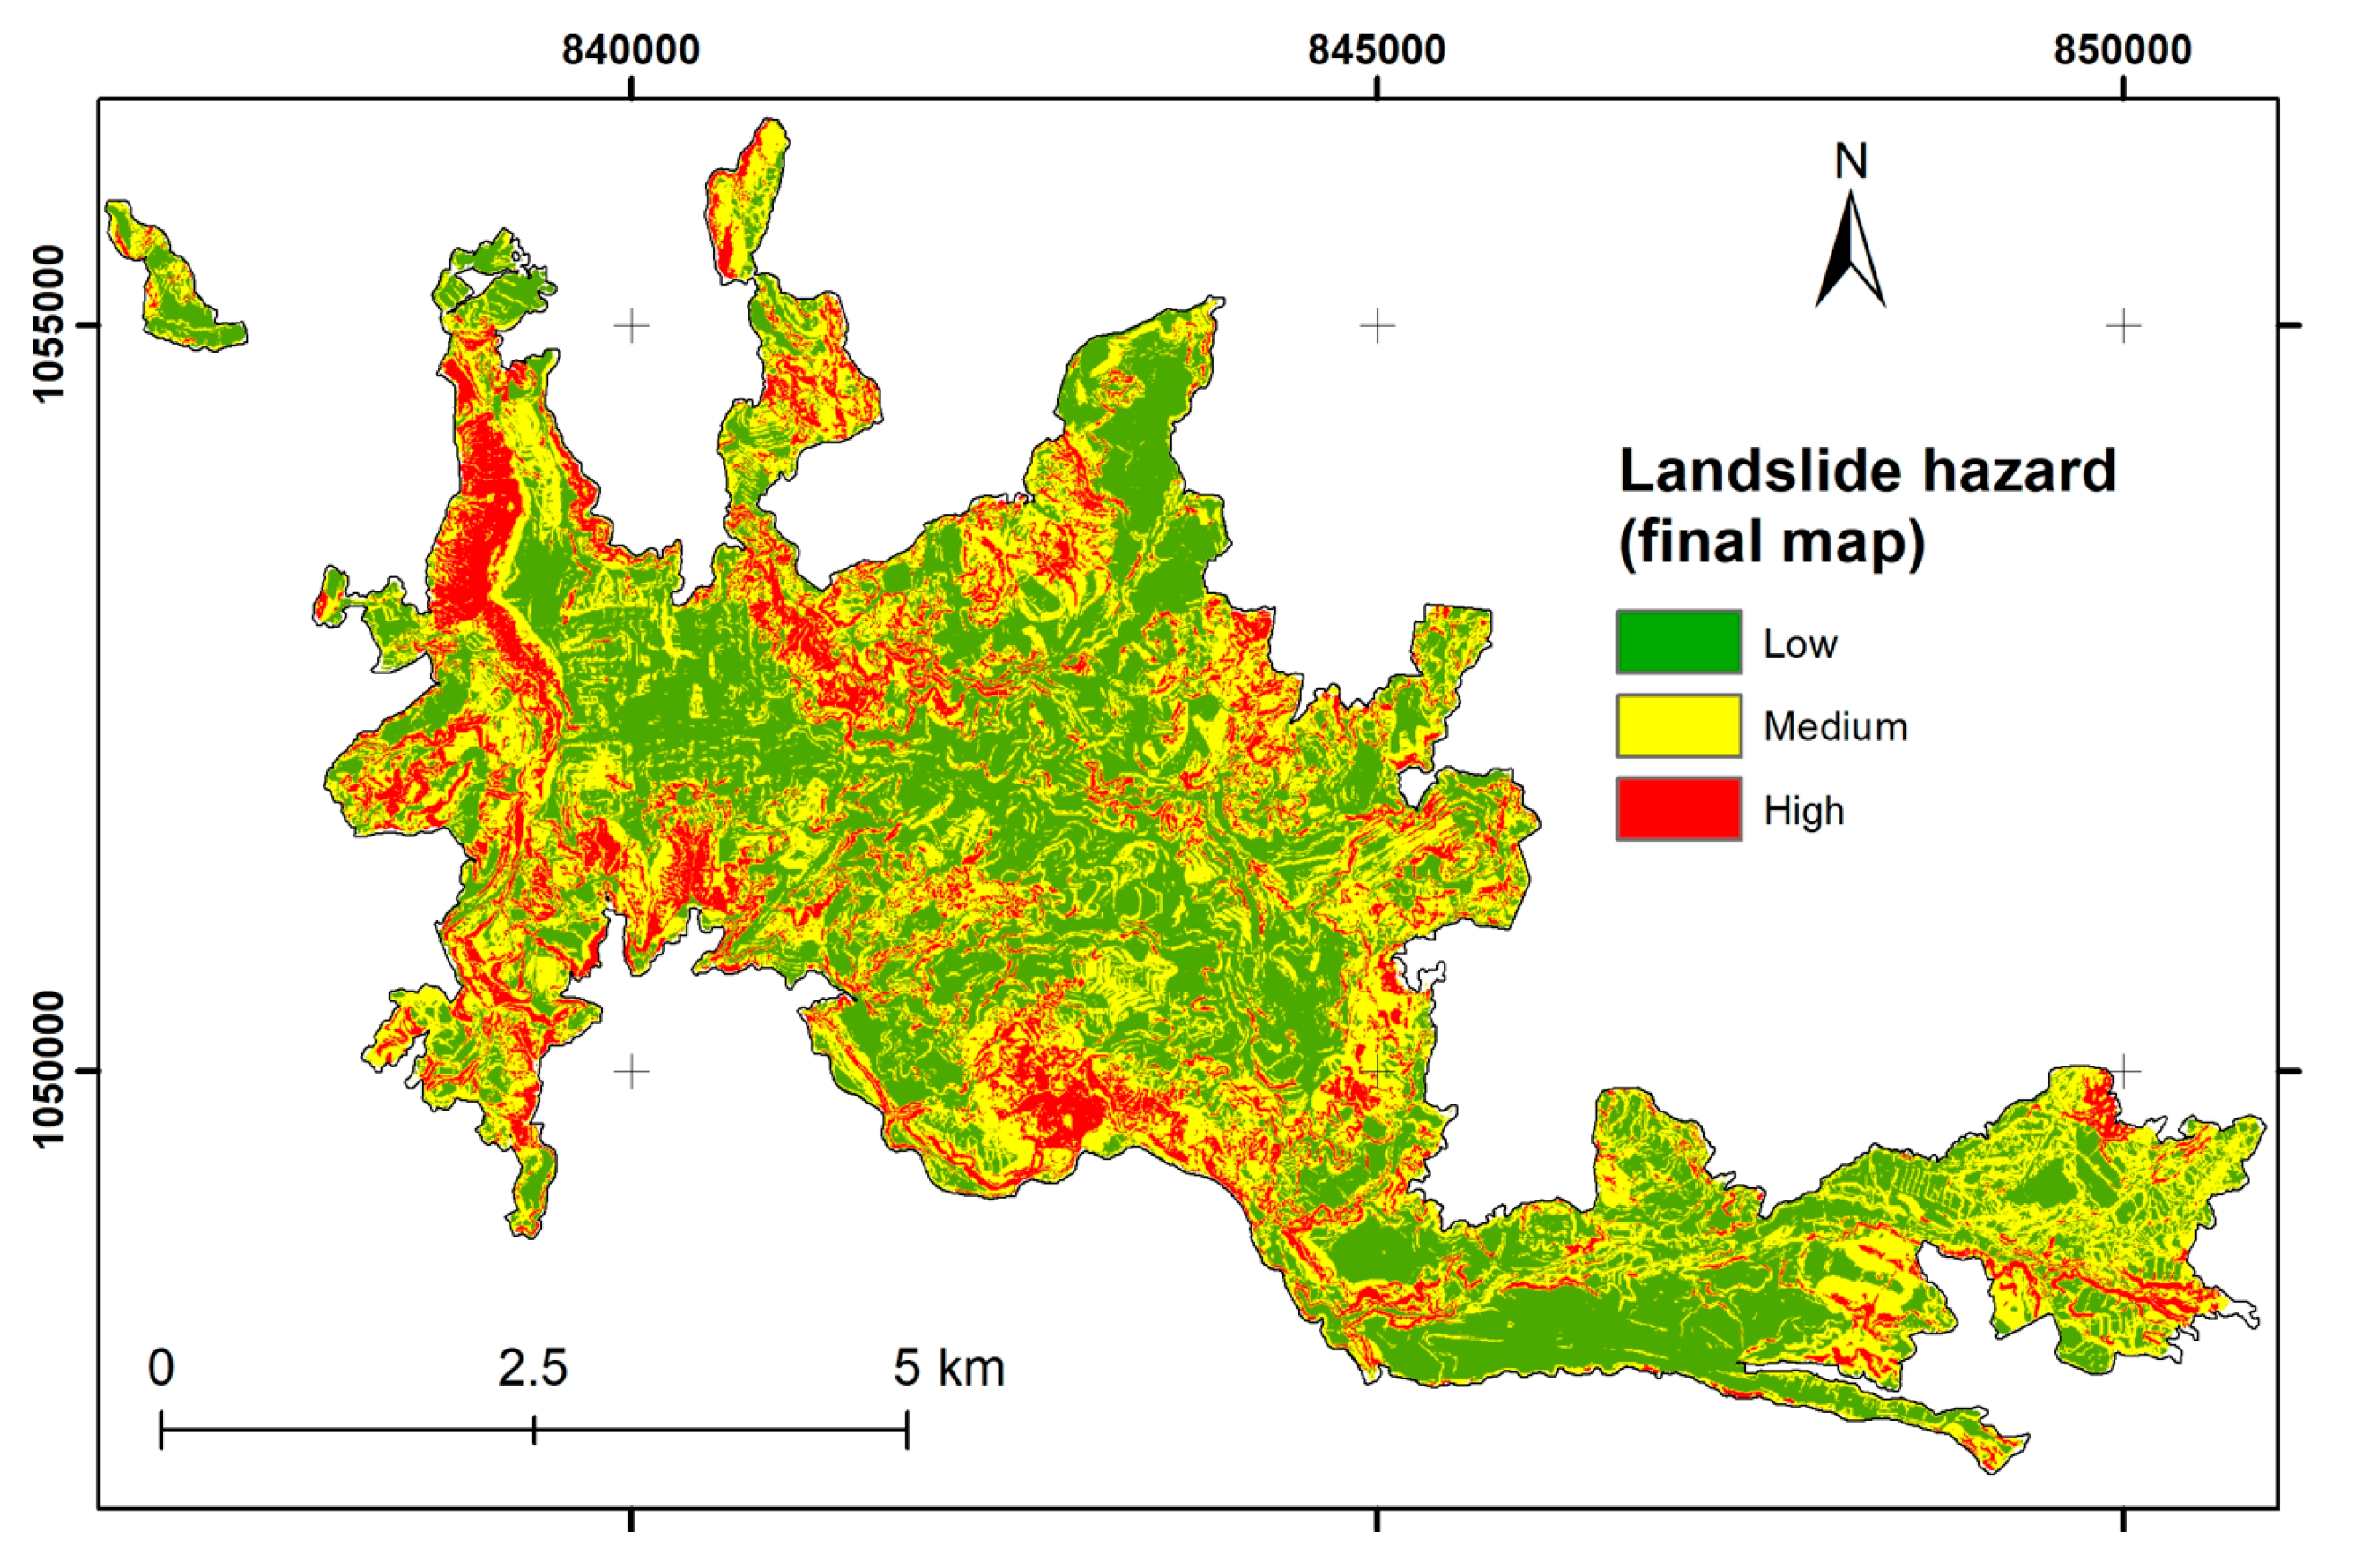
Figure 2 shows the mean factor of safety (FS, Figure 2a), failure probability (Pf, Figure 2b), and planar (Figure 2c) and circular (Figure 2d) failure landslide hazard for urban (and expansion) areas obtained using the FOSM method, considering three random variables (cohesion, friction angle, and soil unit weight). The annual probability of occurrence of the design storm for the analysis using TRIGRS is 0.01 (return period of 100 years), therefore the planar-type hazard map includes the probability of spatial and temporal occurrence. Figure 3 illustrates the combination of both scenarios through a superposition of the two landslide hazard conditions using a simple criterion: when both maps have differing hazard classifications, one level of classification is decreased from the most critical, which is justified by the conservative hazard map derived from the circular failure scenario.

4.2. Rainfall Thresholds

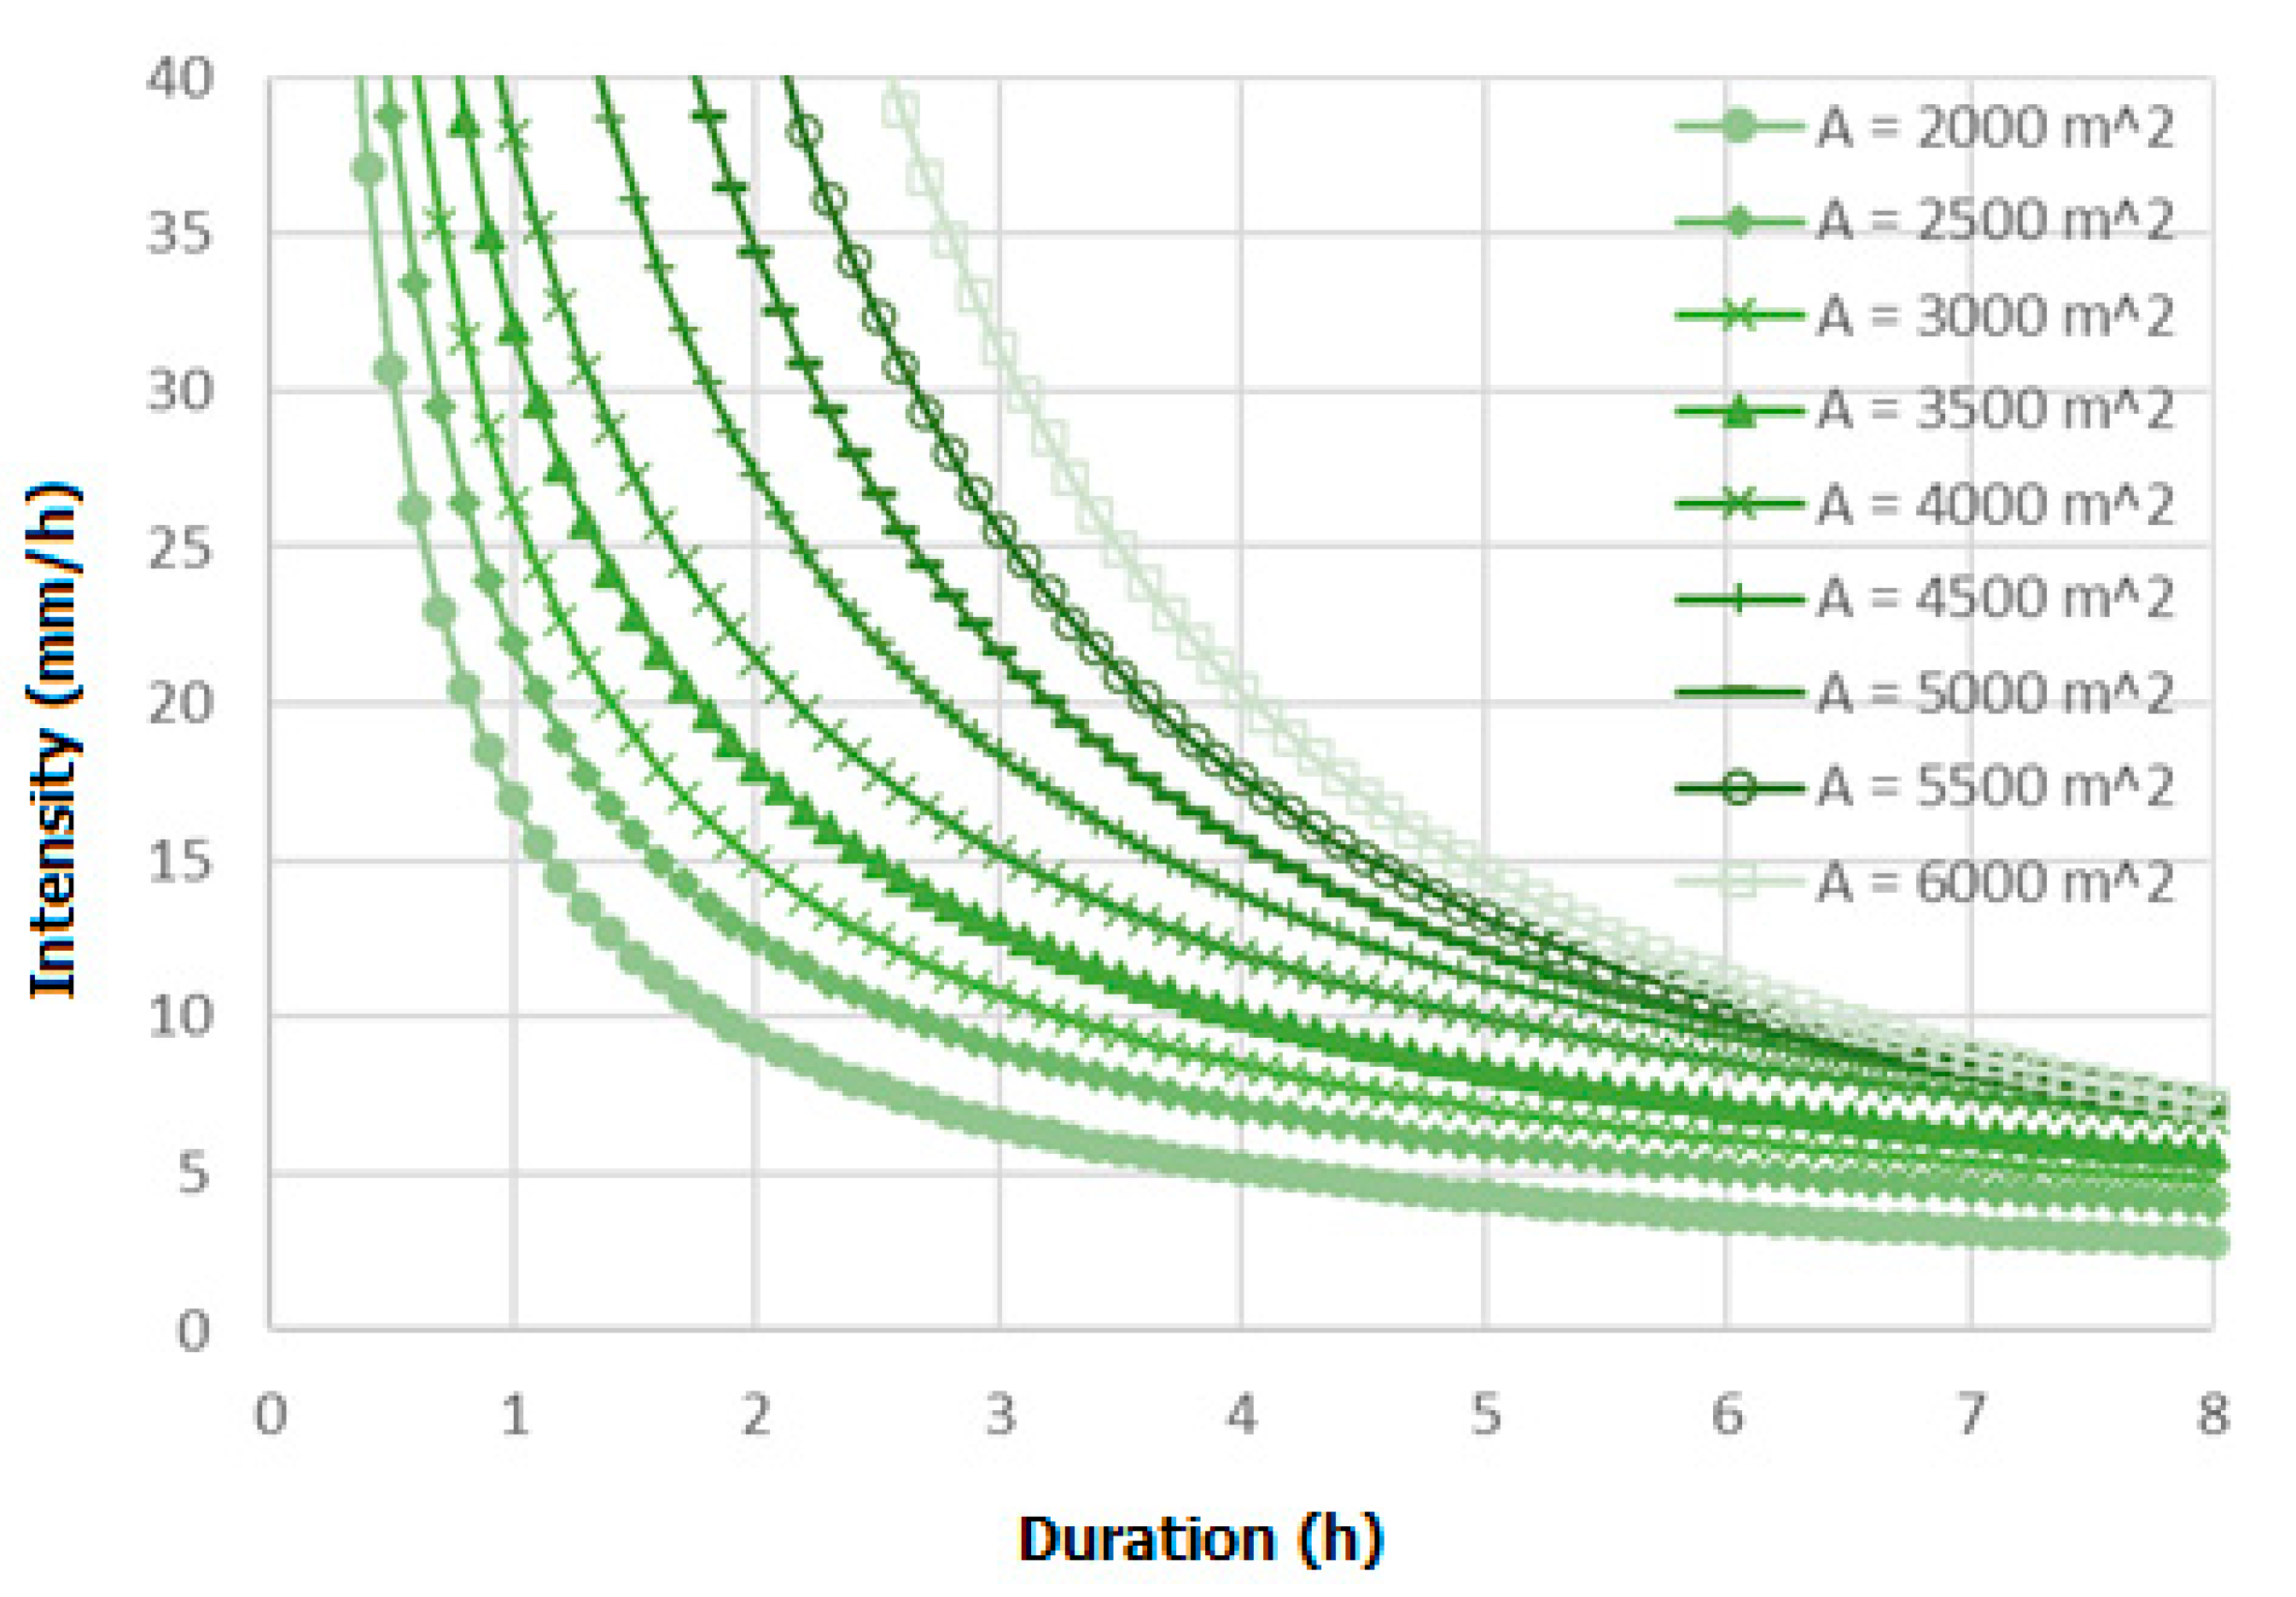
Table 3 presents the power-law equations for the constructed rainfall thresholds, while Figure 4 illustrates the corresponding power-law curves. For a pre-operational phase of the early warning system in Manizales, areas of 2000, 3000, and 4000 m2 were suggested. These areas are depicted in Figure 4, with their corresponding threshold equations provided in Table 4.
These thresholds were selected after analyzing critical rainfall thresholds defined in previous studies in the city of Manizales, rainfall thresholds defined for early warning systems in other cities around the world, and information on rainfall events that triggered mass movements in Manizales (available data).
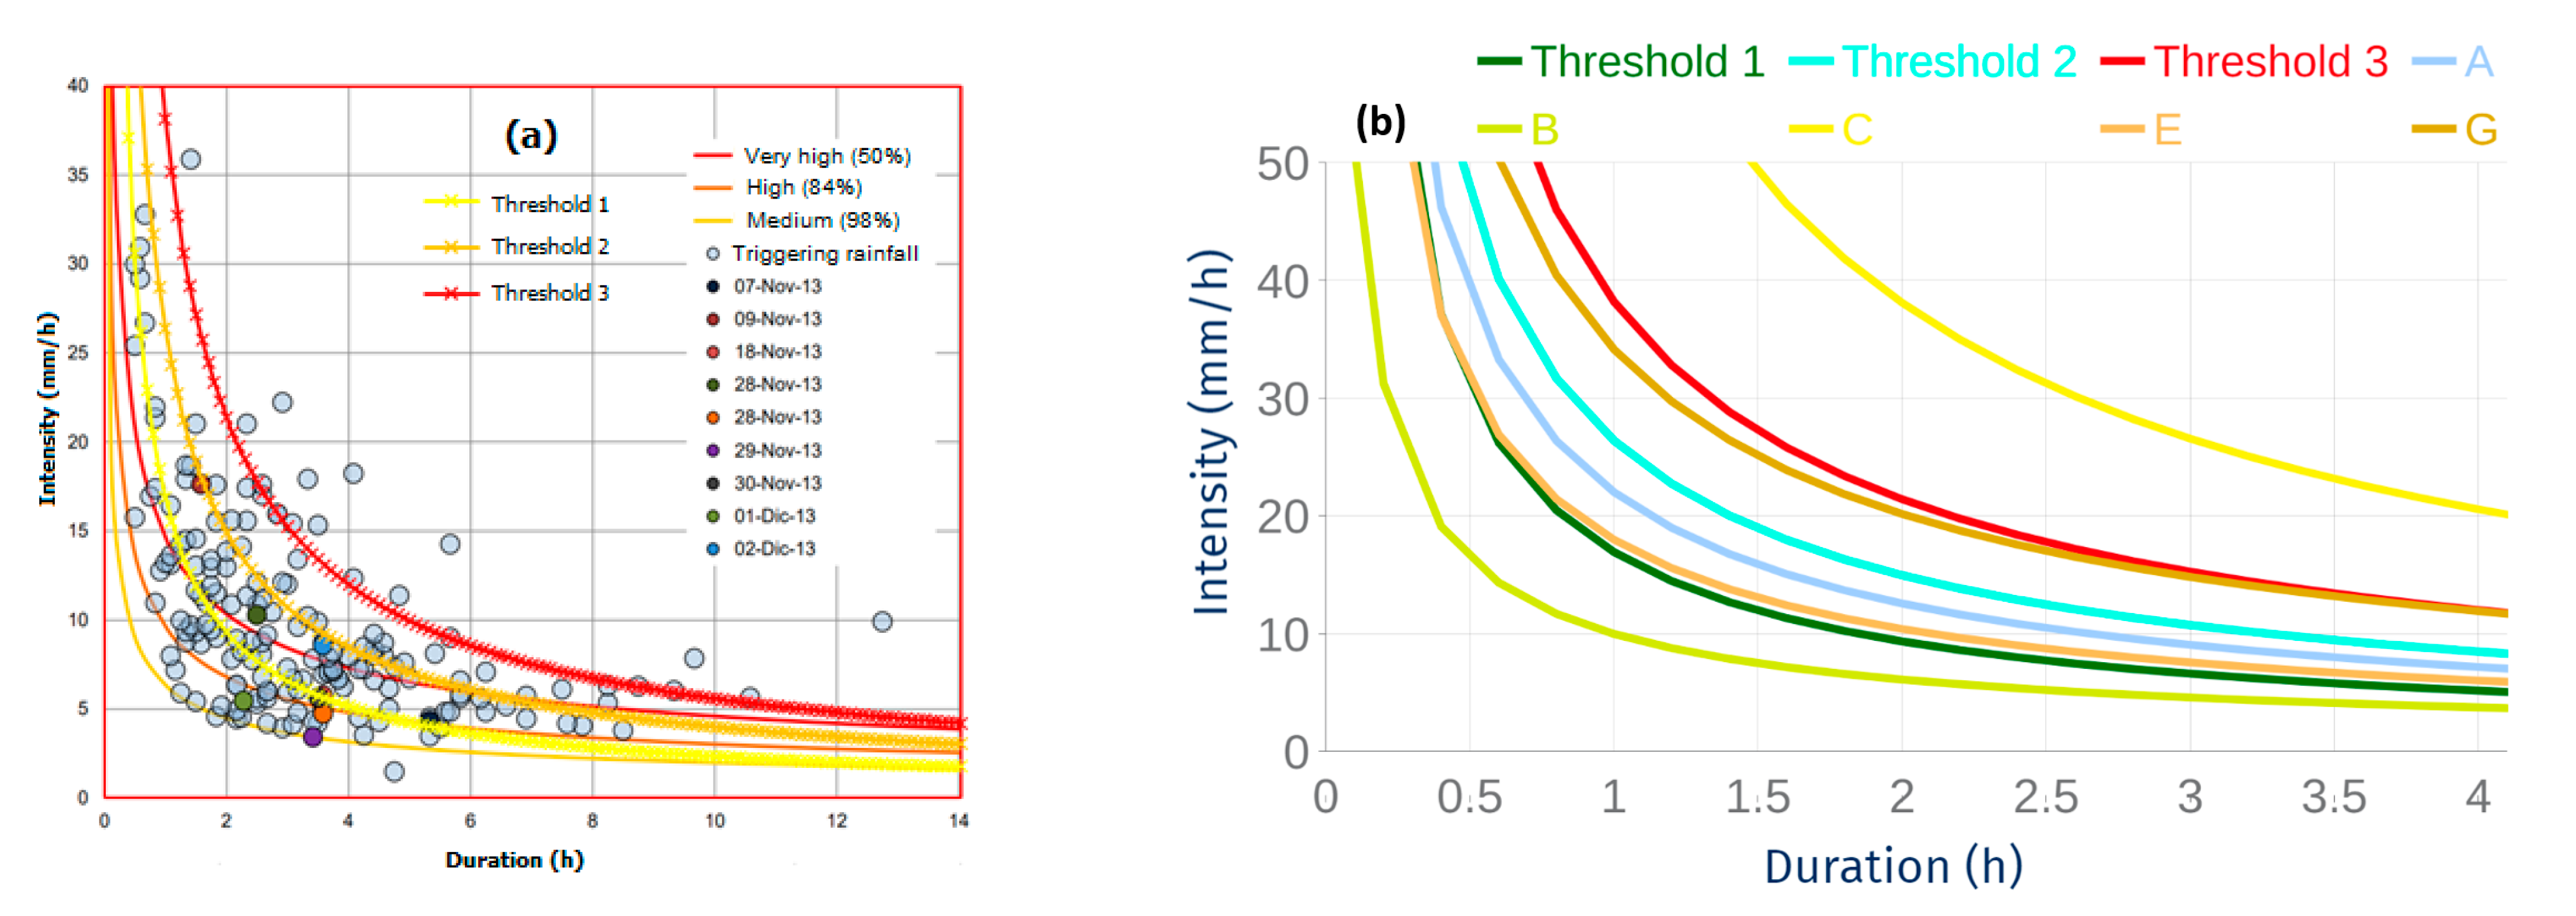
Figure 5 presents intensity and duration rainfall thresholds constructed for Manizales, developed in 2013 at the Instituto de Estudios Ambientales (Institute of Environmental Studies, in English, IDEA, Universidad Nacional de Colombia, https://idea.unal.edu.co/ (accessed on 17 September 2024)). Additionally, this figure includes intensity and duration data from rainfall events that presumably triggered landslides in Manizales. Table 5 presents the equations of those thresholds.
Lower thresholds (comparable to those called Medium, High, and Very High thresholds) were developed in previous analyses using physics-based modeling. These thresholds are considered very low to issue alerts in an early warning system (EWS). Their incorporation as an enveloping curve of all historically recorded mass movements is highly valuable within the conception of the phenomenon and the possible occurrence of mass movements under different conditions, as well as the understanding that thresholds can never eliminate false alarms or, in the worst case, false negatives (landslides that are not predicted by a threshold within the EWS). However, their implementation as an advisory level for issuing an alert must be evaluated considering their annual return period, that is, the annual probability of rainfall events that reach or exceed that threshold.
This was conducted with IDF curves for Manizales, as well as historical rainfall data recorded at stations in Manizales (for example, randomly verified at the CHEC Uribe station, 12–15 February 2020), where daily (and almost all rainfall records) exceeded the “Medium”, “High”, and “Very High” thresholds. In other words, they cannot be functional for defining advisory levels in the EWS because in almost all rainfall events (and repeatedly within the events) the thresholds are exceeded daily, since mass movements do not occur daily, nor numerous movements occurring on the same day.
Nevertheless, the need for rainfall intensity and duration (ID) thresholds leads us to propose conditions that, recognizing the limitations of not having a comprehensive inventory of mass movements and triggering intensity and duration events, fulfill a valuable function of differentiating conditions in which landslide occurrences are more likely. Therefore, the thresholds calculated using physics-based modeling and proposed for the EWS (Threshold 1, Threshold 2, and Threshold 3, equations in Table 4) are compared in Figure 5, both with the triggering rainfall events and with the aforementioned thresholds.
Figure 5b depicts the proposed rainfall thresholds for the EWS alongside those defined by Italian authors [47] for the early warning system of mass movements in the Emilia Romagna region (Italy). While they propose 3D thresholds (additional), for these ID thresholds, they calculate metric indices to evaluate their predictive capacity, including accuracy rates and false alarms. The different thresholds are for eight areas (zones) with an order of 2000–3000 km2. Additionally, in these zones, the inventory of mass movements shows very large differences (as also shown in the thresholds) in the number of historical movements, which is why the areas most prone to instability have lower thresholds (require less extreme rainfall conditions for the occurrence of mass movements). This exercise provides insight into thresholds that aim to strike a balance between accuracy (predicting the greatest number of mass movements) and false alarms (minimizing them as much as possible) in a mass movement early warning system.

5. Discussion

The proposed thresholds for the early warning system in Manizales (Table 6) enable the calculation of a critical intensity for any duration of a rainfall event. Slope stability simulations included durations of up to 14 h. Since the calculations showed very little variation in critical rainfall conditions for events lasting longer than 8 h across all thresholds, a maximum applicability limit of 10 h is proposed for the rainfall thresholds. Although the simulations indicated very little (or no) instability in cells that were initially stable for rainfall events shorter than 1 h, such events are considered highly threatening. Based on experimental evidence, such as the data presented in Figure 5, durations shorter than 1 h (starting from 0) are included in the applicability range of the constructed thresholds. Table 6 presents these thresholds, including the α and β parameters of the power-law equation, as well as specific values (for 1 h, 2 h, and 3 h) of critical intensity (Ic) calculated using the power-law equations.
The calculations presented in the preceding sections, suggested for real-time operation in the EWS, may require computational effort and programmatic development that is expected to be gradually operationalized. Similarly, the primary proposition of these thresholds is the possibility of incorporating specific thresholds for subzones of interest (whose thresholds naturally differ from those proposed for the entirety of Manizales), thus enhancing the predictive capacity of the Manizales EWS. These should be continually developed as hazard and vulnerability maps are analyzed and updated, enabling the EWS to define specific areas of interest (subzones) for incorporating these methodologies. Incorporating this information into the technological system of Manizales also requires greater efforts, which, given its importance, also prompts us to seek optimization and development proposals in line with the current operational conditions of the EWS.
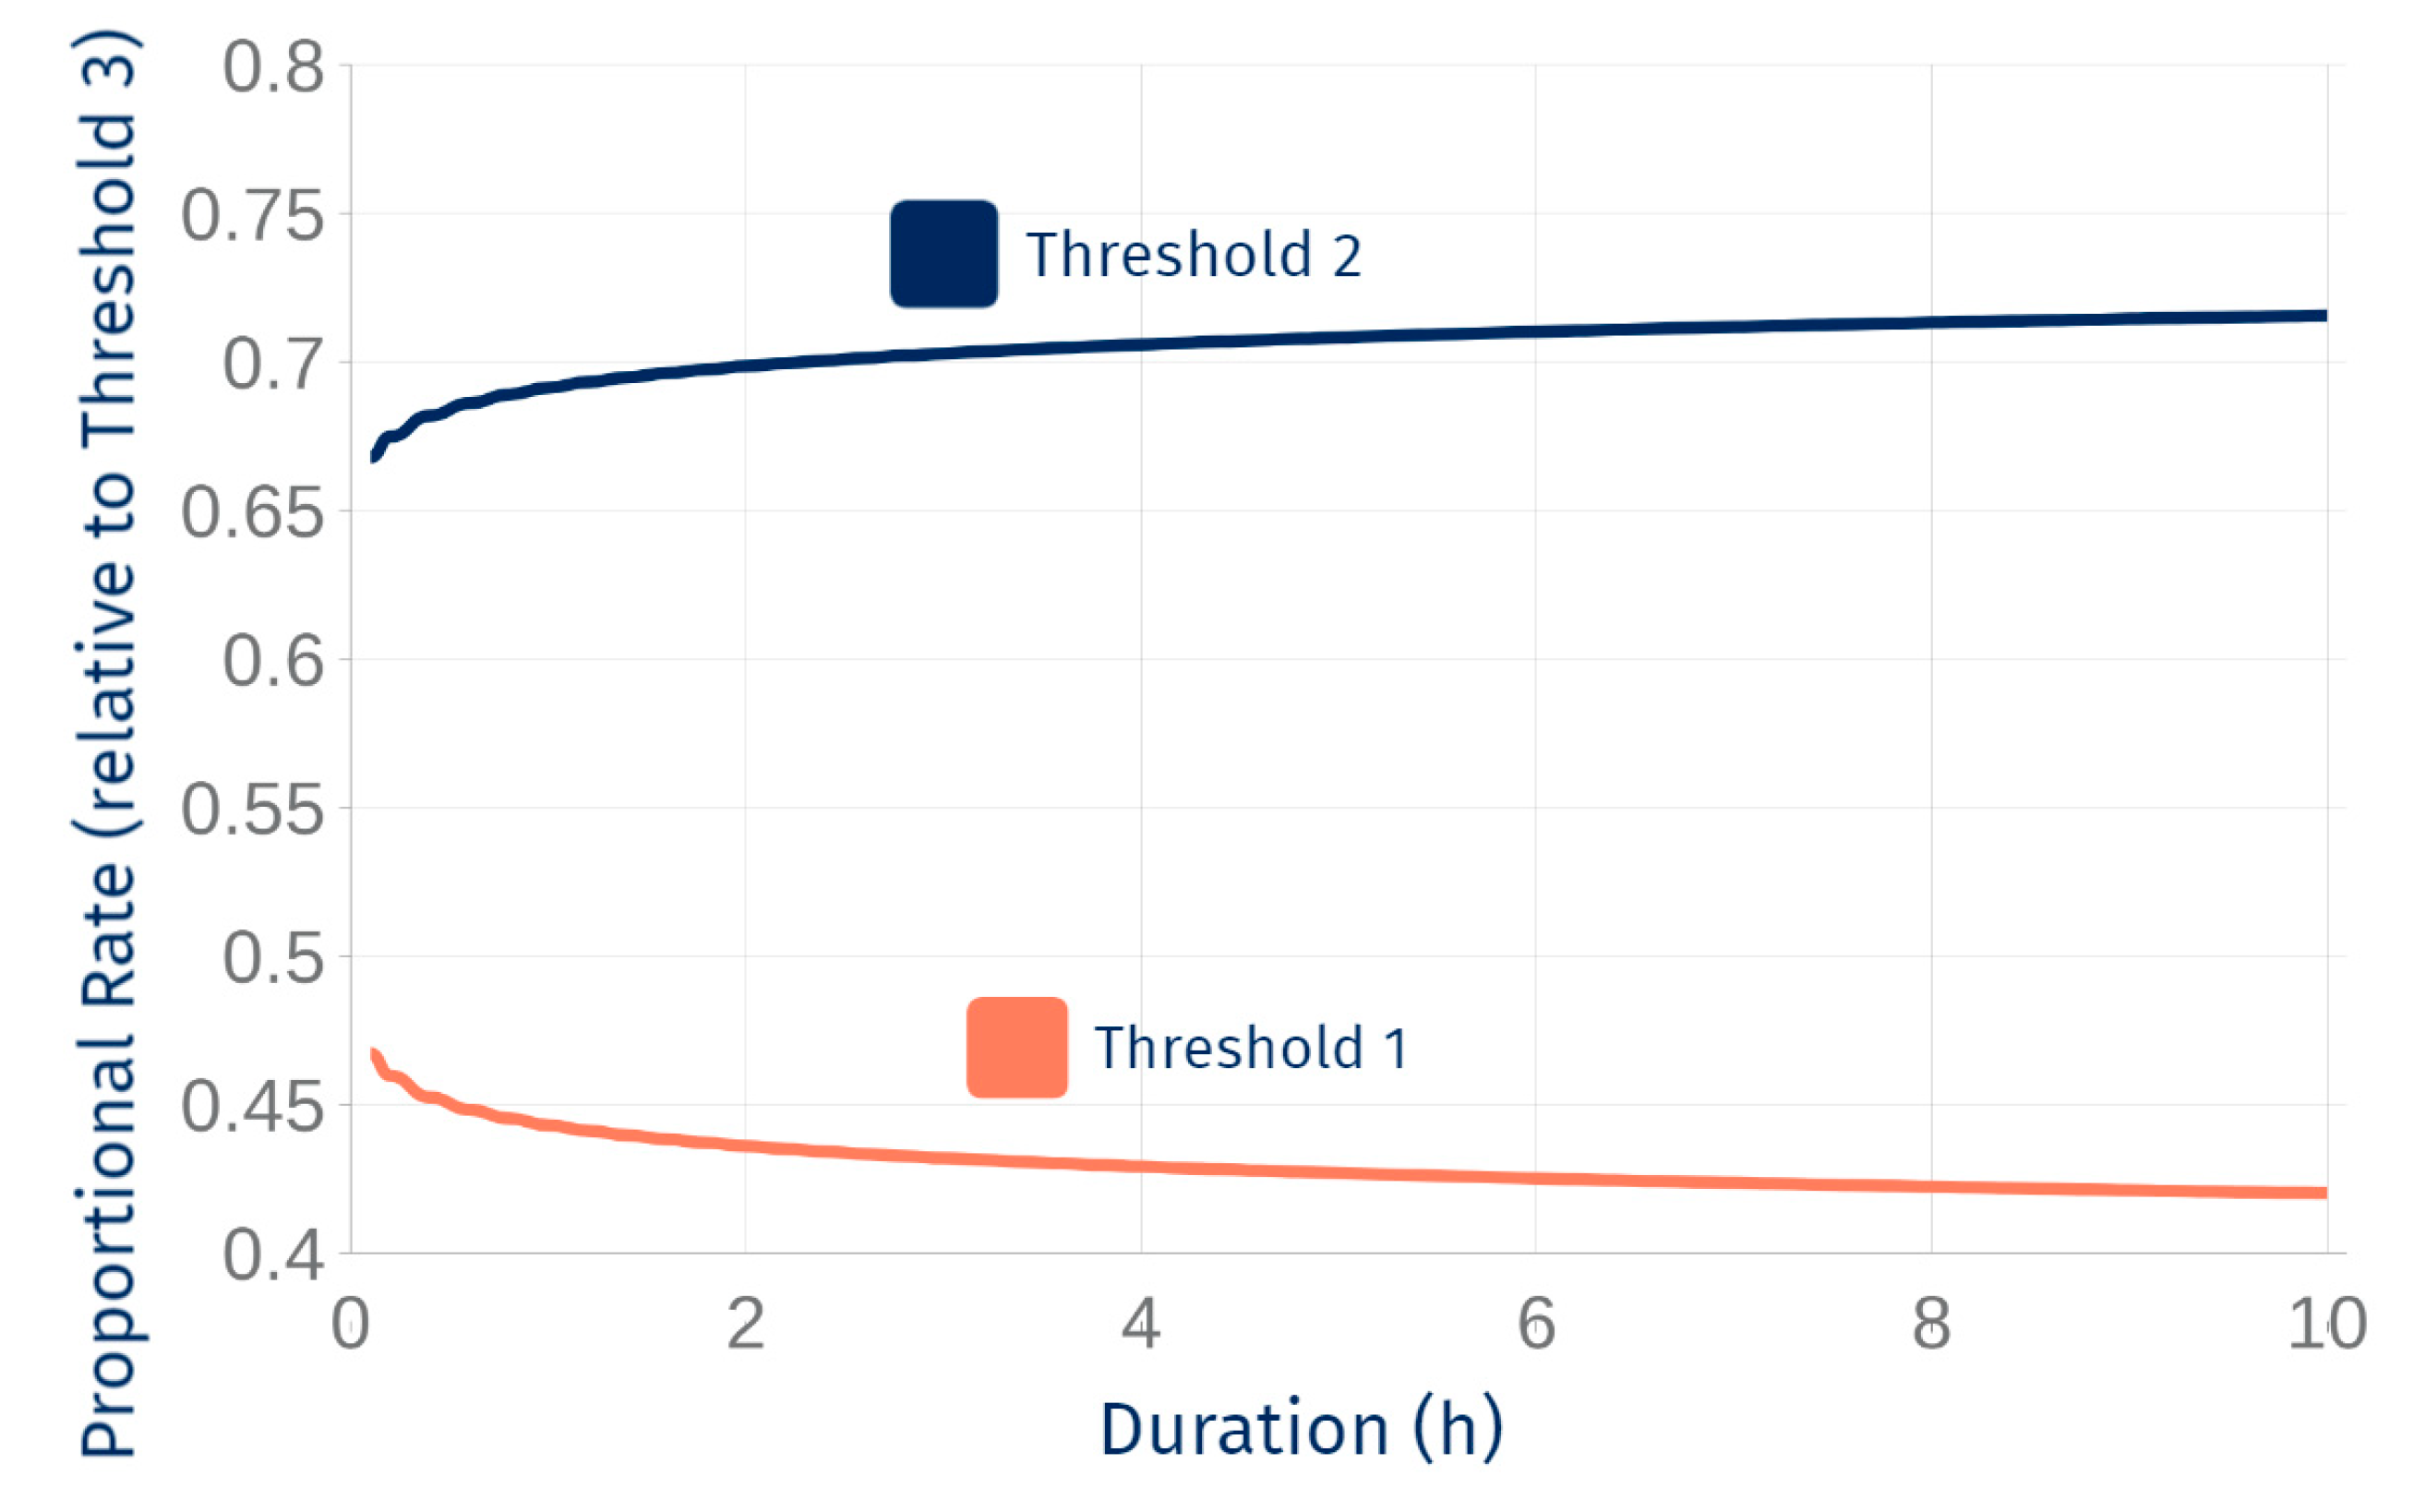
The initial proposal involves reducing the calculations by up to a third if we simplify the thresholds as a percentage of the most critical. Figure 6 illustrates the relationship between Thresholds 1 and 2 with respect to the highest threshold (Threshold 3) for the proposed 10-h duration. Even considering the first hour (which exhibits the greatest variation), the variation is relatively low, and Thresholds 1 and 2 can be simplified by calculating them as a percentage of Threshold 3 (the most conservative value between 1–10 h, in both cases):
Threshold   1 :   I c 1 = 0.42 × I c 3
Threshold   2 :   I c 2 = 0.69 × I c 3
Our study aimed to create detailed landslide hazard zoning maps for Manizales, a city in the Colombian tropical Andean mountains, using physics-based models to assess both shallow planar and deep-seated circular failures. We produced hazard maps that classify urban areas into high, medium, and low-hazard zones, providing a clear framework for understanding the landslide threat in the region. Additionally, we developed rainfall thresholds for the entire city, focusing on shallow landslides, which are critical for the city’s early warning systems. These results offer urban planners and disaster management authorities key insights for improving landslide risk mitigation strategies.
Although there has been limited research in the scientific literature on the comprehensive evaluation of both shallow and deep-seated slope instabilities [48], a key innovation of the current study is the straightforward integration of these failure mechanisms into a single hazard map. This enables risk managers and authorities to understand the holistic concept of landslide hazards without requiring extensive expertise. While the final map classification may not provide a precise numerical engineering quantity, it is frequently required in official landslide hazard assessments. Additionally, existing literature generally lacks practical solutions to this need, which is crucial for authorities and urban planning professionals responsible for managing landslide risks.
Other studies have investigated shallow and deep-seated landslides to enhance understanding of their behavior and susceptibility to triggering events. For instance, research conducted in Taiwan [49] focused on highly fractured rock formations, utilizing logistic regression and support vector machines to model landslide susceptibility. This study employed SHALSTAB, a deterministic and distributed model based on an infinite slope approach integrated with a GIS framework. Although it distinguished between shallow and deep-seated landslides based on slope angle thresholds to produce detailed susceptibility maps, SHALSTAB is fundamentally simplistic and not designed for deep-seated failures. In the Colombian Andes, TRIGRS has demonstrated better performance compared to SHALSTAB [50]. In contrast, our study employed two more complex models—TRIGRS and Scoops3D—tailored to assess each mechanism specifically, with TRIGRS accounting for those unsaturated conditions that SHALSTAB does not consider. However, our research faced data scarcity, which prevented us from implementing ROC analysis for validation, an aspect that the Taiwanese study successfully executed, underscoring the robustness of their results.
Similarly, the ALICE model [51], developed in the French South Alps, effectively integrates various types of landslides—shallow translational, rotational, and complex—while addressing uncertainties related to inherent spatial variability. This model emphasizes the necessity of calibrating parameters against observed data to enhance the accuracy of landslide susceptibility representations across extensive areas. By producing detailed susceptibility maps and considering factors such as groundwater levels and geotechnical properties, ALICE illustrates the importance of expert knowledge in refining model performance. In our research in the Colombian Andes, we adopted a similar approach by integrating shallow planar and deep-seated circular failure mechanisms using physics-based models. Our study also emphasizes the need for accurate hazard zonation maps, combining historical rainfall thresholds to inform early warning systems. While ALICE’s calibration focuses on varying geometries, our research highlights a practical framework for categorizing urban areas into risk zones based on a robust analysis of both shallow and deep-seated landslide mechanisms. Thus, both studies contribute valuable methodologies that can inform hazard mitigation strategies in different geological contexts, albeit with distinct focal points.
The hazard maps, incorporating both shallow and deep-seated failures, give local authorities a robust and practical tool for risk assessment and planning. By assigning different levels of hazard across the urban landscape, our approach enables targeted actions, enhancing resource allocation for landslide mitigation efforts. The rainfall thresholds we developed further strengthen the early warning systems by providing reliable predictions based on regional rainfall characteristics. While designed for Manizales, these physics-based slope stability methods are globally recognized and can be applied to other regions, making the approach a valuable model for improving hazard zoning and disaster readiness worldwide.
While our landslide hazard maps offer valuable insights, they do have certain limitations. First, the classification focuses exclusively on two mechanisms of failure: shallow translational slides on planar surfaces and rotational slides on circular surfaces. However, landslides can occur through various other mechanisms [52,53,54,55,56,57], such as topples, falls, and soil creep, which are not incorporated into this model. This focus may lead to an incomplete understanding of the overall hazard levels in the region.
Another limitation of this study is the scarcity of geotechnical data needed to accurately characterize the soil across the study area. While some soil descriptions exist, data on key mechanical properties, such as triaxial test results, are limited. As a result, assumptions had to be made for defining soil parameters across large geological units, introducing uncertainty into the model. The limited sample size also hinders the development of appropriate mean values and distributions for key input variables, particularly in calculating the coefficient of variability of the random input variables.
Additionally, slope stability results depend on factors like the initial water table, antecedent rainfall, and soil moisture. These variables vary across the region, and the data available are insufficient to develop distribution functions. Although the FOSM method addresses uncertainty, the lack of data limits its effectiveness in generating reliable predictions. As a result, the random input variables considered were limited to soil mechanical properties.
The TRIGRS model, while useful for simulating shallow landslides triggered by rainfall, assumes homogeneous soil layers and relies on simplified 1D infiltration, which may not capture the geological complexity of the area. Scoops3D, although effective for deep-seated failures, does not simulate rainfall events as TRIGRS does, and requires accurate groundwater data. Its reliance on consistent groundwater conditions can limit its precision in regions with highly variable subsurface water levels. Both models depend heavily on accurate input data, which are scarce, making reliable predictions difficult across large regions lacking detailed geotechnical investigations.
To enhance the effectiveness of our hazard assessments, future research could explore these other landslide mechanisms in greater depth. Investigating long-term factors influencing slope stability, such as weathering, vegetation changes, and anthropogenic activities, could yield a more comprehensive understanding of slope stability mechanisms [58]. Additionally, analyzing the impact of transport infrastructure on slope stability, particularly its effects on drainage patterns and erosion, would provide valuable insights. Expanding research efforts in these areas may lead to improved hazard maps and more effective risk mitigation strategies in the future.
The implementation of physics-based models, specifically the TRIGRS model for planar failures and the Scoops3D model for circular failures, proves effective for zoning hazards associated with both shallow and deep-seated landslides. The probabilistic First-Order Second-Moment (FOSM) method emerges as a straightforward yet suitable option for regional zonation analysis. While the TRIGRS model easily integrates with FOSM, it may also be compatible with more advanced probabilistic methods such as the First-Order Reliability Method (FORM), Second-Order Reliability Method (SORM), or Monte Carlo simulations. Conversely, the Scoops3D model remains robust but is more challenging to couple with these complex probabilistic approaches, particularly over larger areas. Overall, the methodology presented in this research is both practical and valuable for assessing landslide hazards.

6. Conclusions

The main contributions of this study are as follows:
  • Three rainfall intensity-duration thresholds for shallow landslides in the urban areas of Manizales were developed using the physics-based TRIGRS model, based on 596 simulations under various rainfall scenarios. These thresholds were compared to recorded rainfall events that triggered mass movements, ensuring a reliable foundation for their establishment.
  • The TRIGRS model for planar failures and the Scoops3D model for circular failures effectively assessed and zoned hazards associated with both shallow and deep-seated landslides. The probabilistic First-Order Second-Moment (FOSM) method was identified as a straightforward approach for regional zonation analysis, integrating seamlessly with the TRIGRS model.
  • Power-law equations were introduced to simplify the advisory levels for rainfall thresholds, proposed for implementation in the Manizales Early Warning System (EWS), thereby enhancing computational efficiency.
  • The findings provide valuable insights for improving early warning systems and hazard mitigation strategies, contributing to more effective disaster management practices in landslide-prone regions.

Author Contributions

Conceptualization, R.J.M. and J.Z.; methodology, R.J.M. and E.F.G.; software, R.J.M. and J.C.M.-S.; validation, R.J.M., J.E.M. and B.Z.; formal analysis, R.J.M. and J.E.M.; investigation, R.J.M., J.C.M.-S. and J.E.M.; resources, R.J.M. and J.Z.; data curation, R.J.M. and J.E.M.; writing—original draft preparation, R.J.M.; writing—review and editing, R.J.M. and E.F.G.; visualization, R.J.M.; supervision, R.J.M., E.F.G. and J.Z.; project administration, R.J.M. and J.Z.; funding acquisition, R.J.M. and J.Z. All authors have read and agreed to the published version of the manuscript.

Funding

This research received no external funding.

Data Availability Statement

The data supporting the findings of this study can be obtained from the corresponding author, R.J.M., upon reasonable request.

Conflicts of Interest

The authors declare no conflict of interest.

References

  1. Froude, M.J.; Petley, D.N. Global fatal landslide occurrence from 2004 to 2016. Nat. Hazards Earth Syst. Sci. 2018, 18, 2161–2181. [Google Scholar] [CrossRef]
  2. Gariano, S.L.; Guzzetti, F. Landslides in a changing climate. Earth Sci. Rev. 2016, 162, 227–252. [Google Scholar] [CrossRef]
  3. Aristizábal, E.; Sánchez, O. Spatial and temporal patterns and the socioeconomic impacts of landslides in the tropical and mountainous Colombian Andes. Disasters 2020, 44, 596–618. [Google Scholar] [CrossRef]
  4. Garcia-Delgado, H.; Petley, D.N.; Bermúdez, M.A.; Sepúlveda, S.A. Fatal landslides in Colombia (from historical times to 2020) and their socio-economic impacts. Landslides 2022, 19, 1689–1716. [Google Scholar] [CrossRef]
  5. Grima, N.; Edwards, D.; Edwards, F.; Petley, D.; Fisher, B. Landslides in the Andes: Forests can provide cost-effective landslide regulation services. Sci. Total Environ. 2020, 745, 141128. [Google Scholar] [CrossRef]
  6. Henao-Céspedes, V.; Garcés-Gómez, Y.A.; Olaya, M.N.M. Landslide early warning systems: A perspective from the internet of things. Int. J. Electr. Comput. Eng. 2023, 13, 2214–2222. [Google Scholar] [CrossRef]
  7. Zambrano-Nájera, J.; Luna, C.C.; Upegui, J.J.V. Performance assessment of indicators of a multi-hazards early warning system in an urban mountain region. Int. J. Disaster Risk Reduct. 2024, 112, 104767. [Google Scholar] [CrossRef]
  8. Pereira, S.; Santos, P.; Zêzere, J.; Tavares, A.; Garcia, R.; Oliveira, S. A landslide risk index for municipal land use planning in Portugal. Sci. Total Environ. 2020, 735, 139463. [Google Scholar] [CrossRef]
  9. Das, S.; Pandit, K.; Sarkar, S.; Kanungo, D.P. Stability and Hazard Assessment of the Progressive Zero Landslide in the Kalimpong Region of Darjeeling Himalaya, India. Geotech. Geol. Eng. 2024, 42, 1693–1709. [Google Scholar] [CrossRef]
  10. Oguz, E.A.; Depina, I.; Myhre, B.; Devoli, G.; Rustad, H.; Thakur, V. IoT-based hydrological monitoring of water-induced landslides: A case study in central Norway. Bull. Eng. Geol. Environ. 2022, 81, 217. [Google Scholar] [CrossRef]
  11. Panchal, S.; Shrivastava, A.K. Landslide hazard assessment using analytic hierarchy process (AHP): A case study of National Highway 5 in India. Ain Shams Eng. J. 2022, 13, 101626. [Google Scholar] [CrossRef]
  12. Sannino, G.; Bordoni, M.; Bittelli, M.; Meisina, C.; Tomei, F.; Valentino, R. Deterministic Physically Based Distributed Models for Rainfall-Induced Shallow Landslides. Geosciences 2024, 14, 255. [Google Scholar] [CrossRef]
  13. Zhang, L.; Zhang, R.; Dou, J.; Hou, S.; Xiang, Z.; Wang, H.; Yang, P.; Liu, X. Advancing reservoir landslide stability assessment via TS-InSAR and airborne LiDAR observations in the Daping landslide group, Three Gorges Reservoir Area, China. Landslides 2024, 1–20. [Google Scholar] [CrossRef]
  14. Devoli, G.; Tiranti, D.; Cremonini, R.; Sund, M.; Boje, S. Comparison of landslide forecasting services in Piedmont (Italy) and Norway, illustrated by events in late spring 2013. Nat. Hazards Earth Syst. Sci. 2018, 18, 1351–1372. [Google Scholar] [CrossRef]
  15. Park, J.Y.; Lee, S.R.; Lee, D.H.; Kim, Y.T.; Lee, J.S. A regional-scale landslide early warning methodology applying statistical and physically based approaches in sequence. Eng. Geol. 2019, 260, 105193. [Google Scholar] [CrossRef]
  16. Piciullo, L.; Abraham, M.T.; Drøsdal, I.N.; Paulsen, E.S. An operational IoT-based slope stability forecast using a digital twin. Environ. Model. Softw. 2024, 183, 106228. [Google Scholar] [CrossRef]
  17. Cui, H.; Medina, V.; Hürlimann, M.; Ji, J. Fast physically-based probabilistic modelling of rainfall-induced shallow landslide susceptibility at the regional scale considering geotechnical uncertainties and different hydrological conditions. Comput. Geotech. 2024, 172, 106400. [Google Scholar] [CrossRef]
  18. Gupta, K.; Satyam, N.; Gupta, V. Probabilistic physical modelling and prediction of regional seismic landslide hazard in Uttarakhand state (India). Landslides 2023, 20, 901–912. [Google Scholar] [CrossRef]
  19. Montrasio, L.; Valentino, R. A model for triggering mechanisms of shallow landslides. Nat. Hazards Earth Syst. Sci. 2008, 8, 1149–1159. [Google Scholar] [CrossRef]
  20. Marin, R.J.; Mattos, J. Physically-based landslide susceptibility analysis using Monte Carlo simulation in a tropical mountain basin. Georisk Assess. Manag. Risk Eng. Syst. Geohazards 2020, 14, 192–205. [Google Scholar] [CrossRef]
  21. Zeng, T.; Gong, Q.; Wu, L.; Zhu, Y.; Yin, K.; Peduto, D. Double-index rainfall warning and probabilistic physically based model for fast-moving landslide hazard analysis in subtropical-typhoon area. Landslides 2024, 21, 753–773. [Google Scholar] [CrossRef]
  22. Alvioli, M.; Melillo, M.; Guzzetti, F.; Rossi, M.; Palazzi, E.; von Hardenberg, J.; Brunetti, M.T.; Peruccacci, S. Implications of climate change on landslide hazard in Central Italy. Sci. Total Environ. 2018, 630, 1528–1543. [Google Scholar] [CrossRef] [PubMed]
  23. Papa, M.N.; Medina, V.; Ciervo, F.; Bateman, A. Derivation of critical rainfall thresholds for shallow landslides as a tool for debris flow early warning systems. Hydrol. Earth Syst. Sci. 2013, 17, 4095–4107. [Google Scholar] [CrossRef]
  24. Sannino, G.; Tomei, F.; Bittelli, M.; Bordoni, M.; Meisina, C.; Valentino, R. Implementation of a slope stability method in the CRITERIA-1D agro-hydrological modeling scheme. Landslides 2024, 1–20. [Google Scholar] [CrossRef]
  25. Bordoni, M.; Vivaldi, V.; Giarola, A.; Valentino, R.; Bittelli, M.; Meisina, C. Comparison between mechanical and hydrological reinforcement effects of cultivated plants on shallow slope stability. Sci. Total Environ. 2024, 912, 168999. [Google Scholar] [CrossRef]
  26. Guzzetti, F.; Gariano, S.L.; Peruccacci, S.; Brunetti, M.T.; Marchesini, I.; Rossi, M.; Melillo, M. Geographical landslide early warning systems. Earth-Sci. Rev. 2020, 200, 102973. [Google Scholar] [CrossRef]
  27. Marin, R.J.; Marin-Sanchez, J.C. LandScient_EWS: Real-Time Monitoring of Rainfall Thresholds for Landslide Early Warning-A Case Study in the Colombian Andes. J. Eng. Geol. 2024, 34, 173–191. [Google Scholar] [CrossRef]
  28. Guzzetti, F.; Peruccacci, S.; Rossi, M.; Stark, C.P. The rainfall intensity–duration control of shallow landslides and debris flows: An update. Landslides 2008, 5, 3–17. [Google Scholar] [CrossRef]
  29. Intrieri, E.; Carlà, T.; Gigli, G. Forecasting the time of failure of landslides at slope-scale: A literature review. Earth-Sci. Rev. 2019, 193, 333–349. [Google Scholar] [CrossRef]
  30. Monsieurs, E.; Dewitte, O.; Demoulin, A. A susceptibility-based rainfall threshold approach for landslide occurrence. Nat. Hazards Earth Syst. Sci. 2019, 19, 775–789. [Google Scholar] [CrossRef]
  31. Palau, R.M.; Berenguer, M.; Hürlimann, M.; Sempere-Torres, D. Implementation of hydrometeorological thresholds for regional landslide warning in Catalonia (NE Spain). Landslides 2023, 20, 2039–2054. [Google Scholar] [CrossRef]
  32. Segoni, S.; Piciullo, L.; Gariano, S.L. A review of the recent literature on rainfall thresholds for landslide occurrence. Landslides 2018, 15, 1483–1501. [Google Scholar] [CrossRef]
  33. Alvioli, M.; Loche, M.; Jacobs, L.; Grohmann, C.H.; Abraham, M.T.; Gupta, K.; Satyam, N.; Scaringi, G.; Bornaetxea, T.; Rossi, M.; et al. A benchmark dataset and workflow for landslide susceptibility zonation. Earth-Sci. Rev. 2024, 258, 104927. [Google Scholar] [CrossRef]
  34. Marin, R.J. Physically based and distributed rainfall intensity and duration thresholds for shallow landslides. Landslides 2020, 17, 2907–2917. [Google Scholar] [CrossRef]
  35. Londoño Grajales, F.J. Sostenibilidad Ambiental y Resistencia al Cortante Tangencial en Suelos Derivados de Cenizas Volcánicas y rocas Metamórficas de Zonas de ladera de la Ciudad de Manizales-Caldas. Master’s Thesis, Universidad Nacional de Colombia, Bogotá, Colombia, 2020. [Google Scholar]
  36. Bernal, G.A.; Salgado-Gálvez, M.A.; Zuloaga, D.; Tristancho, J.; González, D.; Cardona, O.-D. Integration of Probabilistic and Multi-Hazard Risk Assessment Within Urban Development Planning and Emergency Preparedness and Response: Application to Manizales, Colombia. Int. J. Disaster Risk Sci. 2017, 8, 270–283. [Google Scholar] [CrossRef]
  37. Correa, O.; García, F.; Bernal, G.; Cardona, O.D.; Rodriguez, C. Early warning system for rainfall-triggered landslides based on real-time probabilistic hazard assessment. Nat. Hazards 2020, 100, 345–361. [Google Scholar] [CrossRef]
  38. Carreño, M.L.; Cardona, O.-D.; Barbat, A.H.; Suarez, D.C.; Perez, M.d.P.; Narvaez, L. Holistic Disaster Risk Evaluation for the Urban Risk Management Plan of Manizales, Colombia. Int. J. Disaster Risk Sci. 2017, 8, 258–269. [Google Scholar] [CrossRef]
  39. Baum, R.L.; Savage, W.Z.; Godt, J.W. TRIGRS: A Fortran Program for Transient Rainfall Infiltration and Grid-Based Regional Slope-Stability Analysis, Version 2.0; US Geological Survey: Reston, VA, USA, 2008; p. 75. [Google Scholar]
  40. Iverson, R.M. Landslide triggering by rain infiltration. Water Resour. Res. 2000, 36, 1897–1910. [Google Scholar] [CrossRef]
  41. Taylor, D.W. Fundamentals of Soil Mechanics. Soil Sci. 1948, 66, 161. [Google Scholar] [CrossRef]
  42. Reid, M.E.; Christian, S.B.; Brien, D.L.; Henderson, S.T. Scoops3D: Software to Analyze 3D Slope Stability throughout a Digital landscape; Book 14, Chapter A1; US Geological Survey: Reston, VA, USA, 2015; 218p. [Google Scholar] [CrossRef]
  43. Hungr, O. An extension of Bishop’s simplified method of slope stability analysis to three dimensions. Geotechnique 1987, 37, 113–117. [Google Scholar] [CrossRef]
  44. Baecher, G.B.; Christian, J.T. Reliability and Statistics in Geotechnical Engineering; John Wiley and Sons Ltd.: Chichester, UK, 2003; ISBN 978-0-470-87125-6. [Google Scholar]
  45. Marin, R.J.; Velásquez, M.F.; García, E.F.; Alvioli, M.; Aristizábal, E. Assessing two methods of defining rainfall intensity and duration thresholds for shallow landslides in data-scarce catchments of the Colombian Andean Mountains. Catena 2021, 206, 105563. [Google Scholar] [CrossRef]
  46. Marin, R.J.; Velásquez, M.F. Influence of hydraulic properties on physically modelling slope stability and the definition of rainfall thresholds for shallow landslides. Geomorphology 2020, 351, 106976. [Google Scholar] [CrossRef]
  47. Rosi, A.; Segoni, S.; Canavesi, V.; Monni, A.; Gallucci, A.; Casagli, N. Definition of 3D rainfall thresholds to increase operative landslide early warning system performances. Landslides 2021, 18, 1045–1057. [Google Scholar] [CrossRef]
  48. Marin, R.J.; Long, M. 2D and 3D numerical modelling for preliminary assessment of long-term deterioration in Irish glacial till geotechnical slopes. Georisk Assess. Manag. Risk Eng. Syst. Geohazards 2024, 1–27. [Google Scholar] [CrossRef]
  49. Shou, K.-J.; Chen, J. On the rainfall induced deep-seated and shallow landslide hazard in Taiwan. Eng. Geol. 2021, 288, 106156. [Google Scholar] [CrossRef]
  50. Marin, R.J.; García, E.F.; Aristizábal, E. Assessing the effectiveness of TRIGRS for predicting unstable areas in a tropical mountain basin (Colombian Andes). Geotech. Geol. Eng. 2021, 39, 2329–2346. [Google Scholar] [CrossRef]
  51. Vandromme, R.; Thiery, Y.; Bernardie, S.; Sedan, O. ALICE (Assessment of Landslides Induced by Climatic Events): A single tool to integrate shallow and deep landslides for susceptibility and hazard assessment. Geomorphology 2020, 367, 107307. [Google Scholar] [CrossRef]
  52. Crescenzo, L.; Peranić, J.; Arbanas, Ž.; Calvello, M. An approach to calibrate the unsaturated hydraulic properties of a soil through numerical modelling of a small-scale slope model exposed to rainfall. Acta Geotech. 2024, 19, 4437–4456. [Google Scholar] [CrossRef]
  53. Dini, B.; Manconi, A.; Loew, S. Investigation of slope instabilities in NW Bhutan as derived from systematic DInSAR analyses. Eng. Geol. 2019, 259, 105111. [Google Scholar] [CrossRef]
  54. Innocenti, A.; Pazzi, V.; Borselli, L.; Nocentini, M.; Lombardi, L.; Gigli, G.; Fanti, R. Reconstruction of the evolution phases of a landslide by using multi-layer back-analysis methods. Landslides 2023, 20, 189–207. [Google Scholar] [CrossRef]
  55. Mavrouli, O.; Núñez-Andrés, M.A.; Buill, F.; Lantada, N.; Corominas, J. Correlation between rockfall frequency and overhang geometrical attributes. Landslides 2024, 21, 1971–1985. [Google Scholar] [CrossRef]
  56. Loche, M.; Scaringi, G. Temperature and shear-rate effects in two pure clays: Possible implications for clay landslides. Results Eng. 2023, 20, 101647. [Google Scholar] [CrossRef]
  57. Tayyebi, S.M.; Pastor, M.; Hernandez, A.; Gao, L.; Stickle, M.M.; Yifru, A.L.; Thakur, V. Two-Phase Two-Layer Depth-Integrated SPH-FD Model: Application to Lahars and Debris Flows. Land 2022, 11, 1629. [Google Scholar] [CrossRef]
  58. Marin, R.J.; Long, M. Deterioration models for geotechnical slopes: A systematic review on the long-term behaviour of earthwork assets. Struct. Infrastruct. Eng. 2024, 1–17. [Google Scholar] [CrossRef]
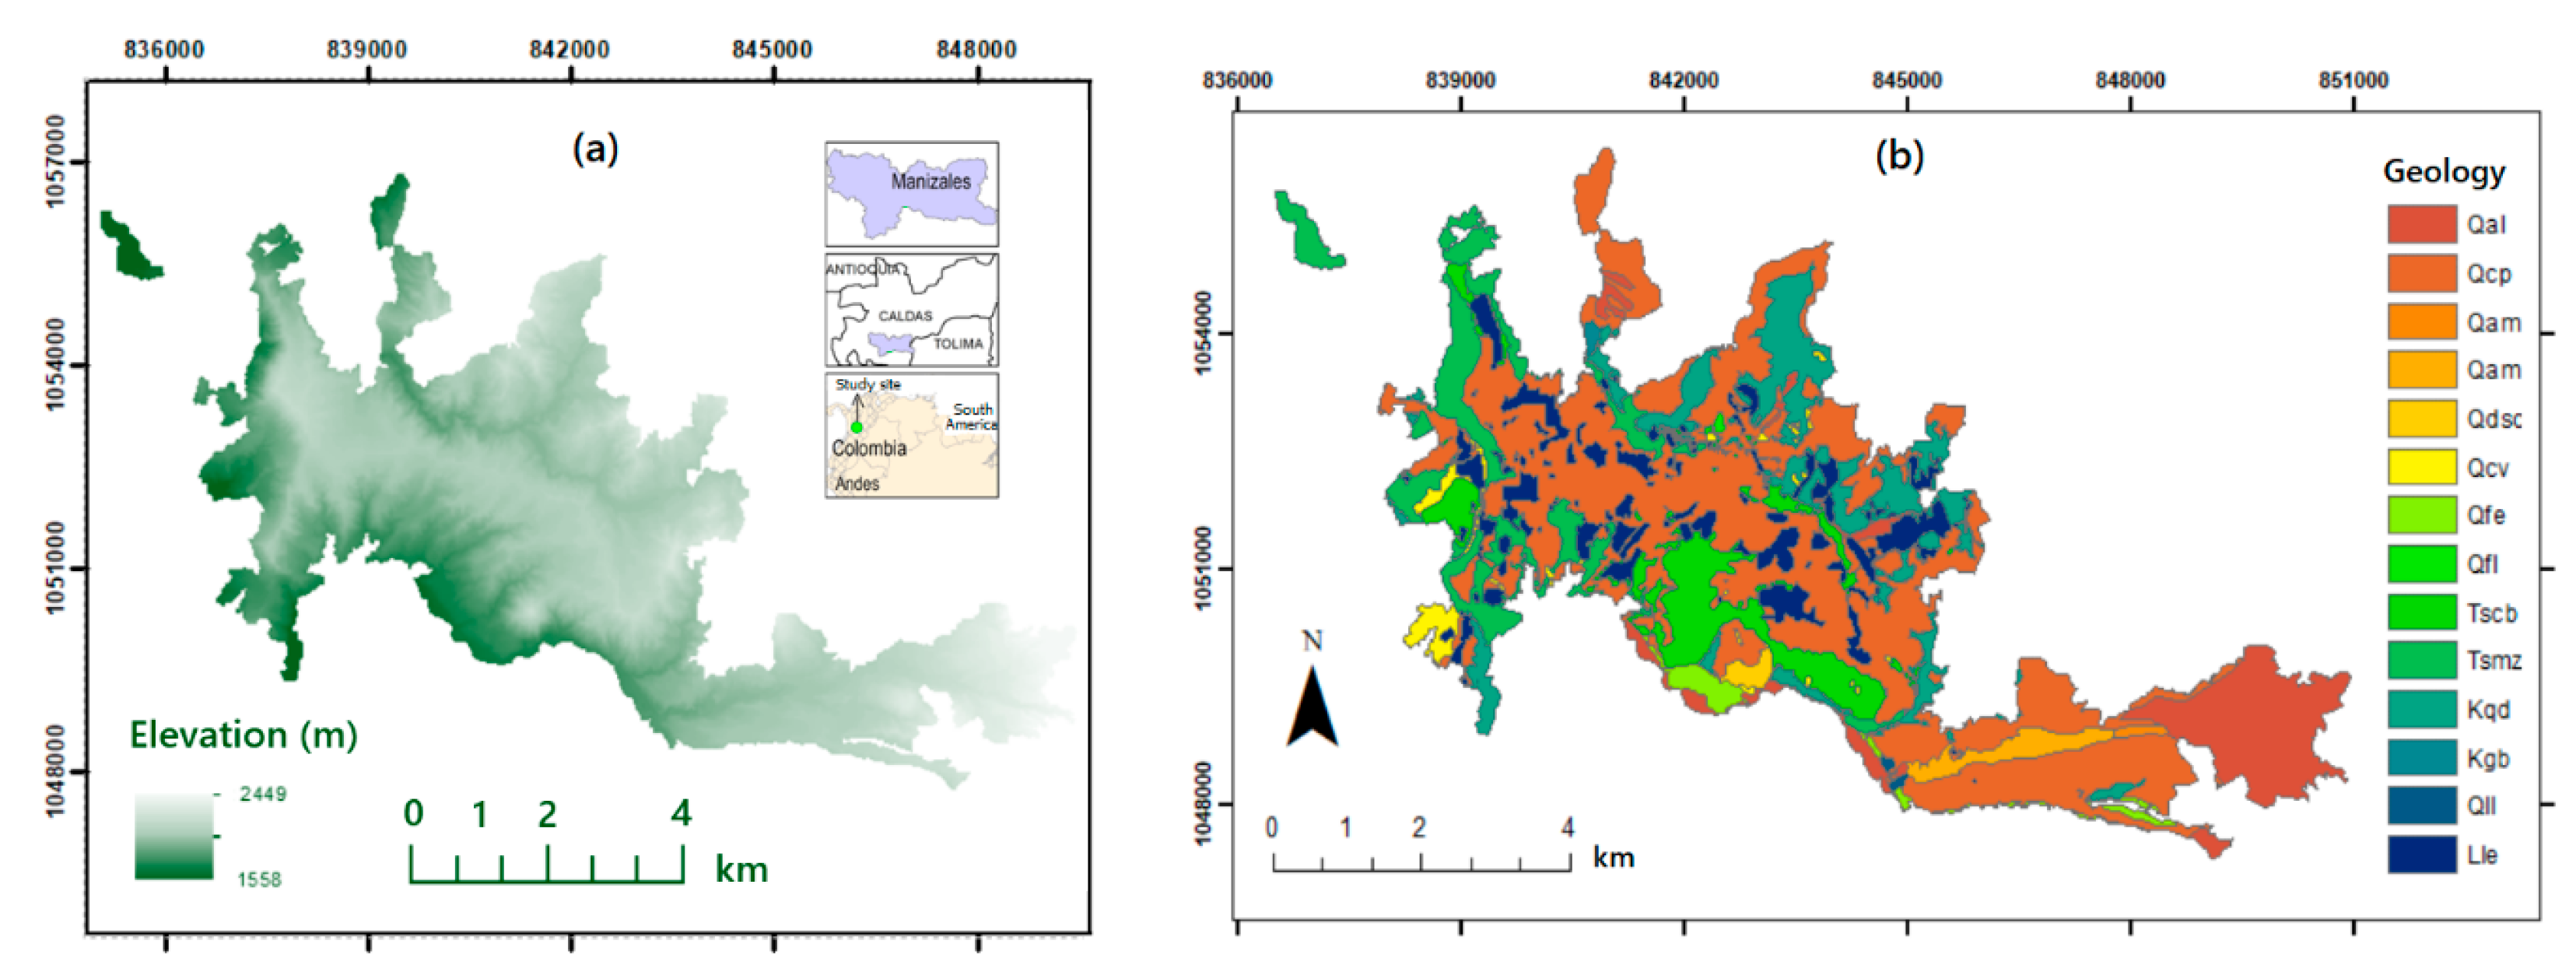
Figure 1. Study Site Overview: (a) Elevation model showcasing the topography; (b) Geological map of the area.
Geosciences 14 00280 g001
Figure 2. (a) Mean factor of safety (FS) and (b) failure probability (Pf) using TRIGRS. Landslide hazard for urban areas in Manizales: (c) planar failure (TRIGRS); (d) circular failure (Scoops3D).
Geosciences 14 00280 g002
Figure 3. Landslide hazard for urban areas in Manizales: map overlay of planar and circular failure hazard maps.
Geosciences 14 00280 g003
Figure 4. Power-law equation of ID thresholds for different critical failure areas.
Geosciences 14 00280 g004
Figure 5. Suggested Rainfall Thresholds (1, 2, and 3) for Manizales (Colombia): (a) Overlaid with triggering rainfall data and thresholds previously proposed by IDEA in 2013: Medium, High, and Very High Threshold. (b) Overlaid with thresholds of five zones of the EWS in Emilia Romagna (Italy) [47]. Threshold equations are presented in Table 5.
Geosciences 14 00280 g005
Figure 6. Relationships of Thresholds 1 and 2 to Threshold 3.
Geosciences 14 00280 g006
Table 1. Time Step Sizes and Ranges of Simulated Durations.
Time Step Size (Hours)Range of Duration (Hours)
11–6
26–14
Table 2. Mean Intensity Step Sizes and Ranges of Simulated Mean Intensities.
Mean Intensity Step Size (Intensity, mm/h)Range of Intensity (mm/h)
13–45
545–100
Table 3. Power-Law Equation of ID Thresholds for Different Critical Failure Areas.
Critical Area (A)Threshold Equation
A = 2000 m2I = 16.904D−0.858
A = 2500 m2I = 22.01D−0.817
A = 3000 m2I = 26.379D−0.82
A = 3500 m2I = 32.105D−0.834
A = 4000 m2I = 38.174D−0.835
A = 4500 m2I = 53.623D−0.974
A = 5000 m2I = 75.924D−1.141
A = 5500 m2I = 106.42D1.298
A = 6000 m2I = 163.91D−1.504
Table 4. Power-Law Equation of ID Thresholds Proposed for Alert States in the Early Warning System of Manizales.
Critical AreaThreshold Equation
A = 2000 m2, Threshold 1I = 16.904D−0.858
A = 3000 m2, Threshold 2I = 26.379D−0.82
A = 4000 m2, Threshold 3I = 38.174D−0.835
Table 5. Rainfall threshold equations proposed by other authors for Manizales and Emilia Romagna (Italy).
ThresholdEquation
Medium Threshold (IDEA-Manizales)I = 6.3204D−0.487
High Threshold (IDEA-Manizales)I = 9.462D−0.481
Very High Threshold (IDEA-Manizales)I = 14.372D−0.485
Threshold A (Emilia Romagna, Italy)I = 22.0D−0.81
Threshold B (Emilia Romagna, Italy)I = 9.96D−0.71
Threshold C (Emilia Romagna, Italy)I = 70.57D−0.89
Threshold E (Emilia Romagna, Italy)I = 17.96D−0.79
Threshold G (Emilia Romagna, Italy)I = 34.12D−0.76
Table 6. Critical Rainfall Thresholds: medium advisory level (threshold 1), moderate advisory level (threshold 2), and high advisory level (threshold 3). Values of critical intensities (Ic1, Ic2, Ic3) are shown for three durations as examples.
Threshold (Critical Intensity)EquationRange
(Duration)
αβIc (1 h)Ic (2 h)Ic (3 h)
Threshold 1 (Ic1)I = 16.904D−0.8580–10 h16.90−0.8616.909.336.59
Threshold 2 (Ic2)I = 26.379D−0.820–10 h26.38−0.8226.3814.9410.72
Threshold 3 (Ic3)I = 38.174D−0.8350–10 h38.17−0.8438.1721.415.25
Disclaimer/Publisher’s Note: The statements, opinions and data contained in all publications are solely those of the individual author(s) and contributor(s) and not of MDPI and/or the editor(s). MDPI and/or the editor(s) disclaim responsibility for any injury to people or property resulting from any ideas, methods, instructions or products referred to in the content.