Abstract
The southeastern coastal regions of China are characterized by typical hilly terrain with abundant rainfall throughout the year, leading to frequent geological hazards. To investigate the measurement accuracy of surface deformation and the effectiveness of error correction methods using the small baselines subset–interferometry synthetic aperture radar (SBAS-InSAR) method in identifying potential geological hazards in such areas, this study processes and analyzes 129 SAR images covering Ninghai County, China. By processing coherence coefficients using the Stacking technique, errors introduced by low-coherence images during phase unwrapping are mitigated. Subsequently, interferograms with high coherence are selected for time-series deformation analysis based on the statistical parameters of coherence coefficients. The results indicate that, after mitigating errors from low-coherence images, applying the SBAS-InSAR method to only high-coherence SAR datasets provides reliable surface deformation results. Additionally, when combined with field geological survey data, this method successfully identified landslide boundaries and potential landslides not accurately detected in previous geological surveys. This study demonstrates that using the SBAS-InSAR method and selecting high-coherence SAR images based on interferogram coherence statistical parameters significantly improves measurement accuracy and effectively identifies potential geological hazards.
1. Introduction
Landslides are one of the most destructive natural disasters. The southeastern coastal regions of China, with their characteristic hilly terrain and abundant rainfall, are frequently affected by typhoons, heavy rains, and other extreme weather conditions, making them particularly susceptible to landslides [1]. Before a landslide occurs, a continuous sliding surface typically forms, accompanied by creep deformation, allowing for the effective identification of potential landslides through the monitoring of pre-trigger deformations [2,3]. Traditional monitoring methods include precise leveling and global positioning systems (GPS). In recent years, interferometric synthetic aperture radar (InSAR) technology, with its advantages of wide coverage, all-weather, and all-day capabilities, has become one of the primary methods for large-scale surface deformation monitoring [3,4]. Time-series InSAR technology can effectively identify surface creep preceding landslide triggers, with PS-InSAR [5,6,7] and SBAS-InSAR [8,9,10,11] being the most widely used methods. In 1995, Achache first utilized SAR imagery to monitor landslide displacement, identifying landslide movement in the French Alps [12]. Since then, numerous scholars both domestically and internationally have undertaken studies using SBAS-InSAR to elucidate landslide dynamics and the influence of hydrogeological conditions, precipitation, and other contributing factors [13,14,15,16]. Research has also extended to urban subsidence [17] and the accuracy of InSAR monitoring in heavily vegetated areas [18]. Washaya et al. [19] demonstrated the effectiveness of coherence change detection (CCD) using Sentinel-1 SAR data for monitoring disaster-induced changes, highlighting its potential in detecting coherence loss after natural and anthropogenic events in urban areas.
Previous research has demonstrated that time-series InSAR technology has significant advantages in monitoring geological hazards. However, uncertainties remain regarding the effectiveness of this technology for monitoring and early warning in environments with dense vegetation and significant atmospheric turbulence. To address these challenges, this study uses Ninghai County, China, as a case example. Initially, Sentinel-1 SAR images were selected with a 24-day interval. These SAR images were preprocessed using the SBAS-InSAR method, and the stacking technique was applied to compute the weighted average of coherence coefficients from all interferograms, effectively reducing decorrelation effects. Despite these efforts, sufficiently reliable deformation measurements were not achieved. Consequently, we increased the number of SAR images to reduce the interval to 12 days for observations during periods with stronger surface scattering characteristics. By selecting interferograms with low noise based on the statistical parameters of InSAR coherence, more accurate deformation measurements were obtained. These results, combined with field geological survey data, were used to analyze potential landslide hazards detected using SBAS-InSAR technology. Finally, we investigated the measurement accuracy and error correction methods of SBAS-InSAR under these observational conditions.
2. Geographical Characteristics of the Study Area
Coastal regions often exhibit hilly terrain and are influenced by marine and subtropical monsoon climates, resulting in high annual rainfall and an increased susceptibility to geological hazards. For instance, Ninghai County in Ningbo City, with elevations ranging from −3 to 956.5 m, an average elevation of approximately 200 m, and a population of 682,000, serves as a representative example. The latitude is 29.29 and the longitude is 121.43. The digital elevation model and the geographical location of this study area are presented in Figure 1. This region is particularly prone to landslides and debris flows. A total of 18 geological hazard sites have been identified in the county, including 8 landslides, 1 collapse, and 9 debris flows [20]. Notably, the Nanshan Zhang landslide and Liufeng landslide in Sangzhou Town are large-scale landslides with a volume of approximately 1 million cubic meters each, located in residential areas, posing a serious threat to local residents’ safety. Therefore, this research uses Ninghai County as a case to investigate surface deformation using time-series InSAR technology and analyze the measurement accuracy and stability of the associated sliding masses.
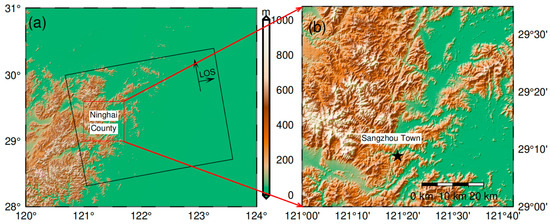
Figure 1.
(a) The red rectangle in the figure indicates the area of Ninghai County; (b) the topography of Ninghai County is shown, with black stars marking the locations of Sangzhou Town, including the Nanshanzhang and Liufeng landslides.
3. Data and Methods
3.1. SAR Images
The SAR data used in this study were obtained from the Sentinel-1 satellite, launched by the European Space Agency in 2014, which has a 12-day revisit cycle for the study area. Since sliding masses and similar targets typically undergo slow surface deformation before triggering, characterized by extended deformation periods and minimal surface changes over short intervals, a temporal interval of 24 days was initially selected for the SAR images. However, due to the significant noise in some SAR images and the resulting low observation accuracy, additional images from periods with stronger surface scattering characteristics were subsequently included. This resulted in a total of 129 ascending track images covering the Ninghai County area from 2017 to 2024. The data were processed using the SBAS-InSAR technique with GMTSAR 6.1 software [21,22,23].
3.2. Research Methods and Data Processing
3.2.1. Calculation of Interferogram Coherence Coefficient Based on Stacking Technology
SBAS-InSAR can more flexibly handle complex terrains and wide coverage areas [8], with relatively less impact from ground obstructions, affording it an advantage over other InSAR technologies in regions with substantial vegetation or buildings [18,24,25,26]. However, Ninghai County, situated in the southeastern part of Zhejiang Province, experiences a subtropical monsoon and oceanic climate, which leads to dense vegetation growth during the summer and considerable atmospheric turbulence. These conditions cause significant variability in radar signal scattering characteristics between imaging periods, resulting in lower coherence in the generated interferograms [27,28]. In contrast, during the winter and spring, slower vegetation growth and reduced atmospheric turbulence generally yield higher coherence in SAR interferograms compared with those obtained in the summer. The formula for calculating coherence coefficients is as follows [29]:
where and represent the complex pixel values of two SAR images at the i-th row and j-th column, and denotes their complex conjugate product. Additionally, m and n denote the number of rows and columns in the images, respectively.
In processing the data, an initial selection of 100 SAR images with a 24-day interval was made, resulting in a temporal baseline of 75 days (the SAR data information is shown in Table S1). This configuration ensured that each intermediate SAR image could be interfered with the four adjacent images, both preceding and following, thereby satisfying the critical temporal baseline requirements for interferometry. A total of 228 interferograms were generated, with their temporal and spatial baselines illustrated in Figure 2. In the figure, the red pentagons indicate the master images used during image registration in the preprocessing phase.
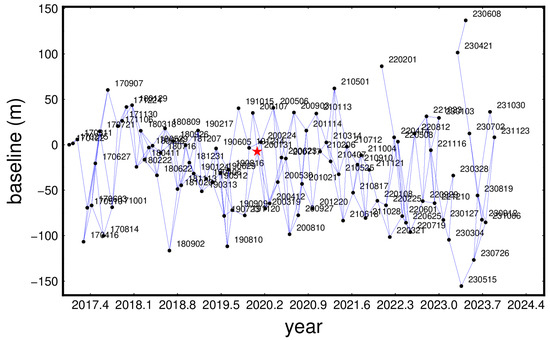
Figure 2.
The temporal and spatial baseline distribution plot for the first set of SAR images. The horizontal axis represents the acquisition time of the radar images, with the numbers after the decimal point indicating a decimal division of the year for greater precision.
To mitigate the observational errors caused by low coherence due to summer vegetation and atmospheric turbulence, the coherence coefficients of all interferograms were weighted and averaged using the stacking method before phase unwrapping [30,31,32,33]. We used the stacking-InSAR method to process the coherence coefficients of all interferograms, ultimately identifying ground targets with more stable radar backscattering characteristics for phase unwrapping across all interferograms. For interferograms with lower phase coherence, this method allows more pixels corresponding to ground targets with stable scattering characteristics to participate in the phase unwrapping process, even in low-coherence images [32]. The coherence coefficients obtained from the weighted average are shown in Figure 3. In Figure 3b, the sliding mass with the largest volume, R1, exhibits the highest overall coherence, reaching 0.6, and its corresponding standard deviation is relatively low, at approximately 0.2, similar to those of R2 to R4. After applying the stacking method to calculate the average coherence coefficients of all interferograms, the resulting coherence coefficients for areas with relatively stable surface scattering characteristics were obtained. This coherence information was used to generate a grid file for phase unwrapping of all interferograms, allowing the selection of more stable ground targets with consistent radar backscattering characteristics during subsequent phase unwrapping, thus facilitating convergence and providing more accurate surface deformation observations.
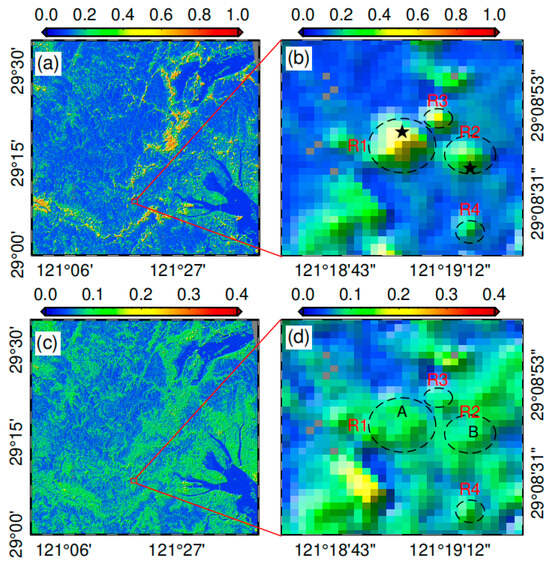
Figure 3.
Stacking coherence coefficient and standard deviation after weighted averaging. (a) Coherence coefficient map for SAR image interferograms of Ninghai County and surrounding areas; (b) coherence coefficient map for regions including the Nanshanzhang and Liufeng landslides in Nanling Village; (c,d) standard deviations of the weighted averages for the corresponding areas. The pentagrams in the figure indicate the positions of sliding masses identified through field geological surveys. In panel (d), the locations marked A and B represent the core deformation areas identified through field geological surveys and InSAR observations and were thus designated as feature points for subsequent deformation extraction.
3.2.2. Statistical Analysis of Observation Accuracy
By applying the stacking technique to process the coherence coefficients of all interferograms during phase unwrapping, errors due to temporal and spatial decorrelation were weakened. However, during the summer, the study area experiences vigorous vegetation growth and significant atmospheric turbulence, resulting in considerable observational noise in interferograms derived from summer SAR images compared with those from the winter. To evaluate the impact of SAR image coherence on deformation observation noise in the study area, a statistical analysis of the coherence across all interferograms was conducted. The root-mean-square, standard deviation, and mean of the coherence coefficients for each interferogram were calculated using the following formulas:
where represents the coherence coefficient of each pixel in the interferogram, as defined in Equation (1), and n denotes the total number of pixels.
The statistical parameters of coherence for the interferograms are shown in Figure 4. It is evident that the coherence coefficients of SAR image interferograms exhibited significant seasonal variations, with the root-mean-square (RMS) displaying the most pronounced seasonal amplitude changes. Interferograms derived from summer SAR images generally have lower RMS, standard deviation, and mean coherence values, indicating weaker coherence and higher observation noise in the deformation field. In contrast, interferograms from winter SAR images show higher coherence, reflecting reduced observation noise in the deformation field. To investigate the impact of these coherence statistical parameters on deformation observation, interferograms with relatively high and low coherence, as shown in Figure 4, were analyzed. The statistical parameters are presented in Figure 5. Interferograms from winter and spring exhibit a coherence RMS above 0.35, indicating robust overall coherence. Conversely, interferograms from summer and autumn display a coherence RMS around 0.2, reflecting substantial decorrelation in most areas. This decorrelation leads to significant observation noise in the deformation field and unreliable surface deformation measurements, thereby introducing considerable errors in the final time-series deformation calculations.
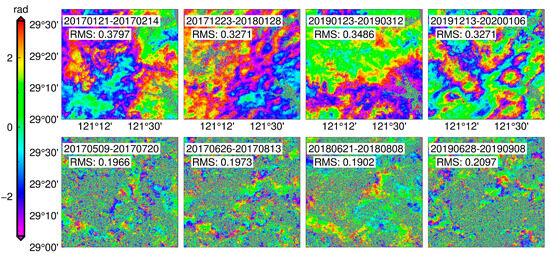
Figure 4.
Partial interferograms and the corresponding root-mean-square (RMS) of coherence coefficients.
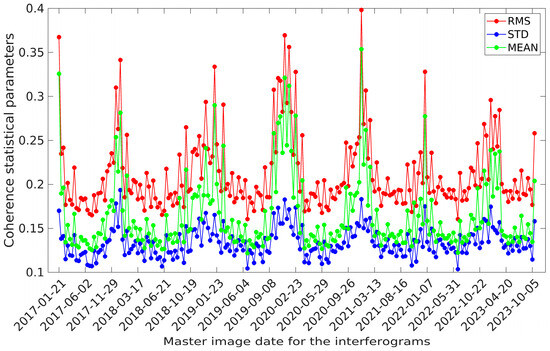
Figure 5.
Statistical parameters of interferometric coherence in SAR images.
Based on this analysis, the root-mean-square (RMS) was used as the primary criterion for assessing observation noise in the deformation field. Interferograms with a coherence RMS below a specific threshold were excluded from the final deformation calculations. By testing various thresholds and analyzing deformation trends at feature points in the study area, it was determined that interferograms with a coherence RMS below 0.226 should be excluded for time-series deformation calculations using SBAS technology. To evaluate the effectiveness of the error correction, the accumulated deformation at feature points in the study area is presented in Figure 6, with feature points A and B indicated as shown in Figure 3. Figure 6a shows excessive deformation fluctuations and periodic uplift deformation, inconsistent with the sliding mass movement characteristics found in the field geological survey. After reducing the observation noise caused by low-coherence interferograms, Figure 6b shows that, although the residual sum of squares of the fitted accumulated deformation curve is smaller than that in Figure 6a, there are still significant fluctuations and observation noise inconsistent with the actual deformation characteristics of the sliding masses, indicating that the observation accuracy remains relatively low.
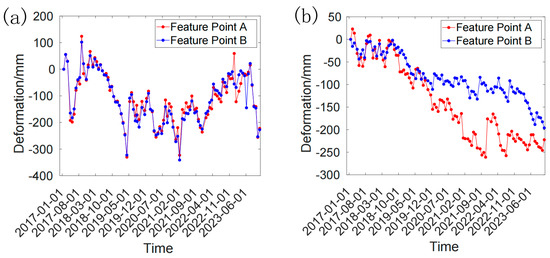
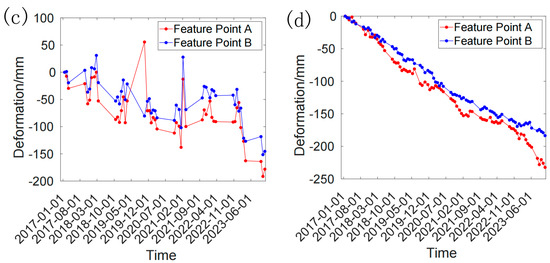
Figure 6.
Cumulative deformation of characteristic points in the study area. (a) Time-series deformation at feature points for the first dataset; (b) time-series deformation at feature points for the first dataset after removing interferograms with high noise, based on a coherence RMS threshold; (c) time-series deformation at feature points for the second dataset; (d) time-series deformation at feature points for the third dataset.
3.2.3. Analysis of Measurement Accuracy After Excluding High-Noise SAR Images
In Figure 6b, the measurement accuracy at the feature points is relatively improved, indicating that eliminating errors caused by low-coherence interferograms enhances overall observation accuracy. Therefore, we reprocessed two sets of data to investigate the impact of high-noise summer SAR images on SBAS observation accuracy.
The second set of SAR images excluded summer images affected by atmospheric and vegetation changes that resulted in substantial observation noise, retaining only SAR images from periods with higher coherence (from October to March of the following year). This resulted in a total of 47 images (the SAR data information is shown in Table S2). Due to the absence of summer SAR images, we extended the temporal baseline to 550 days during SAR data processing, producing a total of 357 high-coherence interferogram pairs. Although the coherence of the interferograms improved, the residuals of the deformation curves fitted from the measurements remained relatively high due to the insufficient number of SAR images. The temporal and spatial baseline distribution and coherence statistical parameters for these interferograms are shown in Figure 7 and Figure 8, with feature point deformation illustrated in Figure 6c.
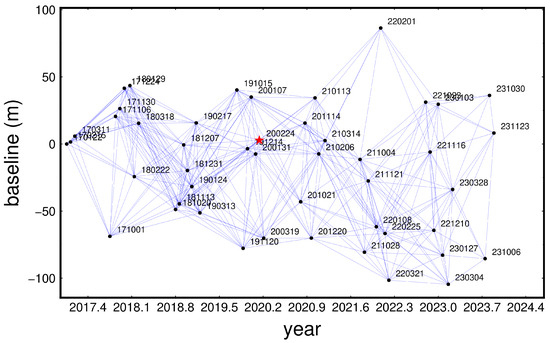
Figure 7.
Temporal and spatial baseline distribution plot for the second set of SAR images. The horizontal axis represents the acquisition time of the radar images, with the numbers after the decimal point indicating a decimal division of the year for greater precision.
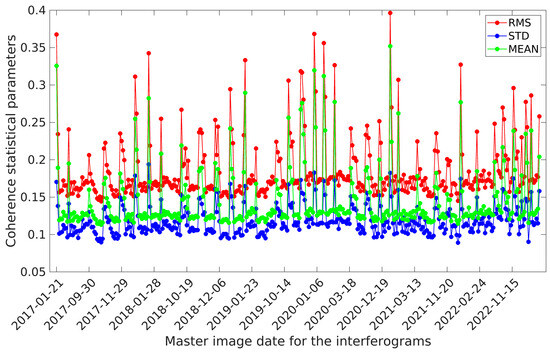
Figure 8.
Statistical parameters of interferometric coherence corresponding to the second set of SAR images.
The third set of SAR images retained the original data while incorporating an additional 29 SAR images from high-coherence periods (from October to March of the following year), bringing the total to 76 images (the SAR data information is shown in Table S3). The temporal baseline was set to 550 days, producing 676 high-coherence interferogram pairs. The temporal and spatial baseline distribution and coherence statistical parameters for these interferograms are presented in Figure 9 and Figure 10, with feature point deformation illustrated in Figure 6d.
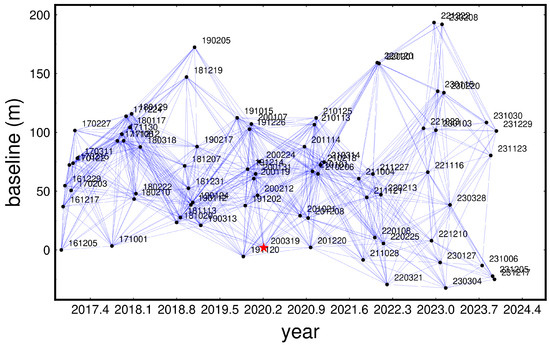
Figure 9.
Temporal and spatial baseline distribution plot for the third set of SAR images. The horizontal axis represents the acquisition time of the radar images, with the numbers after the decimal point indicating a decimal division of the year for greater precision.
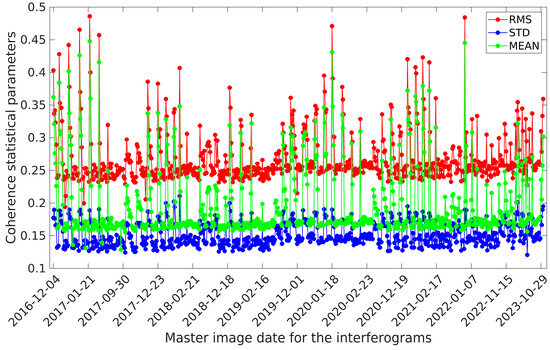
Figure 10.
Statistical parameters of interferometric coherence corresponding to the third set of SAR images.
In the reprocessed datasets, the second set of SAR images, due to the limited data, exhibited significant fluctuations in the observed values at the feature points (Figure 6c), resulting in relatively low observation accuracy. In contrast, the third set of SAR images included all data from periods with lower observation noise and used a longer temporal baseline for interferometric processing. This approach produced a large number of interferogram pairs, revealing a more stable deformation trend at the feature points and achieving higher overall observation accuracy [34,35]. Consequently, based on the deformation field obtained from the third set of SAR images, we analyzed the sliding mass movement and geometric characteristics in the study area, integrating information from field geological surveys.
4. Results
4.1. Field Geological Survey Overview of Potential Landslide Locations
During the initial geological hazard investigations in Ninghai County, the potential landslide areas of Nanshanzhang and Liufeng (locations shown in Figure 11b) were identified as significant landslide hazards. These areas have a sliding mass volume reaching 1,000,000 m3 and pose a threat to over 260 local households [20]. Consequently, Nanshanzhang and Liufeng were selected as the primary subjects for study. The field survey focused on the southern side of Sangzhou Town, Ninghai County. This survey region is characterized by abundant rainfall throughout the year and a well-developed surface water system, with a creek flowing from south to north between the Nanshanzhang and Liufeng sliding masses, corresponding to the boundary between R1 and R2 in Figure 11b. This abundant rainfall and developed water system significantly contribute to landslide activity [20]. The sliding masses of the two potential landslide sites are primarily composed of Quaternary residual slope deposits. The upper layer mainly consists of clay and gravelly clay, while the lower layer is dominated by boulder clay. The base of the potential sliding mass generally contains a thin layer of clay or silty clay. The shallow layers of boulder mixed with clay and poorly lithified clay are prone to sliding under conditions of well-developed water systems and sufficient rainfall [20].
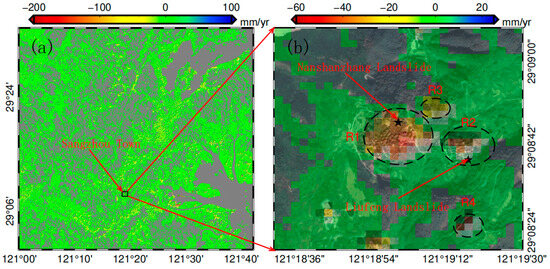
Figure 11.
Rate of LOS deformation to the surface in the study area. (a) Surface deformation rate in the radar line of sight (LOS) in Ninghai County; (b) Surface deformation rate in the radar line of sight (LOS) in the research area of Sangzhou Town.
4.2. Surface Deformation Rate and Cumulative Displacement
By processing 76 SAR images (the third dataset) covering the study area using SBAS [8], we obtained the Line-of-Sight (LOS) deformation rate, as shown in Figure 11. Negative values of the LOS deformation rate indicate movement away from the radar along the line of sight. The map in (a) represents Ninghai County and the surrounding area, while (b) shows the area around Nanling Village in Sangzhou Town. The results indicate that, from 22 January 2017 to 7 January 2023, the overall deformation range of the Nanling Village Nanshanzhang (R1) landslide was large, with a maximum LOS deformation rate of approximately −60 mm/year. In the Liufeng landslide area (R2), the maximum deformation rate was about −40 mm/year. The cumulative surface displacement along the radar’s line of sight (LOS) is shown in Figure 12, with the Nanshanzhang potential sliding mass having a maximum cumulative LOS deformation of −170 mm and the Liufeng sliding mass having a value around −130 mm.
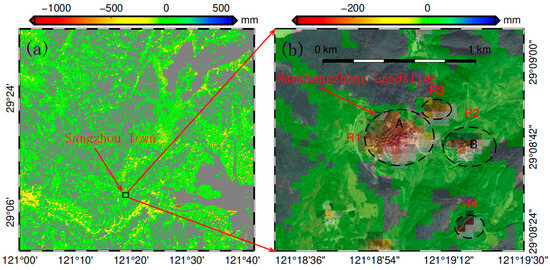
Figure 12.
Cumulative surface deformation along the line of sight (LOS) in the study area. (a) Cumulative surface deformation in the LOS in Ninghai County; (b) Cumulative surface deformation in the LOS in the research area of Sangzhou Town.
Additionally, by projecting the surface deformation characteristics obtained from SBAS-InSAR onto the optical image basemap for comparison, two significant deformations were identified along the township road in Sangzhou Town, labeled as R3 and R4. Based on the deformation range, it is inferred that R3 and R4 are medium-sized landslides with sliding masses of several hundred thousand cubic meters. The deformation rate and cumulative deformation field derived from SBAS suggest that R3 has a deformation rate of approximately −30 mm/year, with a maximum cumulative deformation of around −100 mm. R4’s deformation range is smaller than that of R3, with a deformation rate of about −50 mm/year, and a maximum cumulative deformation of up to −150 mm. We also extracted the deformation cycles of characteristic points within the landslide areas, as shown in Figure 6b. Points A and B, located at the center of the potential slide masses, directly reflect the movement of these slide masses. The observed deformation curves reveal that, despite some fluctuations due to coherence factors, the overall trend is subsidence. Moreover, the deformation at these characteristic points is more pronounced in the summer, particularly at Point A before August 2019, suggesting that summer rainfall may accelerate crack formation and sliding within the masses.
5. Discussion
The study area exhibits a typical hilly terrain with dense vegetation and relatively high atmospheric moisture content. There are no stable structures or large exposed rock areas, making the SBAS method highly applicable [8]. Additionally, by using the stacking method to process the coherence coefficients, we can obtain ground targets with relatively stable radar backscatter intensity in the study area [19,30]. Based on the preliminary InSAR surface deformation observations, four major deformation areas were identified in the residential and village road areas of Sangzhou Town and its surroundings. Among these, R1 and R2 correspond to the Nanshanzhang and Liufeng landslides, respectively, within the study area. Due to their large volumes, extensive coverage, and locations within residential zones, these landslides pose significant threats to the safety and property of local residents. Projecting the deformation rates and cumulative deformations over the observation period onto optical images, combined with geological survey data and field geomorphological analysis, allowed us to assess the potential landslide movement characteristics, as shown in Figure 13.
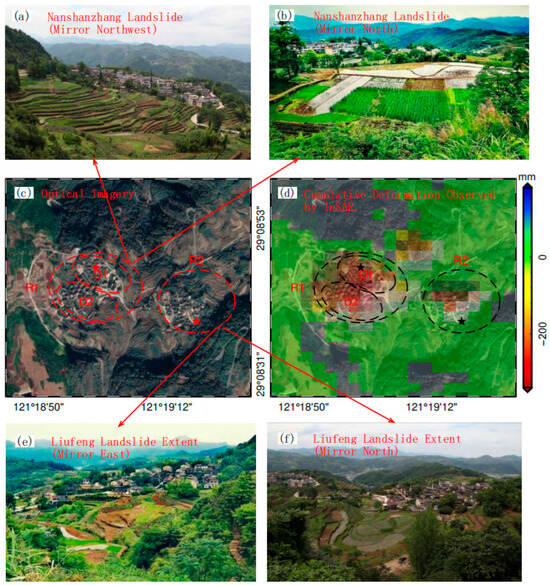
Figure 13.
Deformation and geomorphological characteristics of Nanzhang landslide and Liufeng landslide. (a) On-site topography from the field geological survey of the potential landslide at Nanshanzhang (mirror NW); (b) On-site topography from the field geological survey of the potential landslide at Nanshanzhang (mirror N); (c) Optical image of the study area; (d) Cumulative surface deformation of the study area; (e) On-site topography from the field geological survey of the potential landslide at Liufeng (mirror E); (f) On-site topography from the field geological survey of the potential landslide at Liufeng (mirror N).
The Nanshanzhang landslide has an estimated volume of 1,176,000 m3, with deformation area R1 encompassing numerous residential buildings and other structures [20]. Consequently, the cumulative LOS deformation in this region may also include factors related to building subsidence [36,37,38,39]. To ascertain the source of the deformation signals, we conducted a detailed comparison between the deformation information and the optical image base map. This analysis revealed that the entire deformation area can be further subdivided into two primary sub-deformation zones (D1 and D2). D1 represents the higher elevation portion of the slide mass, with an overall elevation greater than that of D2, and relatively fewer buildings. Therefore, the observed surface subsidence was not due to buildings. Significant displacement was observed, even in areas along the upper edge of D1, where there are no buildings, with a continuous deformation gradient extending from the outer edge of D1 to the center of the slide mass. This confirms that significant sliding has occurred from the upper boundary to the central region of the slide mass, and the deformation signals in the D1 area are primarily caused by the movement of the potential slide mass. The D2 area, located in the lower half of the slide mass, has a lower elevation and contains many buildings. While the possibility of natural subsidence due to the buildings cannot be ruled out, significant surface displacement is still observed at the lower edge of D2 (the lower boundary of the entire slide mass R1), where no buildings are present [24,40,41,42]. The magnitude of displacement from the boundary to the center of the slide mass also shows good continuity, consistent with the deformation characteristics of the entire slide mass slowly sliding along the slope. Moreover, the boundary of the deformation zone aligned with the boundary of the potential slide mass identified by the geological survey [43]. Therefore, it is inferred that this part of the deformation is also primarily caused by the slide mass moving along the slope.
Moreover, the area between the two secondary deformation zones serves as the deformation center of the entire Nanshanzhang slide mass, where the magnitude of deformation reaches its maximum. Based on the positions of D1 and D2, it can be inferred that the movement of D1 exerts a certain compressive promoting effect on D2. Both zones slide together along the slope, forming the deformation field R1 observed by InSAR. Therefore, it can be determined that the Nanshanzhang slide mass maintains an annual sliding rate of approximately 60 mm/year along the LOS direction. As the most significant potential landslide hazard point threatening the largest number of local residents among the large-scale landslides in Ninghai County, this area should be prioritized for monitoring and mitigation in future work.
In Figure 13c, R2 represents the approximate boundary of the Liufeng landslide, with a volume of 1,102,500 m3. In the field geological survey, the landslide volume in this area was found to be close to that of R1 [43]. The entire landslide area still includes residential buildings and other structures, with the center of maximum deformation located where these buildings are situated. Early geological surveys indicated that the potential volume of the Liufeng landslide was similar to that of the Nanshanzhang landslide, and both are currently under relatively stable conditions. However, the LOS deformation magnitude observed through InSAR for the Liufeng landslide (approximately defined by R2) was significantly smaller than that of the Nanshanzhang landslide. Therefore, two hypotheses are proposed: first, the movement of this landslide might be relatively stable compared with that of the Nanshanzhang landslide, with deformation primarily caused by building subsidence; second, the sliding range and magnitude of this landslide might be smaller than initially estimated, with the upper boundary potentially not accurately identified, indicating that the actual landslide boundary is smaller than the results from the early geological survey.
In Figure 13d, the black pentagon indicates the landslide position identified by geological surveys. However, only minor displacements were observed at this location, which were at the edge of the R2 deformation field. Comparing geomorphological features, although the deformation magnitude and range in this area were small, a significant deformation boundary was present, with minor displacements observed at the boundary where no buildings were located. This suggests that this deformation boundary reflected the current boundary of the landslide. Therefore, the second hypothesis as more likely: the early geological survey may have inaccurately defined the boundary of the Liufeng landslide, leading to an overestimation of its potential volume. According to InSAR observations, the landslide is still active, with a maximum annual sliding rate of approximately 40 mm/year along the LOS direction. Future geological investigations should monitor the sliding state and determine the precise boundary of the potential landslide.
Deformation areas R3 and R4 were not identified in previous geological surveys. This oversight was primarily due to the limited workforce and efficiency of field surveys, which focused only on densely populated areas. However, upon examining the field geomorphology of these deformation areas, it was found that they were located on the slopes at the edge of the roads. According to the earlier geological survey, the shallow layers are predominantly clay and gravelly clay, with poor cementation. Additionally, the area has well-developed surface water systems and heavy rainfall, which makes landslides more likely under these conditions. Therefore, it is inferred that R3 and R4 are slopes disturbed by road excavation and construction, leading to the development of cracks and subsequent slow sliding under the influence of abundant rainfall. It is recommended to enhance deformation monitoring in these areas in future geological surveys.
6. Conclusions
This study employed SBAS-InSAR and the stacking technique to observe surface deformation in Ninghai County, with a focus on analyzing the deformation characteristics of the Nanshanzhang and Liufeng landslides. This research also explored methods to improve the observation accuracy of SBAS-InSAR technology in areas with low radar backscatter coherence. The findings are summarized as follows:
- (1)
- To address the observation noise caused by low coherence in radar backscatter intensity, the stacking technique was used to perform weighted averaging of the coherence coefficients of all interferograms, effectively reducing the impact of observation noise.
- (2)
- When conducting long-term deformation monitoring of landslides, selecting SAR images from seasons with dense vegetation and high atmospheric moisture content, such as the summer, may increase the number of images, but may not improve monitoring accuracy, and could instead introduce errors.
- (3)
- Only SAR images with low observation noise should be selected, and interferograms should be generated using long temporal baselines. For interferograms that still exhibit significant errors after phase unwrapping, high-coherence interferograms should be selected based on the statistical parameters of interferogram coherence. These can then be applied with SBAS-InSAR to calculate time-series deformation, significantly enhancing monitoring accuracy.
Supplementary Materials
The following supporting information can be downloaded at: https://www.mdpi.com/article/10.3390/geosciences14100278/s1, Table S1: The basic parameters of the first set of SAR images; Table S2: The basic parameters of the second set of SAR images; Table S3: The basic parameters of the third set of SAR images.
Author Contributions
Conceptualization, J.X. and X.B.; methodology, J.X.; software, S.G., J.G. and B.Z.; validation, C.Z., J.G. and B.Z.; investigation, S.G. and C.Z.; resources, J.X.; writing—original draft preparation, J.X.; writing—review and editing, X.B.; funding acquisition, J.X. All authors have read and agreed to the published version of the manuscript.
Funding
This research was funded by the Natural Resources Science and Technology Project of Zhejiang Province, grant number 2023-72.
Data Availability Statement
Sentinel-1 SAR images were downloaded from ESA (https://scihub.copernicus.eu/dhus/#/home (accessed on 20 January 2024)). All figures were plotted using Generic Mapping Tools version 6.1 (https://www.generic-mapping-tools.org (accessed on 10 September 2021)). Other datasets and software cited in this article are listed in the References section.
Acknowledgments
We used the Generic Mapping Tools (GMTs) open-source collection of computer software tools, developed and maintained by Paul Wessel and Walter H. F. Smith, to create most of the figures.
Conflicts of Interest
The authors declare no conflicts of interest.
References
- Huang, R. Large-scale Landslides and Their Sliding Mechanisms in China Since the 20th Century. Chin. J. Rock Mech. Eng. 2007, 26, 433–454. (In Chinese) [Google Scholar] [CrossRef]
- Xue, F.; Lv, X.; Dou, F.; Yun, Y. A Review of Time-Series Interferometric SAR Techniques: A Tutorial for Surface Deformation Analysis. IEEE Geosci. Remote Sens. Mag. 2020, 8, 22–42. [Google Scholar] [CrossRef]
- Tizzani, P.; Berardino, P.; Casu, F.; Euillades, P.; Manzo, M.; Ricciardi, G.; Zeni, G.; Lanari, R. Surface deformation of Long Valley Caldera and Mono Basin, California, investigated with the SBAS-InSAR approach. Remote Sens. Environ. 2007, 108, 277–289. [Google Scholar] [CrossRef]
- Zhu, J.; Li, Z.; Hu, J. Research Progress and Methods of InSAR for Deformation Monitoring. Acta Geod. Et Cartogr. Sin. 2017, 46, 1717–1733. (In Chinese) [Google Scholar] [CrossRef]
- Ferretti, A.; Prati, C.; Rocca, F. Permanent scatterers in SAR interferometry. IEEE Trans. Geosci. Remote Sens. 2001, 39, 8–20. [Google Scholar] [CrossRef]
- Yao, J.; Yao, X.; Liu, X. Landslide Detection and Mapping Based on SBAS-InSAR and PS-InSAR: A Case Study in Gongjue County, Tibet, China. Remote Sens. 2022, 14, 4728. [Google Scholar] [CrossRef]
- Frattini, P.; Crosta, G.B.; Rossini, M.; Allievi, J. Activity and kinematic behaviour of deep-seated landslides from PS-InSAR displacement rate measurements. Landslides 2018, 15, 1053–1070. [Google Scholar] [CrossRef]
- Berardino, P.; Fornaro, G.; Lanari, R.; Sansosti, E. A new algorithm for surface deformation monitoring based on small baseline differential SAR interferograms. IEEE Trans. Geosci. Remote Sens. 2022, 40, 2375–2383. [Google Scholar] [CrossRef]
- Xuguo, S.; Jinhu, X.; Houjun, J.; Lu, Z.; Mingsheng, L. Slope Stability State Monitoring and Updating of the Outang Landslide, Three Gorges Area with Time Series InSAR Analysis. Earth Sci. 2019, 44, 4284–4292. (In Chinese) [Google Scholar] [CrossRef]
- Kang, Y.; Zhao, C.; Zhang, Q.; Lu, Z.; Li, B. Application of InSAR Techniques to an Analysis of the Guanling Landslide. Remote Sens. 2017, 9, 1046. [Google Scholar] [CrossRef]
- Aryal, A.; Brooks, B.A.; Reid, M.E. Landslide subsurface slip geometry inferred from 3-D surface displacement fields. Geophys. Res. Lett. 2015, 42, 1411–1417. [Google Scholar] [CrossRef]
- Achache, J.; Fruneau, B.; Delacourt, C. Applicability of SAR Interferometry for Monitoring of Landslides. In The Second ERS Applications; European Space Agency: Paris, France, 1996; Volume 383, p. 165. [Google Scholar]
- Xiaopeng, T.; David, S. Active movement of the Cascade landslide complex in Washington from a coherence-based InSAR time series method. Remote Sens. Environ. 2016, 186, 405–415. [Google Scholar] [CrossRef]
- Cianflone, G.; Tolomei, C.; Brunori, C.A.; Monna, S.; Dominici, R. Landslides and Subsidence Assessment in the Crati Valley (Southern Italy) Using InSAR Data. Geosciences 2018, 8, 67. [Google Scholar] [CrossRef]
- Bouali, E.H.; Oommen, T.; Escobar-Wolf, R. Mapping of slow landslides on the Palos Verdes Peninsula using the California landslide inventory and persistent scatterer interferometry. Landslides 2017, 15, 439–452. [Google Scholar] [CrossRef]
- Su, X.; Zhang, Y.; Meng, X.; Rehman, M.U.; Khalid, Z.; Yue, D. Updating Inventory, Deformation, and Development Characteristics of Landslides in Hunza Valley, NW Karakoram, Pakistan by SBAS-InSAR. Remote Sens. 2022, 14, 4907. [Google Scholar] [CrossRef]
- Shi, X.; Chen, C.; Dai, K.; Deng, J.; Wen, N.; Yin, Y.; Dong, X. Monitoring and Predicting the Subsidence of Dalian Jinzhou Bay International Airport, China by Integrating InSAR Observation and Terzaghi Consolidation Theory. Remote Sens. 2022, 14, 2332. [Google Scholar] [CrossRef]
- Bekaert, D.P.; Handwerger, A.L.; Agram, P.; Kirschbaum, D.B. InSAR-based detection method for mapping and monitoring slow-moving landslides in remote regions with steep and mountainous terrain: An application to Nepal. Remote Sens. Environ. 2020, 249, 111983. [Google Scholar] [CrossRef]
- Washaya, P.; Balz, T.; Mohamadi, B. Coherence Change-Detection with Sentinel-1 for Natural and Anthropogenic Disaster Monitoring in Urban Areas. Remote Sens. 2018, 10, 1026. [Google Scholar] [CrossRef]
- Ninghai County Natural Resources and Planning Bureau. Ninghai County Geological Disaster Prevention “14th Five-Year Plan”; Ninghai County Natural Resources and Planning Bureau: Ningbo, China, 2021; Volume 10. (In Chinese) [Google Scholar]
- Zebker, H.A.; Villasenor, J. Decorrelation in interferometric radar echoes. IEEE Trans. Geosci. Remote Sens. 1992, 30, 950–959. [Google Scholar] [CrossRef]
- Wessel, P.; Smith, W.H.F. New, improved version of generic mapping tools released: EOS. Trans. Am. Geophys. Union 1998, 79, 579. [Google Scholar] [CrossRef]
- Sandwell, D.; Mellors, R.; Tong, X.; Wei, M.; Wessel, P. Open Radar Interferometry Software for Mapping Surface Deformation: EOS. Trans. Am. Geophys. Union 2011, 92, 234. [Google Scholar] [CrossRef]
- Zhou, L.; Guo, J.M.; Hu, J.Y.; Li, J.W.; Xu, Y.F.; Pan, Y.J.; Shi, M. Wuhan Surface Subsidence Analysis in 2015–2016 Based on Sentinel-1A Data by SBAS-InSAR. Remote Sens. 2017, 9, 982. [Google Scholar] [CrossRef]
- Govorčin, M.; Pribičević, B.; Wdowinski, S. Surface Deformation Analysis of the Wider Zagreb Area (Croatia) with Focus on the Kašina Fault, Investigated with Small Baseline InSAR Observations. Sensors 2019, 19, 4857. [Google Scholar] [CrossRef] [PubMed]
- De Luca, C.; Cuccu, R.; Elefante, S.; Zinno, I.; Manunta, M.; Casola, V.; Rivolta, G.; Lanari, R.; Casu, F. An on-demand web tool for the unsupervised retrieval of earth’s surface deformation from SAR data: The P-SBAS service within the ESA G-POD environment. Remote Sens. 2015, 7, 15630–15650. [Google Scholar] [CrossRef]
- Sinha, S.; Sharma, L.; Chockalingam, J.; Nathawat, M.; Das, A.; Mohan, S. Efficacy of InSAR coherence in tropical forest remote sensing in context of REDD. Int. J. Adv. Remote Sens. GIS Geogr. 2015, 3, 38–46. [Google Scholar]
- Martone, M.; Bräutigam, B.; Rizzoli, P.; Gonzalez, C.; Bachmann, M.; Krieger, G. Coherence Evaluation of TanDEM-X Interferometric Data. ISPRS J. Photogramm. Remote Sens. 2012, 73, 21–29. [Google Scholar] [CrossRef]
- Chang, Z.; Gong, H.; Zhang, J.; Chen, M. Correlation Analysis on Interferometric Coherence Degree and Probability of Residue Occurrence in Interferogram. IEEE Sens. J. 2014, 14, 2369–2375. [Google Scholar] [CrossRef]
- Zhang, L.; Dai, K.; Deng, J.; Ge, D.; Liang, R.; Li, W.; Xu, Q. Identifying Potential Landslides by Stacking-InSAR in Southwestern China and Its Performance Comparison with SBAS-InSAR. Remote Sens. 2021, 13, 3662. [Google Scholar] [CrossRef]
- Qin, Z.; Agarwal, V.; Gee, D.; Marsh, S.; Grebby, S.; Chen, Y.; Meng, N. Study of Ground Movement in a Mining Area with Geological Faults Using FDM Analysis and a Stacking InSAR Method. Front. Environ. Sci. 2021, 9, 787053. [Google Scholar] [CrossRef]
- Dai, K.; Liu, G.; Li, Z.; Ma, D.; Wang, X.; Zhang, B.; Tang, J.; Li, G. Monitoring Highway Stability in Permafrost Regions with X-band Temporary Scatterers Stacking InSAR. Sensors 2018, 18, 1876. [Google Scholar] [CrossRef] [PubMed]
- Xu, Y.; Li, T.; Tang, X.; Zhang, X.; Fan, H.; Wang, Y. Research on the Applicability of DInSAR, Stacking-InSAR and SBAS-InSAR for Mining Region Subsidence Detection in the Datong Coalfield. Remote Sens. 2022, 14, 3314. [Google Scholar] [CrossRef]
- Pawluszek-Filipiak, K.; Borkowski, A. Integration of DInSAR and SBAS Techniques to Determine Mining-Related Deformations Using Sentinel-1 Data: The Case Study of Rydułtowy Mine in Poland. Remote Sens. 2020, 12, 242. [Google Scholar] [CrossRef]
- Ghzala, K.; Tounsi, Y.; Muhire, D.; Nassim, A. Land motion detection in central Rwanda using small baseline subset interferometry. Remote Sens. Appl. Soc. Environ. 2021, 21, 100430. [Google Scholar] [CrossRef]
- Montuori, A.; Luzi, G.; Bignami, C.; Gaudiosi, I.; Stramondo, S.; Crosetto, M.; Buongiorno, F. The interferometric use of radar sensors for the urban monitoring of structural vibrations and surface displacements. IEEE J. Sel. Top. Appl. Earth Obs. Remote Sens. 2016, 9, 3761–3776. [Google Scholar] [CrossRef]
- Bozzano, F.; Esposito, C.; Franchi, S.; Mazzanti, P.; Perissin, D.; Rocca, A.; Romano, E. Understanding the subsidence process of a quaternary plain by combining geological and hydrogeological modelling with satellite InSAR data: The Acque Albule Plain case study. Remote Sens. Environ. 2015, 168, 219–238. [Google Scholar] [CrossRef]
- Cigna, F.; Banks, V.J.; Donald, A.W.; Donohue, S.; Graham, C.; Hughes, D.; McKinley, J.M.; Parker, K. Mapping Ground Instability in Areas of Geotechnical Infrastructure Using Satellite InSAR and Small UAV Surveying: A Case Study in Northern Ireland. Geosciences 2017, 7, 51. [Google Scholar] [CrossRef]
- Cigna, F.; Osmanoğlu, B.; Cabral-Cano, E.; Dixon, T.H.; Ávila-Olivera, J.A.; Gardũno-Monroy, V.H.; DeMets, C.; Wdowinski, S. Monitoring land subsidence and its induced geological hazard with Synthetic Aperture Radar Interferometry: A case study in Morelia, Mexico. Remote Sens. Environ. 2012, 117, 146–161. [Google Scholar] [CrossRef]
- Dou, J.; Yunus, A.P.; Bui, D.T.; Merghadi, A.; Sahana, M.; Zhu, Z.; Chen, C.W.; Han, Z.; Pham, B.T. Improved landslide assessment using support vector machine with bagging, boosting, and stacking ensemble machine learning framework in a mountainous watershed, Japan. Landslides 2020, 17, 641–658. [Google Scholar] [CrossRef]
- Zhao, F.; Meng, X.; Zhang, Y.; Chen, G.; Su, X.; Yue, D. Landslide Susceptibility Mapping of Karakorum Highway Combined with the Application of SBAS-InSAR Technology. Sensors 2019, 19, 2685. [Google Scholar] [CrossRef]
- Chen, G.; Zhang, Y.; Zeng, R.; Yang, Z.; Chen, X.; Zhao, F.; Meng, X. Detection of Land Subsidence Associated with Land Creation and Rapid Urbanization in the Chinese Loess Plateau Using Time Series Insar: A Case Study of Lanzhou New District. Remote Sens. 2018, 10, 270. [Google Scholar] [CrossRef]
- He, Q.; Zhou, J. Causes Analysis of Nanshanzhang and Liufeng Landslides in Nanling Village, Sangzhou Town, Ninghai County. In Proceedings of the 70 Years of Geological Work in Zhejiang—Proceedings of the 2019 Annual Academic Conference of Zhejiang Geological Society, Lishui, China, 2019; Volume 11. (In Chinese). [Google Scholar]
Disclaimer/Publisher’s Note: The statements, opinions and data contained in all publications are solely those of the individual author(s) and contributor(s) and not of MDPI and/or the editor(s). MDPI and/or the editor(s) disclaim responsibility for any injury to people or property resulting from any ideas, methods, instructions or products referred to in the content. |
© 2024 by the authors. Licensee MDPI, Basel, Switzerland. This article is an open access article distributed under the terms and conditions of the Creative Commons Attribution (CC BY) license (https://creativecommons.org/licenses/by/4.0/).