Article

Analysis of Enhanced Geothermal System Development Scenarios for District Heating and Cooling of the Göttingen University Campus

1
Geoscience Centre, Department of Structural Geology and Geodynamics, Georg-August-Universität Göttingen, Goldschmidtstraße 3, 37077 Göttingen, Germany
2
Universitätsenergie Göttingen GmbH, Hospitalstraße 3, 37073 Göttingen, Germany
3
HAWK Hildesheim/Holzminden/Faculty of Resource Management, Göttingen University of Applied Sciences and Arts, Rudolf-Diesel-Straße 12, 37075 Göttingen, Germany
*
Author to whom correspondence should be addressed.
Geosciences 2021, 11(8), 349; https://doi.org/10.3390/geosciences11080349
Submission received: 7 June 2021 / Revised: 13 August 2021 / Accepted: 16 August 2021 / Published: 19 August 2021

Abstract

:
The huge energy potential of Enhanced Geothermal Systems (EGS) makes them perspective sources of non-intermittent renewable energy for the future. This paper focuses on potential scenarios of EGS development in a locally and in regard to geothermal exploration, poorly known geological setting—the Variscan fold-and-thrust belt —for district heating and cooling of the Göttingen University campus. On average, the considered single EGS doublet might cover about 20% of the heat demand and 6% of the cooling demand of the campus. The levelized cost of heat (LCOH), net present value (NPV) and CO2 abatement cost were evaluated with the help of a spreadsheet-based model. As a result, the majority of scenarios of the reference case are currently not profitable. Based on the analysis, EGS heat output should be at least 11 MWth (with the brine flow rate being 40 l/s and wellhead temperature being 140 °C) for a potentially profitable project. These parameters can be a target for subsurface investigation, reservoir modeling and hydraulic stimulation at a later stage. However, sensitivity analysis presented some conditions that yield better results. Among the most influential parameters on the outcome are subsidies for research wells, proximity to the campus, temperature drawdown and drilling costs. If realized, the EGS project in Göttingen might save up to 18,100 t CO2 (34%) annually.

1. Introduction

According to the report by the German Federal Ministry for Economic Affairs and Energy (BMWi) [1], the share of geothermal energy in renewable-based electricity generation in Germany in 2019 was just 0.1%. The analogous value for heat generation is 8.9%. While 8.2% are related to shallow geothermal energy, which is usually used for local, decentralized low temperature applications in urban areas [2], deep geothermal energy accounts for only 0.7%. At the same time, deep geothermal energy is potentially an enormous source of renewable energy of a non-intermittent nature that has low land and water requirements and significant CO2 sequestration potential [3,4]. Other positive and negative sustainability issues of geothermal energy are reviewed in Ref. [5].
An Enhanced (or engineered) Geothermal System (EGS), which is also referred to as Hot Dry Rock (HDR) in some works, is a technology implying artificial enhancements of rock permeabilities, e.g., by the creation of new fractures in rocks or by opening and/or widening preexisting ones to extract geothermal energy from depths of 3–5 km where sufficient natural permeability is low or absent [6]. In paper [7], the authors developed a subsurface model for evaluating maximum electric output from an EGS in dependence on brine flow rate and the distance between the wells. The authors estimated that 13,450 EGS plants can be built in crystalline areas in Germany providing 474 GWel (4155 TWhel). At the same time, the technical potential of EGS in Europe was assessed at 6560 GWel [8], which is a significant amount of renewable energy. However, the risks and uncertainties of developing EGS are still high. This is why various research groups currently focus on the development and exploitation of EGS and overcoming related geological, technical, economic, ecological and social issues and risks [9,10,11,12,13,14].
As of now, the technology is not mature enough, and there are just a few successful R&D or commercial EGS projects, e.g., [15,16]. Most of them have been realized in igneous and sedimentary rocks and have reservoir temperatures less than 165 °C and flow rates less than 40 l/s [17]. However, there are some exceptions, e.g., the geothermal heat plant in Rittershoffen producing more than 70 l/s of brine with temperature of 170 °C [18].
Many research works related to EGS focus on electricity generation or combined generation of heat and power via Organic Rankine Cycle (ORC) or Kalina cycle [19,20,21]. In [22], multiple-criteria decision making (MCDM) for EGS and a decision-making tool were presented, and the authors used the tool to calculate the levelized cost of electricity (LCOE) and perform a sensitivity analysis. Levelized costs of electricity generated from EGS were acquired and analyzed in other works as well [23,24,25,26]. The values of LCOE for solar-geothermal plants in Northern Chile were estimated in Ref. [27]. In the work [28], Monte Carlo simulations were used to assess the LCOE of a double-flash geothermal plant, and the values were compared with gas prices. The investments in the plant are more attractive if natural gas prices are higher. Two software packages, EURONAT and GEOPHIRES, were used in Ref. [29] for economic studies, and the authors concluded that EGS facilities are not likely to be competitive with either renewable on non-renewable energy sources by 2030. Nevertheless, the latest studies and reports by different organizations [30,31,32,33] have shown that the LCOE of renewables, including geothermal energy, is already competitive or even lower than the LCOE of fossil fuel-based alternatives. The findings of work [34] show that 4600 GWel of EGS with an LCOE less than 50 €/MWhel can be installed worldwide by 2050.
While renewable energy sources met 42.1% of Germany’s gross electricity consumption in 2019, the share of renewables in the final energy consumption in the heating/cooling sector was just 14.7%. In addition, final energy consumption was 576 TWhel and 1218 TWhth, respectively [1]. It can be observed that Germany’s energy transition (Energiewende) focuses much more on the electricity sector than on the heating and cooling one. Additionally, electricity (e.g., from distant wind farms) can be transmitted on long distances easier than heat. This is why this work considers EGS as a locally available energy source to cover the base load for heat and cold supply rather than for electricity supply. The latter can be met by various other renewable energy sources like solar, wind energy or biomass.
In work [35], the authors also used the tool GEOPHIRES to estimate LCOE and levelized cost of heat (LCOH) for different technology readiness levels of EGS. The estimated value of LCOH for today’s technology is about 42 €/MWhth. In the study [36], LCOH for a doublet in the West Netherlands Basin with a production rate of 200 m3/h was estimated at around 30 €/MWhth. The cost of geothermal heat for oil sands extraction in Northern Alberta (Canada) was estimated at up to 38 €/MWhth [37]. An economic analysis made for a university in the USA showed that a low-potential geothermal reservoir at a 3-km depth assisted by a heat pump can supply the university’s district heating system, the LCOH being about 20 €/MWhth [38]. The perspective development of CO2 storage technologies is CO2-EGS, which utilizes CO2 as the circulating heat exchange fluid or the working fluid. For potential cogeneration of CO2-EGS in Central Poland, the calculations showed that LCOH varies from 25 to 45 €/MWhth [39].
The existing literature gives quite a good overview of economic indicators of electricity and heat generation from geothermal systems. Meanwhile, the majority of LCOH values found in different works show a quite promising and optimistic economic picture when considering that the current average costs of heat from oil and gas boilers in German households are 65–75 €/MWhth [40] and from natural gas CHP—74 €/MWhth [41]. This means that energy transition from fossil fuels to geothermal energy in Germany might be quite attractive. However, this work focuses on the EGS exploration of metasedimentary sequences of the Variscan fold-and-thrust belt in the Göttingen region, which has been poorly investigated as of yet, especially with regard to geothermal exploration and exploitation. This is why one of the goals of this work is to perform an economic and ecological analysis of different potential scenarios on the preliminary stage of EGS development for district heating and cooling of the Göttingen University campus. Such analysis is necessary because of many geological uncertainties of EGS exploration in a Variscan geotectonic setting, and it is supposed to show the minimum required brine parameters of a successful EGS project, which will be a target for subsurface investigation, reservoir modeling and hydraulic stimulation at a later stage. Another goal is to show potential investors and stakeholders the range of possible outcomes of EGS development and define which factors are the most important for the outcome and need of increased attention when developing EGS systems.

2. Background

The campus of the Georg August University (UGOE) and University Medical Centre (UMG) (both UGOE and UMG referred to as “the university” further on) takes up a large area in the center and in the north of the city of Göttingen. Being a demo site of the EU Horizon 2020 project MEET (Multidisciplinary and multi-context demonstration of EGS exploration and Exploitation Techniques and potentials [42,43]), the university has a good chance to commit itself to renewable energy utilization, and particularly to geothermal energy by developing an EGS concept in deformed metasedimentary rocks. In the best-case scenario, the Göttingen demo site can become a real laboratory for exploring and expanding the knowledge about EGS in Variscan fold-and-thrust belt and serving as a representative case study for other places with similar geotectonic settings in Europe.

2.1. Geological Setting

The geological setting in Göttingen and its vicinity is quite poorly investigated since there are only a few exploration wells with a maximum depth of 1500 m in the surrounding area. This indicates that the exploration of geothermal energy potential in Göttingen is currently at a very early stage. However, some progress was made in 2015 when a seismic campaign with two profiles crossing the campus area at an exploration depth of 1500 m validated that the upper several thousand meters of the subsurface of Göttingen are built up of three main units [44]:
  • The lowermost unit (below 1500 m) represents low-grade metamorphic basement mainly consisting of Devonian and Carboniferous metasedimentary and metavolcanic successions (greywackes, slates, quartzites, cherts, diabase) that have been folded and thrusted during the Variscan Orogeny in the late Carboniferous;
  • A Permian sedimentary sequence (several hundred meters of thickness) on top of the basement unit. It starts with either no or only locally deposited metavolcanics or sandstones of the Rotliegend as well as sequences of rock salt, potash salt, anhydrite, dolomite and clay-dominated layers of the Zechstein age;
  • The uppermost major unit comprises the sedimentary cover (500 to 800 m of thickness) made up mainly of sandstones, clay rocks and limestones of the Triassic age (Buntsandstein, Muschelkalk and Keuper).
The whole sequence is overprinted tectonically by the north−south striking Leinetal Graben structure which developed during Mesozoic to Cenozoic times. It is still not clear whether the faults continue into the Variscan rock sequences or if they are decoupled mechanically by the Zechstein successions and possibly located elsewhere. Within the Leinetal Graben structure, Quaternary alluvial and wind-carried sediments form an additional unit of minor thickness but of importance regarding the utilization of shallow geothermal systems.
Considering the very low natural permeability of the basement, either EGS or a deep closed loop system with horizontal multilateral wellbores can be applied [45,46]. In this study, only EGS is considered, which means that permeability is to be increased by hydraulic stimulation. However, for the Variscan geotectonic setting underneath Göttingen, the fluid flow rate after the stimulation is not expected to be higher than 50 l/s.

2.2. Current Energy System of the Campus

The campus’ main energy supplier is a combined heat and power (CHP) plant which includes a gas turbine and several steam and hot water boilers. The existing high-temperature district heating (HTDH) network (13 km of pipelines) delivers heat from the plant to the consumers of the campus. Apart from electricity and heat for district heating, the UMG also needs steam and cold. The latter is produced by both absorption cooling (base load) and vapor compression machines (peak load). In 2018, total natural gas consumption of the CHP plant and boilers for producing electricity (partly for cold), hot water (district heating) and steam (partly for cold) for the campus was about 358 GWh/a [47], and corresponding CO2 emissions were about 72,000 t/a. Additional indirect emissions resulted from an external power grid and external district heating for the campus (about 22,000 and 5000 t/a, respectively).
The complete renewal of most of the UMG buildings within the next 15–20 years and the soon-expected end of the gas turbine lifetime (produced in 1997) put a question to the UGOE and the UMG on what their energy supply system should consist of in the future. The plans of the university involve the construction of not only new buildings but also a low-temperature district heating (LTDH) network. Although it is not exactly clear at the moment at which level of temperatures the planned LTDH network will operate, design supply and return temperatures in the network for this work were assumed to be 70 °C and 40 °C, respectively. This level of temperatures correlates with Refs. [48,49]. Additionally, steam absorption cooling machines are planned to be replaced with low-temperature ones supplied by hot water with the minimum temperature of 70 °C. Although these measures are good prerequisites for utilization of geothermal energy at different depths and for energy transition at the campus, other additional measures can be also considered [50], including an integrated energy concept, energy efficient construction of new buildings and refurbishment of old buildings of the campus. The latter aspect is one of the key elements of a successful energy transition and CO2 neutrality until 2050 [51].

2.3. Initial Data and Scenarios

Since there are no geological and geophysical well data and no reliable numerical reservoir models yet, several probable scenarios for brine flow rate and wellhead temperature were considered. The values varied from 10 to 50 l/s with a step of 10 l/s and from 90 to 140 °C with a step of 10 °C, respectively. Higher flow rates and temperatures can hardly be expected in this Variscan geological setting. The density and specific heat capacity of the brine were derived from dependencies provided in Ref. [52]. Average geothermal gradient was considered to be a standard value for Europe, which is 30 °C/km [53]. There are no accessible or reliable data on the geothermal gradient for a better specification for the Variscan basement. Several other uncertain parameters were composed in the reference case and two cases for sensitivity analysis: unfavorable and favorable deviations, which are presented in Table 1. The values of CO2 tax equal to 55–65 €/t correspond to the ones set by the German Government and coming into effect from 2026 [54]. Since CO2 taxes in Sweden and Switzerland are already much higher [55], 100 €/t was also considered as additional favorable scenario in this work. Parameter “Subsidy for production well” included 50% or 80% (both favorable deviations) subsidy for drilling and stimulation of the research well (to be transformed in the production well later on).
The EGS system in Göttingen is supposed to represent a doublet (one production and one injection well). The research (production) well depth was assumed to be 5000 m since it is not known at what depth the most suitable conditions can be found. Only after a first research well is drilled, it will be clear at what depth an EGS could be developed with the highest efficiency. Thus, the depth of the second well (injection) is a variable, and it is defined by the considered temperature scenarios and the geothermal gradient.
For different values of the parameter “Distance to the campus”, heat losses in the pipelines and specific electricity consumption for pumping the heat carrier from the site to the campus were assumed based on Ref. [56] and are shown in Table 2.
Usually, it takes from 5 to 7 years to develop a deep geothermal project from the early stages of exploration to operating facilities [57,58]. In order to make planning of the geothermal system construction clear and coherent with the planning of the reconstruction of the campus’ buildings, the Gantt chart for potential EGS development in Göttingen is proposed in Table 3. There are also the reference case, unfavorable deviation and favorable deviation in the chart. Parameter “Construction time” from Table 1 correlates with the parameter “Start of operation” from Table 3.
For investors, important milestones in the chart are marked with darker shades, which means moments when investments for the project are needed. The investments can be split up into three parts: the research well (on average 45%), the second well (on average 37%), and surface infrastructure (on average 18%). The decisive part of the whole project is the first one, when the research well drilling is financed, the research work is done and it will be clear what outcome can be achieved. In case of geologically unsuitable and unpromising conditions leading to a failure of the project, the first part of the investments is lost and the other two parts make no further sense for investors. This shows that EGS projects can be quite risky and not very attractive for investors. However, there are initiatives and projects aiming at establishing financial instruments for insurance of deep geothermal projects [59] which might be able to attract investors.

3. Materials and Methods

Based on the test reference year data from the German weather service [60] and internal documents from the university, an expected heat load profile of the campus after its reconstruction, which includes the heat demand for the new (to-be-built) buildings, for the existing buildings (a part of the existing buildings is planned to be deconstructed, and only remaining buildings are meant here) and for the absorption cooling machines was compiled. The assumption was made that a potential EGS supplies the new buildings as the first priority, then the remaining existing buildings, and, in the last turn, the absorption chillers. The calculations of the total EGS heat generation were performed considering the limitation that the injection temperature is at least 5 °C higher than the return temperature from a consumer and not lower than noted in Table 1.
The main focus of the methodology is the calculation of LCOH, net present value (NPV), and CO2 abatement cost for the campus for different scenarios described in Section 2.3. These parameters are one of the main indicators for potential investors and stakeholders to make a decision with regard to an EGS project. A spreadsheet-based (Microsoft Excel 2019) model, which is explained below, was developed for evaluating those parameters.
Capital expenditures (CAPEX) include the following components:
CAPEX = C d r i l l + C s t i m u l + C p i p e s + C l a n d + C m a n a g e + C e q u i p
where:
  • C d r i l l —cost of drilling. Dependencies of drilling costs from depth were acquired from several sources [61,62,63,64,65], and the average values are plotted in Figure 1 and were taken for the calculations.
  • C s t i m u l —cost of hydraulic stimulation; assumed to be 2 M€/well.
  • C p i p e s —cost of the main pipelines from the site to the campus (distribution pipelines are already a part of the existing HTDH network and not included here, and the cost of the planned distribution LTDH network is also not included); derived from work [66].
  • C l a n d —cost of land; specific value was assumed to be 37.5 €/m2 [64]. Land requirement is 5000 m2/MW [67]. For the scenario “0.5 km from the campus”, this cost is zero since the university already owns the land.
  • C m a n a g e —cost of project management, cost of campaigning for public acceptance and other costs [64,68].
  • C e q u i p —cost of equipment (pumps, heat exchangers, piping valves, auxiliaries), which can be calculated as follows:
    C e q u i p = C s u b _ p u m p s + C p u m p s + C H E X + C v a l v e s
  • C s u b _ p u m p s —cost of submersible pumps; derived from Ref. [69] using Producer Price Index (PPI) equal to 1.6 [70] (exchange rate in November 2020: 1 USD = 0.85 EUR). The pumps are to be replaced every 5 years.
  • C p u m p s —cost of circulation pumps for district heating network. The values were obtained from price lists of manufacturers.
  • C H E X —cost of surface heat exchangers; average specific cost is 0.009 M€/MWth [61].
  • C v a l v e s —cost of piping valves and auxiliaries; assumed to be 25% of the equipment cost.
Operational expenditures (OPEX) include the following components:
OPEX = C e l _ p u m p + C l a b o r + C m a i n t e n + C i n s u r
where:
  • C e l _ p u m p —annual cost of electricity for pumping. Submersible pumps’ electricity consumption was assumed to be 10% of the total heat production from EGS [67,71]. For the circulation pumps in the district heating network, specific values from Table 2 were used. The electricity price for non-households in Germany in 2020 was 178 €/MWhel [72].
  • C l a b o r —annual cost of labor [64].
  • C m a i n t e n —annual cost of maintenance and repair [64].
  • C i n s u r —annual cost of insurance and legal assistance [64].
LCOH was calculated according to Ref. [73]:
LCOH = j = 0 L C A P E X j + O P E X j · 1 + d n j j = S L Q e g s j · 1 + d n j
where C A P E X j —capital expenditures from year 0 to S ; O P E X j —annual operational expenditures from year S to L ; S —year of the operation start; L —total project lifetime; Q e g s j —annual amount of heat delivered from the EGS to the campus (from year S to L ) considering heat losses derived from Table 2; d n —nominal discount rate [74], which can be calculated by Equation (5):
d n = 1 + d r · 1 + e 1
where d r —real discount rate; e = 0.015—annual average inflation rate [72].
Operational lifetime was defined by temperature drawdown: the operation ends when the wellhead temperature reaches the value of 10 °C higher than the injection temperature. Otherwise, operational lifetime was considered to be 30 years.
NPV was calculated according to Equation (6):
NPV = j = 0 L C A P E X j O P E X j + Q e g s j · C h e a t 1 + d n j
where C h e a t = 89 €/MWhth—prognosed heat tariff (price) for the university from fossil-fuel based system taking into account the CO2 tax in Germany equal to 55 €/t from the year of 2026 [54]. For the favorable deviations of CO2 tax in Table 1, the heat tariff is 91 and 100 €/MWhth, respectively.
The CO2 abatement cost was calculated according to Equation (7):
A C = NPV j = S L C O 2 j s a v
where C O 2 j s a v —annual CO2 savings during operation from year S to L considering electricity mix and natural gas emission factors equal to 397 t CO2/GWhel and 202 t CO2/GWh, respectively [75,76]. Positive values of A C show how much money is required to avoid one ton of CO2 emission, while negative values show that the process is economically profitable.

4. Results

4.1. Heat Demand of the Campus and Potential Heat Supply from EGS

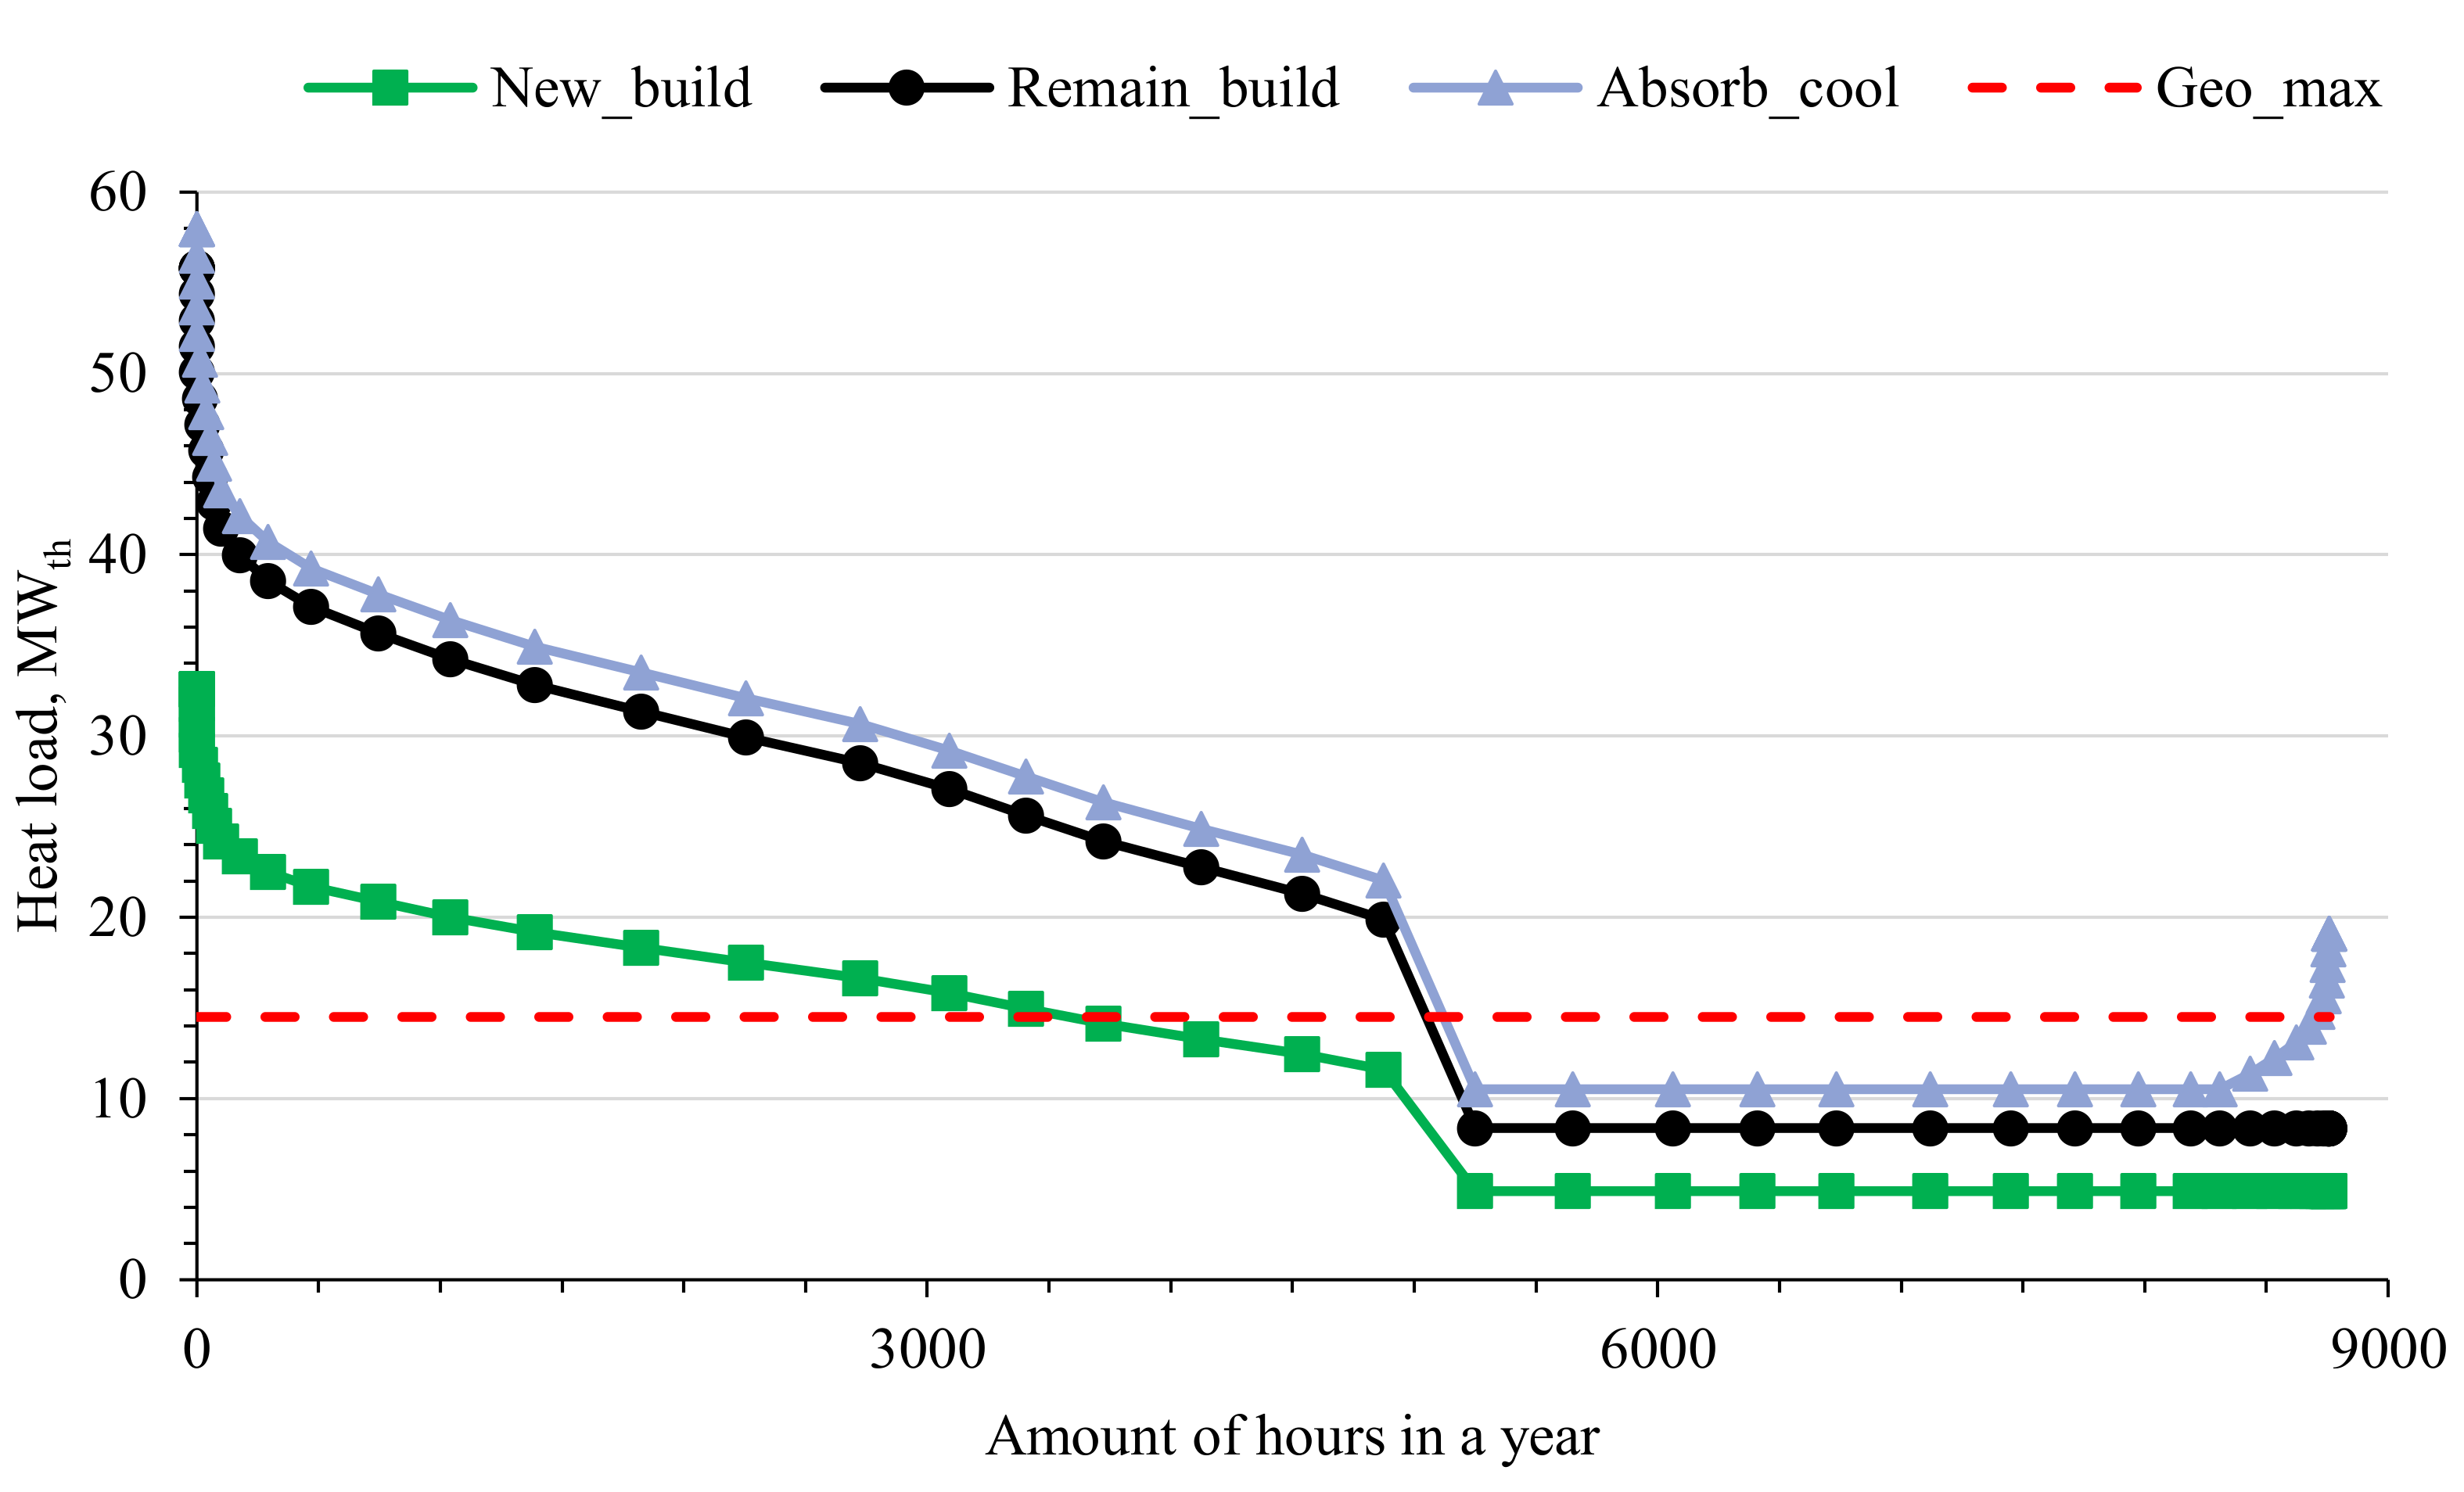
Figure 2 illustrates the expected heat load of the campus when its reconstruction is finished. The design heat load of the to-be-built buildings and the remaining existing buildings is estimated at 32.6 and 23.2 MWth, respectively, while the heat load of absorption chillers can reach up to 10.7 MWth in summer. Thus, the influence of the to-be-built buildings on the future heat and cold supply of the campus might be quite high. The heat demand of the campus in summer is, in many scenarios, lower than potential heat production. That is why practically achievable EGS heat generation is lower than the potential one. The red dashed line in Figure 2 displays the estimated maximum geothermal output, and in this case, the load factor is 88%, while other values of the output lead to higher load factors. The average distribution of geothermal energy between the heat demand of the to-be-built buildings, remaining existing buildings, and absorption cooling machines is 91%, 7% and 2%, respectively.
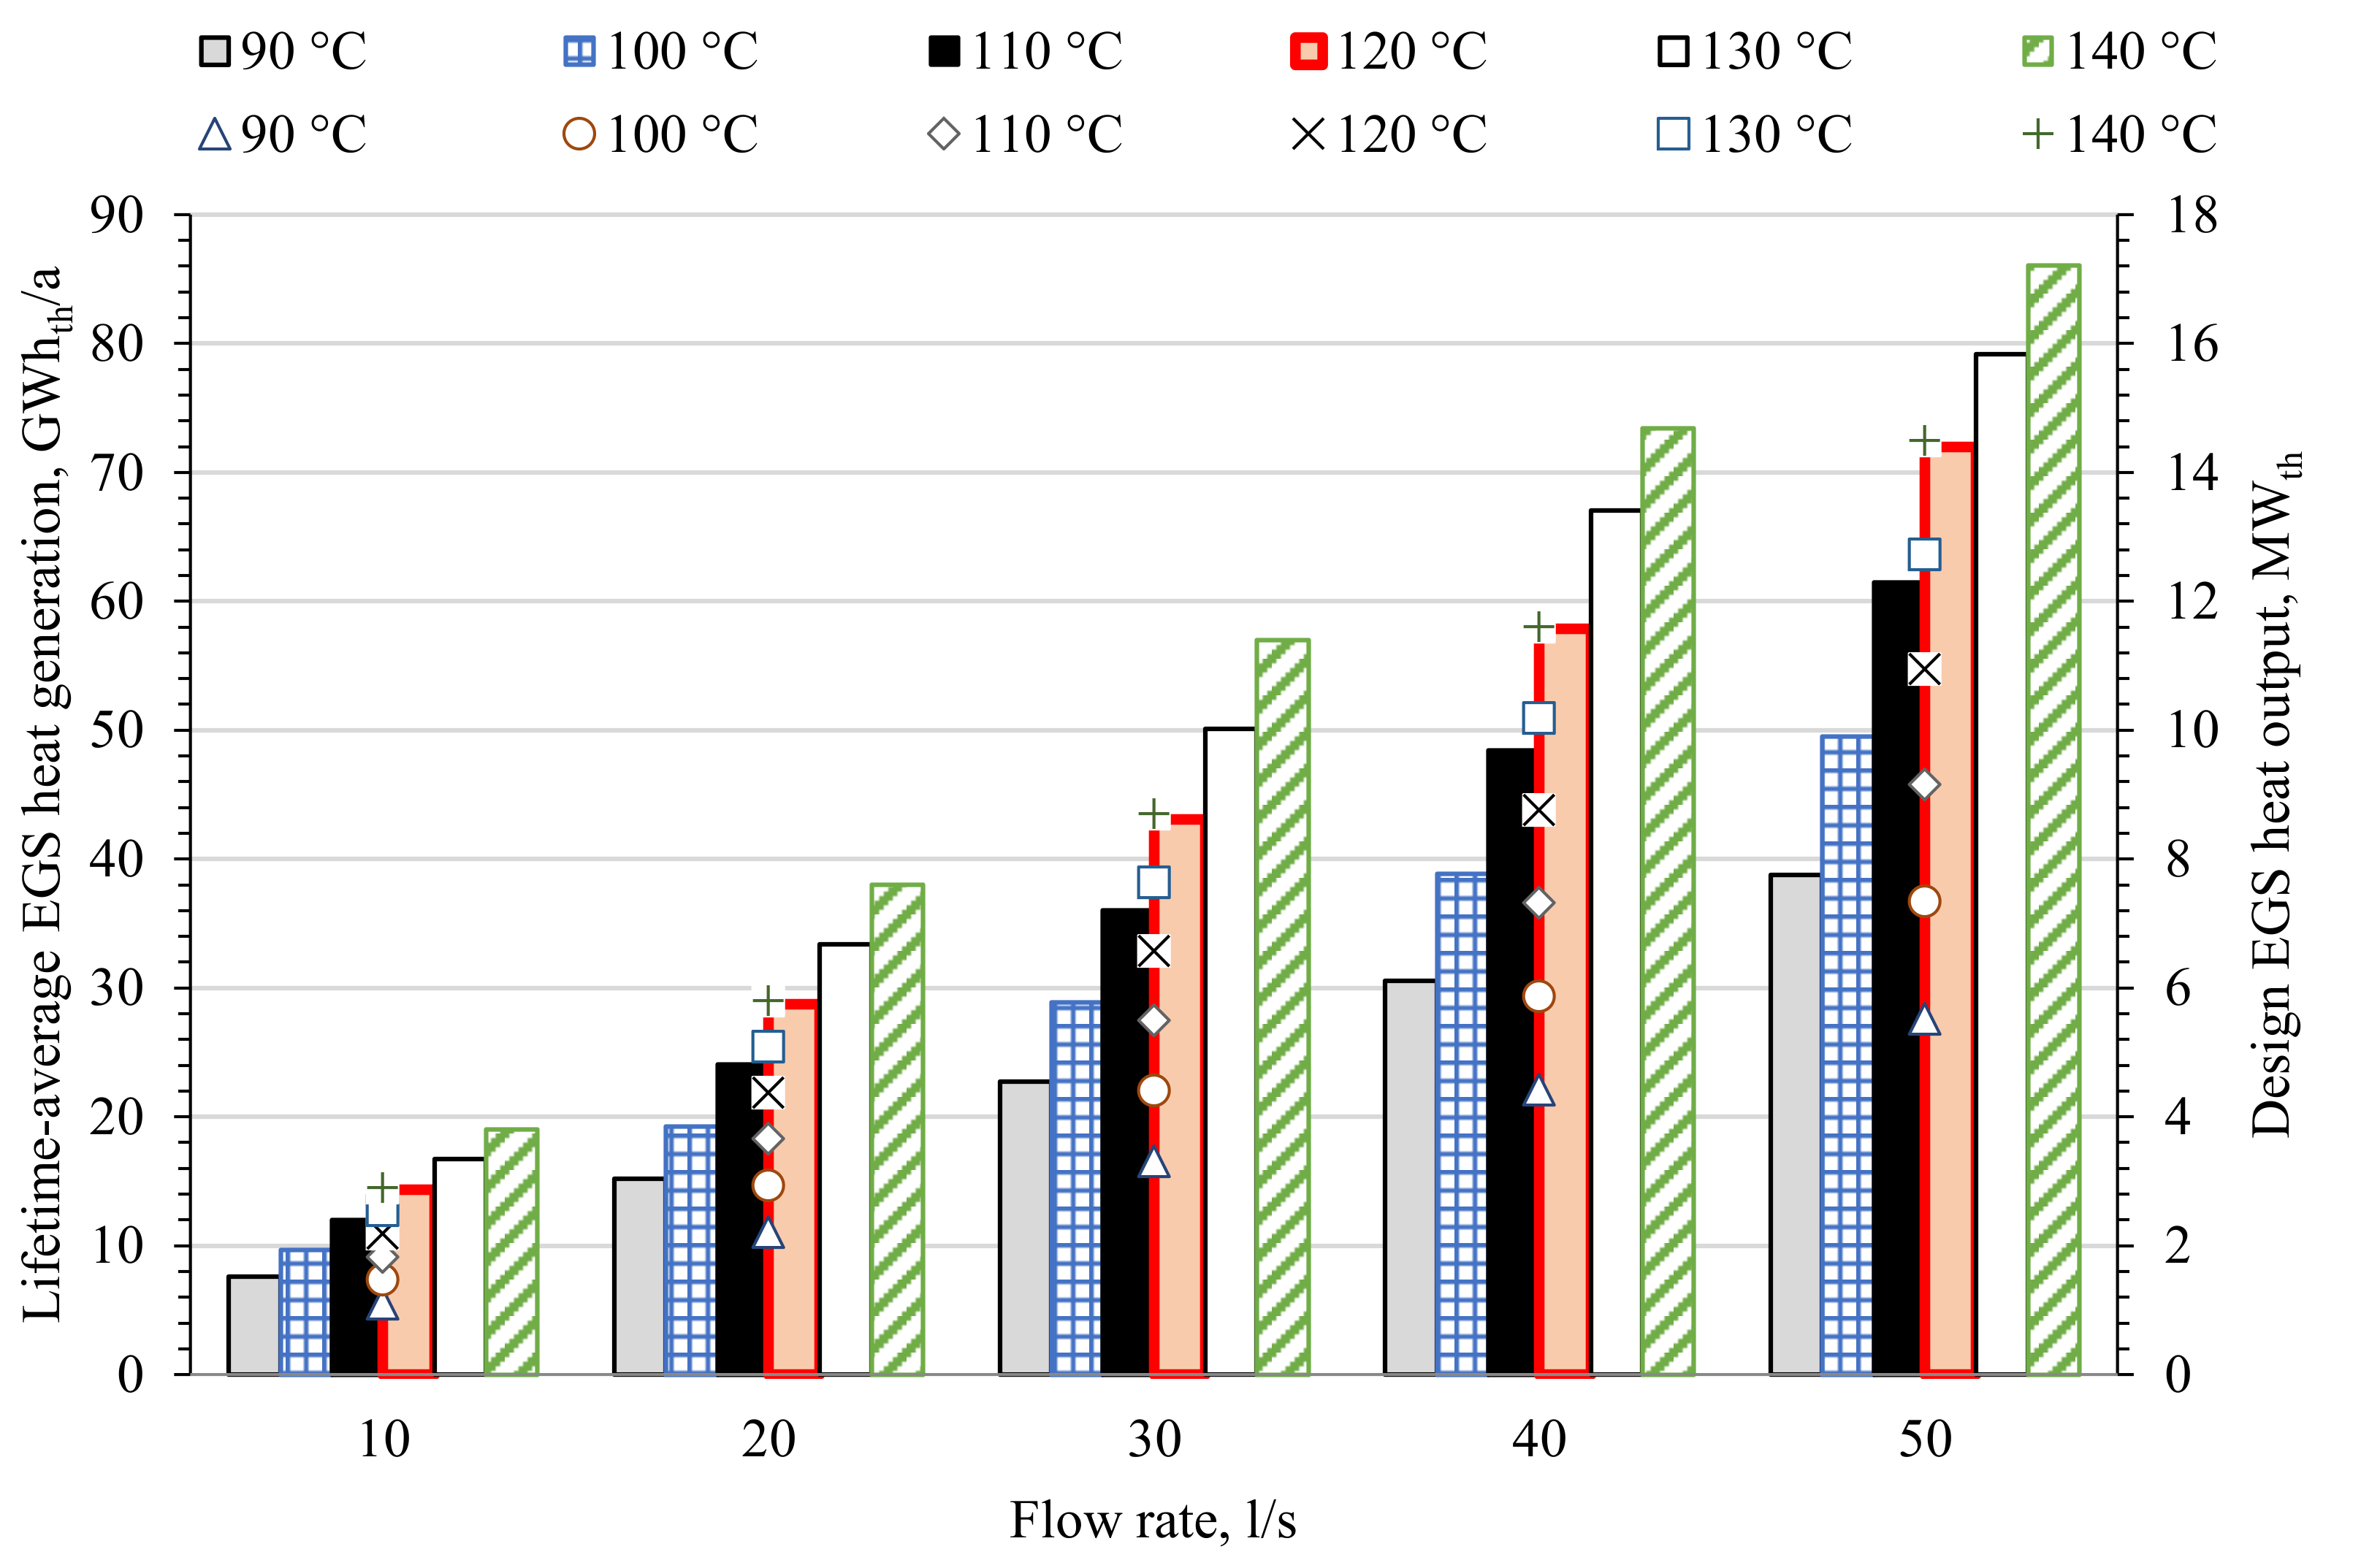
In Figure 3, lifetime-average EGS heat generation (without heat losses in the network) and design EGS heat output for the reference case are presented depending on brine flow rate and wellhead temperature. The heat generation can vary from 7.6 to 86.0 GWhth/a, while the heat output—from 1.1 to 14.5 MWth. Table 4 displays how much the heat demand of different consumers of the campus can be potentially covered by an EGS. On average, the values amount to 30.8%, 5.0% and 6.1% of the heat demand of new buildings, remaining existing buildings and absorption chillers, respectively. Existing heat and cold supply sources of the campus, which are supposed to cover the remaining demand, and back-up options were not considered in this study. Additionally, CO2 emissions from the fossil-fuel based heating and cooling system of the campus (the specific CO2 emissions are 252.7 g/kWhth) are shown in Table 4. Thus, from 3.6 to 41.1% of CO2 emissions could be theoretically saved if the EGS caused no greenhouse gas emissions during operation.

4.2. Economic and Ecological Results

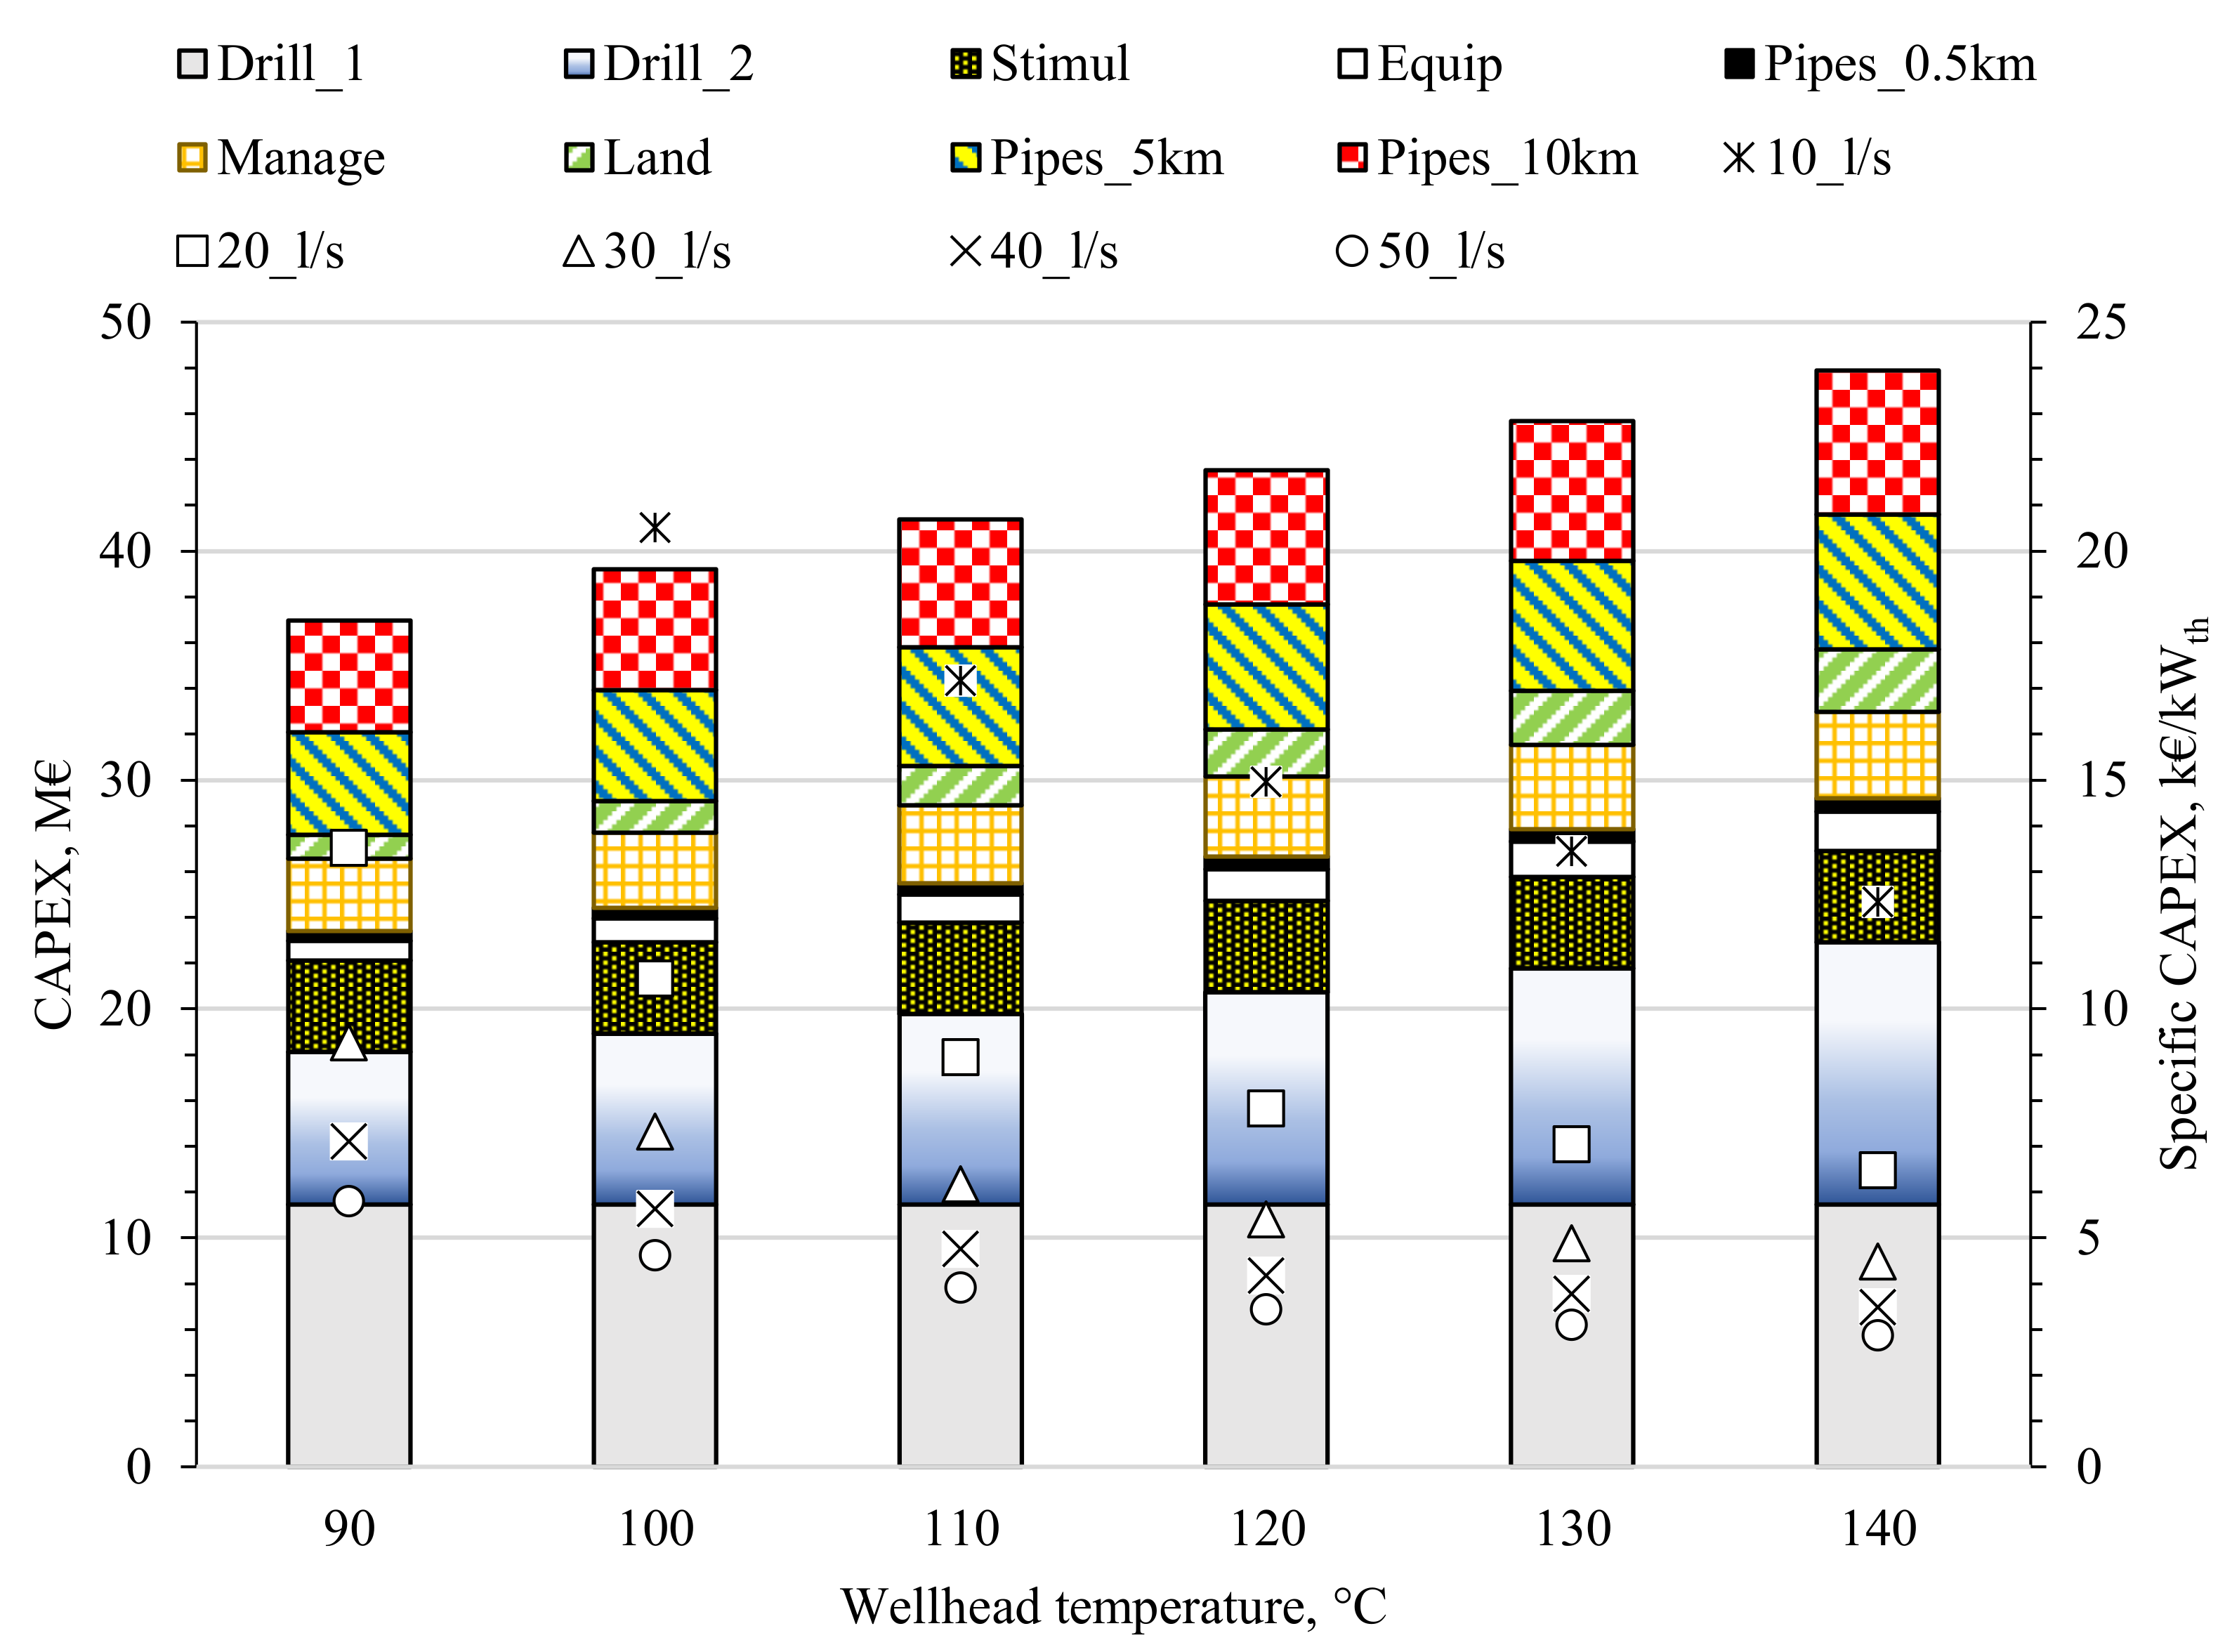
Capital expenditures for the reference case conditions along with 0.5 km, 5 km and 10 km scenarios are shown in Figure 4. Costs of drilling and stimulation of two wells represent from 56 to 86% of CAPEX, and the next costly items are the costs of pipelines and the cost of project management. It is worth noting that components “Land”, “Pipes_5 km” and “Pipes_10 km” are applicable only for 5 km and 10 km scenarios. Since drilling-related costs form the biggest part of the CAPEX, the components of CAPEX are presented in the chart only in dependence to the wellhead temperature, which is directly related to the drilling depth, and the influence of fluid flow rate on the total CAPEX is relatively small. In the same chart, specific CAPEX for different flow rates in the reference case are shown. The smallest values correspond to the highest considered flow rate (50 l/s); they vary from 5.8 to 2.9 k€/kWth for the temperatures from 90 to 140 °C. At the same time, the values for 10 l/s vary from 26.1 to 12.3 k€/kWth.
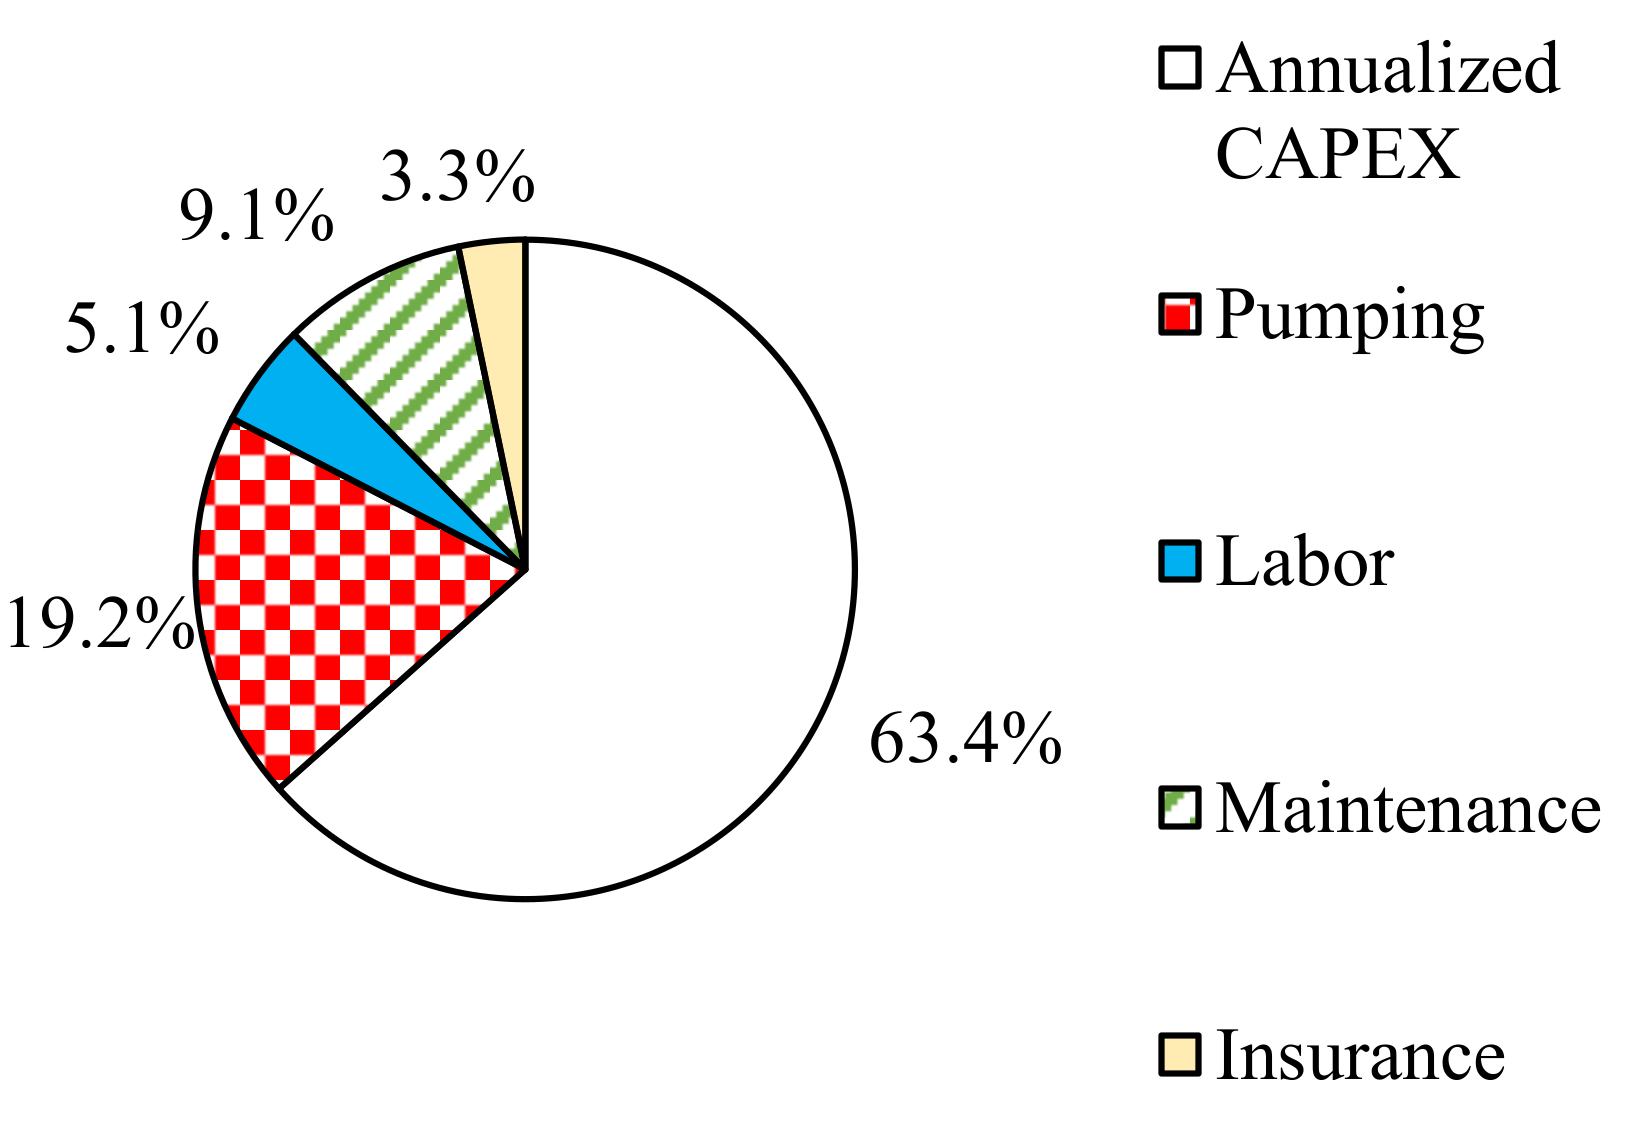
In Figure 5, temperature- and flow rate-average structure of operational costs and average annualized capital costs for the reference case are compared with each other. Annualized capital costs were obtained with the help of an annuity factor [77], but such an approach was used only in this part of the work to allow for the comparison in Figure 5. It can be noted that electricity costs for pumping represent the biggest part of the OPEX.
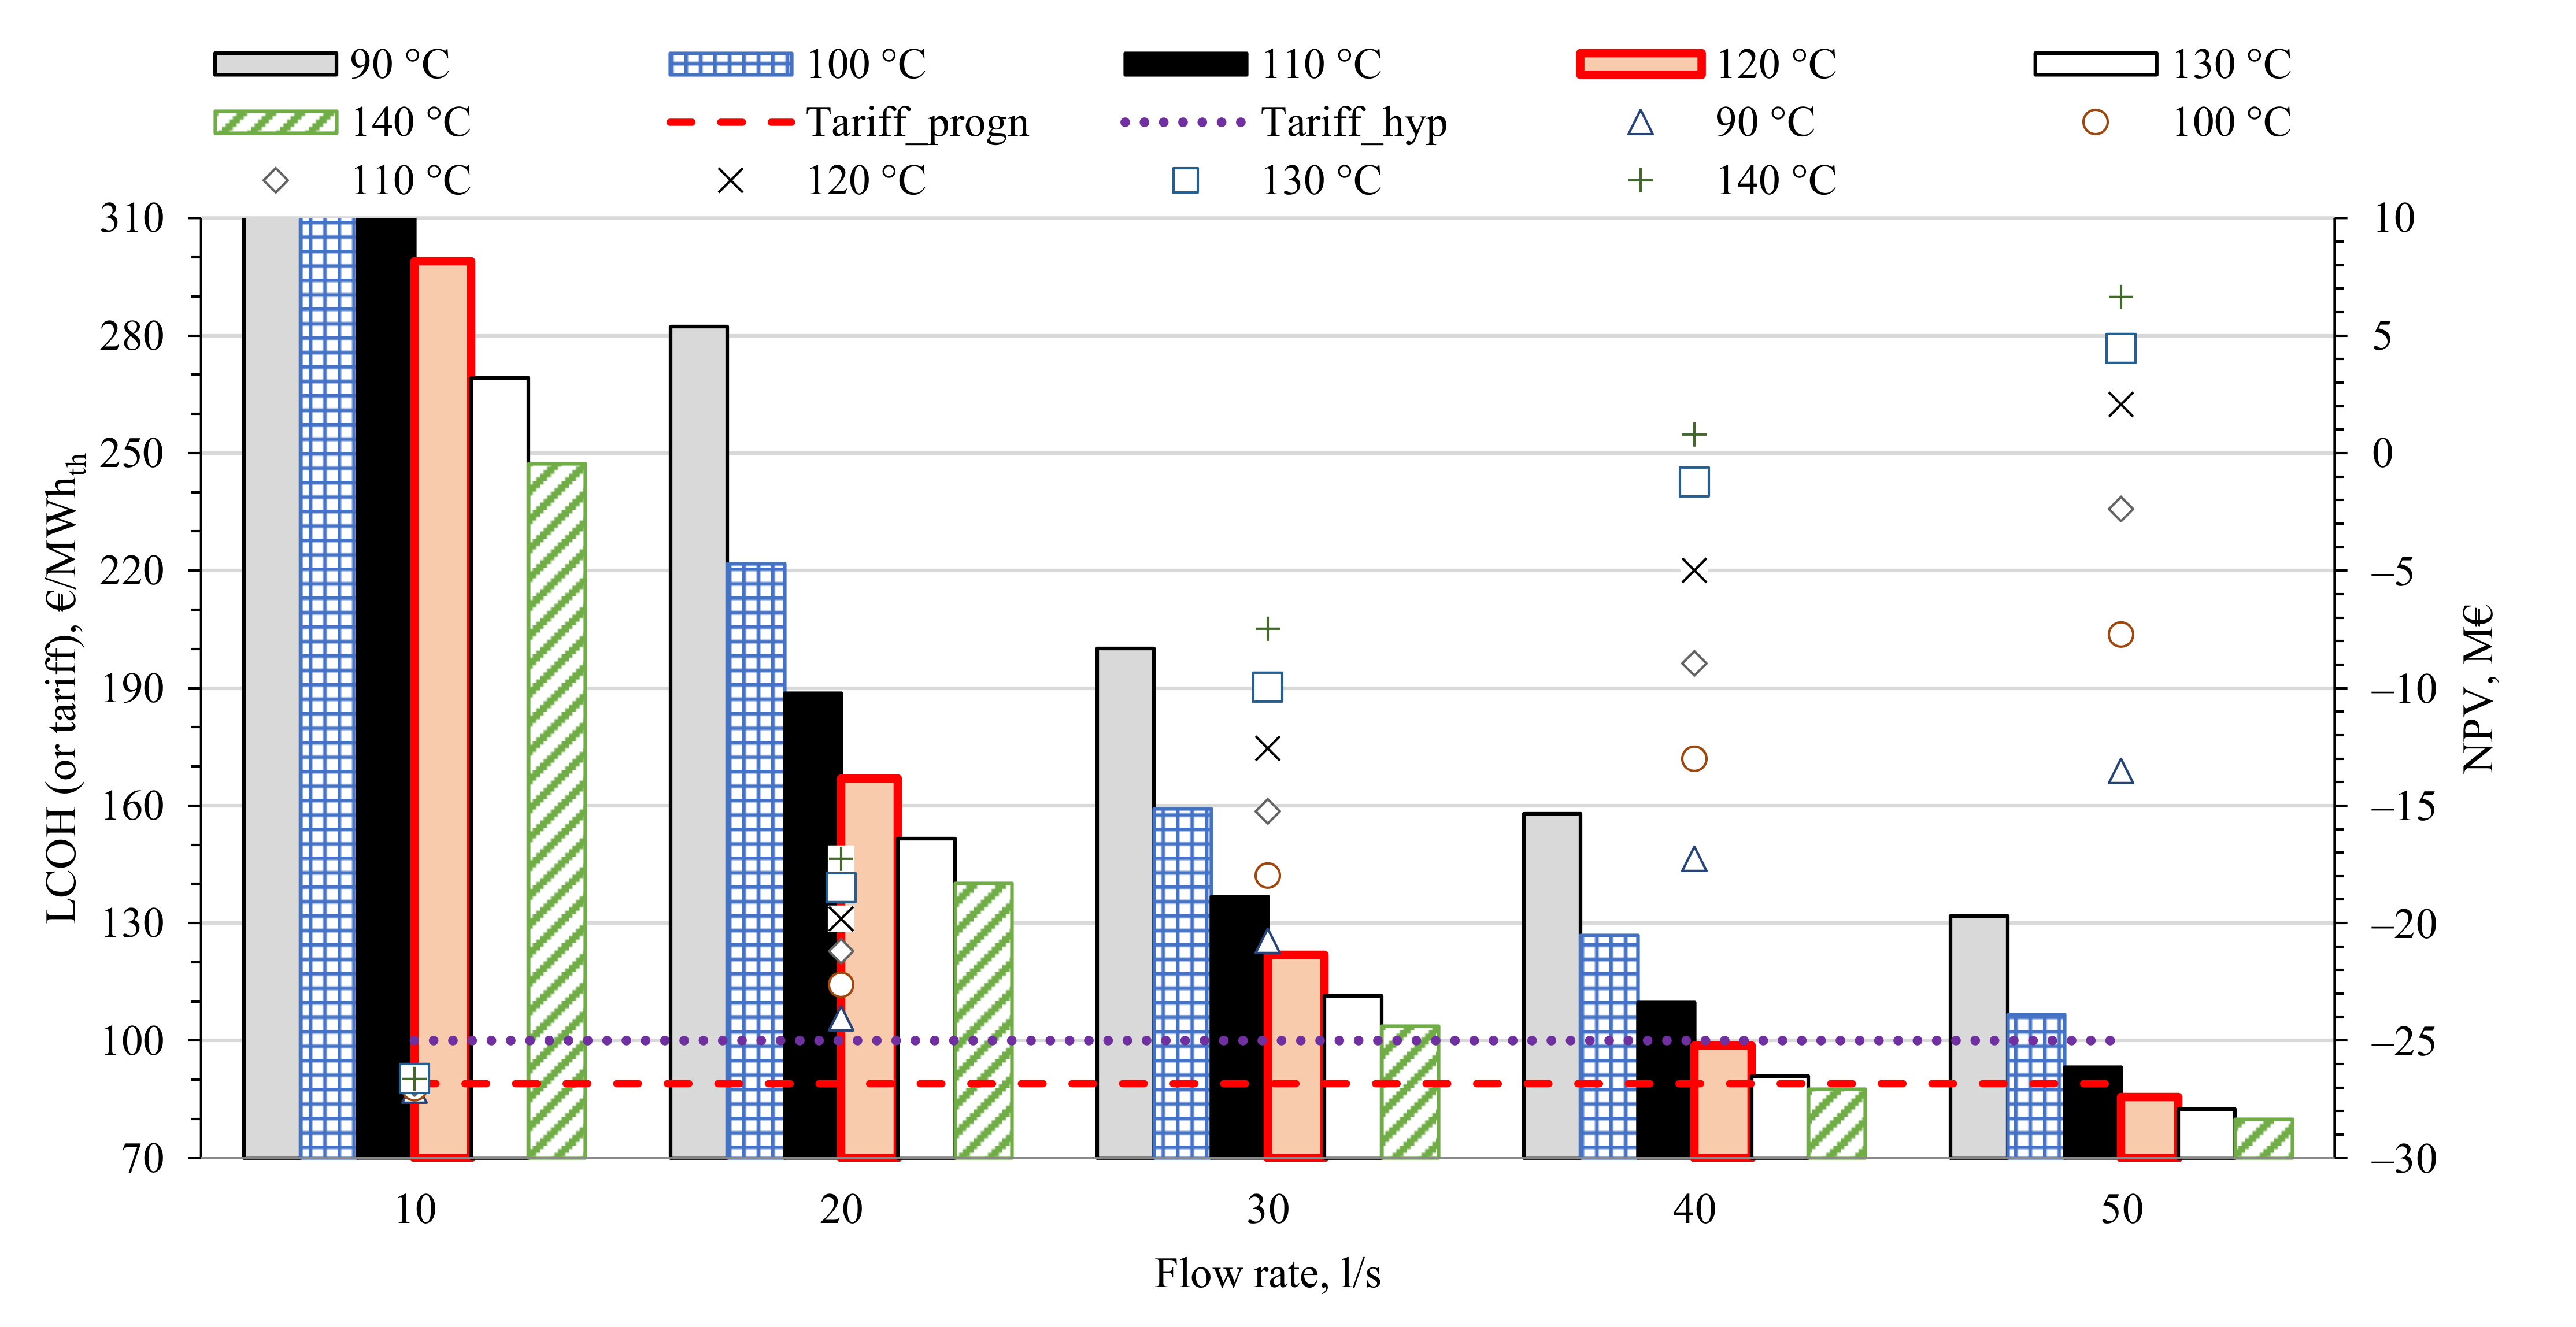
The results of LCOH and NPV calculations for the reference case are demonstrated in Figure 6. For illustrative comparison, the prognosed heat tariff for the campus (89 €/MWhth) from a fossil-fuel based system under CO2 tax equal to 55 €/t and a hypothetic heat tariff (100 €/MWhth if CO2 tax is 100 €/t) are also plotted in the chart. LCOH varies from 80 to 525 €/MWhth for the highest and lowest parameters of brine, respectively. It is clear that the majority of the scenarios of the reference case have worse LCOH than the prognosed fossil fuel-based heat tariff. The exceptions are the few scenarios with brine temperatures of 120 °C or higher and brine flow rates equal to 50 l/s, as well as the scenario with parameters 140 °C and 40 l/s. Although the scenarios with high temperatures and flow rates are considered in this work, their practical accomplishment in a Variscan geological setting is doubtful, especially regarding quite high flow rates such as 40–50 l/s. A slightly more realistic flow rate is 30 l/s, for which high temperature scenarios result in an LCOH of about 111 and 104 €/MWhth, i.e., relatively close to the prognosed heat tariff and might be even profitable under some favorable conditions. Scenarios with flow rates less than 30 l/s are far from being economically feasible.
As for the NPV values, they vary from −27.1 to 6.6 M€ for the lowest and highest parameters of brine, respectively. Most of the calculated values are below zero, except for the same high temperature and high flow rate scenarios as in the LCOH part. In general, the values of NPV show similar trends to LCOH. When looking at NPV values, the scenarios with the flow rate of 30 l/s and high temperatures seem to be not so optimistic since the highest achievable NPV for such scenarios is −7.5 M€; however, these can be improved under favorable conditions.
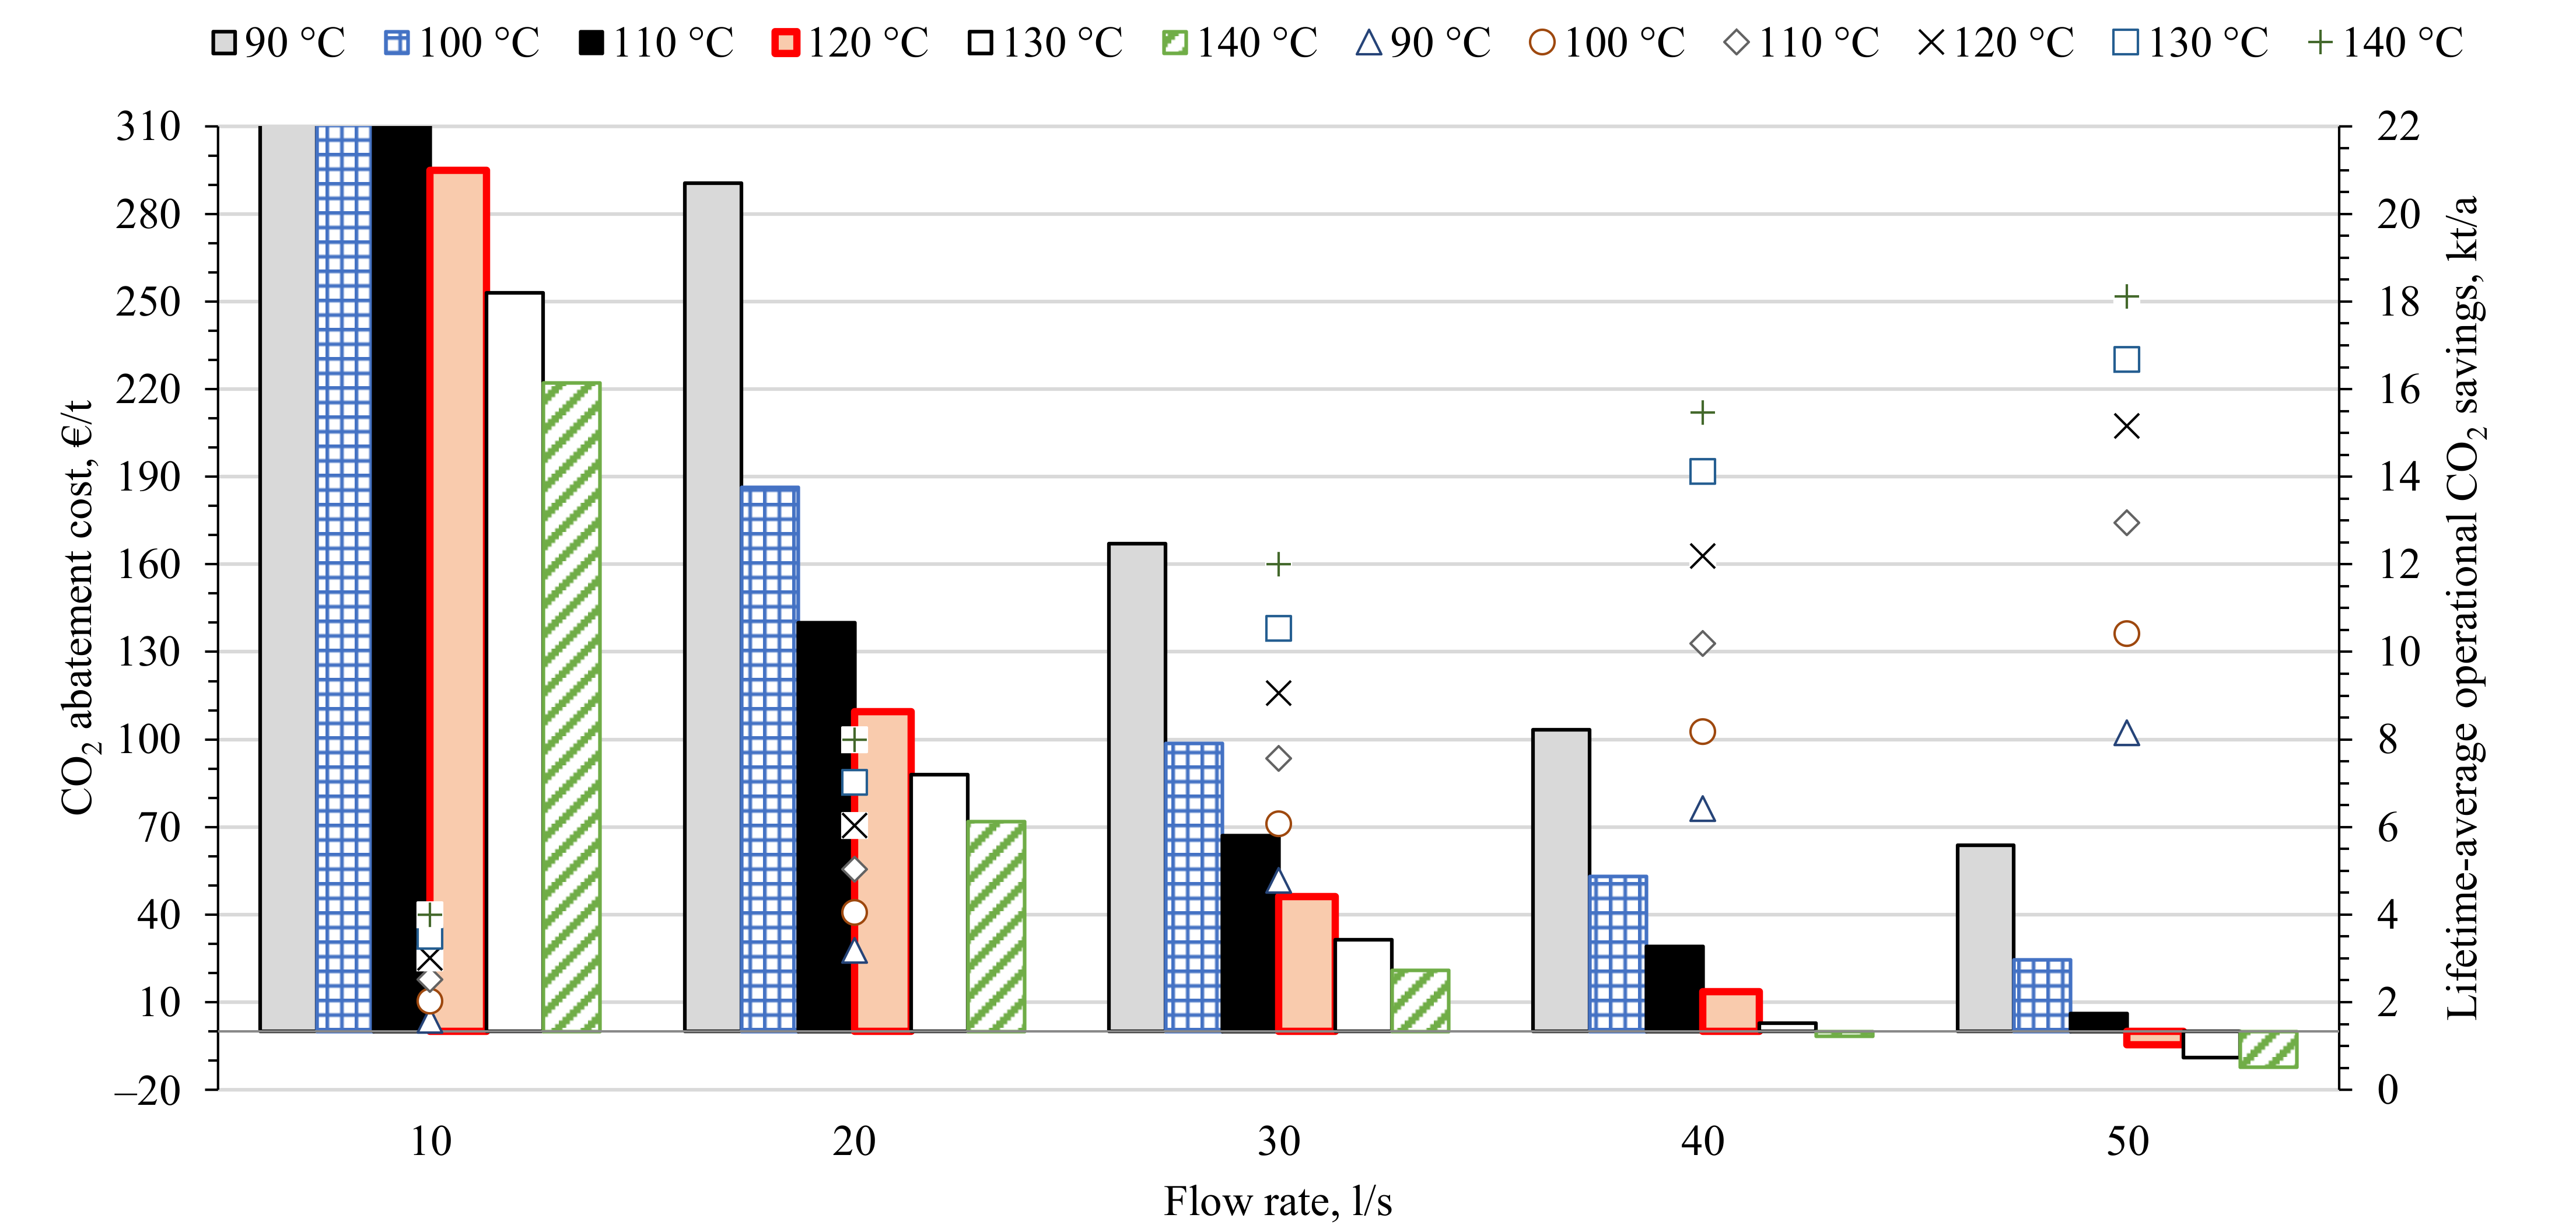
Even though many scenarios are not economically beneficial, their ecological effect is an important factor to consider. CO2 abatement cost and lifetime-average operational CO2 savings for the reference case are presented in Figure 7. The CO2 savings vary from 1.6 to 18.1 kt/a (3–34% of the emissions from the fossil-fuel based heat supply system of the remaining existing buildings, new buildings and absorption chillers) and the CO2 abatement costs—from −12 to 655 €/t. The highest parameters of the brine yield the best results, as it was demonstrated for LCOH and NPV. The high-temperature scenarios with brine flow rates of 30 l/s present quite acceptable CO2 abatement costs, which range from 21 to 31 €/t.
The average specific value of CO2 emissions resulting from the operation of a potential geothermal plant in Göttingen is 42.4 g/kWhth. In work [16], life cycle assessment for currently operating direct-use geothermal plant Rittershoffen in France was performed, which indicated that specific CO2 emissions are 7.0–9.2 g/kWhth. However, it should be noted that the nuclear power-dominated French electricity mix is nine times less carbon-intensive than the German one (44 g/kWhth vs. 397 g/kWhth) [75], which explains the difference.

4.3. Sensitivity Analysis

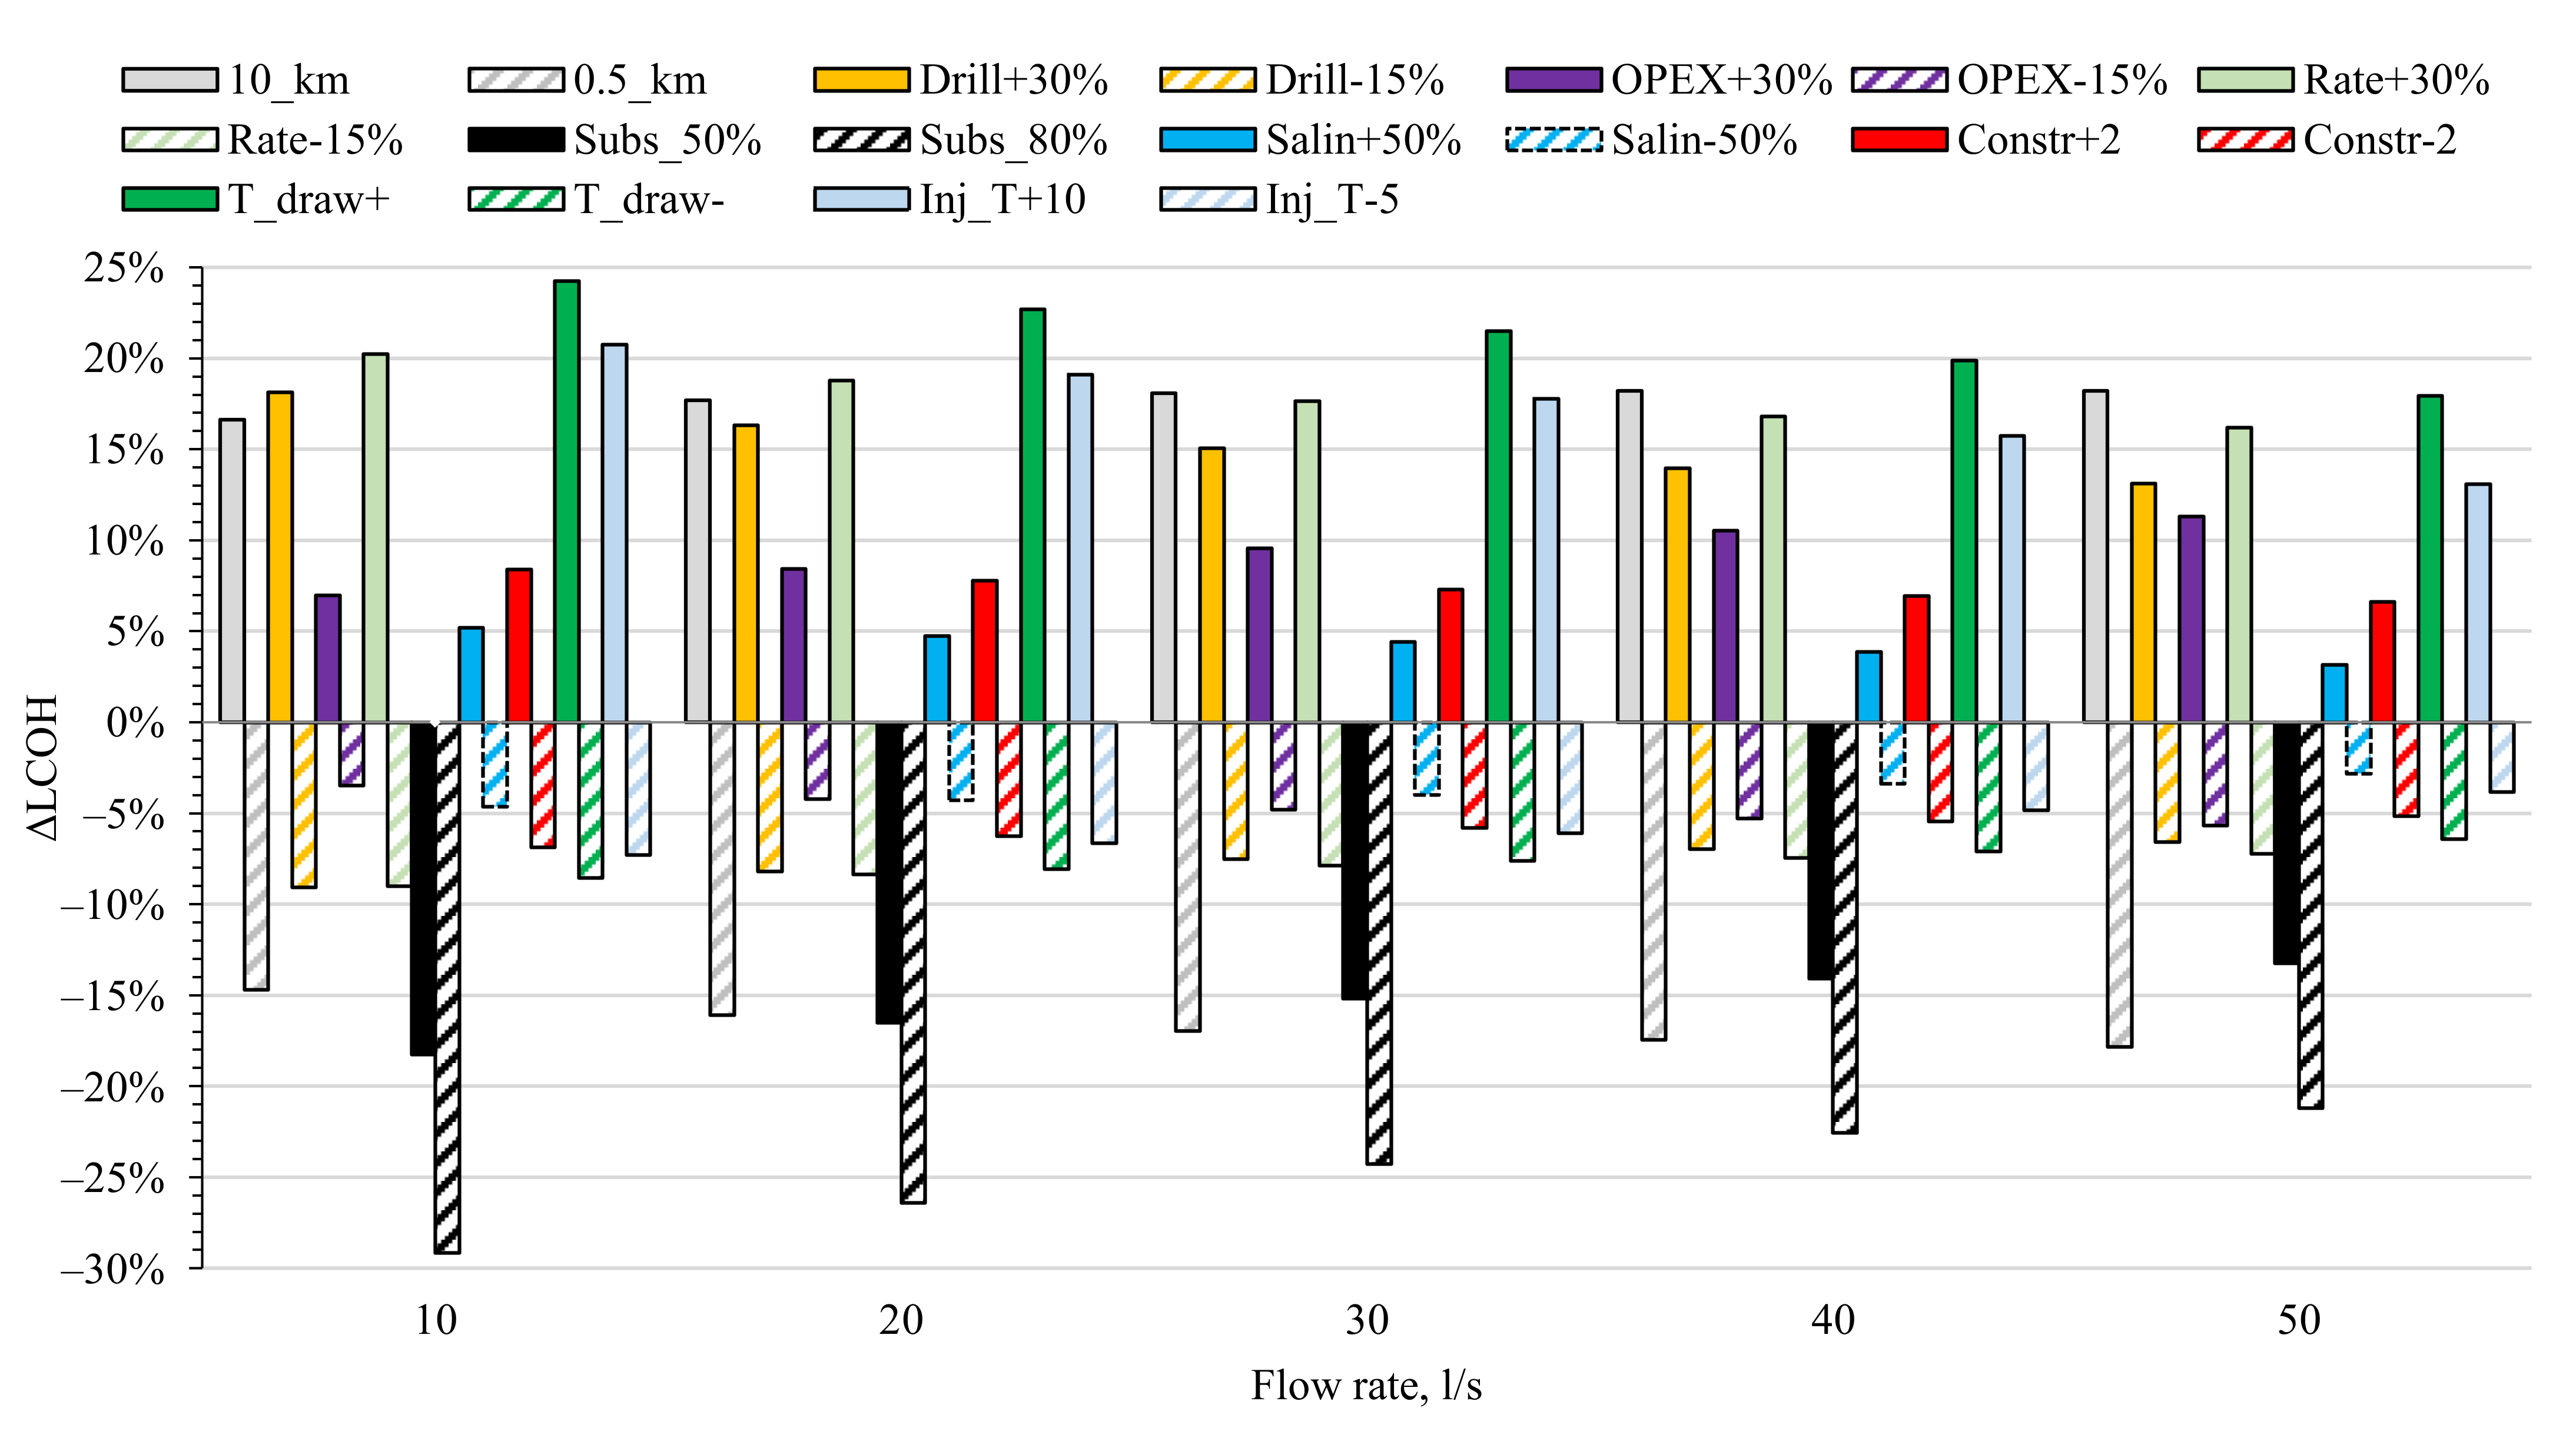
In order to cope with the uncertainty of the parameters and to get a better understanding of potential deviations from the obtained results of the reference case, a sensitivity analysis was carried out. The temperature-averaged results of LCOH sensitivity analysis for the parameters from Table 1 (unfavorable and favorable deviations) are displayed in Figure 8.
Increasing temperature drawdown from 1%/year to 2%/year leads to the biggest increase of LCOH (24–18% for the flow rates from 10 to 50 l/s, respectively). The other significant factor leading to increase of LCOH by 16–20% is a 30% increase of the nominal discount rate. Additional parameters worth noting are a 10 °C increase of injection temperature, 10 km-distance from the field to the campus and a 30% increase of drilling costs contributing 13–21%, 17–18% and 13–18% to the increase of LCOH, respectively. Less important parameters are OPEX, construction time (or the year of operation start) and brine salinity.
The most important parameter leading to decrease of LCOH is the research well subsidy of 50 or 80%, which allows to achieve 13–18% or 21–29% of LCOH reduction, respectively. Decreasing the distance from 5 km to 0.5 km has also a large effect (15–18%) on LCOH decrease. The remaining considered parameters are of less importance and contribute not more than 10% to LCOH decrease each.
It can be noted that, in general, factors influencing LCOH have less effect on higher flow rate scenarios which can be explained by larger amount of produced heat by EGS, thus smoothing the fluctuations. The exceptions are “Distance” and “OPEX” parameters showing the opposite trend since they are both proportionally and strongly related to the amount of produced heat.
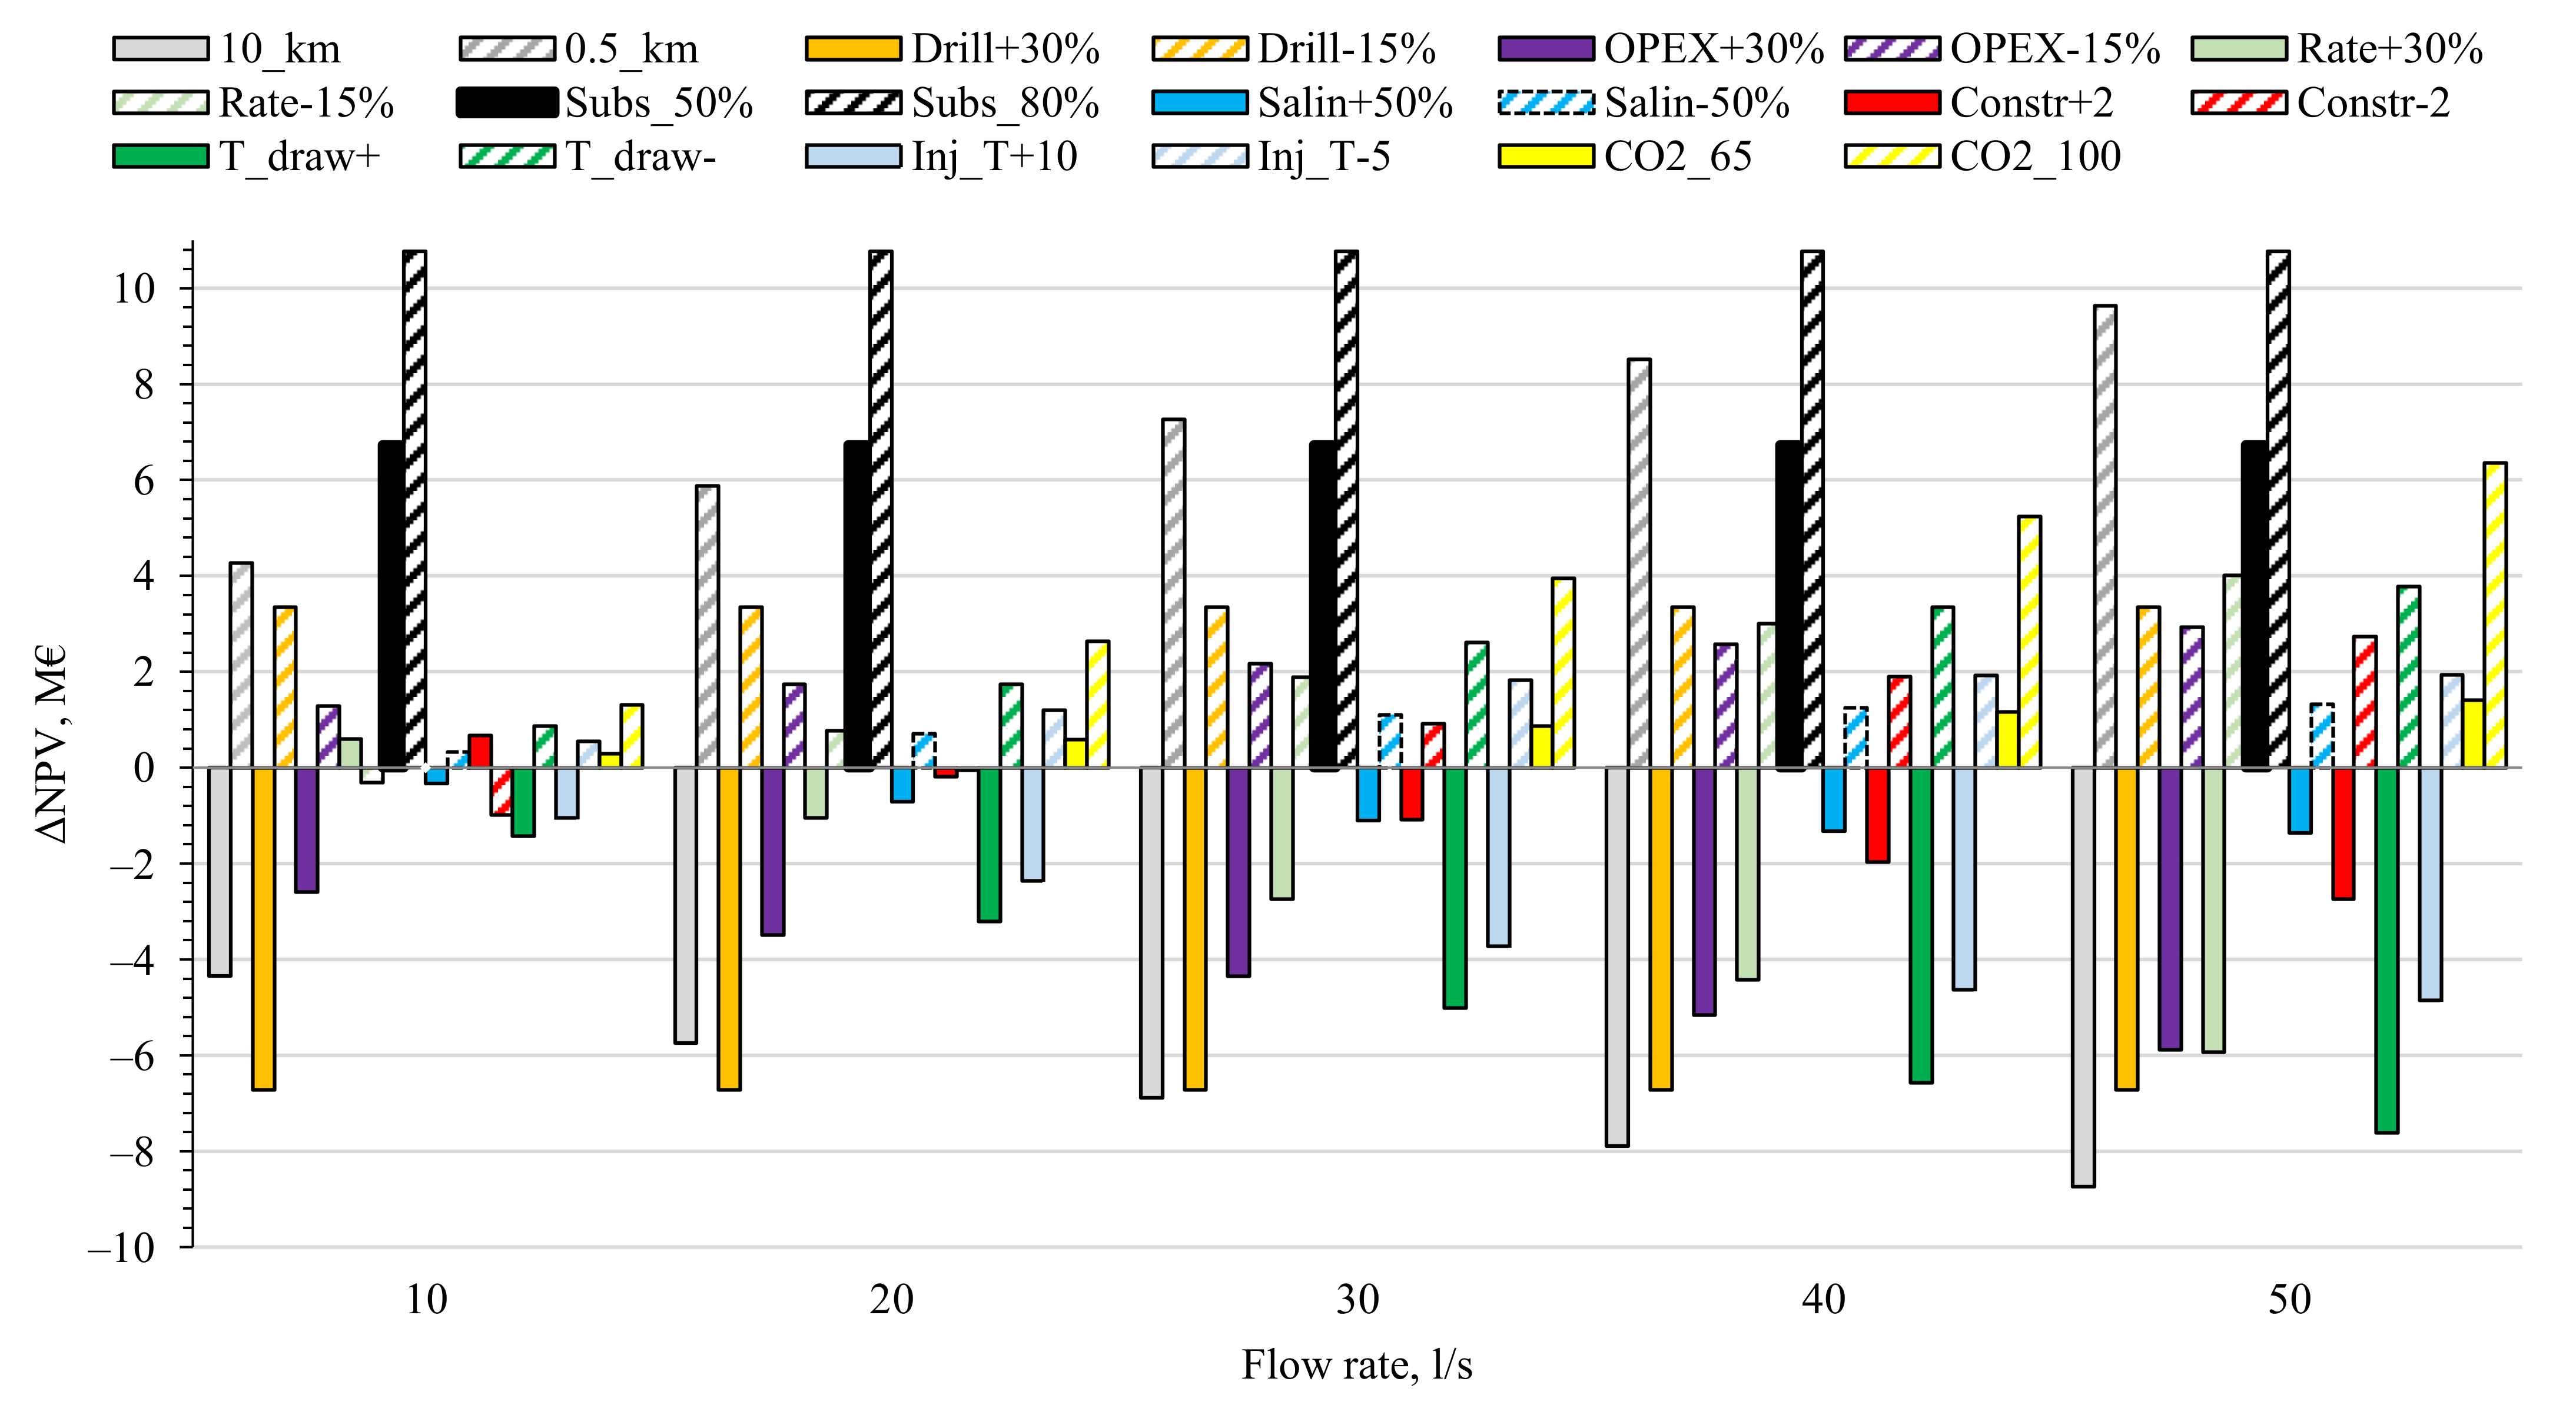
The temperature-averaged results of NPV sensitivity analysis for the parameters from Table 1 (unfavorable and favorable deviations) are presented in Figure 9.
Parameters “Distance” and “Drilling cost” are very influential on unfavorable deviations of NPV. If the distance from the field to the campus is increased from 5 to 10 km, NPV decreases by 4.3–8.7 M€ for the scenarios with flow rates from 10 to 50 l/s. Increasing drilling cost by 30% leads to NPV decrease by 6.7 M€. Temperature drawdown is also a parameter worth noting, especially for high flow rates, since it can worsen NPV value by up to 7.6 M€. Other parameters—OPEX, nominal discount rate and injection temperature—have some impact on NPV, and the remaining parameters have a relatively minor one.
As for favorable deviation of the parameters, 50 and 80% subsidy will lead to NPV increase by 6.7 and 10.8 M€, respectively. The possibility to build the geothermal plant just 0.5 km from the campus will result in 4.3–9.6 M€ increase of NPV for the scenarios with flow rates from 10 to 50 l/s. Reducing drilling cost by 15% can improve NPV by 3.4 M€. A potential increase of CO2 tax up to 100 €/t can lead to 1.3–6.4 M€ increase of NPV. While the influence of temperature drawdown, nominal discount rate and OPEX becomes significant under high flow rates, the other remaining parameters have much less effect.
As seen in Figure 9, the influence of most of the parameters intensifies for higher flow rates. And for low flow rates, e.g., 10 l/s, some parameters barely lead to any change in NPV. Parameters “Construction time” and “Nominal discount rate” show shifting behavior when the flow rate increases. For small flow rates, they lead to NPV increase, while NPV decreases for large flow rates. It can be explained by the fact that longer construction time leads to a shift in the schedule for investments (Table 3) which is “beneficial” for low flow rate scenarios because of later discounting of those CAPEX. It simply means that the scenarios are not profitable anyway, but the losses are a bit reduced because the investments were made later. For high flow rates, the situation is the opposite since longer construction time delays obtaining relatively high revenues from the plant operation. Being discounted in later years, those revenues obtain less value and influence on the overall result leading to decrease of NPV with regard to the reference case. Moreover, a similar behavior is true for the nominal discount rate.

5. Discussion

Although the results were acquired for the Göttingen demo site, the considered parameters for the calculations and analysis were quite typical. This is why the results can be also applied to an early-stage development analysis of other EGS projects in poorly known geological settings for district heating and cooling. However, it should be noted that electricity prices in Germany are among the highest in Europe [72], and the district heating prices are above the average level [78]. Therefore, the results will be economically better for the countries with lower electricity prices and higher heat prices.
Interconnection and interdependence between different parameters were not considered during the sensitivity analysis. For example, large extraction of heat from the geothermal reservoir (high brine flow rate and low injection temperature) might lead to a bigger and faster temperature drawdown, and consequently, to a much smaller operation lifetime of the project, which puts forward a question of sustainable energy generation from EGS. Additionally, brine salinity and injection temperature are also correlated parameters since injection temperature might be limited by scaling and corrosion issues in the case of a high-salinity brine. Thus, some parameters from the sensitivity analysis can depend on each other and/or aggregate, leading to more complex effects on the final result.
The development of the EGS system in the Variscan basement in Göttingen is associated with many uncertainties and risks. Although the risks are not explicitly considered in this study, they are addressed in a follow-up work [79]. One of the biggest uncertainties and risks for any EGS is induced seismicity risk since it affects public acceptance of EGS projects [80] and can completely freeze any further works and lead to the cancellation of a project [81]. Cost-benefit analysis was applied to quantify the trade-off between seismicity risks and proximity to district heating and heat consumers in Ref. [82]. The authors concluded that remote EGS is less favorable even if the seismicity risk is considerably decreased or close to zero. The results of the sensitivity analysis of this work have also demonstrated that proximity of the geothermal plant to the campus significantly improves the economic indicators of the project. Nevertheless, it might be quite challenging to drill the wells, conduct hydraulic stimulation tests and build the plant close to the campus without public acceptance. That is why public acceptance is one of the prerequisites of future successful realization of the EGS project in Göttingen.
One of the obstacles of the project is to correlate and synchronize the university’s plans of the campus reconstruction and the development of the EGS plant, which was partially addressed in this study by proposing the Gantt diagram of the EGS development. Nevertheless, effective communication and cooperation between different stakeholders within the university and outside of it is also one of the key prerequisites to launch the project.
The performed analysis has demonstrated that the reference case might not currently be competitive with the existing fossil fuel alternatives. Moreover, such long-term projects are usually not very attractive for private investors. Therefore, the government’s support is another necessary prerequisite for the project.
Even if the economic part of the project might happen to be not very promising after the research drilling and hydraulic stimulation tests are carried out, the importance of its ecological effect is undoubtful. Economic and political measures for CO2 emission reduction are likely to become stricter in the future which will pave the way for initially commercially unfeasible projects to be supported and implemented. The hypothetic value of the heat tariff depicted in Figure 6 and the values in Figure 9 show that CO2 tax can be a powerful tool of the government to impact the profitability of EGS projects. On the other hand, other renewable options, which also benefit from high CO2 tax and can yield better results than EGS due to more mature technological level and undercut the heat tariff, were not considered in this work.
The next important and essential step of the project development is to get research well funding. An additional opportunity of EGS projects in sites with poorly known geological settings, which can be provided by a deep research well, is investigation of shallow and medium layers and their further exploitation, e.g., for underground seasonal thermal energy storages. Such an integrated approach helps not only to increase the overall contribution of geothermal energy, i.e., renewable energy, but also to maximize the public subsidies for a research well, since the research focus is on both deep and medium deep target zones. In Germany, this is crucial when applying for public subsidies because financial support for drilling is preferentially given to the drilling sections defined as not yet investigated target rock units.

6. Conclusions

The geological setting in Göttingen—Variscan fold-and-thrust belt—is relatively poorly investigated for Enhanced Geothermal Systems exploitation. Nevertheless, there are expectations that geothermal energy will be able to partially meet the heat and cold demands of the Göttingen University campus (a demo site of the MEET project). This is why various scenarios of potential development of EGS for the campus were considered and analyzed in order to deal with different geological, technical and economic uncertainties of the project. On average, the considered single EGS doublet might cover about 20% of the expected heat demand and 6% of the cooling demand of the campus after its reconstruction. For different wellhead temperatures (90–140 °C) and flow rates (10–50 l/s) of brine, the obtained values of LCOH, NPV and CO2 abatement cost vary from 80 to 525 €/MWhth, from −27.1 to 6.6 M€ and from −12 to 655 €/t, respectively.
The most influential parameters on LCOH and NPV, which were identified during the sensitivity analysis, are subsidies for research wells, distance from the field to the campus, temperature drawdown and drilling costs. These parameters should be primarily dealt with when considering EGS development. CO2 tax, operational expenditures, injection temperature and nominal discount rate can be also quite influential, especially under high brine flow rates. Other analyzed parameters, namely construction time and brine salinity, have significantly less effect on the economic indicators.
For the considered initial conditions in the reference case, it can be concluded that EGS heat output should be at least 11.0 MWth (corresponds to brine flow rate and wellhead temperature of 40 l/s and 140 °C, respectively) in order to have a more or less economically justified EGS project. If the distance between the field and the campus is 0.5 km, minimum EGS heat output can be 7.2 MWth (30 l/s and 125 °C). In case of 50 and 80% subsidy, the minimum heat output is 8.1 MWth (30 l/s and 135 °C) and 7.2 MWth, respectively. The abovementioned parameters of brine can serve as a benchmark for geologists, engineers, managers, investors and other involved stakeholders to evaluate the success rate of the project, especially with regard to subsurface investigation, reservoir modeling and hydraulic stimulation.
The support of the government, public acceptance and effective cooperation between all stakeholders are the key prerequisites for launching the EGS project in Göttingen, which might save 1600–18,100 t CO2 annually (3–34% of the emissions from the fossil fuel-based heat supply system of the remaining existing buildings, new buildings and absorption chillers).

Author Contributions

Conceptualization, D.R. and B.L.; methodology, D.R.; investigation, D.R.; writing—original draft preparation, D.R.; writing—review and editing, D.R. and B.L.; supervision, B.L.; funding acquisition, B.L. All authors have read and agreed to the published version of the manuscript.

Funding

This work has received funding from the European Union’s Horizon 2020 research and innovation program (grant agreement № 792037—MEET Project).

Acknowledgments

The authors are grateful to Bianca Wagner for having contributed to the funding strategy for this study as well as for her discussions. Inga Moeck’s helpful comments and remarks on the manuscript are appreciated. We thank Real Estate and Facilities Management (Gebäudemanagement) departments of UGOE and UMG for providing data and discussions.

Conflicts of Interest

The authors declare no conflict of interest.

References

  1. BMWi. Renewable Energy Sources in Figures. National and International Development 2019; BMWi: Berlin, Germany, 2020; p. 88. [Google Scholar]
  2. Bayer, P.; Attard, G.; Blum, P.; Menberg, K. The geothermal potential of cities. Renew. Sustain. Energy Rev. 2019, 106, 17–30. [Google Scholar] [CrossRef]
  3. Lu, S.M. A global review of enhanced geothermal system (EGS). Renew. Sustain. Energy Rev. 2018, 81, 2902–2921. [Google Scholar] [CrossRef]
  4. Anderson, A.; Rezaie, B. Geothermal technology: Trends and potential role in a sustainable future. Appl. Energy 2019, 248, 18–34. [Google Scholar] [CrossRef]
  5. Shortall, R.; Davidsdottir, B.; Axelsson, G. Geothermal energy for sustainable development: A review of sustainability impacts and assessment frameworks. Renew. Sustain. Energy Rev. 2015, 44, 391–406. [Google Scholar] [CrossRef]
  6. Olasolo, P.; Juárez, M.C.; Morales, M.P.; Damico, S.; Liarte, I.A. Enhanced geothermal systems (EGS): A review. Renew. Sustain. Energy Rev. 2016, 50, 133–144. [Google Scholar] [CrossRef]
  7. Jain, C.; Vogt, C.; Clauser, C. Maximum potential for geothermal power in Germany based on engineered geothermal systems. Geotherm. Energy 2015, 3:15, 1–20. [Google Scholar] [CrossRef] [Green Version]
  8. Chamorro, C.R.; García-Cuesta, J.L.; Mondéjar, M.E.; Pérez-Madrazo, A. Enhanced geothermal systems in Europe: An estimation and comparison of the technical and sustainable potentials. Energy 2014, 65, 250–263. [Google Scholar] [CrossRef]
  9. Garapati, N.; Alonge, O.B.; Hall, L.; Irr, V.J.; Zhang, Y.; Smith, J.D.; Jeanne, P.; Doughty, C. Feasibility of development of geothermal deep direct-use district heating and cooling system at west Virginia university campus-Morgantown, WV. In Proceedings of the 44th Workshop on Geothermal Reservoir Engineering Stanford University, Stanford, CA, USA, 11–13 February 2019; p. 12. [Google Scholar]
  10. Gustafson, J.O.; Smith, J.D.; Beyers, S.M.; Aswad, J.A.; Jordan, T.E.; Tester, J.W.; Ming Khan, T. Risk reduction in geothermal deep direct-use development for district heating: A cornell university case study. In Proceedings of the 44th Workshop on Geothermal Reservoir Engineering Stanford University, Stanford, CA, USA, 11–13 February 2019; p. 23. [Google Scholar]
  11. Dalmais, E.; Genter, A.; Trullenque, G.; Leoutre, E.; Leiss, B.; Wagner, B.; Mintsa, A.C.; Bär, K.; Rajsl, I. MEET Project: Toward the spreading of EGS across Europe. In Proceedings of the European Geothermal Congress, Den Haag, The Netherlands, 11–14 June 2019; p. 8. [Google Scholar]
  12. Menberg, K.; Pfister, S.; Blum, P.; Bayer, P. A matter of meters: State of the art in the life cycle assessment of enhanced geothermal systems. Energy Environ. Sci. 2016, 9, 2720–2743. [Google Scholar] [CrossRef]
  13. Chavot, P.; Heimlich, C.; Masseran, A.; Serrano, Y.; Zoungrana, J.; Bodin, C. Social shaping of deep geothermal projects in Alsace: Politics, stakeholder attitudes and local democracy. Geotherm. Energy 2018, 6, 1–21. [Google Scholar] [CrossRef]
  14. Ragnarsson, Á; Óladóttir, A.A.; Hauksdóttir, S.; Maury, J.; Maurel, C.; Manzella, A.; Ámannsson, H.; Drouin, V.; Haraldsdóttir, S.H.; Guðgeirsdóttir, G.; et al. Report on Environmental Concerns. Overall State of the Art on Deep Geothermal Environmental Data; Geoenvi. 2021. Available online: https://www.geoenvi.eu/publications/report-on-environmental-concerns-overall-state-of-the-art-on-deep-geothermal-environmental-data/ (accessed on 7 June 2021).
  15. Genter, A.; Evans, K.; Cuenot, N.; Fritsch, D.; Sanjuan, B. Contribution of the exploration of deep crystalline fractured reservoir of Soultz to the knowledge of enhanced geothermal systems (EGS). Comptes Rendus. Geosci. 2010, 342, 502–516. [Google Scholar] [CrossRef]
  16. Pratiwi, A.; Ravier, G.; Genter, A. Life-cycle climate-change impact assessment of enhanced geothermal system plants in the Upper Rhine Valley. Geothermics 2018, 75, 26–39. [Google Scholar] [CrossRef]
  17. Breede, K.; Dzebisashvili, K.; Liu, X.; Falcone, G. A systematic review of enhanced (or engineered) geothermal systems: Past, present and future. Geotherm. Energy 2013, 1, 4. [Google Scholar] [CrossRef] [Green Version]
  18. Mouchot, J.; Ravier, G.; Seibel, O.; Pratiwi, A. Deep geothermal plants operation in upper Rhine graben: Lessons learned. In Proceedings of the European Geothermal Congress 2019, Den Haag, The Netherlands, 11–14 June 2019; pp. 1–8. [Google Scholar]
  19. Meng, N.; Li, T.; Jia, Y.; Qin, H.; Liu, Q.; Zhao, W.; Lei, G. Techno-economic performance comparison of enhanced geothermal system with typical cycle configurations for combined heating and power. Energy Convers. Manag. 2020, 205, 112409. [Google Scholar] [CrossRef]
  20. Moya, D.; Aldás, C.; Kaparaju, P. Geothermal energy: Power plant technology and direct heat applications. Renew. Sustain. Energy Rev. 2018, 94, 889–901. [Google Scholar] [CrossRef]
  21. Wei, G.; Meng, J.; Du, X.; Yang, Y. Performance analysis on a hot dry rock geothermal resource power generation system based on Kalina cycle. Energy Procedia 2015, 75, 937–945. [Google Scholar] [CrossRef] [Green Version]
  22. Raos, S.; Ilak, P.; Rajšl, I.; Bilić, T.; Trullenque, G. Multiple-criteria decision-making for assessing the enhanced geothermal systems. Energies 2019, 12, 1597. [Google Scholar] [CrossRef] [Green Version]
  23. Sanyal, S.K.; Morrow, J.W.; Butler, S.J.; Robertson-Tait, A. Is EGS commercially feasible? In Proceedings of the Annual Meeting of the Geothermal Resources Council 2007: Renewable Baseload Energy: Geothermal Heat Pumps to Engineered Reservoirs, Reno, NV, USA, 30 September–3 October 2007; p. 10. [Google Scholar]
  24. Sanyal, S.K.; Morrow, J.W.; Butler, S.J.; Robertson-Tait, A. Cost of electricity from enhanced geothermal systems. In Proceedings of the 32nd Workshop on Geothermal Reservoir Engineering, Stanford, CA, USA, 22–24 January 2007; p. 11. [Google Scholar]
  25. Van Erdeweghe, S.; Van Bael, J.; Laenen, B.; D’haeseleer, W. Feasibility study of a low-temperature geothermal power plant for multiple economic scenarios. Energy 2018, 155, 1004–1012. [Google Scholar] [CrossRef]
  26. Heidinger, P. Integral modeling and financial impact of the geothermal situation and power plant at Soultz-sous-Forêts. Comptes Rendus Geosci. 2010, 342, 626–635. [Google Scholar] [CrossRef]
  27. Cardemil, J.M.; Cortés, F.; Díaz, A.; Escobar, R. Thermodynamic evaluation of solar-geothermal hybrid power plants in northern Chile. Energy Convers. Manag. 2016, 123, 348–361. [Google Scholar] [CrossRef]
  28. Sener, A.C.; Van Dorp, J.R.; Keith, J.D. Perspectives on the economics of geothermal power. In Proceedings of the Transactions—Geothermal Resources Council, Reno, NV, USA, 4–7 October 2009; p. 8. [Google Scholar]
  29. Olasolo, P.; Juárez, M.C.; Olasolo, J.; Morales, M.P.; Valdani, D. Economic analysis of Enhanced Geothermal Systems (EGS). A review of software packages for estimating and simulating costs. Appl. Therm. Eng. 2016, 104, 647–658. [Google Scholar] [CrossRef]
  30. Renewable Power Generation Costs in 2019; International Renewable Energy Agency: Abu Dhabi, United Arab Emirates, 2020; 144p, Available online: https://www.irena.org/-/media/Files/IRENA/Agency/Publication/2020/Jun/IRENA_Power_Generation_Costs_2019.pdf (accessed on 7 June 2021).
  31. Kost, C.; Shammugam, S.; Jülch, V.; Nguyen, H.-T.; Schlegl, T. Stromgestehungskosten Erneuerbare Energien; Fraunhofer-Institut für Solare Energiesysteme ISE: Freiburg, Germany, 2018; 44p. [Google Scholar]
  32. Lazard. Lazard’s levelized cost of energy analysis—Version 13.0; Lazard: Hamilton, Bermuda, 2019; 20p. [Google Scholar]
  33. Levelized Cost and Levelized Avoided Cost of New Generation Resources in the Annual Energy Outlook 2020; U.S. Energy Information Administration: Washington, DC, USA, 2020; 22p.
  34. Aghahosseini, A.; Breyer, C. From hot rock to useful energy: A global estimate of enhanced geothermal systems potential. Appl. Energy 2020, 279, 115769. [Google Scholar] [CrossRef]
  35. Beckers, K.F.; Lukawski, M.Z.; Anderson, B.J.; Moore, M.C.; Tester, J.W. Levelized costs of electricity and direct-use heat from Enhanced Geothermal Systems. J. Renew. Sustain. Energy 2014, 6, 013141. [Google Scholar] [CrossRef]
  36. Willems, C.J.L.; Nick, H.M. Towards optimisation of geothermal heat recovery: An example from the West Netherlands Basin. Appl. Energy 2019, 247, 582–593. [Google Scholar] [CrossRef]
  37. Pathak, V.; Babadagli, T.; Majorowicz, J.A.; Unsworth, M.J. Evaluation of engineered geothermal systems as a heat source for oil sands production in Northern Alberta. Nat. Resour. Res. 2014, 23, 247–265. [Google Scholar] [CrossRef]
  38. Galantino, C.R.; Beyers, S.; Lindsay Anderson, C.; Tester, J.W. Optimizing Cornell’s future geothermal district heating performance through systems engineering and simulation. Energy Build. 2021, 230, 110529. [Google Scholar] [CrossRef]
  39. Gładysz, P.; Sowiżdżał, A.; Miecznik, M.; Pająk, L. Carbon dioxide-enhanced geothermal systems for heat and electricity production Energy and economic analyses for central Poland. Energy Convers. Manag. 2020, 220, 113142. [Google Scholar] [CrossRef]
  40. IEA. Germany 2020—Energy Policy Review; International Energy Agency: Paris, France, 2020; 229p. [Google Scholar]
  41. Rubczyński, A.; Rączka, J.; Macuk, R. Good heating practices from Denmark and Germany. Conclusions for Poland; Forum Energii: Warsaw, Poland, 2018; 84p. [Google Scholar]
  42. Trullenque, G.; Genter, A.; Leiss, B.; Wagner, B.; Bouchet, R.; Léoutre, E.; Malnar, B.; Bär, K.; Rajšl, I. Upscaling of EGS in Different Geological Conditions: A European Perspective. In Proceedings of the 43rd Workshop on Geothermal Reservoir Engineering Stanford University, Stanford, CA, USA, 12–14 February 2018; pp. 1–10. [Google Scholar]
  43. Leiss, B.; Wagner, B. EU-Projekt MEET: Neue Ansätze “Enhanced Geothermal Systems (EGS)”—Göttinger Unicampus als Demoprojekt. Geotherm. Energie 2019, 91, 26–28. [Google Scholar] [CrossRef]
  44. Leiss, B.; Vollbrecht, A.; Tanner, D.; Wemmer, K. Tiefengeothermisches Potential in der Region Göttingen—geologische Rahmenbedingungen. In Neue Untersuchungen zur Geologie der Leinetalgrabenstruktur—Bausteine zur Erkundung des geothermischen Nutzungspotentials in der Region Göttingen; Leiss, B., Tanner, D., Vollbrecht, A., Arp, G., Eds.; Universitätsverlag Göttingen: Göttingen, Germany, 2011; pp. 163–170. [Google Scholar]
  45. Wang, G.; Song, X.; Shi, Y.; Yang, R.; Yulong, F.; Zheng, R.; Li, J. Heat extraction analysis of a novel multilateral-well coaxial closed-loop geothermal system. Renew. Energy 2021, 163, 974–986. [Google Scholar] [CrossRef]
  46. Lea, E. A Step Towards A Lower Carbon Future: Integrating Closed Loop Geothermal Technology in District Cooling Applications; University of Calgary: Calgary, AB, Canada, 2020; 79p. [Google Scholar]
  47. Leiss, B.; Romanov, D.; Wagner, B. Risks and Challenges of the Transition to an Integrated Geothermal Concept for the Göttingen University Campus. In Proceedings of the 1st Geoscience & Engineering in Energy Transition Conference, Virtual Conference, 16–18 November 2020; pp. 1–4. Available online: https://www.earthdoc.org/content/papers/10.3997/2214-4609.202021044 (accessed on 7 June 2021).
  48. Lund, H.; Werner, S.; Wiltshire, R.; Svendsen, S.; Thorsen, J.E.; Hvelplund, F.; Mathiesen, B.V. Generation district heating (4GDH). integrating smart thermal grids into future sustainable energy systems. Energy 2014, 68, 1–11. [Google Scholar] [CrossRef]
  49. Kaarup Olsen, P.; Holm Christiansen, C.; Hofmeister, M.; Svend Svendsen, J.-E.T. Guidelines for Low-Temperature District Heating. EUDP 2010-II Full-Scale Demonstr. Low-Temp. Dist. Heat. Exist. Build. 2014, 68, 1–43. [Google Scholar]
  50. Leiss, B.; Wagner, B.; Heinrichs, T.; Romanov, D.; Tanner, D.; Vollbrecht, A.; Wemmer, K. Integrating deep, medium and shallow geothermal energy into district heating and cooling system as an energy transition approach for the Göttingen University Campus. In Proceedings of the World Geothermal Congress 2021, Reykjavik, Iceland, 24–27 October 2021; pp. 1–9. [Google Scholar]
  51. Agemar, T.; Suchi, E.; Moeck, I. Die Rolle der Tiefen Geothermie bei der Wärmewende—Wie Deutschland 60% Erneuerbare Wärme bis 2050 Schaffen Könnte; LIAG: Hannover, Germany, 2018; 14p. [Google Scholar]
  52. Lukosevicius, V. Thermal Energy Prodcution from Low Temperature Geothermal Brine—Technological Aspects and Energy Efficiency; United Nations University: Tokyo, Japan, 1993; p. 42. [Google Scholar]
  53. Bauer, M.; Freeden, W.; Jacobi, H.; Neu, T. Handbuch Tiefe Geothermie. Prospektion, Exploration, Realisierung, Nutzung; Springer: Berlin/Heidelberg, Germany, 2014; 867p. [Google Scholar]
  54. CO2-Bepreisung. Available online: https://www.bundesregierung.de/breg-de/themen/klimaschutz/co2-bepreisung-1673008 (accessed on 12 December 2020).
  55. Carbon Taxes in Europe. Available online: https://taxfoundation.org/carbon-taxes-in-europe-2020/ (accessed on 16 April 2021).
  56. International Energy Agency District Heating. IEA-ETSAP Techonology Brief E16. ETSAP Energy Technol. Syst. Anal. Program. 2013, 7. Available online: https://iea-etsap.org/E-TechDS/PDF/E16_DistrHeat_EA_Final_Jan2013_GSOK.pdf (accessed on 7 June 2021).
  57. Pan, S.Y.; Gao, M.; Shah, K.J.; Zheng, J.; Pei, S.L.; Chiang, P.C. Establishment of enhanced geothermal energy utilization plans: Barriers and strategies. Renew. Energy 2019, 132, 19–32. [Google Scholar] [CrossRef]
  58. Stefánsson, V. Investment cost for geothermal power plants. Geothermics 2002, 31, 263–272. [Google Scholar] [CrossRef]
  59. GEORISK: Providing financial de-risking schemes for geothermal. Available online: https://www.georisk-project.eu/wp-content/uploads/2020/08/D6.4-GEORISK_Brochure_smaller.pdf (accessed on 11 December 2020).
  60. Deutscher Wetterdienst. Available online: https://www.dwd.de/EN/Home/home_node.html (accessed on 11 December 2020).
  61. Bertani, R. Deep geothermal energy for heating and cooling. In Renewable Heating and Cooling: Technologies and Applications; Woodhead Publishing: Sawston, UK, 2016; pp. 67–88. ISBN 9781782422181. [Google Scholar]
  62. Beckers, K.F.; McCabe, K. GEOPHIRES v2.0: Updated geothermal techno-economic simulation tool. Geotherm. Energy 2019, 7. [Google Scholar] [CrossRef]
  63. Eyerer, S.S.; Hofbauer, S.C.; Wieland, C.; Zosseder, K.; Bauer, W.; Baumann, T.; Heberle, F.; Hackl, C.; Irl, M.; Spliethoff, H. Potential der Hydrothermalen Geothermie zur Stromerzeugung in Deutschland; Geothermie-Allianz Bayern: Munich, Germany, 2017; 53p, Available online: https://www.mse.tum.de/fileadmin/w00bvc/www/gab/Potential_der_hydrothermalen_Geothermie_zur_Stromerzeugung_in_Deutschland.pdf (accessed on 7 June 2021).
  64. Weinand, J.M.; McKenna, R.; Kleinebrahm, M.; Mainzer, K. Assessing the contribution of simultaneous heat and power generation from geothermal plants in off-grid municipalities. Appl. Energy 2019, 255, 113824. [Google Scholar] [CrossRef]
  65. Yost, K.; Valentin, A.; Einstein, H.H. Estimating cost and time of wellbore drilling for Engineered Geothermal Systems (EGS)—Considering uncertainties. Geothermics 2015, 53, 85–99. [Google Scholar] [CrossRef]
  66. Vivian, J.; Emmi, G.; Zarrella, A.; Jobard, X.; Pietruschka, D.; De Carli, M. Evaluating the cost of heat for end users in ultra low temperature district heating networks with booster heat pumps. Energy 2018, 153, 788–800. [Google Scholar] [CrossRef]
  67. Danish Energy Agency. Technology Data for Generation of Electricity and District Heating; DEA: Copenhagen, Denmark, 2020; 414p. [Google Scholar]
  68. Schlagermann, P. Exergoökonomische Analyse geothermischer Strombereitstellung am Beispiel des Oberrheingrabens; Dr. Hut: München, Germany, 2014. [Google Scholar]
  69. Mines, G. GETEM User Manual; INL: Idaho Falls, ID, USA, 2016; 194p. [Google Scholar]
  70. Federal reserve bank of, St. Luis Producer Price Index by Commodity: Machinery and Equipment: Pumps, Compressors, and Equipment. Available online: https://fred.stlouisfed.org/series/WPU1141 (accessed on 11 December 2020).
  71. Majorowicz, J.; Grasby, S.E. Deep geothermal energy in Canadian sedimentary basins vs. fossils based energy we try to replace—Exergy [KJ/KG] compared. Renew. Energy 2019, 141, 259–277. [Google Scholar] [CrossRef]
  72. The Statistical Office of the European Union. Available online: https://ec.europa.eu/eurostat (accessed on 12 December 2020).
  73. IEA. Projected Costs of Generating Electricity 2015; IAE: Paris, France, 2015. [Google Scholar]
  74. Short, W.; Packey, D.; Holt, T. A Manual for the Economic Evaluation of Energy Efficiency and Renewable Energy Technologies; NREL: Golden, CO, USA, 1995; 121p. [Google Scholar]
  75. Buck, M.; Redl, C.; Hein, F.; Jones, D. The European Power Sector in 2019; Agora Energiewende and Sandbag: Berlin, Germany, 2020; 48p. [Google Scholar]
  76. Juhrich, K. CO2 Emission Factors for Fossil Fuels; Umweltbundesamt: Dessau-Roßlau, Germany, 2016; 48p. [Google Scholar]
  77. Eyerer, S.; Schifflechner, C.; Hofbauer, S.; Bauer, W.; Wieland, C.; Spliethoff, H. Combined heat and power from hydrothermal geothermal resources in Germany: An assessment of the potential. Renew. Sustain. Energy Rev. 2020, 120, 109661. [Google Scholar] [CrossRef]
  78. Werner, S. European District Heating Price Series; Energiforsk: Stockholm, Sweden, 2016; 58p. [Google Scholar]
  79. Romanov, D.; Leiss, B. Summary of Göttingen Site Optimization for Integration of Geothermal Resources in the Energy Supply; MEET Report, Deliverable D6.12; Universitätsenergie Göttingen: Göttingen, Germany, 2021; 22p. [Google Scholar]
  80. Kunze, C.; Hertel, M. Contested deep geothermal energy in Germany—The emergence of an environmental protest movement. Energy Res. Soc. Sci. 2017, 27, 174–180. [Google Scholar] [CrossRef]
  81. Deichmann, N.; Giardini, D. Earthquakes induced by the stimulation of an enhanced geothermal system below Basel (Switzerland). Seismol. Res. Lett. 2009, 80, 784–798. [Google Scholar] [CrossRef]
  82. Knoblauch, T.A.K.; Trutnevyte, E. Siting enhanced geothermal systems (EGS): Heat benefits versus induced seismicity risks from an investor and societal perspective. Energy 2018, 164, 1311–1325. [Google Scholar] [CrossRef]
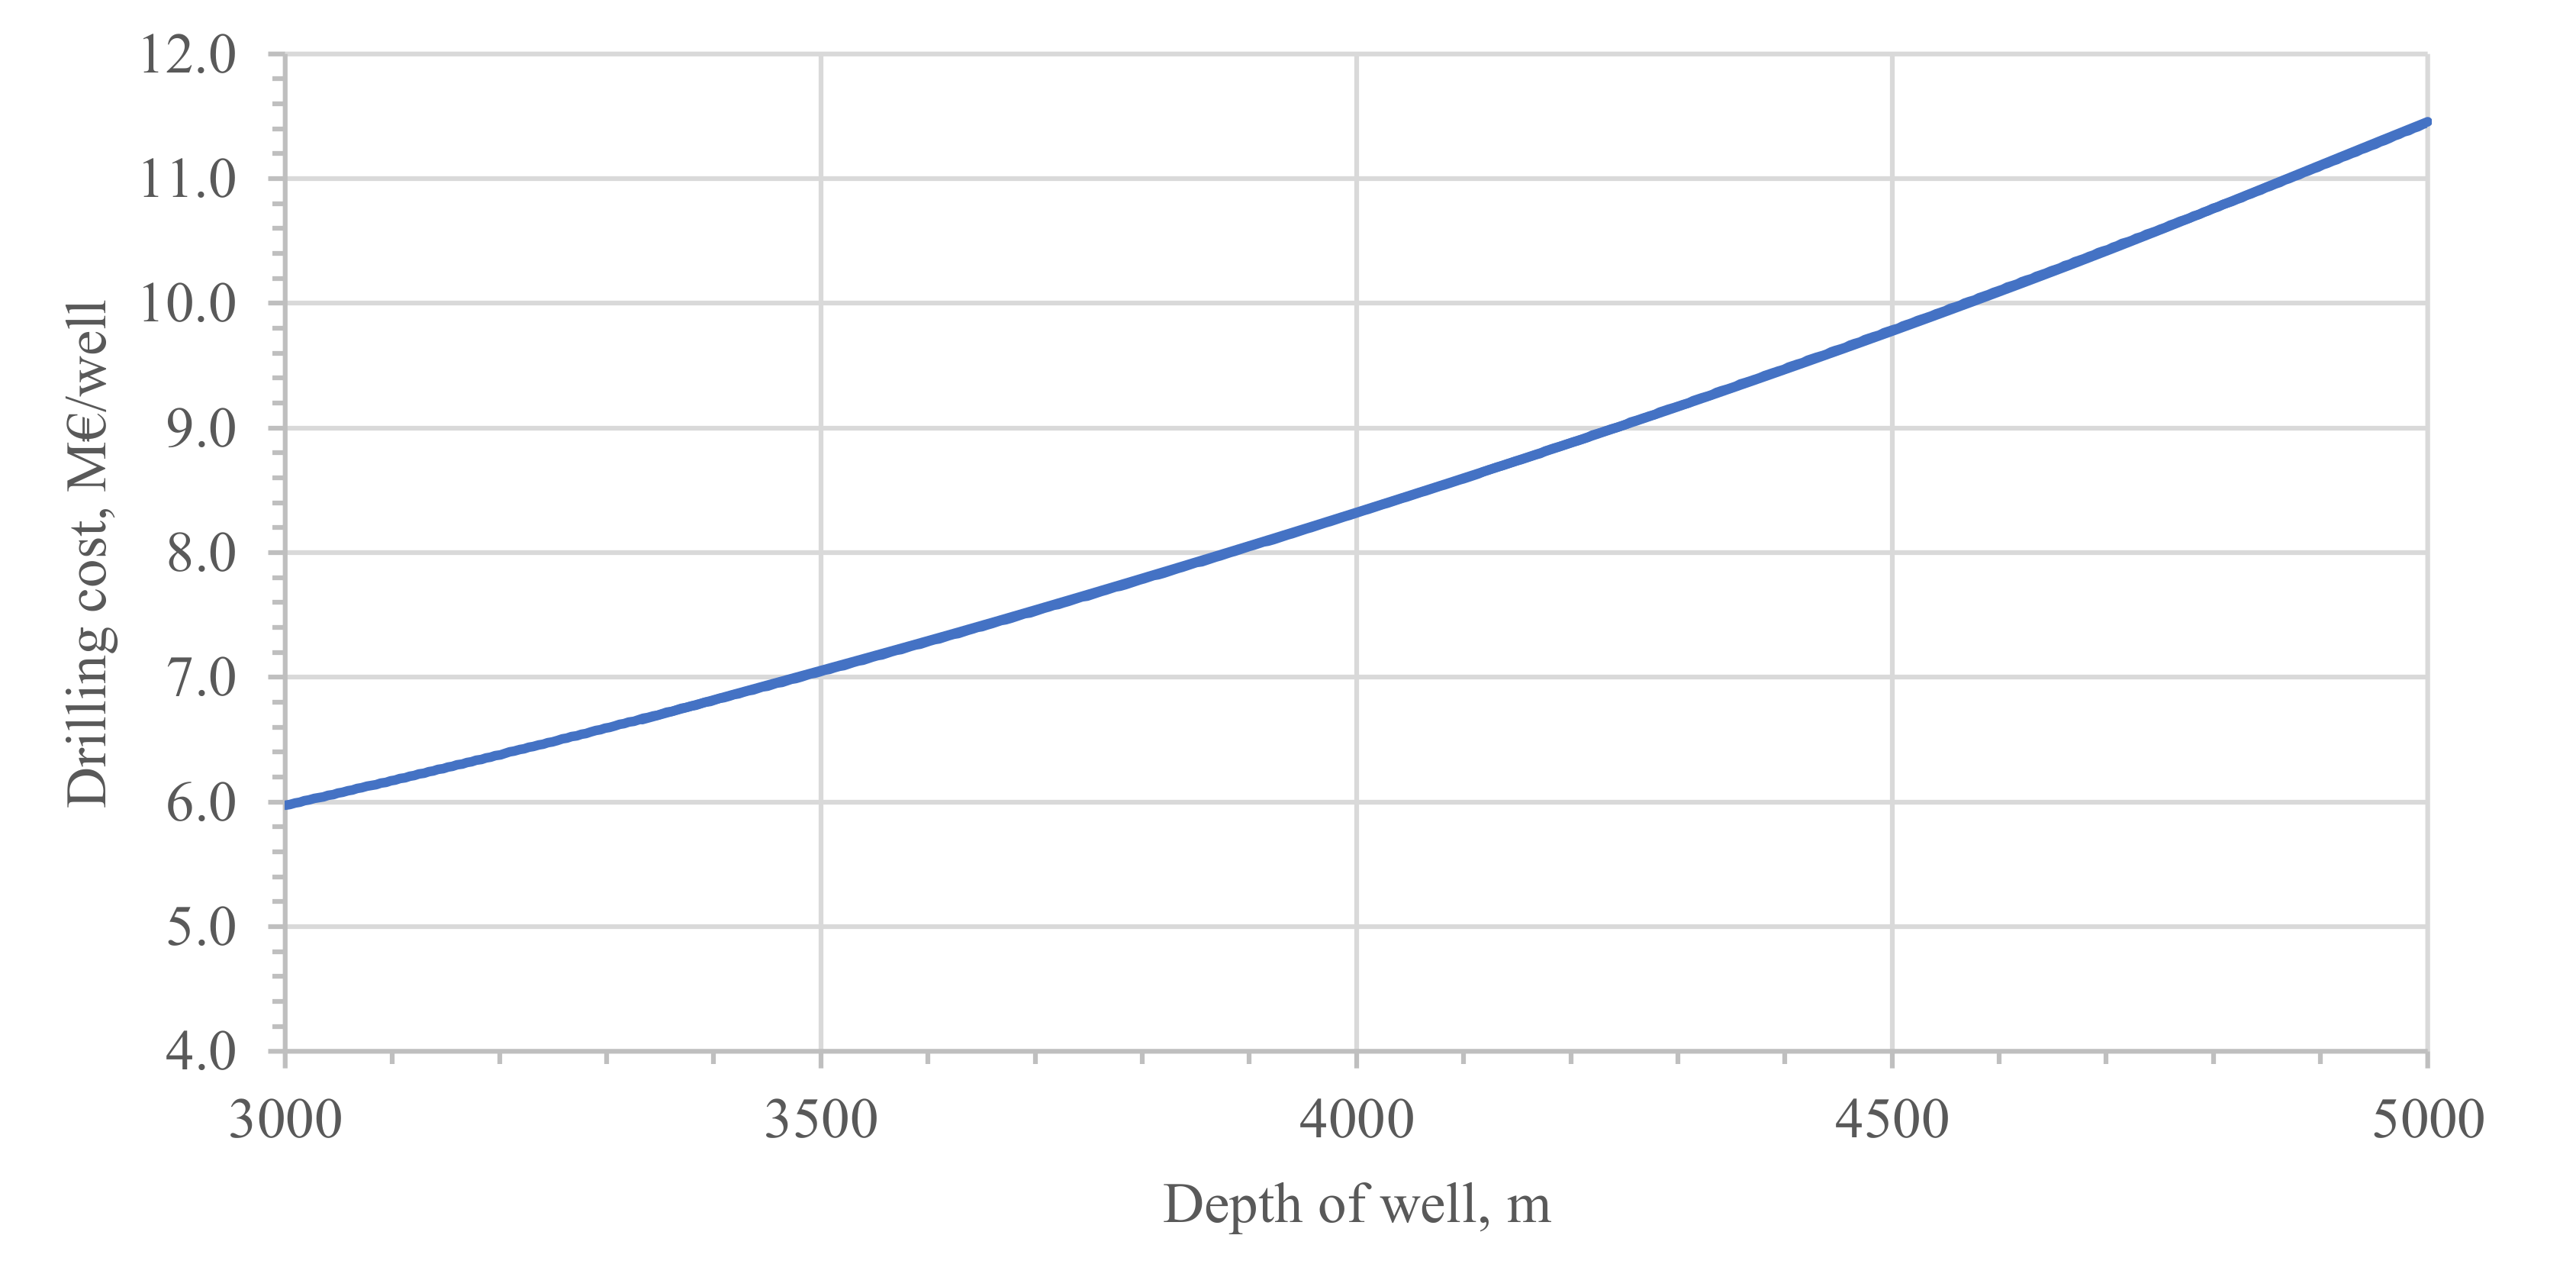
Figure 1. Cost of drilling assumed for the calculations.
Geosciences 11 00349 g001
Figure 2. Expected heat load duration curve after reconstruction of the campus (including to-be-built buildings, remaining existing buildings, and heat for absorption cooling) in comparison with the estimated maximum geothermal output. Note: absorption cooling is assumed to be constant throughout the year, except for summer peak.
Geosciences 11 00349 g002
Figure 3. Lifetime-average EGS heat generation (columns) and design EGS heat output (symbols) for the reference case.
Geosciences 11 00349 g003
Figure 4. Components of CAPEX for different wellhead temperatures and different distances to the campus under the reference case conditions (columns) and specific CAPEX for different flow rates under the reference case conditions (symbols). Note: the value of specific CAPEX for 10 l/s under 90 °C is 26.1 k€/kWth.
Geosciences 11 00349 g004
Figure 5. Average structure of operational costs and average annualized capital costs for the reference case.
Geosciences 11 00349 g005
Figure 6. LCOH (columns), prognosed heat tariff for the campus (dashed line), hypothetic heat tariff for the campus if CO2 tax is 100 €/t (dotted line), and NPV (symbols) for the reference case. Note: the values of LCOH for 90 °C, 100 °C and 110 °C under 10 l/s are 525, 406 and 342 €/MWhth, respectively.
Geosciences 11 00349 g006
Figure 7. CO2 abatement cost (columns) and lifetime-average CO2 operational savings (symbols) for the reference case. Note: the values of CO2 abatement cost for 90, 100 and 110 °C under 10 l/s are 655, 445 and 355 €/t, respectively.
Geosciences 11 00349 g007
Figure 8. LCOH sensitivity analysis for the parameters from Table 1.
Geosciences 11 00349 g008
Figure 9. NPV sensitivity analysis for the parameters from Table 1.
Geosciences 11 00349 g009
Table 1. Parameters for the reference case and two cases with parameters for sensitivity analysis.
Case L [km] C d r i l l [%] O P E X [%] d n [%] S g o v [%] C c a r b [€/t] β
[%]
τ [years] T d r a w [%/years] T i n j [°C]
Unfavorable deviation101301309.1______158270
Reference case51001007.0055106160
Favorable deviation0.585856.0508065100540.555
L —distance to the campus; C d r i l l —cost of drilling; O P E X —operational expenditures; d n —nominal discount rate; S g o v —subsidy for research (production) well; C c a r b —CO2 tax; β —brine salinity; τ —construction time; T d r a w —temperature drawdown; T i n j —injection temperature.
Table 2. Heat losses and specific electricity consumption for different distances to the campus [56].
L [km] q h l [%] e s p e c [kWel/MWth]
0.555
5107.5
101510
L —distance to the campus; q h l —heat losses in the pipelines; e s p e c —specific electricity consumption for pumping.
Table 3. Gantt chart for potential development of EGS for Göttingen demo site. Squares with green color—favorable deviation; squares with yellow color—reference case; squares with red color—unfavorable deviation; darker shades—moments for investments.
ActivityYear
012345678
Feasibility study
Permitting and public survey
Research well financing
(~45%)
Research well drilling
Research work
Stimulation tests
Injection well financing
(~37%)
Injection well drilling
Transformation of the well: research → production
Stimulation tests
Surface infrastructure
financing (~18%)
Surface infrastructure
construction
Start-up and commissioning
Start of operation
Table 4. Lifetime-average potential heat supply from EGS as a share of heat demand of different consumers and CO2 emissions of a future fossil-fuel based heating and cooling system.
ApplicationType of Heat ConsumerExpected Heat Demand (100%) [GWhth/a]CO2 Emissions from Fossil-Fuel System [t/a]Potential Heat Supply from EGS
Minimum [%]Average [%]Maximum [%]
HeatingNew buildings110.827,9916.830.860.6
Remaining buildings78.819,9200.05.015.3
Buildings total189.647,9104.020.141.8
CoolingAbsorption chillers19.950290.06.134.0
Heating & CoolingTotal209.552,9393.618.841.1
Publisher’s Note: MDPI stays neutral with regard to jurisdictional claims in published maps and institutional affiliations.