Article

Sedimentation Patterns of Multiple Finnish Lakes Reveal the Main Environmental Stressors and the Role of Peat Extraction in Lake Sedimentation

1
Geological Survey of Finland, P.O. Box 97, 67101 Kokkola, Finland
2
Geological Survey of Finland, P.O. Box 1237, 70211 Kuopio, Finland
3
Geological Survey of Finland, P.O. Box 96, 02151 Espoo, Finland
*
Author to whom correspondence should be addressed.
Geosciences 2020, 10(8), 313; https://doi.org/10.3390/geosciences10080313
Submission received: 2 July 2020 / Revised: 6 August 2020 / Accepted: 10 August 2020 / Published: 13 August 2020

Abstract

:
Human land-use activities, especially in the peatlands, are under consideration as the mitigation and lowering of CO2 emissions from land-use practices is needed to address climate change. In Finland, approximately one third of the land surface is covered by peatlands, and around 50% of peatlands are ditched for forestry. Another 3% of peatlands are used for agriculture and approximately 1% for peat extraction. The effects of these different land-use practices, including changes in sediment depositional rates and sediment quality, need to be identified. This study analyzed 51 lakes that were subdivided into two groups: (1) a group of impacted lakes in which peat was recently extracted from the catchments and (2) a reference group consisting of lakes where peat had not been extracted from the basin, but in which other land-use activities had occurred. The overall aim of the study was to investigate if peat extraction caused excessive delivery and deposition of dry and organic matter in lakes that are located in their immediate downstream catchment areas. Differences in sediment accumulation were defined by comparing the overall sediment thickness and recent (post 1986) sedimentation levels to identify if there were differences in the sediment chemical composition or rate of organic matter deposition between groups and to identify possible land-use stressors that could explain the possible differences in sediment chemical assemblages or sedimentation rates. The results show moderate (cm scale) sedimentation rates in both impacted and reference lakes after 1986, while sediment chemical assemblages indicated the erosion and input of mineral soils to all of the studied lakes, rather than the input of organic materials. No statistically significant correlations were observed between selected environmental variables and the recent accumulation rates of carbon and dry matter. Moreover, significant changes in the stressors potentially affecting the chemical assemblages of pre- and post-disturbance sediments were not observed.

1. Introduction

Human land use directly affects more than 70% of the global ice-free land surface [1]. These activities also impact peatlands that are important in the climate change context due to their significance in the cycling and storage of carbon (e.g., [2,3]). Impacts of anthropogenic activities on the Earth’s surface worldwide had begun by 10,000 to 8000 years ago [4,5]. Recently, Jenny et al. [6] showed that a significant portion of the Earth’s surface shifted to human-driven soil erosion 4000 years ago, long before deforestation and land-use practices were affected by industrialization. Globally, drained peatlands that comprise less than 0.3% of the land area contribute almost 6% of global CO2 emissions [7]. In Finland, approximately one third of the land surface is covered by peatlands and around 50% of peatlands are ditched for forestry. About 3% of peatlands are used for agriculture, and approximately 1% for peat extraction [8].
In addition to CO2 emissions, the draining of peatlands can increase losses of carbon to downstream watercourses, if not managed properly (drainage and management practices based on best available knowledge and techniques, with effective flood and sediment control [9]). Increased losses of carbon may apply to Finland where peatlands are extensively modified for forestry and agricultural purposes or peat extraction. Peat extraction activities and the related drainage of the peatlands are known to result in an increase in water flow from the peat extraction sites during peak hydrograph conditions and the export of suspended solids and dissolved organic matter (e.g., [10]). This has caused concerns of the impacts of peat extraction on the receiving water bodies. In particular, it is often assumed that peat extraction leads to excessive increases in organic matter sedimentation in downstream lake basins, resulting in thick sedimentary deposits and significant changes in sediment quality.
Attempts have been made to separate the effects of peat extraction and peatland forest drainage on the lacustrine environment in Finland [10]. This has turned out to be a difficult task, because sediment loadings from these land-use practices are often similar. Kauppila et al. [11] compared two adjacent lakes, one with peat extraction impacts and one with only drainage from forestry and found insignificant differences between these lakes regarding the rate of deposition and sediment quality. However, their study only dealt with a single case, and more extensive research is needed to better understand the effects of peat extraction on sediment quality and sedimentation rates in lakes that receive drainage from areas of different land-use practices.
More robust and generalizable results of the effects of peat extraction on lacustrine sedimentation can be obtained by examining a larger number of study sites over a larger area in both basins with peat-extraction impacted watercourses and reference basins. Such a multi-basin approach not only increases the confidence in results but also provides valuable data on the properties of sediment types and the typical rate(s) of deposition in this type of environment. It also reduces the impacts of individual anomalous cases on the results and makes it possible to study the influence of catchment and lake properties on accumulation rates and sediment composition. Accordingly, we selected and investigated drainage basins from two types of lakes: lakes that receive part of their waters from areas of peat extraction (henceforth called impacted lakes) and lakes that have basins with peatlands in their catchment but not extractions activities, although they have been impacted by other land-use practices (henceforth called reference lakes). To further standardize the histories of land use in these lakes, the reference lakes were selected close to the impacted lakes, even though pairwise comparisons were not attempted. The same bipartition was applied by Daza-Secco et al. [12], who evaluated the applicability of testate amoebae communities as potential indicators of organic matter leaching from peat extraction areas to downstream lake sediments. Daza-Secco et al. [12] used a set of 36 lakes that are part of the studied sites examined herein.
The overall aim of the present study was to investigate if peat extraction is causing excessive delivery to and deposition of dry and organic matter in downstream lakes. The specific aims of this study were to: (i) investigate between-group differences in the rate of recent sedimentation, (ii) examine between-group differences in sediment chemical composition, and (iii) characterize the common lake and catchment properties that have an effect on sediment quality in these basins. In addition, the results provide general information on the properties of lacustrine sediments and sedimentation patterns in peatland-rich regions in western Finland, which are typically intensively impacted by human activities. The study provides a perspective on the impacts of peat extraction and other land-use practices of peatlands on lakes and informs the development of responsible peatland management programs that lead to the sustainable use of peatlands.

2. Materials and Methods
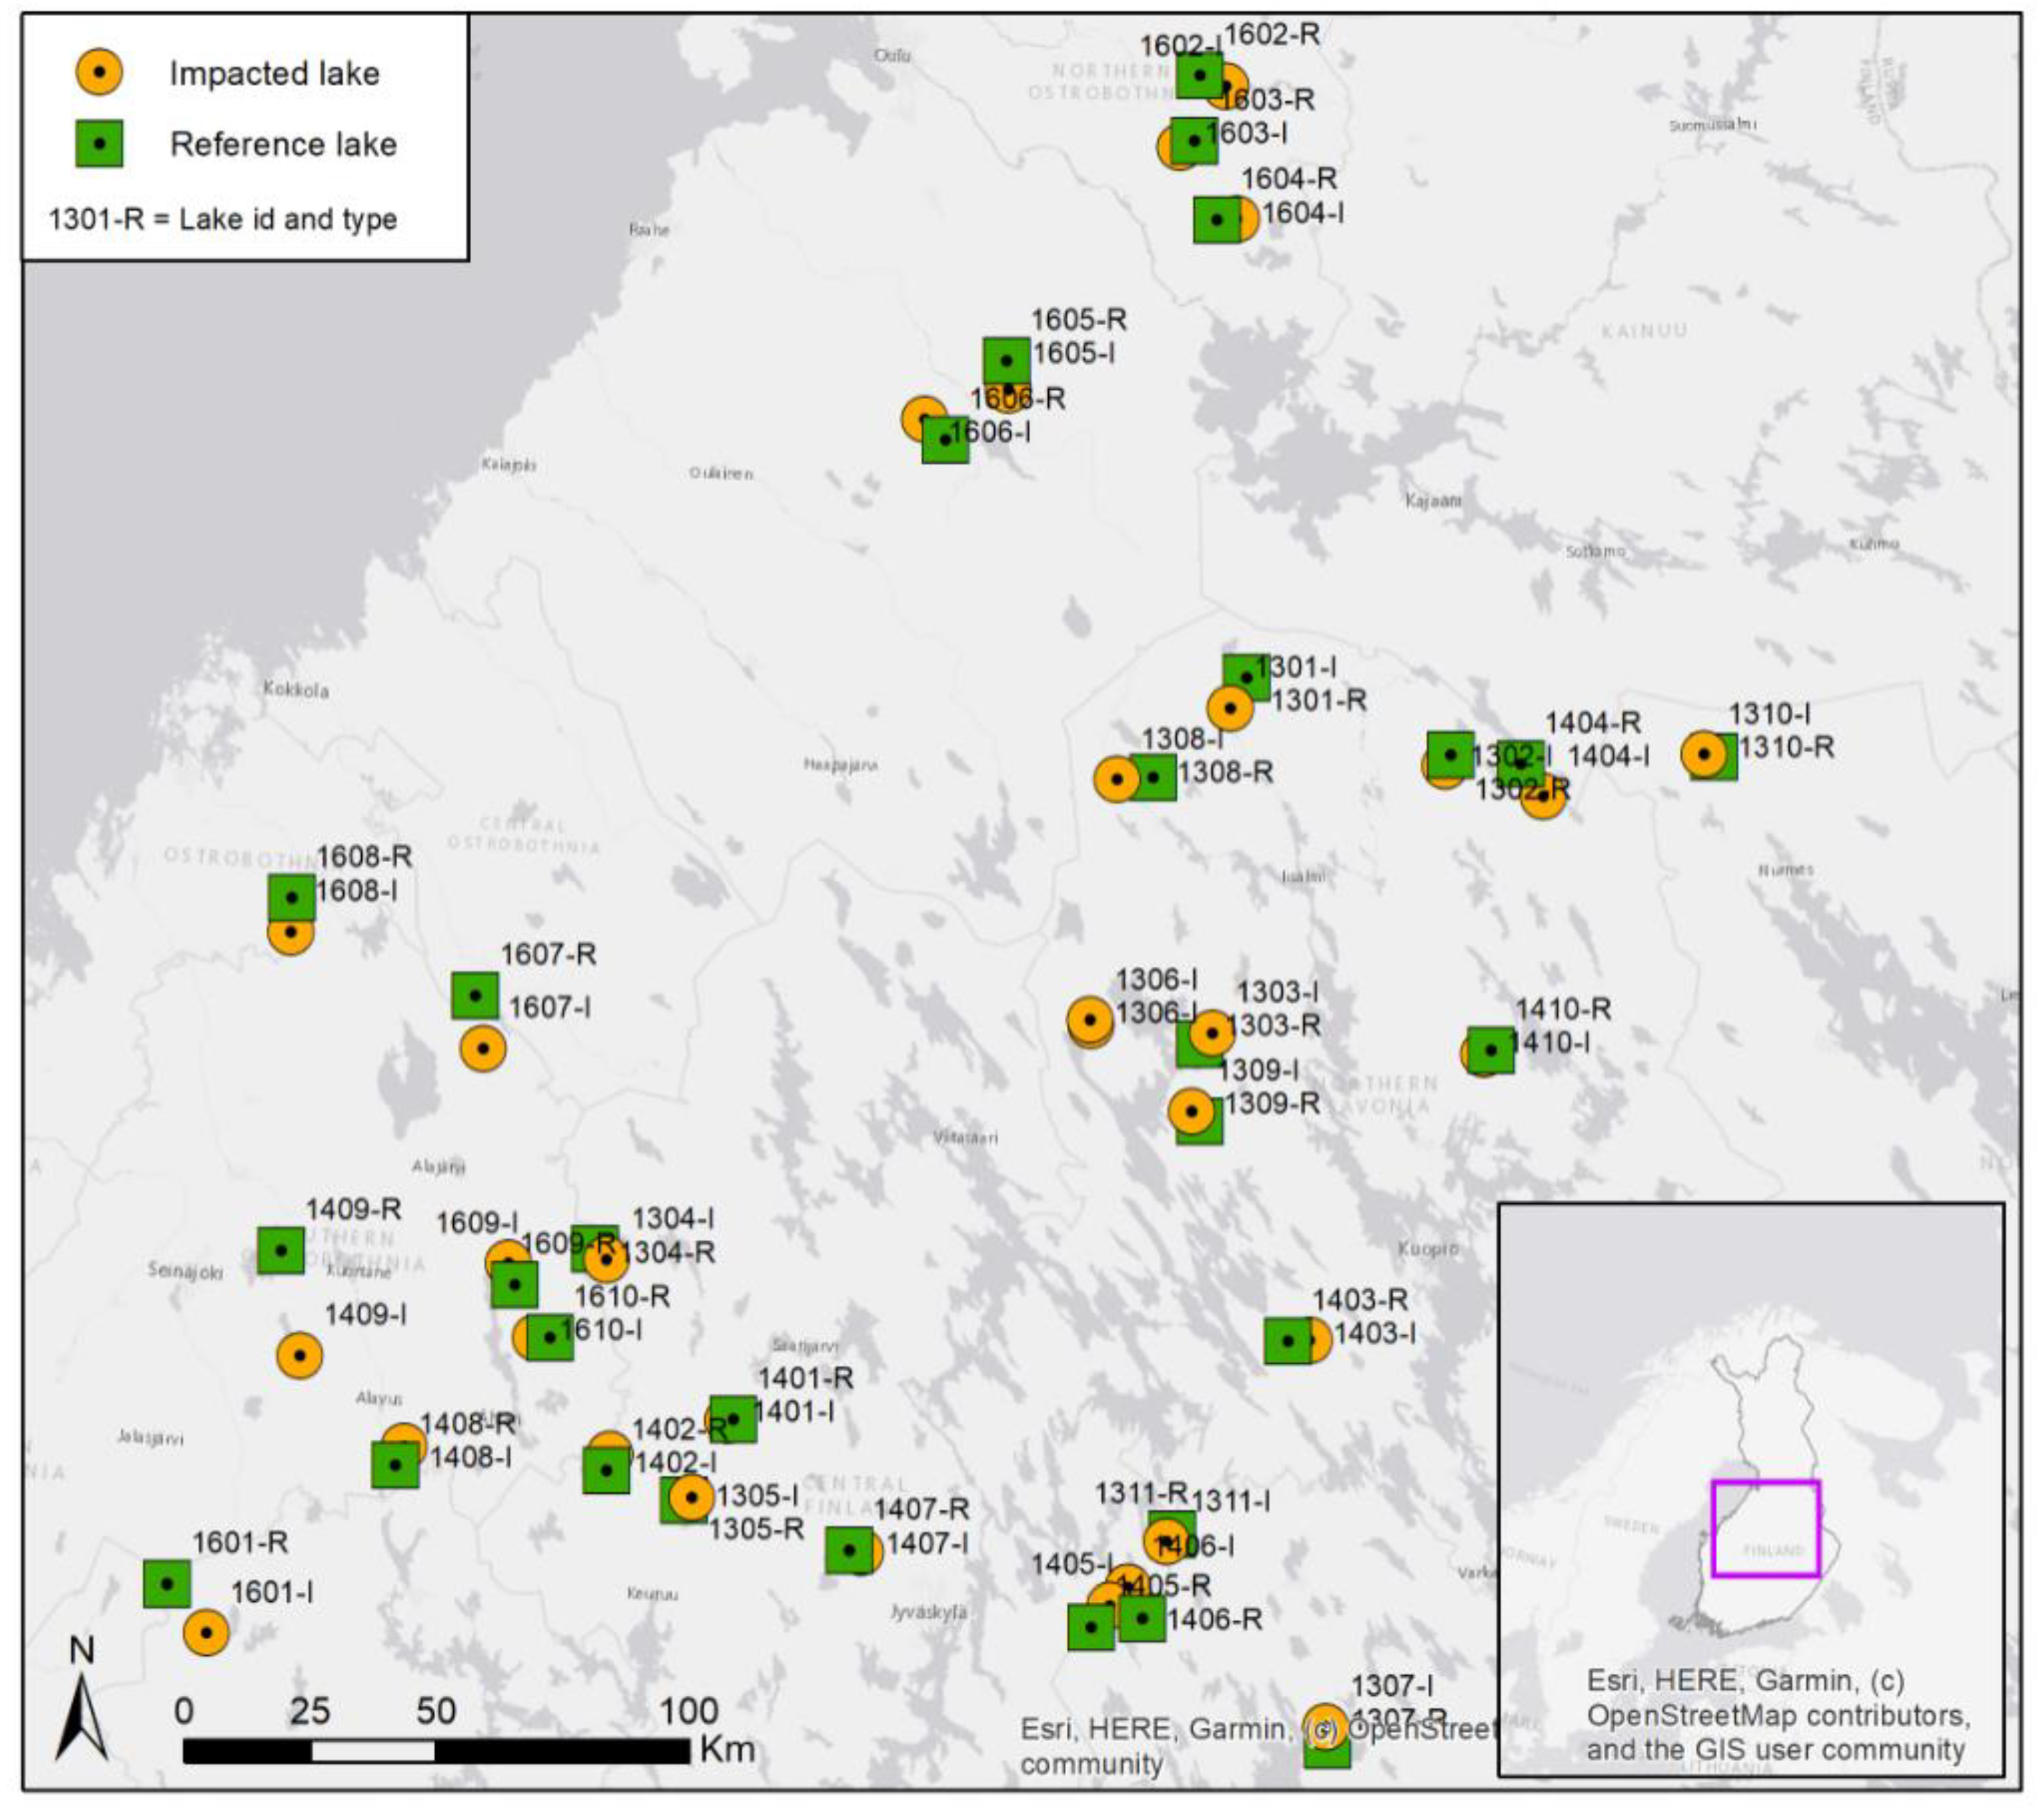
2.1. Lake Selection

A total of 62 lakes (32 impacted, 30 reference) were initially selected from central Finland (Figure 1). Medium- to small-sized lakes (5–40, <5 ha) were first randomly selected using a GIS-based approach and publicly available spatial data from National Land Survey (NLS) (base map data, including lakes and peat extraction areas [13]) and the Finnish Environment Institute (catchment boundary data [14]). The selected lakes was then narrowed down by verifying the existence/nonexistence of peat extraction areas near the sites, resulting in 32 potentially impacted lakes (Figure 1). The potential drainage pathway from the peat extraction site to the study lake was verified from the Environmental Impact Assessment documents of each peat extraction area [15]. These documents also stated that peat extraction in most studied lake basins started in the 1980s (1973–2005) and have been active since. Subsequently, reference lakes without peat extraction in their watersheds were selected adjacent to the potentially impacted lakes with the help of generalized catchment boundary data. Preference was given to lakes located in the same 3rd level catchment area or that were located nearby. This was done to ensure that the impacted and the reference lakes had comparable land-use histories and were characterized by similar climatic, geomorphological, and geological environments.

2.2. Lake and Catchment Properties (Environmental Variables)

Properties of the study lakes and their catchments were collected from publicly available sources to assemble an environmental variable dataset. The selection of variables was based on their potential to influence sediment properties through catchment disturbance (land-use variables), catchment-to-lake hydrological processes, or within-basin sedimentation patterns (lake and catchment size, lake bathymetry, abundance of upstream basins). The catchment area boundaries were determined for each lake using the Finnish Environment Institute’s VALUE-catchment delineation tool (Figure 2) [16]. Catchment delineation was then used to extract other catchment properties from spatial datasets, such as percentages of peatland area, ditched peatland area, peat extraction area, and Corine Land Cover (CLC) [17] data (see Table 1). The peat extraction area and area of the upstream lake basin, expressed as percentage of the catchment area, were collected from the National Land Survey (MML) data [13]. Lake surface area and depth information were obtained from the lake database of the Finnish Environmental Institute [18] and was combined with the exact water depth recorded at the coring site in the field. The peatland area and the ditched peatland area, mainly associated with ditched peatlands in forested areas, were extracted from the peatland boundary data of Geological Survey of Finland (GTK) [19]. Other land-use data were derived from the CLC 2018 data [17].
Lake size and bathymetry, which are essential variables controlling sedimentation [20], were reasonably similar in impacted and reference lakes (Table 1). The lakes were on average larger in the impacted group (131 vs. 73 ha) but shallower (2.4 m vs. 3.6 m average depth, 7.0 m vs. 8.6 m maximum depth). For a few lakes, depth data were missing or only the maximum depth was available.
The environmental settings of catchment areas for all of the lakes are presented in Table 1 (upper part). In order to define the exact environmental settings affecting the lakes, the calculated exact-upper catchment area was used for the observation of environmental settings instead of the 3rd level catchment area information used in the initial lake selection process. The impacted group of lakes (n = 29) have larger catchments in relation to lake area, and their catchments are characterized by higher amounts of ditched peatlands, peat extraction areas, and forests than the reference group lakes (n = 22). The median size of the catchment area of the impacted group lakes is 3548 ha, as opposed to 277 ha in the reference group lakes. The average peatland area in the impacted group was 33% of the catchment (variation 15–58%, median 33%), whereas in the reference group lakes the average was 19% (variation 0–64%, median 12%). On average, peat extraction area comprises 4% (0–17%, median 3%) of the impacted group and 0% in the reference group. The ditched peatland area is 86% (56–100, median 88%) in the impacted group and 62% (0–100, median 79%) in the reference group.
Based on the CLC classes, agricultural areas (including pastures, nonirrigated arable land and land principally occupied by agriculture) covered 4% of the catchment on average in the impacted group lakes (0–16%, median 1%) and 7% in the reference group lakes (0–66%, median 2%). The water body area averaged 5% of the basin in the impacted group (0–15%, median 4%) and 11% in the reference group (0–49%, median 7%).
To account for the effect of catchment size on the results, a smaller subset of lakes (henceforth called the trimmed subset) with comparable catchment sizes was selected by removing both impacted lakes with catchments larger than in the reference lakes and reference lakes with catchments smaller than those found for the impacted lakes. For this trimmed subset, the environmental characteristics of the catchments were more similar: water depth at the coring site was 4.7 m (1.0–11.5 m, median 3.0 m) for the impacted group and 5.9 m (1.5–6.2 m, median 3.4 m) for the reference group; proportion of ditched peatlands was 92% (79–100%, median 91%) for the impacted group and 87% (57–100%, median 92%) for the reference group. Agricultural areas encompassed 3% (0–16%, median 1%) for the impacted and 3% (0–11%, median 2%) for the reference group. However, for the trimmed subset, impacted lakes were statistically smaller, in contrast to entire lake dataset. The impacted group possessed an average lake area of 35 ha (8–79 ha, median 24 ha), whereas the reference group exhibited a lake area of 103 ha (7–170 ha, median 126 ha). The amount of peatlands and upper water body area remained similar in the trimmed subset when compared to the whole lake set. In the trimmed subset the average peatland proportion of catchments was 33% (16–56%, median 31%) for the impacted group and 20% (2–43%, median 17%) for the reference group. The amount of upstream water bodies was 5% (0–15%, median 3%) in the impacted group and 13% (0–30%, median 10%) for the reference group. The environmental settings for the smaller subset of lakes with comparable catchment sizes is presented in the lower part of Table 1.

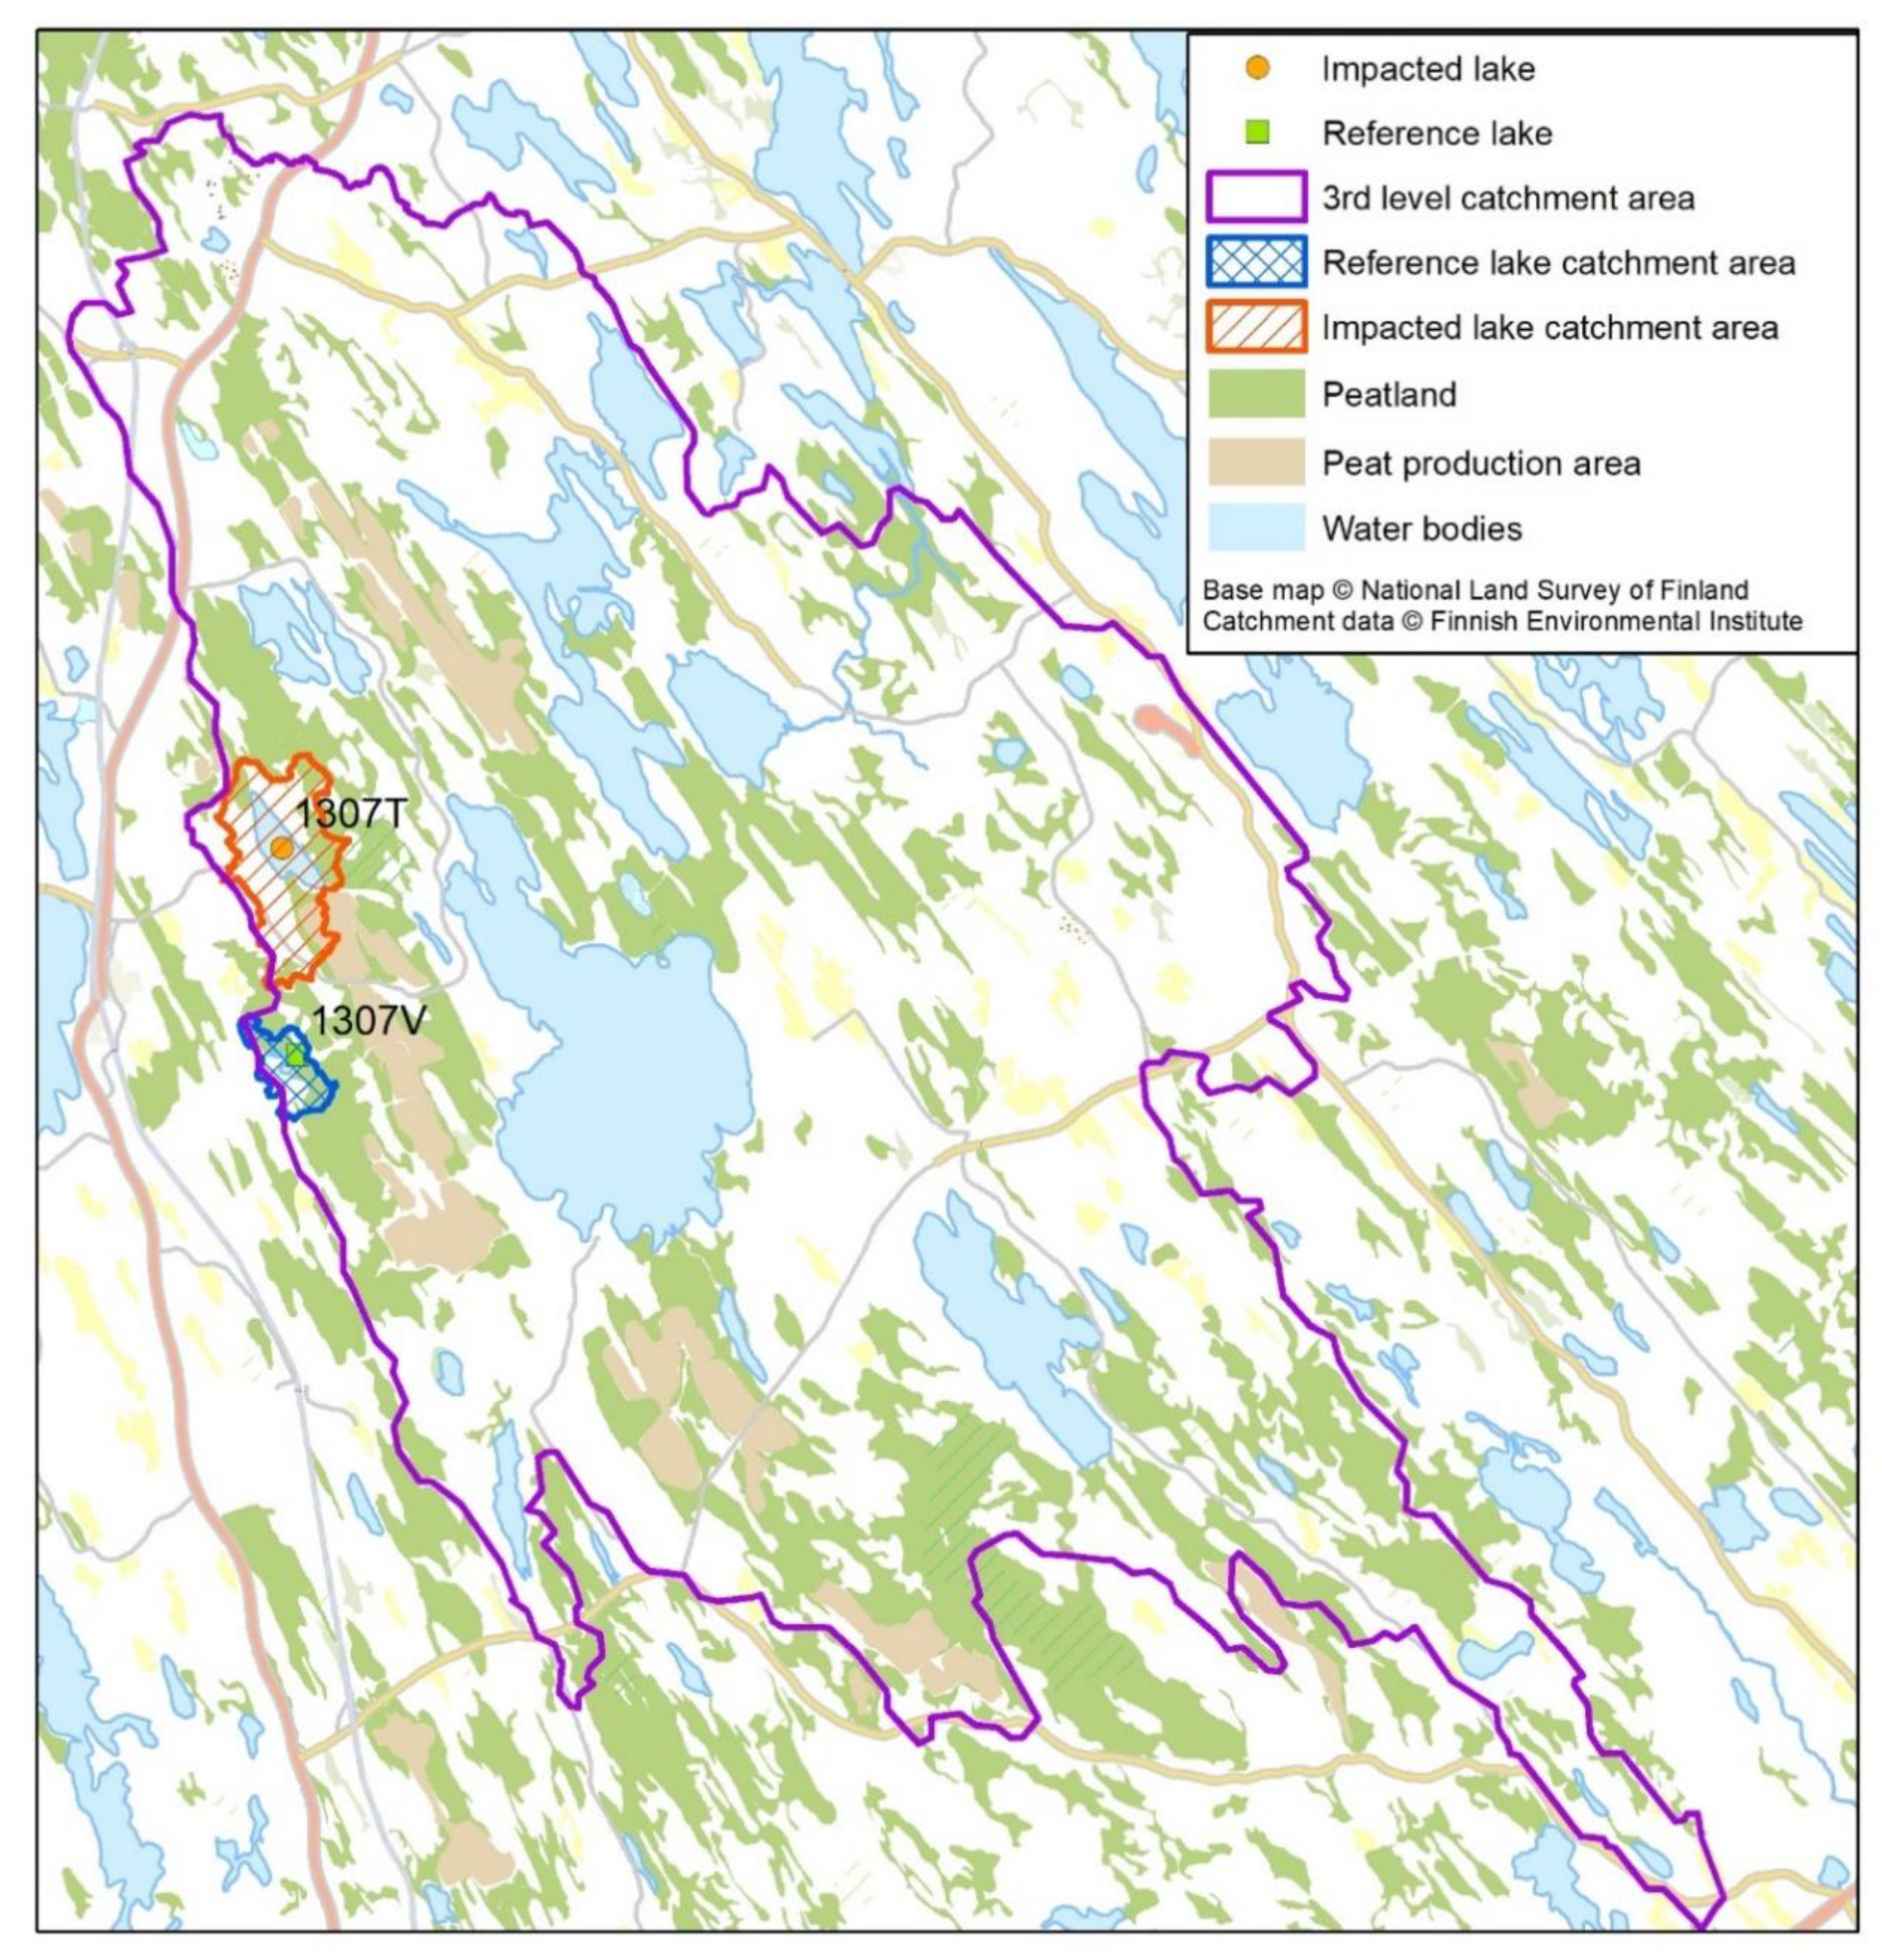
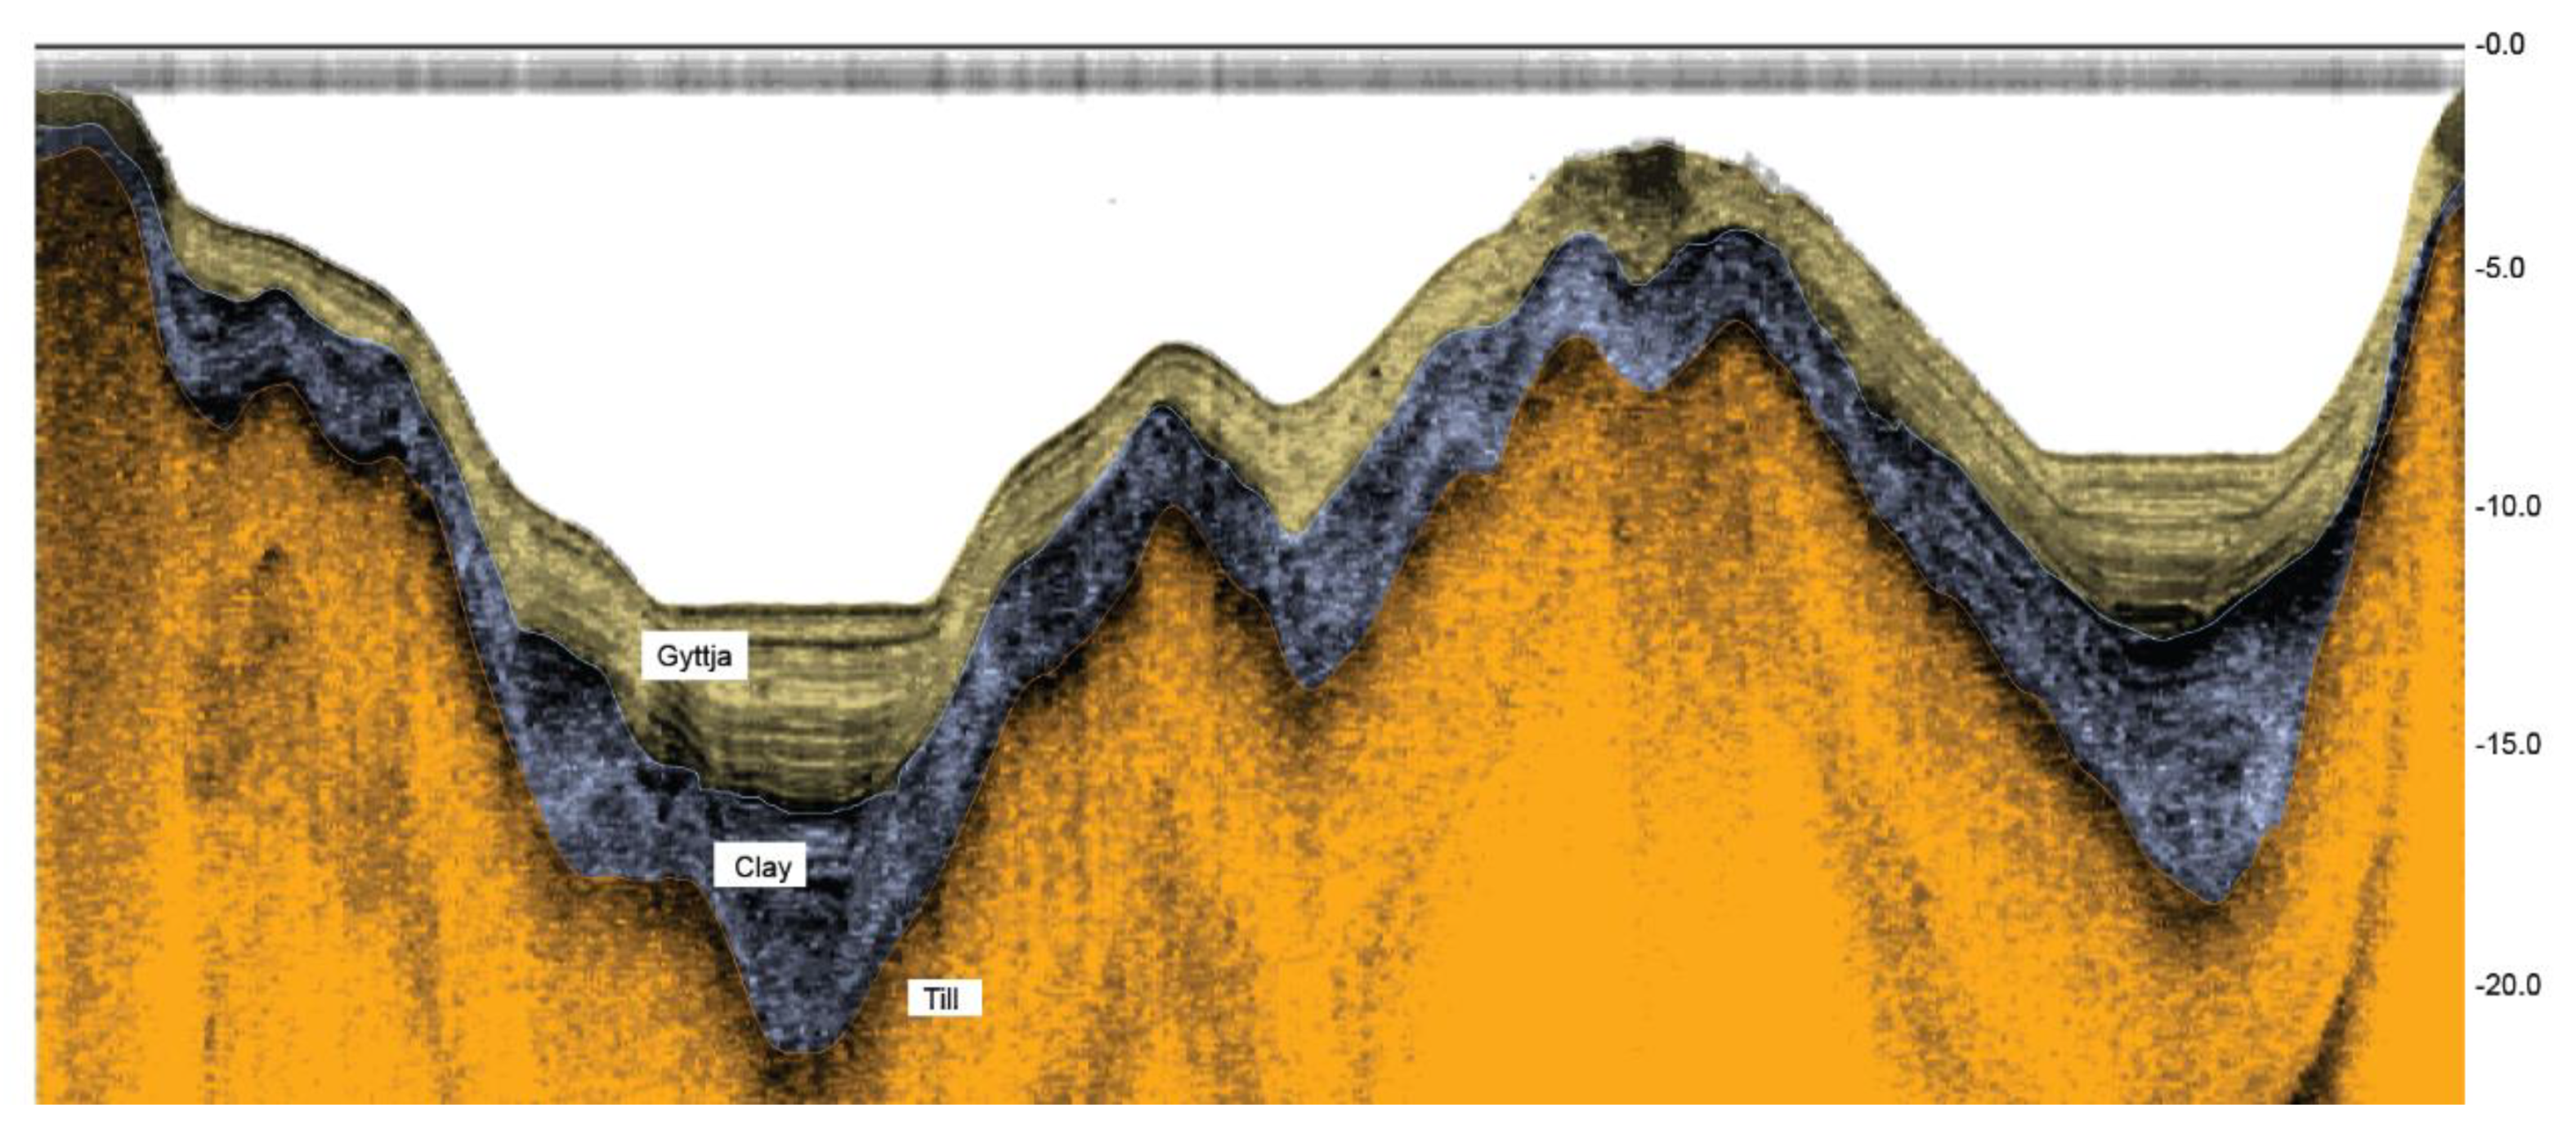
2.3. Echo Sounding Surveys and Sediment Coring

A majority of the studied lakes were surveyed with an acoustic method (24 kHz MD 500 echo sounder and MDSC data collection software © MeriData Finland Ltd., Lohja, Finland) to obtain information on the spatial distribution and thickness of postglacial sediments in the basins. With a few inaccessible exceptions, the survey lines covered the whole lake. The survey line resolution depended on the lake size, typically varying from 50 to 200 m. This system allowed the delineation of the water–sediment interface and the main sediment unit boundaries. The processing of acoustic sub-bottom profiles and interpretation of sediment units and their boundaries was carried out using MDPS software (© MeriData Finland LDT). Modelling of the spatial distribution of sediments was made with ArcGIS (© ESRI, Redlands, CA, USA) Topo to raster interpolation tool. Guided by the acoustic sub-bottom profiles on-site, the coring of sediment sequences was targeted to areas of thick gyttja sections, which were considered on the basis of previous knowledge of postglacial sedimentation in typical Finnish lakes to be location with stable and continuous sedimentation (e.g., [20,21] as well as general theories on sedimentation dynamics [22]). The intent was not to obtain the average accumulation rate over the whole lake basin but to compare accumulation rates and sediment properties typical for the accumulation zones of these basins. Coring of the short sediment sequences (15–30 cm long) was done with a Limnos sediment sampler (height 94 cm, diameter 100/94 mm) [23] in order to obtain undisturbed surface deposits. Typically, one core was obtained per lake; in a few cases two cores were taken. Due to logistical difficulties, acoustic surveys and sediment sampling were not feasible for all lakes that were originally selected. Acoustic surveys were performed for 44 lakes, and sediment coring and analyses were performed for 51 lakes (29 impacted lakes and 22 reference lakes, representing 71% and 82% of the originally identified 62 lakes) during the summers 2013, 2014, and 2016.

2.4. Dating with 137Cs Fallout

Isotopes with short half-lives, such as lead (210Pb) (22.26 years) and cesium (137Cs) (30 years), have been commonly used to date recent sediments spanning the last 100–150 years in lacustrine and marine environments [24]. Cesium is one of the radioactive isotopes that was produced as a result of the nuclear weapon testing and nuclear power plant accidents after the Second World War. Having no natural sources, 137Cs contamination of the environment results from anthropogenic sources alone. In the northern hemisphere, measurable amounts of anthropogenic 137Cs in the atmosphere first occurred in the 1950s, with the first pronounced increase in AD 1954. This was followed by a minimum in AD 1960−61 and a maximum in AD 1963. A clear decrease occurred until fallout resulting from the Chernobyl accident occurred, reaching a peak in AD 1986 [24,25].
The 137Cs peak in AD 1986 from the Chernobyl accident is the dominant feature in sediment sequences in the high fallout area in southern Finland and central Sweden (e.g., [26,27]). Here lake studies were based on annually laminated (i.e., varved) sediments with undisturbed high-resolution sampling and precise chronological control [28,29]. Klaminder et al. [26] and Ojala et al. [27] further showed that due to the high fallout concentration and the slow downward diffusion of the Chernobyl-derived 137Cs, the AD 1986 peak often masks the preceding features of the 137Cs curve formed during the 1950s and 1960s. Consequently, the dominant AD 1986 peak is often the only 137Cs peak that can be used to date recent sediments in the high fallout area.
Cesium (137Cs) analyses during this study were performed at the Geological Survey of Finland (GTK) using two different gamma spectrometers, an older EG&G Ortec ACE™-2K equipped with a four-inch NaI/TI detector and a new fully digital BrightSpec bMCA-USB pulse height analyzer coupled to a well-type NaI(Tl) detector. Ojala et al. [27] showed that despite detector-specific discrepancies, both instruments provided similar results for the Chernobyl-age sediments, regardless of the sample pretreatment or normalizing procedure. Here, 137Cs concentrations of 49 study lakes were measured with 1-cm-resolution. The length of the sediment sections measured from each lake varied between 10 and 20 cm, and some of the measurements were repeated on parallel sediment sequences to control the quality of 137Cs determinations and sediment subsampling.

2.5. Chemical and Physical Analyses of Sediment

Chemical and physical analyses of the sediment cores were conducted at 1-cm-resolution. Laboratory analyses were performed at Eurofins Labtium Oy (SFS-EN ISO/IEC 17025, FINAS accreditation T025). The element concentrations were determined by ICP-MS (Thermo Scientific iCAP Qc; Waltham, MA, USA) and ICP-OES (Thermo Electron iCAP 6500 Duo; Waltham, MA, USA) after microwave-assisted HNO3 digestion (Method 3051; US EPA 1994). The digestion breaks down sulphides, most salts (e.g., apatite), carbonates, trioctahedral micas, and 2:1 and 1:1 clay minerals but does not appreciably dissolve major silicates, such as feldspars. A CN-analyzer (Elementar Vario MAX) was used to determine carbon and nitrogen concentrations. Laboratory duplicates (each batch and every 10th sample) and certified reference materials (each batch) were employed.
In addition, all sub-samples were weighed and dried to determine sediment dry matter contents. This information was then combined with carbon (C) concentrations, sediment bulk density, and cesium dating to calculate carbon and dry matter (DM) accumulation rates (g m−2 a−1) for the post-1986 period (recent sediments) based on the appearance of peak 137Cs fallout from the Chernobyl nuclear accident (Figure 3).
To compare chemical compositions of pre-industrial and recently deposited lake sediments, the human-impacted (top) and background (bottom) sections were identified in each core on the basis of the vertical distributions of K, Cu, Zn, Pb, N, and C. In all of the sediment profiles from both the impacted and reference lakes, there was a clear increase in HNO3-extracted element concentrations (Figure 3). This increase was used to divide the chemical results into three sections: a section with high concentrations in the upper part of the core (4–17 cm thick, depending on the lake), a transitional mid-section (2–8 cm thick), and a bottom section of lower concentrations (2–10 cm thick) (Figure 3). The top and bottom sections are thus based on chemical profiles alone, reflecting general changes in land us, and the time intervals included in the sections likely differ between lakes. These sections were used to generate two datasets of response variables for the numerical analyses by calculating average concentrations of Al, Ba, Ca, Co, Cr, Cu, Fe, K, Mg, Mn, Na, Ni, P, Pb, S, Sr, Ti, V, Zn, N, and C for both the top (human-impacted) and bottom (pre-industrial) sections. The transitional mid-section was omitted from the analyses.

2.6. Numerical Analyses

Numerical methods were employed to study differences between the lake groups and their sediment properties and to examine correlations between environmental variables and sediment accumulation rates and chemical compositions. These basic statistics, correlations, partial correlations, and two-sample tests were calculated with Past 3.24 [30]. T-tests and Mann–Whitney tests were employed to study the differences in average and median carbon and dry matter accumulation rates between the impacted and reference lake groups and to examine differences in catchment and lake properties (environmental variables) between the groups. Due to significant differences, especially in catchment sizes, a trimmed subset of lakes with similar catchment sizes was generated and tested as well. Linear correlations between the environmental variables and accumulation rates were examined to identify factors that effected carbon and dry matter accumulation. Partial linear correlations were then employed to study whether the effect of peat extraction intensity on accumulation rates was masked by other environmental factors. This analysis controls the other variables one at a time. Rank order correlations were used to identify relationships between the environmental variables and bottom-to-top changes in sediment chemical concentrations. The overall change in sediment chemistry was modeled with Euclidian distances between the log-transformed average chemical concentrations of the bottom and top sections of the cores (21 elements).
Multivariate ordinations were applied to study changes in chemical assemblages and relations between environmental factors (lake and catchment properties) and chemical assemblages (sediment quality) in more detail. Unconstrained and constrained ordinations and the related plots were made with CANOCO 4.5 WIN and the CanoDraw software packages [31]. Linear-response-based methods of principal components analysis (PCA) and redundancy analysis (RDA) were used to identify relations.
The explanatory dataset (environmental variables) employed in the numerical analyses was generated as described above (see Lake and Catchment Properties). The same dataset was used for both top and bottom chemistries but variables that describe recent land use were excluded when studying the predisturbance (bottom) sediment data set. Variables included in the environmental dataset were: catchment area (ha), lake size (ha), catchment to lake ratio, peatland area (% of catchment), peat extraction area (%), forestry-ditched (drained) peatland area (%), the total area of lakes in the catchment (%), and agricultural area (%).

3. Results

3.1. Recent Sedimentation Rates

3.1.1. Overall Sediment Thickness

The quality of acoustic data was divided into four groups depending on the distinctiveness of sub-bottom units and spatial coverage of the profiles. Accordingly, the studied lakes were divided into (i) good, (ii) average, and (iii) poor classes. Of the sub-bottom surveys, a total of 14 lakes were ranked as good in their quality (five impacted lakes, nine reference lakes), 15 lakes were ranked as average quality (nine impacted lakes, six reference lakes), and 15 lakes were ranked as poor quality (11 impacted lakes, four reference lakes) (Table A1). The results clearly show that there is no significant difference in the quality of acoustic sub-bottom profiles between the impacted and reference lakes. We also note that the accuracy of the inferred spatial distribution and thickness of gyttja depends on the general quality of acoustic data where the most reliable interpretations of sediment distribution and thicknesses were made on lakes where both the distinctiveness of sediment units and the spatial coverage of survey lines were high.
The distribution of lacustrine deposits in the impacted and reference group lakes display draped characteristics where an average overall thickness of postglacial soft sediments in both lake groups was very similar (Table A1). An example of acoustic profile and sediment unit interpretation from the impacted Lake Halmejärvi, typical of the studied lakes, is given in Figure 4. The thickest gyttja section is found in the deepest basins, although almost the entire lake bottom is covered by postglacial soft sediments. In the Lake Halmejärvi case, the maximum and average thickness of lake sediments is 7.6 and 2.7 m, respectively, which is among the thickest sections found in the study. Importantly, we did not find any significant differences in the variation in spatial thickness of the sediments between the impacted and reference lakes. The interpolated average thickness of soft sediments in all surveyed lakes is 1.9 m with a median of 1.6 m. We noticed only a minor difference in average thickness of soft sediments between the impacted and reference group lakes (Table A1). Where the average soft sediment thickness in the impacted lakes is 2.0 m (median 1.6 m), it is 1.8 m (median 1.7 m) in reference lakes. Likewise, the maximum observed sediment thickness of the impacted lakes is 10.9 m in Lake Salahminjärvi (impacted lake) and 8.6 m in reference lakes (Lake Eitikka).

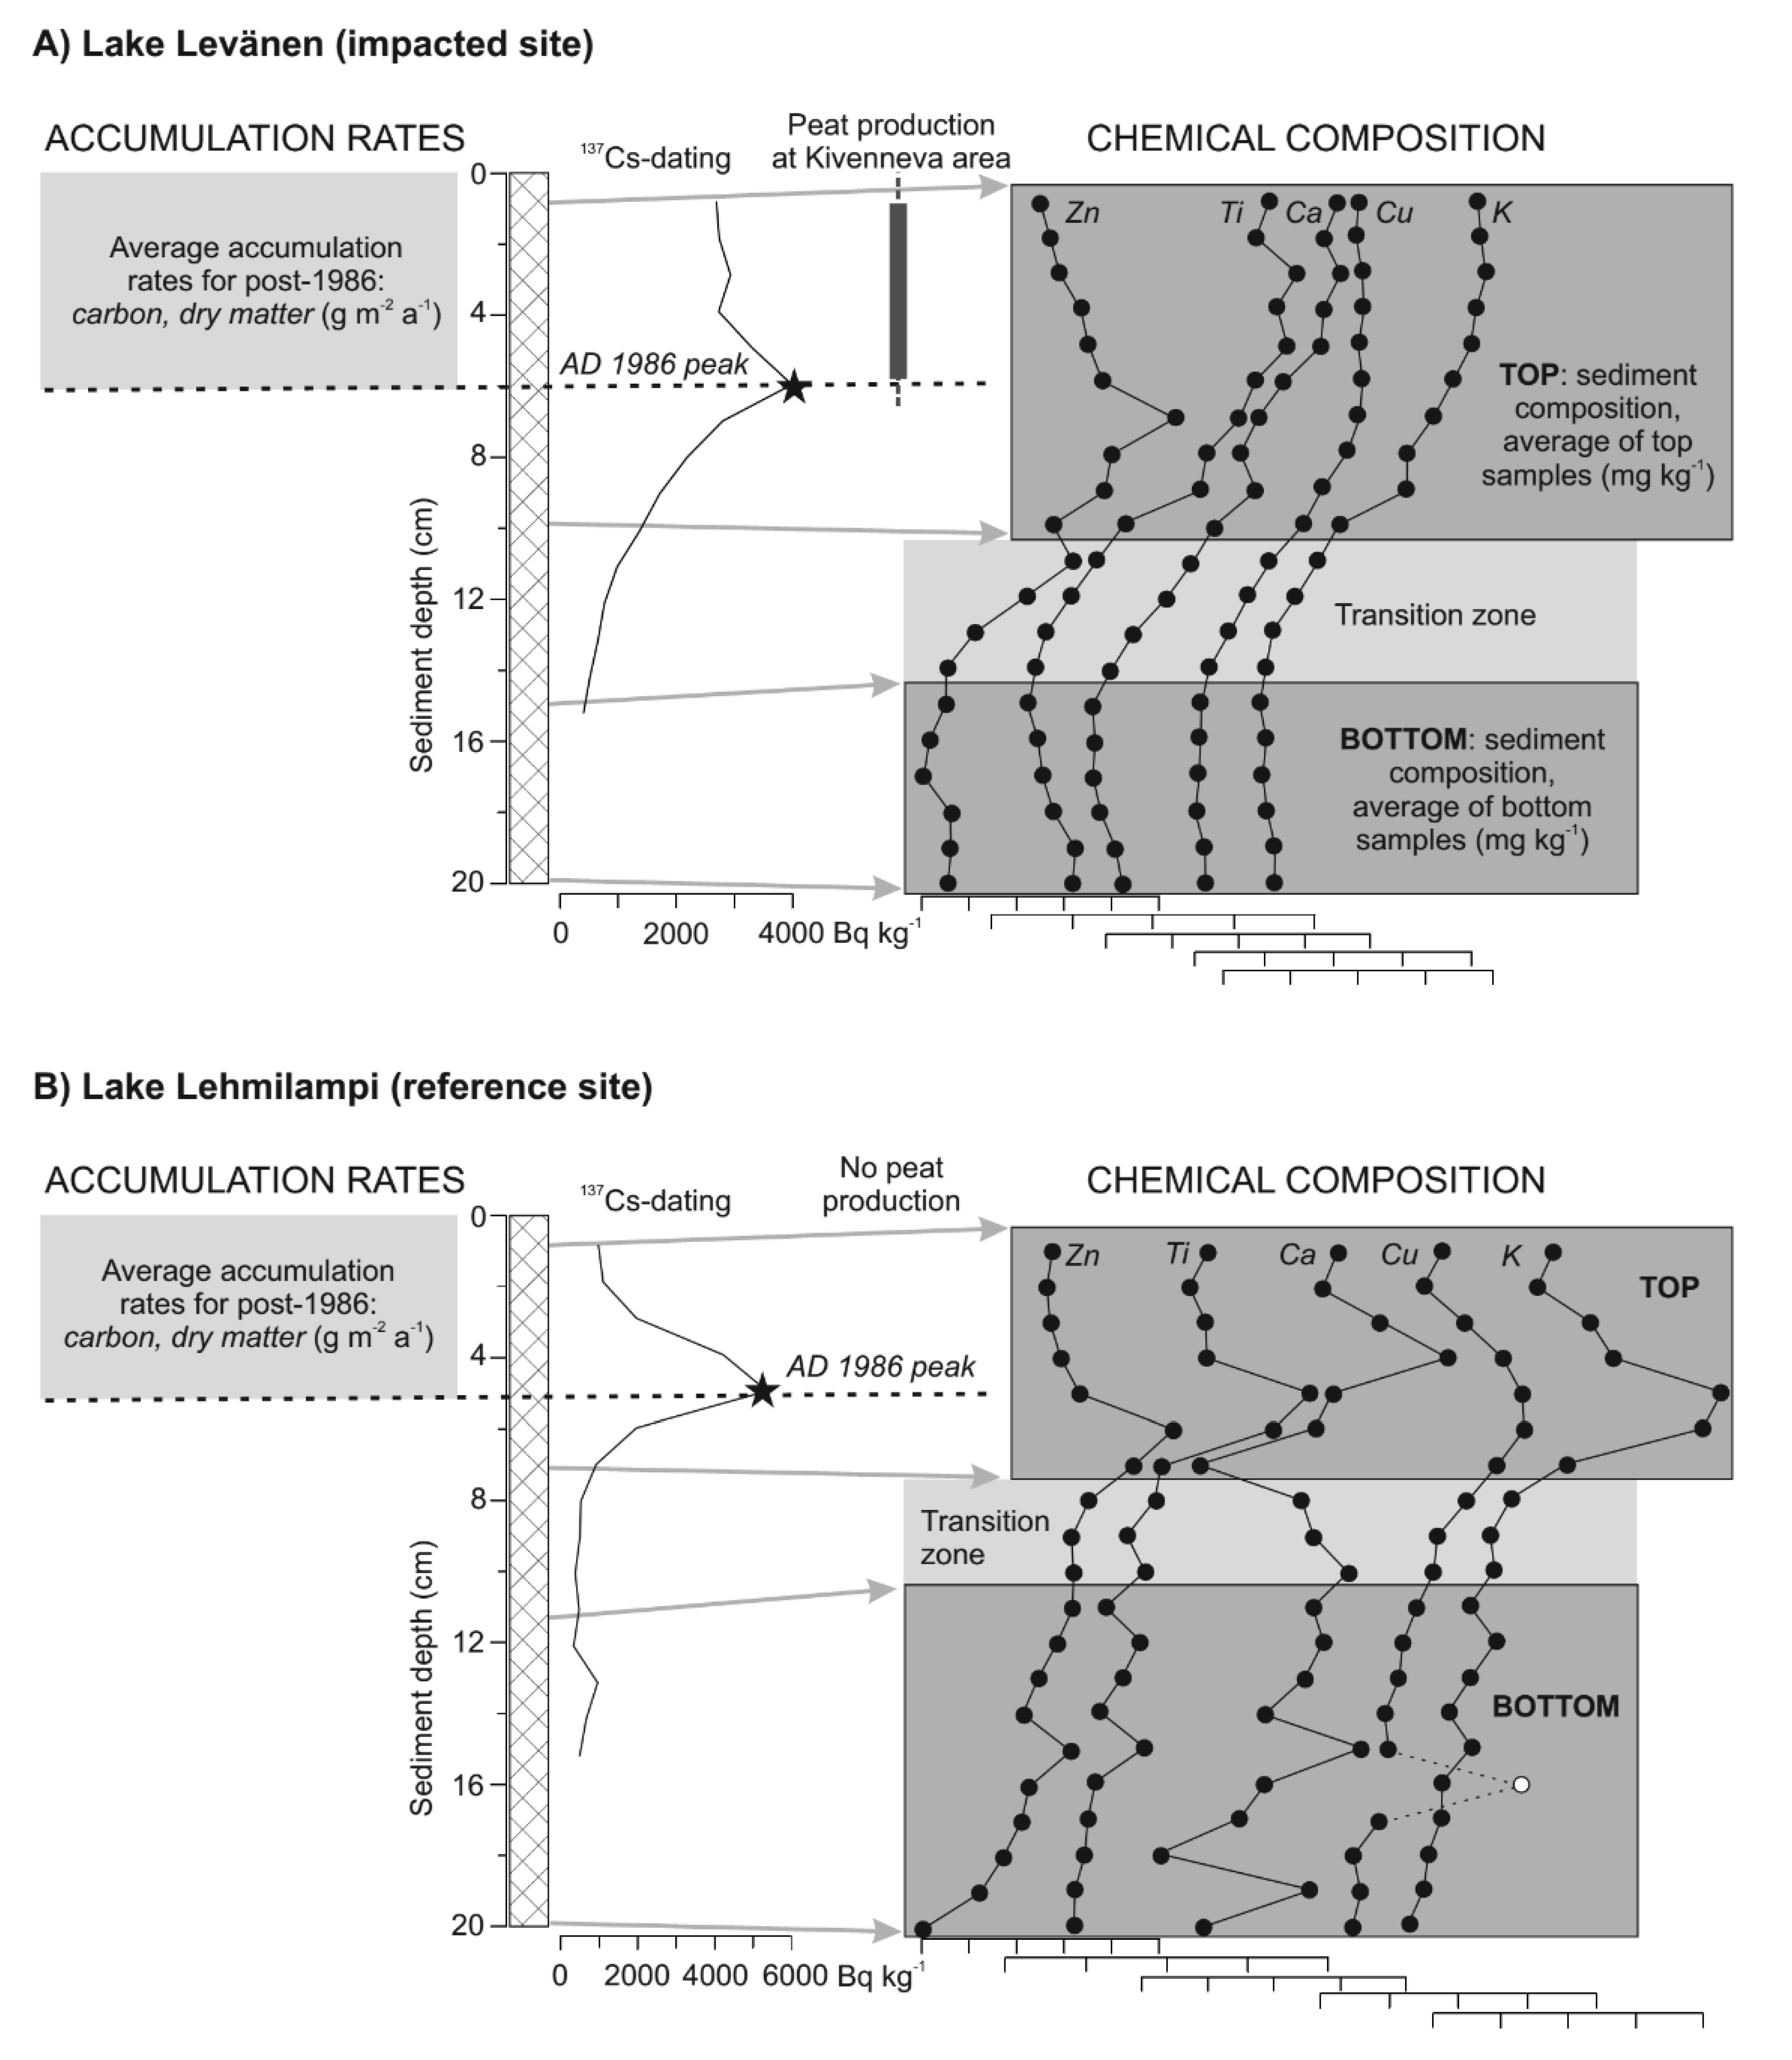
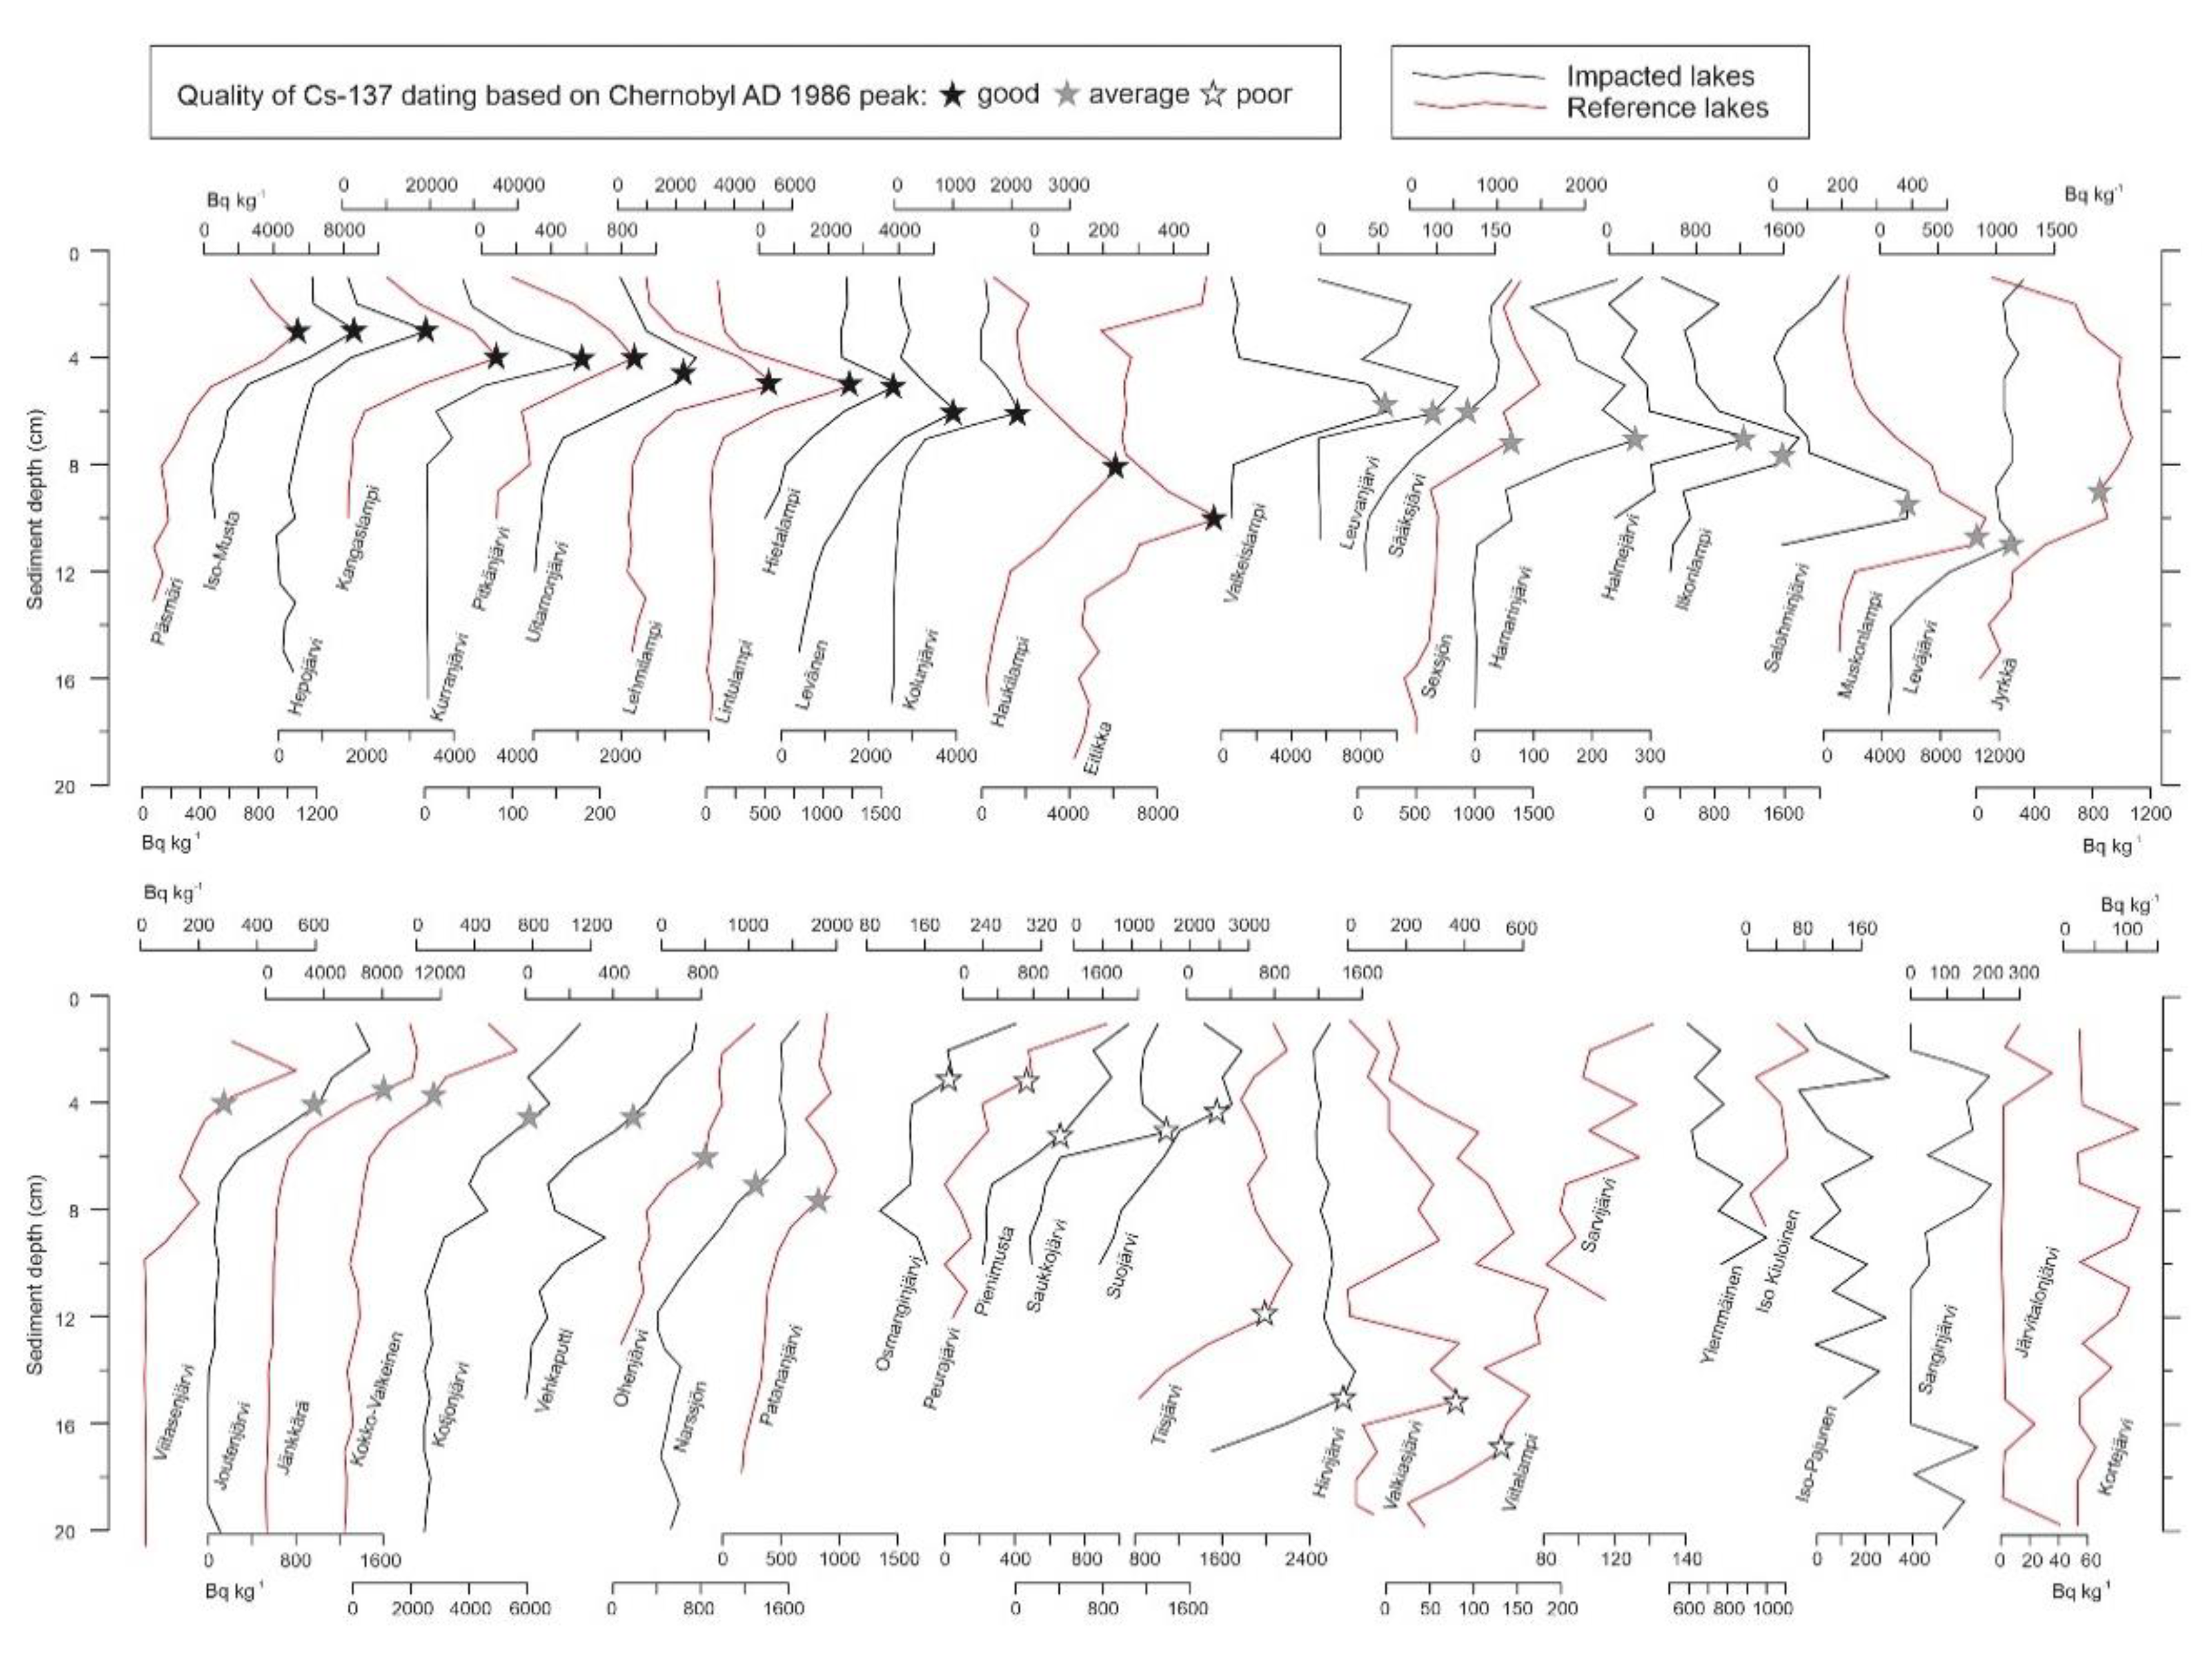
3.1.2. 137Cs Dating and the Rate of Recent Sediment Deposition

The vertical distribution of 137Cs in the impact and reference lake sequences are presented in Figure 5. Every package of surface sediments in the dataset contained anthropogenic cesium, indicating that they post-date 1950 in age and represent recent sediment accumulation. Based on the shape of the curves and, in particular, the appearance and distinctiveness of the Chernobyl-derived AD 1986 fallout peak, each 137Cs curve was classified as (i) good, (ii) average, or (iii) poor to assess the quality of cesium dating. In 14 cases the dating quality was classified as good, in 19 cases as average, and in nine cases as poor. In addition, in seven cases the 137Cs curves were so dispersed or low in cesium concentration that the sequence could not be dated with any meaningful certainty. Importantly, impacted and reference lakes were evenly distributed in all quality classes indicating that the 137Cs dating results are independent of whether there was peat extraction in their catchment area. The activity of 137Cs and the depth of the Chernobyl-derived AD 1986 peak were used to assess sediment age–depth levels and to calculate the rate of deposition as given in Table A2.
The lakes that were rated as good in their dating quality, including Päsmäri, Iso-Musta, Hepojärvi, Kangaslampi, Kurranjärvi, Pitkänjärvi, Untamonjärvi, Lehmilampi, Lintulampi, Hietalampi, Levänen, Kolunjärvi, Haukilampi, and Eitikka, show a pronounced AD 1986 peak at a depth of 3–10 cm, corresponding to a sedimentation rate of 1–3.3 mm a−1 during about the last 30 years (Figure 5, Table A2). In all these curves, the cesium peak is followed by a gentle upwards declining trend (‘tail’) indicative of catchment-to-basin 137Cs mobilization and re-deposition. The curves also exhibit a slight downward diffusion of the Chernobyl-derived cesium in the sediment. These characteristics are typical for lake sequences in the area of high atmospheric fallout as discussed by Ojala et al. [25], among others. Importantly, we note that there is no significant and/or systematic difference in the AD 1986 peak depth or in the rate of recent deposition between the impacted and reference lakes of the present study.
The lakes that were rated as average in their 137Cs dating quality possess peaks or rises in the AD 1986 137Cs activity level that is fairly easy to detect. Again, this group of lakes contains similar numbers of impact and reference lakes. In their sequences, significant rises or peaks in cesium are related to the maximum Chernobyl-derived fallout at the depth of 4–8 cm. However, in some cases (e.g., Moskunlampi and Ilkonlampi), the number of analyzed sample points below the peak is unfortunately few, adding uncertainties to the dating. The inferred depth of AD 1986 in these sequences typically lies between 6 and 11 cm. In other average-rated cases (e.g., Joutenjärvi, Jänkkärä, Kokko-Valkeinen, and Kotjonjärvi), 137Cs activity curves show a gentle increase from the zero-background level (below about 8 cm) towards the top of the sequence (i.e., present day) without any distinct peak value. As suggested by Ilus and Saxén [32], this type of 137Cs curve appears in lakes that are characterized by a very slow rate of sedimentation, which is probably the case here as well. We believe that in these cases the AD 1986 Chernobyl fallout level is close to the sediment surface, generally corresponding to a post-Chernobyl sedimentation rate of 1.3–2.3 mm a−1.
The lakes that were rated as poor in their 137Cs dating quality are clearly lacking a distinguishable peak value but contain some indications of elevated concentration that could be interpreted to represent AD 1986 event. For example, 137Cs profiles of the lakes Tiisjärvi, Hirvijärvi, Valkiaisjärvi, and Viitalampi indicate a rapid increase in 137Cs concentration in the lower part of the section and then a broad curve in the uppermost part of the sequence. The inflection point in these cesium profile curves, at the depth of 12–17 cm, may represent the AD 1986 level in the sediment. However, the lack of analysis below the 20 cm level makes the dating more uncertain, which is why they were classified as poor in 137Cs dating quality.
Finally, lakes Sarvijärvi, Valkeisjärvi, Ylemmäinen, Iso-Pajunen, Sanginjärvi, Järvitalonjärvi, and Kortejärvi exhibit scattered 137Cs profiles, which were consider unsuitable for dating. They typically have lower concentrations of cesium in their sequences or/and contain noise in their data due to considerable sediment mixing during deposition or sediment sampling. This group of lakes contain both the impact and reference lakes, indicating that unsuccessful 137Cs dating was not related to the extraction of peat from the catchment area.

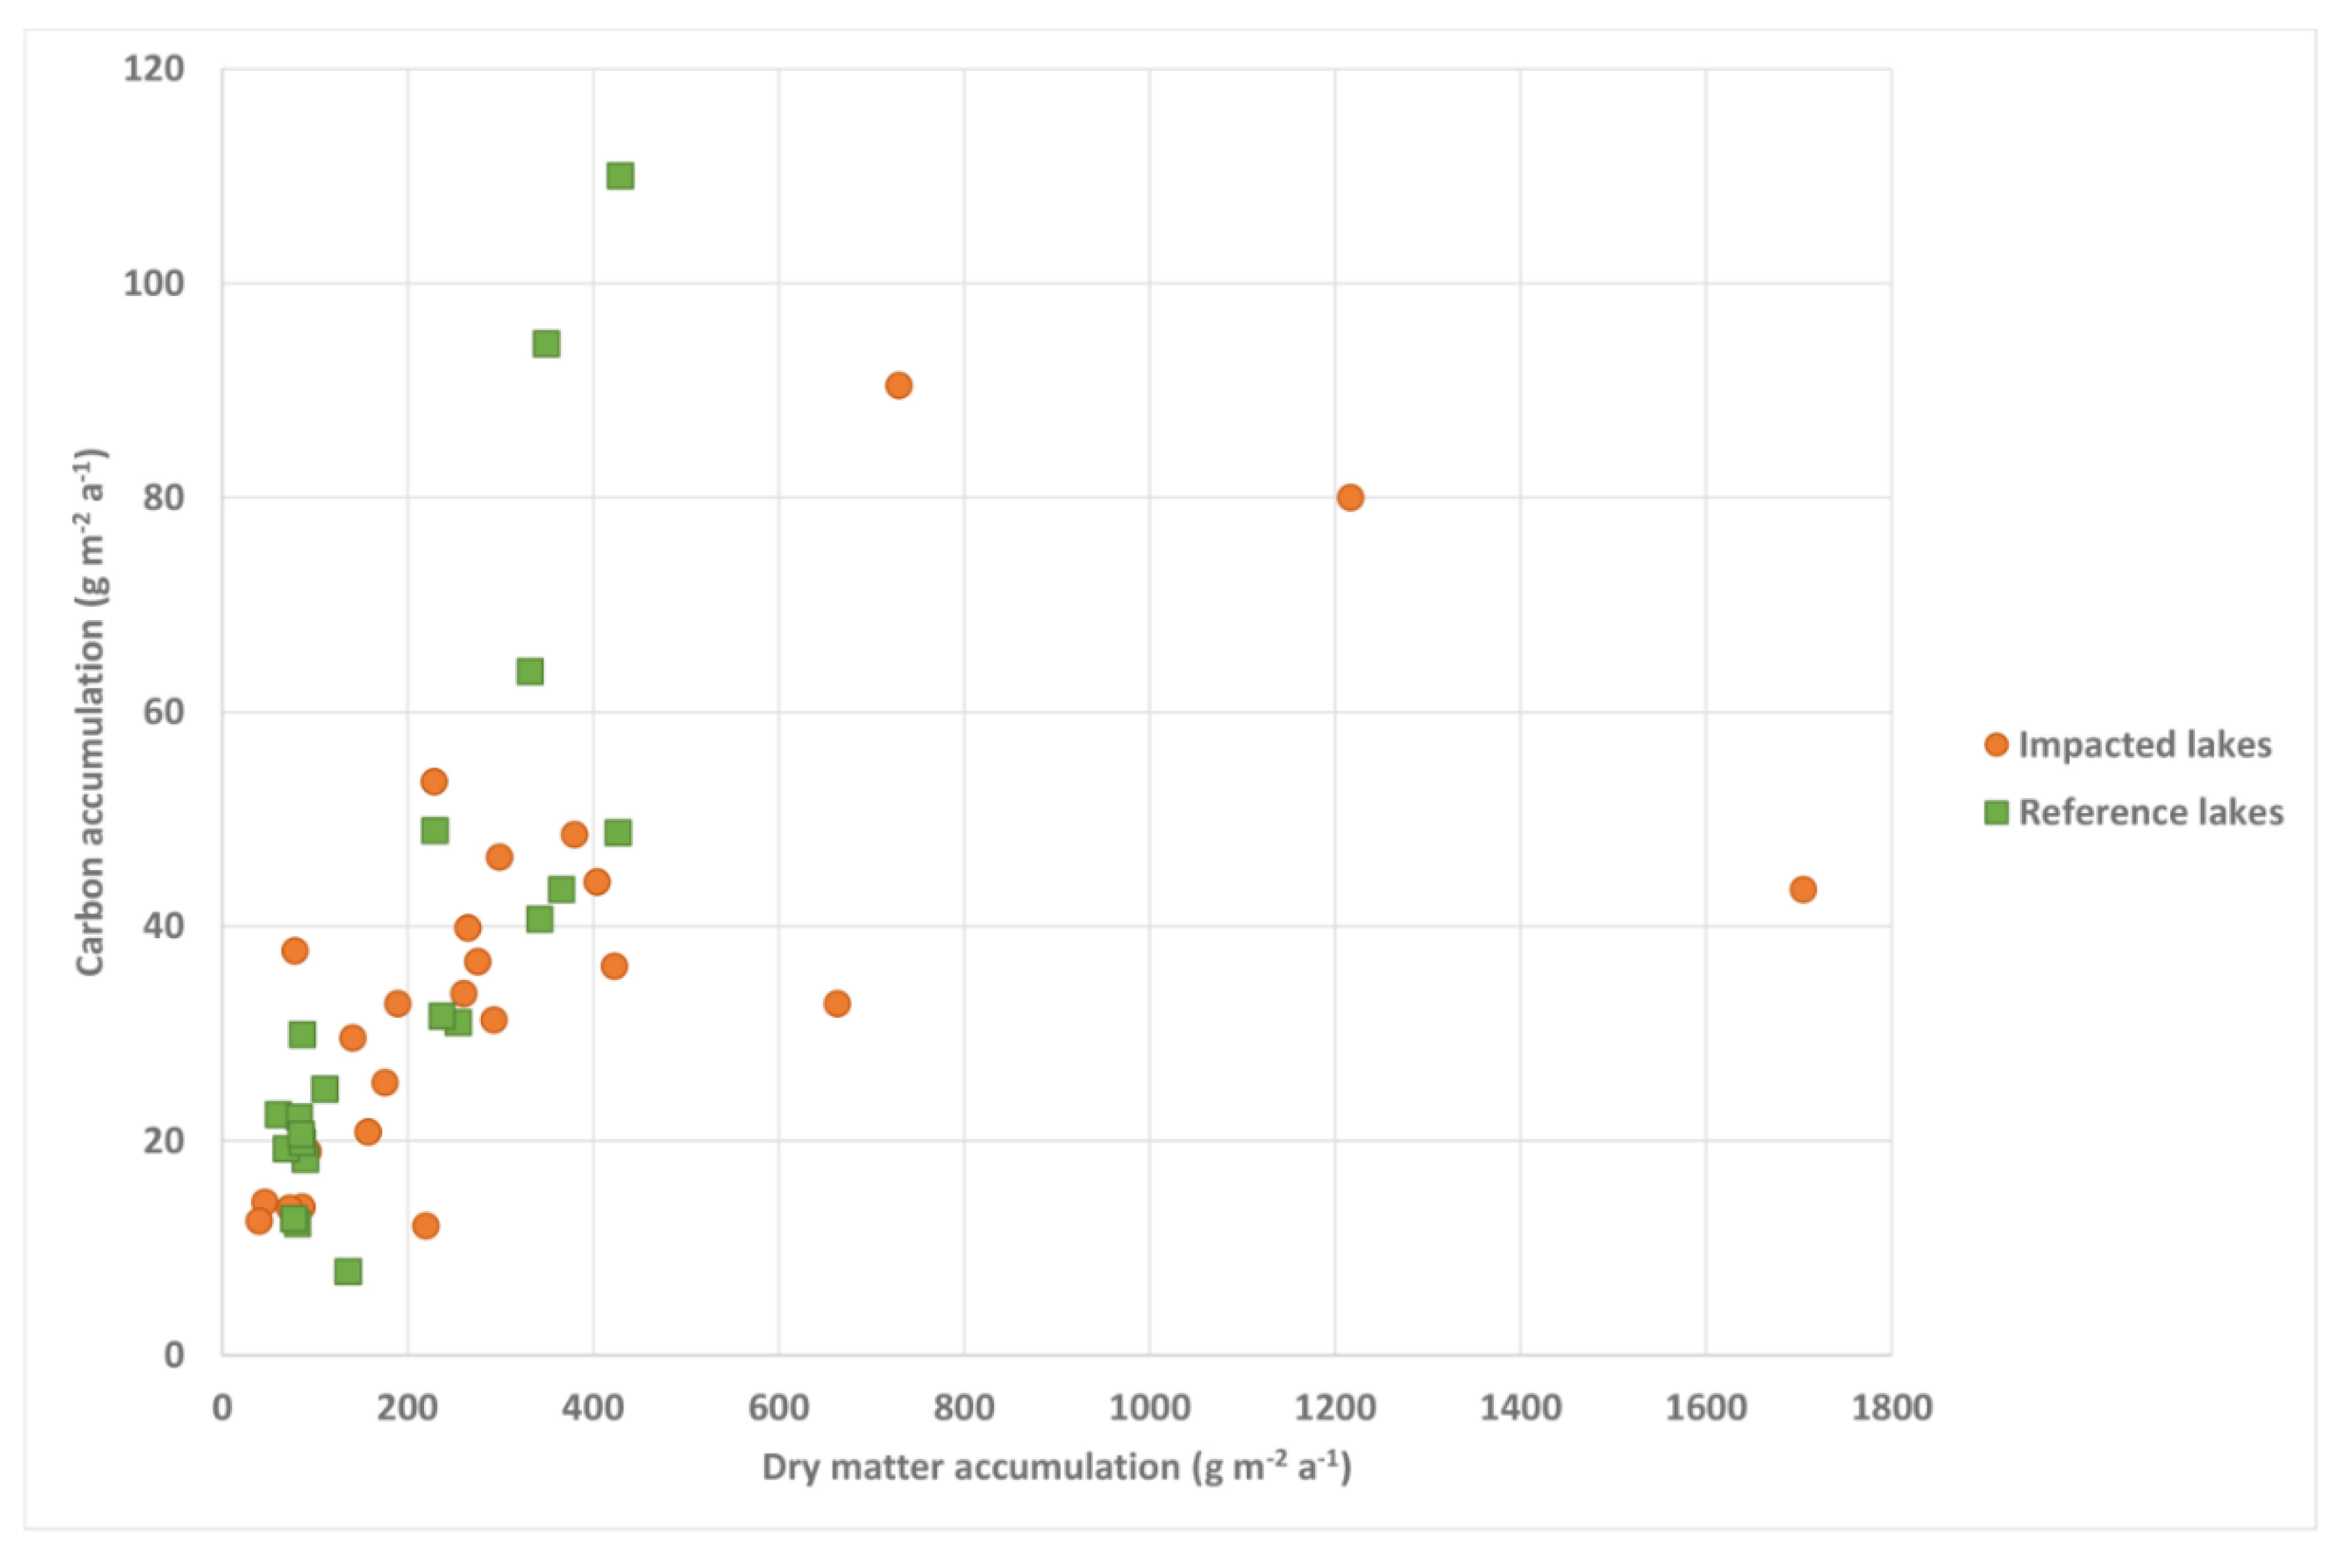
3.1.3. Carbon and Dry Matter Accumulation

The dry matter to carbon (DM/C) ratio for all samples/cores of the studied lake sediments was in general similar to other small lakes in Finland (Figure 6) (e.g., [20]). The only noticeable difference can be found in those impacted lakes that have carbon contents less than c. 10%. They are also characterized by higher dry matter contents than typical small lakes in Finland (Figure 6). Figure 7 shows the post-1986 carbon and dry matter accumulation rates in the impacted and reference lake groups. In most cases, both groups have carbon accumulation rates between 10 and 60 g m−2 a−1 and DM accumulation of less than 500 g m−2 a−1. There are no significant differences between the lake groups. The highest scattered values of DM accumulation rates (up to 1700 g m−2 a−1) can be found in the impacted lake group, while the highest carbon accumulation rates are in the reference group lakes and reach up to 115 g m−2 a−1.
On average, the post-1986 rate of carbon accumulation was similar in the impacted and reference lakes, 36 and 35 g m−2 a−1, respectively (Table 2). The small difference in the mean accumulation rates was not statistically significant (p = 0.873).
However, the group-wise comparison may be hampered by the differences in the catchment properties between the lakes, discussed above (see Table 1). In particular, the impacted lake group includes lakes with very large catchments, while a number of lakes in the reference group have catchments smaller than 100 ha. To account for the effect of catchment size on the results, a smaller subset of lakes with comparable catchment sizes was selected by removing both the impacted lakes with catchments larger than in the reference lakes and reference lakes with catchments smaller than those found for the impacted lakes (Table 1). The trimming resulted in better correspondence of catchment size, depth, drainage intensity, and agricultural intensity between the impacted and reference lakes. However, the impacted lakes were statistically smaller in the trimmed subset (it was the other way around in the full set) and had somewhat more peatlands (33 vs. 20%). The trimmed dataset also had fewer upstream water bodies (5 vs. 13%) in their catchments than the reference lakes. Similar to the full set of lakes, carbon accumulation was slightly higher in the impacted lakes (31.4 vs. 30.5 g m−2 a−1) of the trimmed subset, but the difference was not statistically significant. The same was true for dry matter accumulation (247 vs. 204 g m−2 a−1).

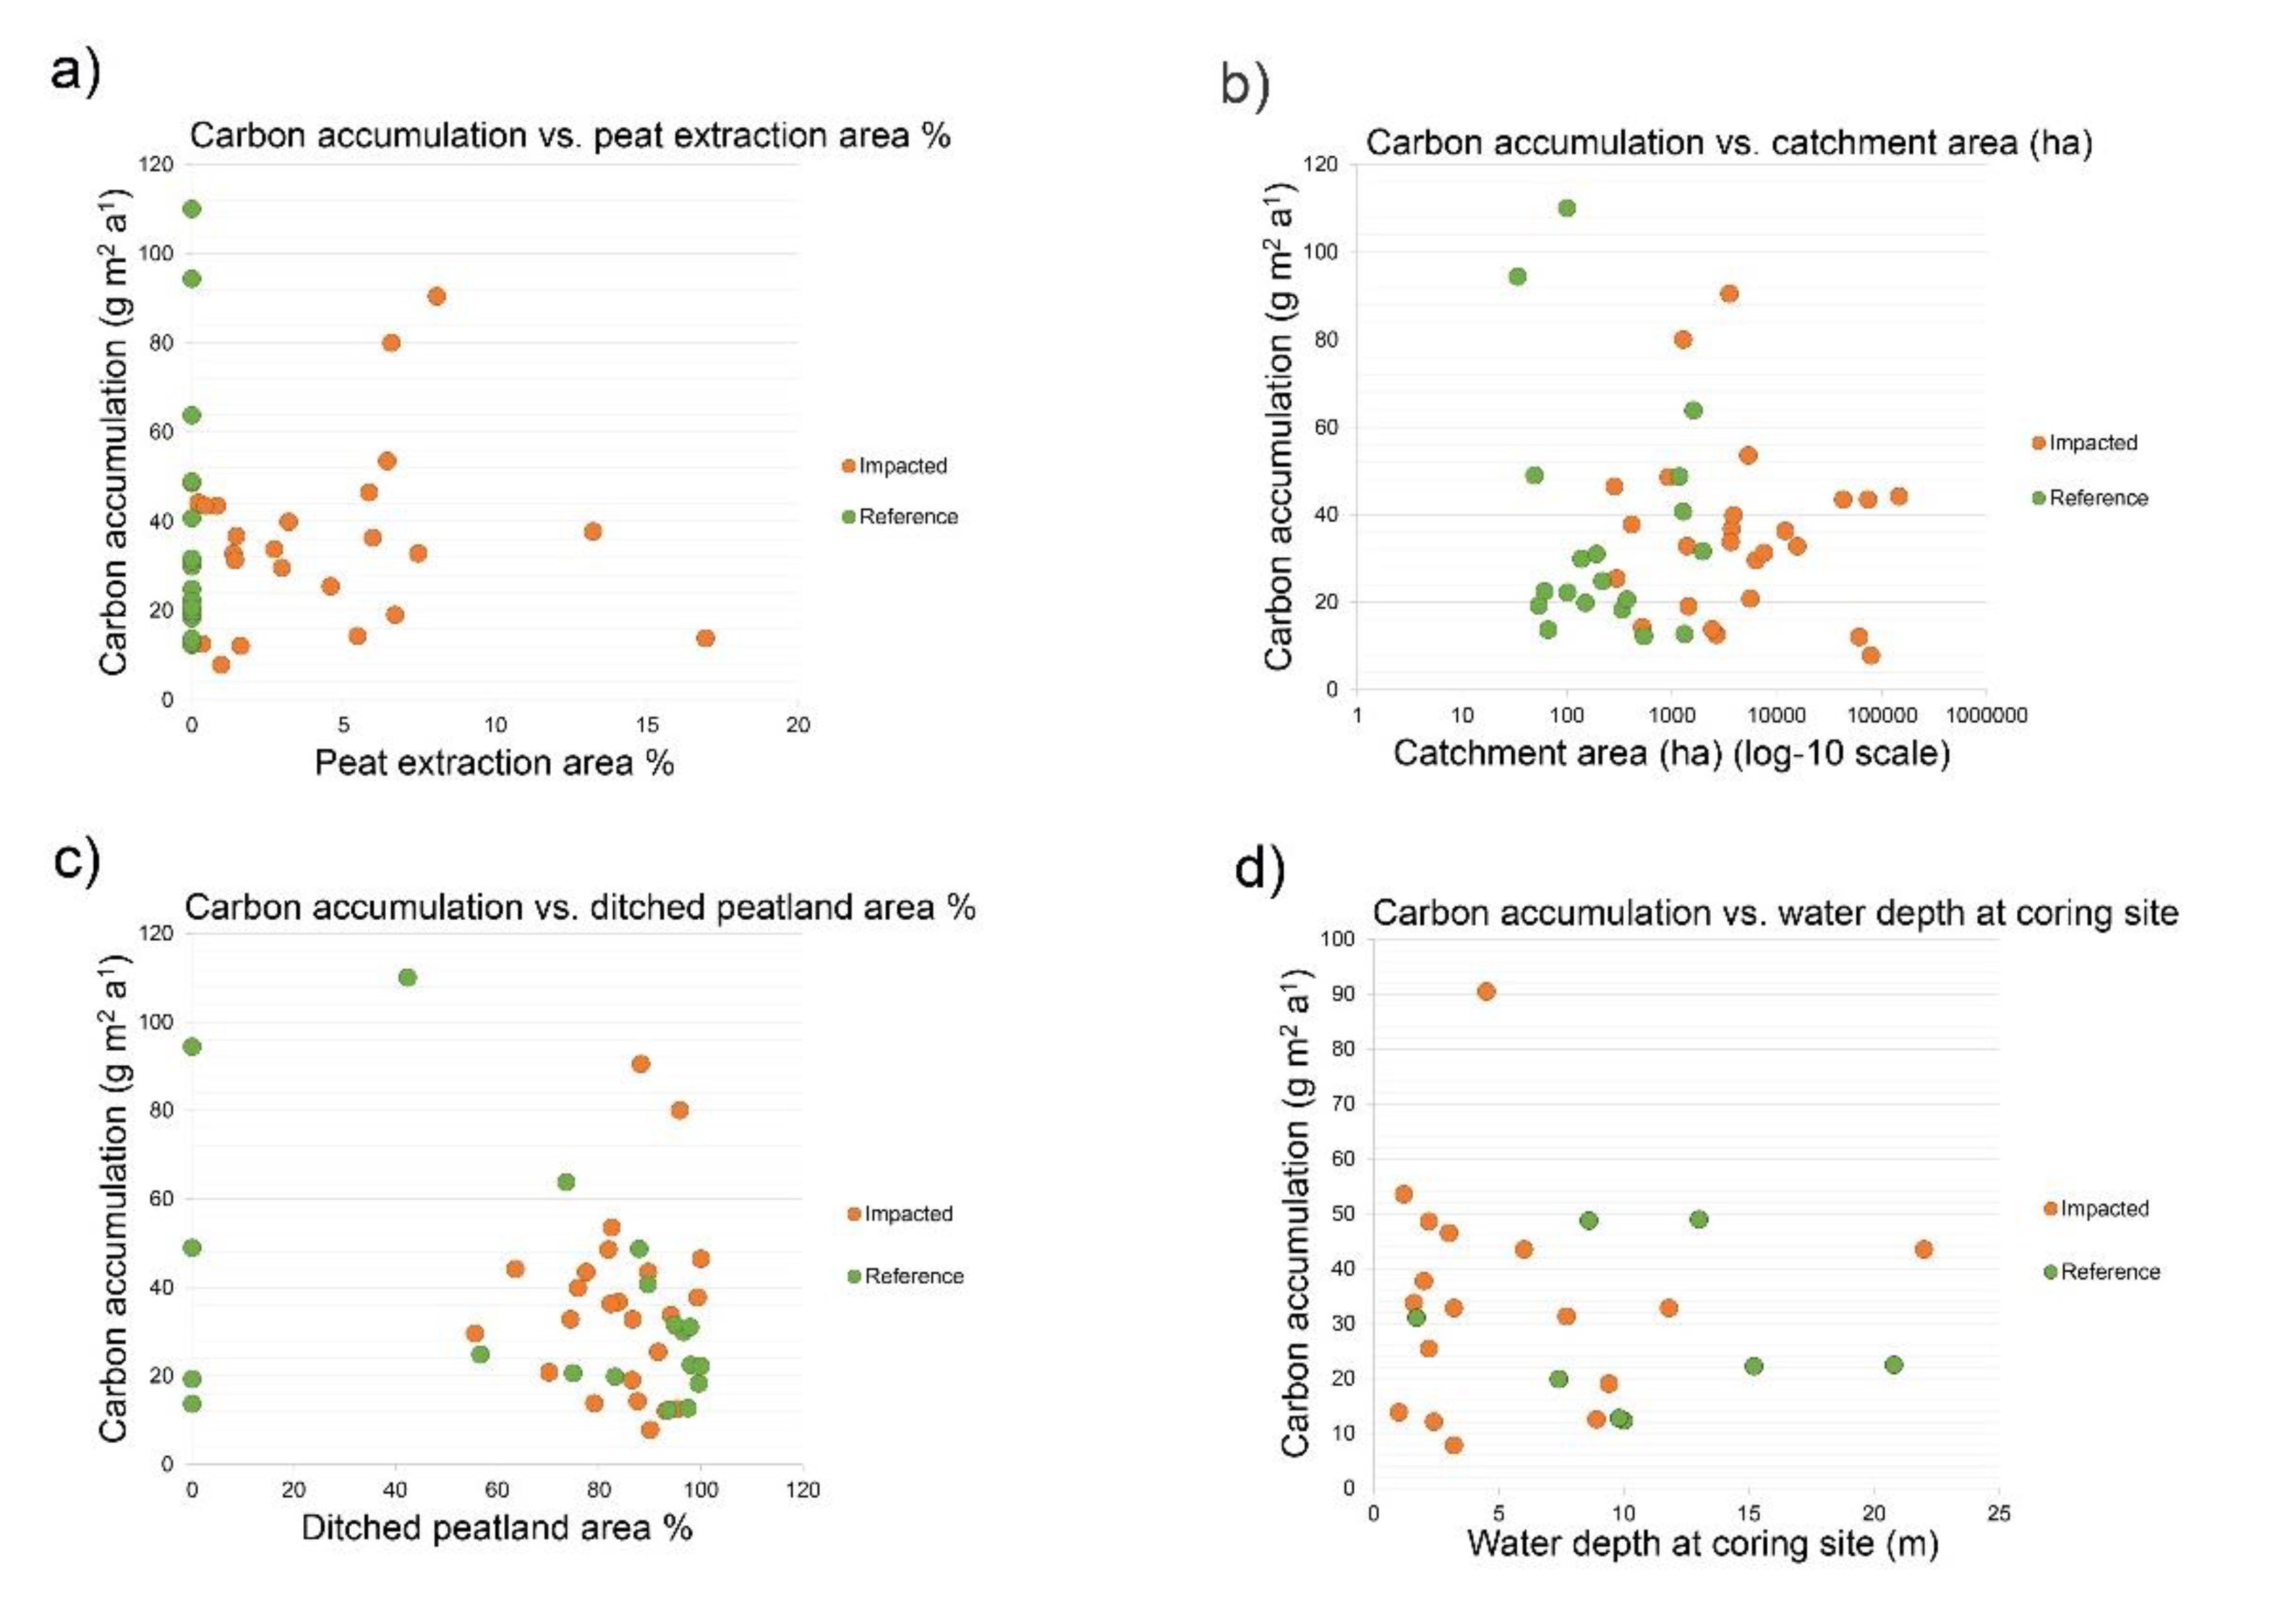
3.1.4. Factors Affecting Carbon and Dry Matter Accumulation

Environmental factors affecting the post-1986 carbon and dry matter accumulation rates were studied for both the full dataset for which recent (post 1986) accumulation rates were available (43 lakes) and the trimmed subset that contained 19 lakes. Table 3 shows the linear (Pearson) correlations for both datasets between the environmental variables and recent (post–1986) dry matter and carbon accumulation. With two exceptions, no statistically significant correlations were found between the environmental factors and the accumulation rates. The exceptions included weak positive correlations between agricultural land and carbon accumulation and weak correlations between lake size and the accumulation of dry matter for the full 43-lake dataset. Correlation between the extent of peat extraction and carbon accumulation was weak and not statistically significant for either data set, and the same was true for drainage intensity. This lack of trend between environmental variables and carbon accumulation is evident in Figure 8, which shows the post-1986 carbon accumulation rate plotted against peat extraction area (% of the catchment area), catchment area size (hectares), ditched peatland area (% of the catchment area), and average lake depth (m).
Because the lack of correlation between peat extraction and recent carbon accumulation may result from other variables that mask their influence, partial linear correlations between peat extraction and carbon accumulation were calculated after accounting for the other variables (Table 4). However, the extent of peat extraction failed to produce a statistically significant correlation with the remaining variation in the carbon accumulation rates in either the full dataset and trimmed subset.

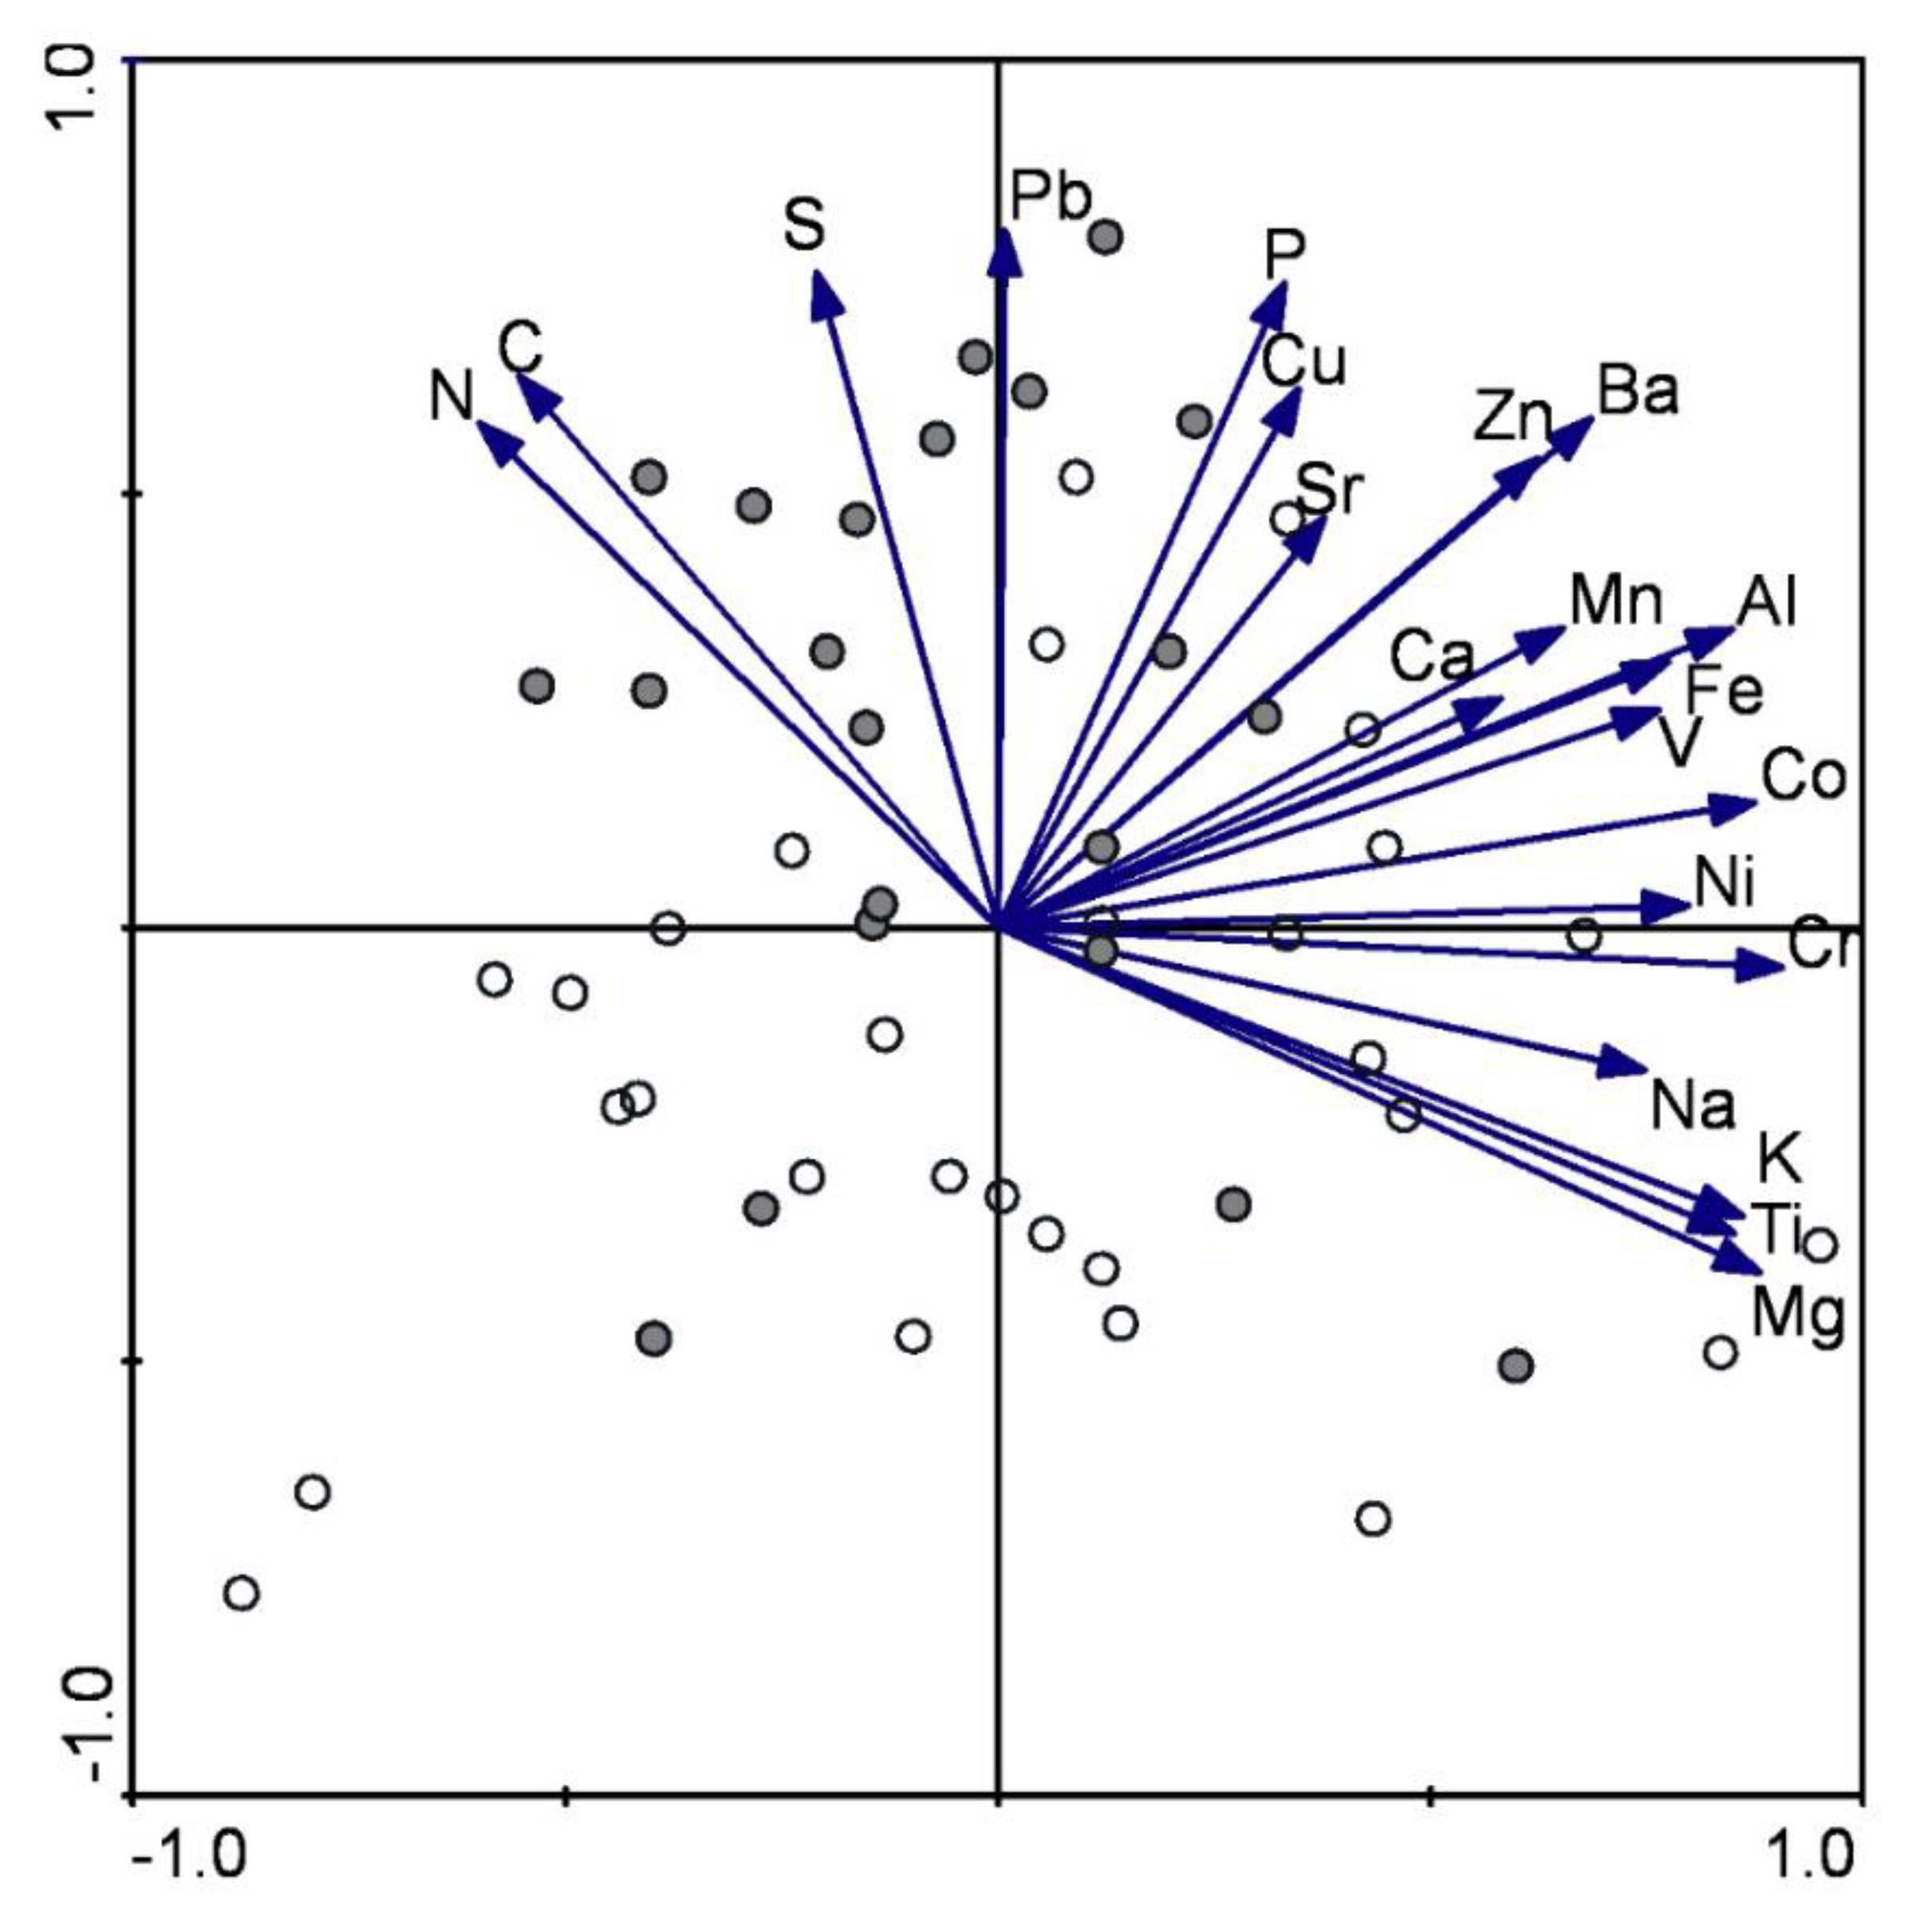
3.2. Chemical Compositions of the Sediment

The chemical composition of sediments was studied for 51 lakes (29 impacted and 22 reference lakes) by comparing the differences between top and bottom concentrations within both lake groups. As described in the methods section, ‘top’ and ‘bottom’ sections were identified from each core based on the vertical distribution of K, Cu, Zn, Pb, N, and C. The averages were calculated for four groups of sediment samples: top and bottom values in both impacted and reference lakes.
Table 5 shows that differences in the chemical composition of the sediments occurred between the impacted and reference lake groups prior to the industrial period and before signs of intensive land use. Most notably, the bottom sediments of the impacted lakes were richer in K, Na, Mg, and Ti, but poorer in P, S, and Pb. In general, the chemical composition of the sediments became more mineral-rich through time but with lower C and N concentrations in all lakes. However, this increase in mineral-related elements (e.g., Al, Ti, K, Na, and Mg) was more pronounced in the impacted lake group. In contrast, concentrations of redox-sensitive elements (including Fe, Mn, and Sr) increased more in the reference lakes. Reference lakes also saw increases in Zn, Cu, and the aerial fallout elements S and Pb. Altogether, sediments in the studied lakes contained less HNO3-extractable Al, Cr, K, and Mg than small Finnish lakes in general (see [21]), whereas concentrations of the aerial fallout elements S and Pb were higher.
The Spearman’s rank correlations between bottom-to-top changes in individual elements (change in concentration relative to bottom concentration) to the environmental variables (see Table A3) were, in general, weak (Rs < 0.4). Poor correlations were also observed between the environmental variables and the overall chemical change as expressed as Euclidean distances between the bottom–top pairs calculated based on log-transformed chemical data (see Table A3). The only statistically significant, moderately strong correlations were between Pb and the percentage of upstream water bodies (Rs = 0.549, p = 0.000), carbon and lake size (Rs = 0.426, p = 0.001), and phosphorus and peatland percentage (Rs = 0.416, p = 0.002). Peat extraction produced statistically significant but weak positive rank order correlations with changes in Ca, Sr, and Ba concentrations (Rs = 0.383, 0.386, and 0.279). Although expected to be a significant factor, the size of the catchment was not significantly related to changes in sediment chemical composition, even though the dataset included a wide range of catchment sizes.

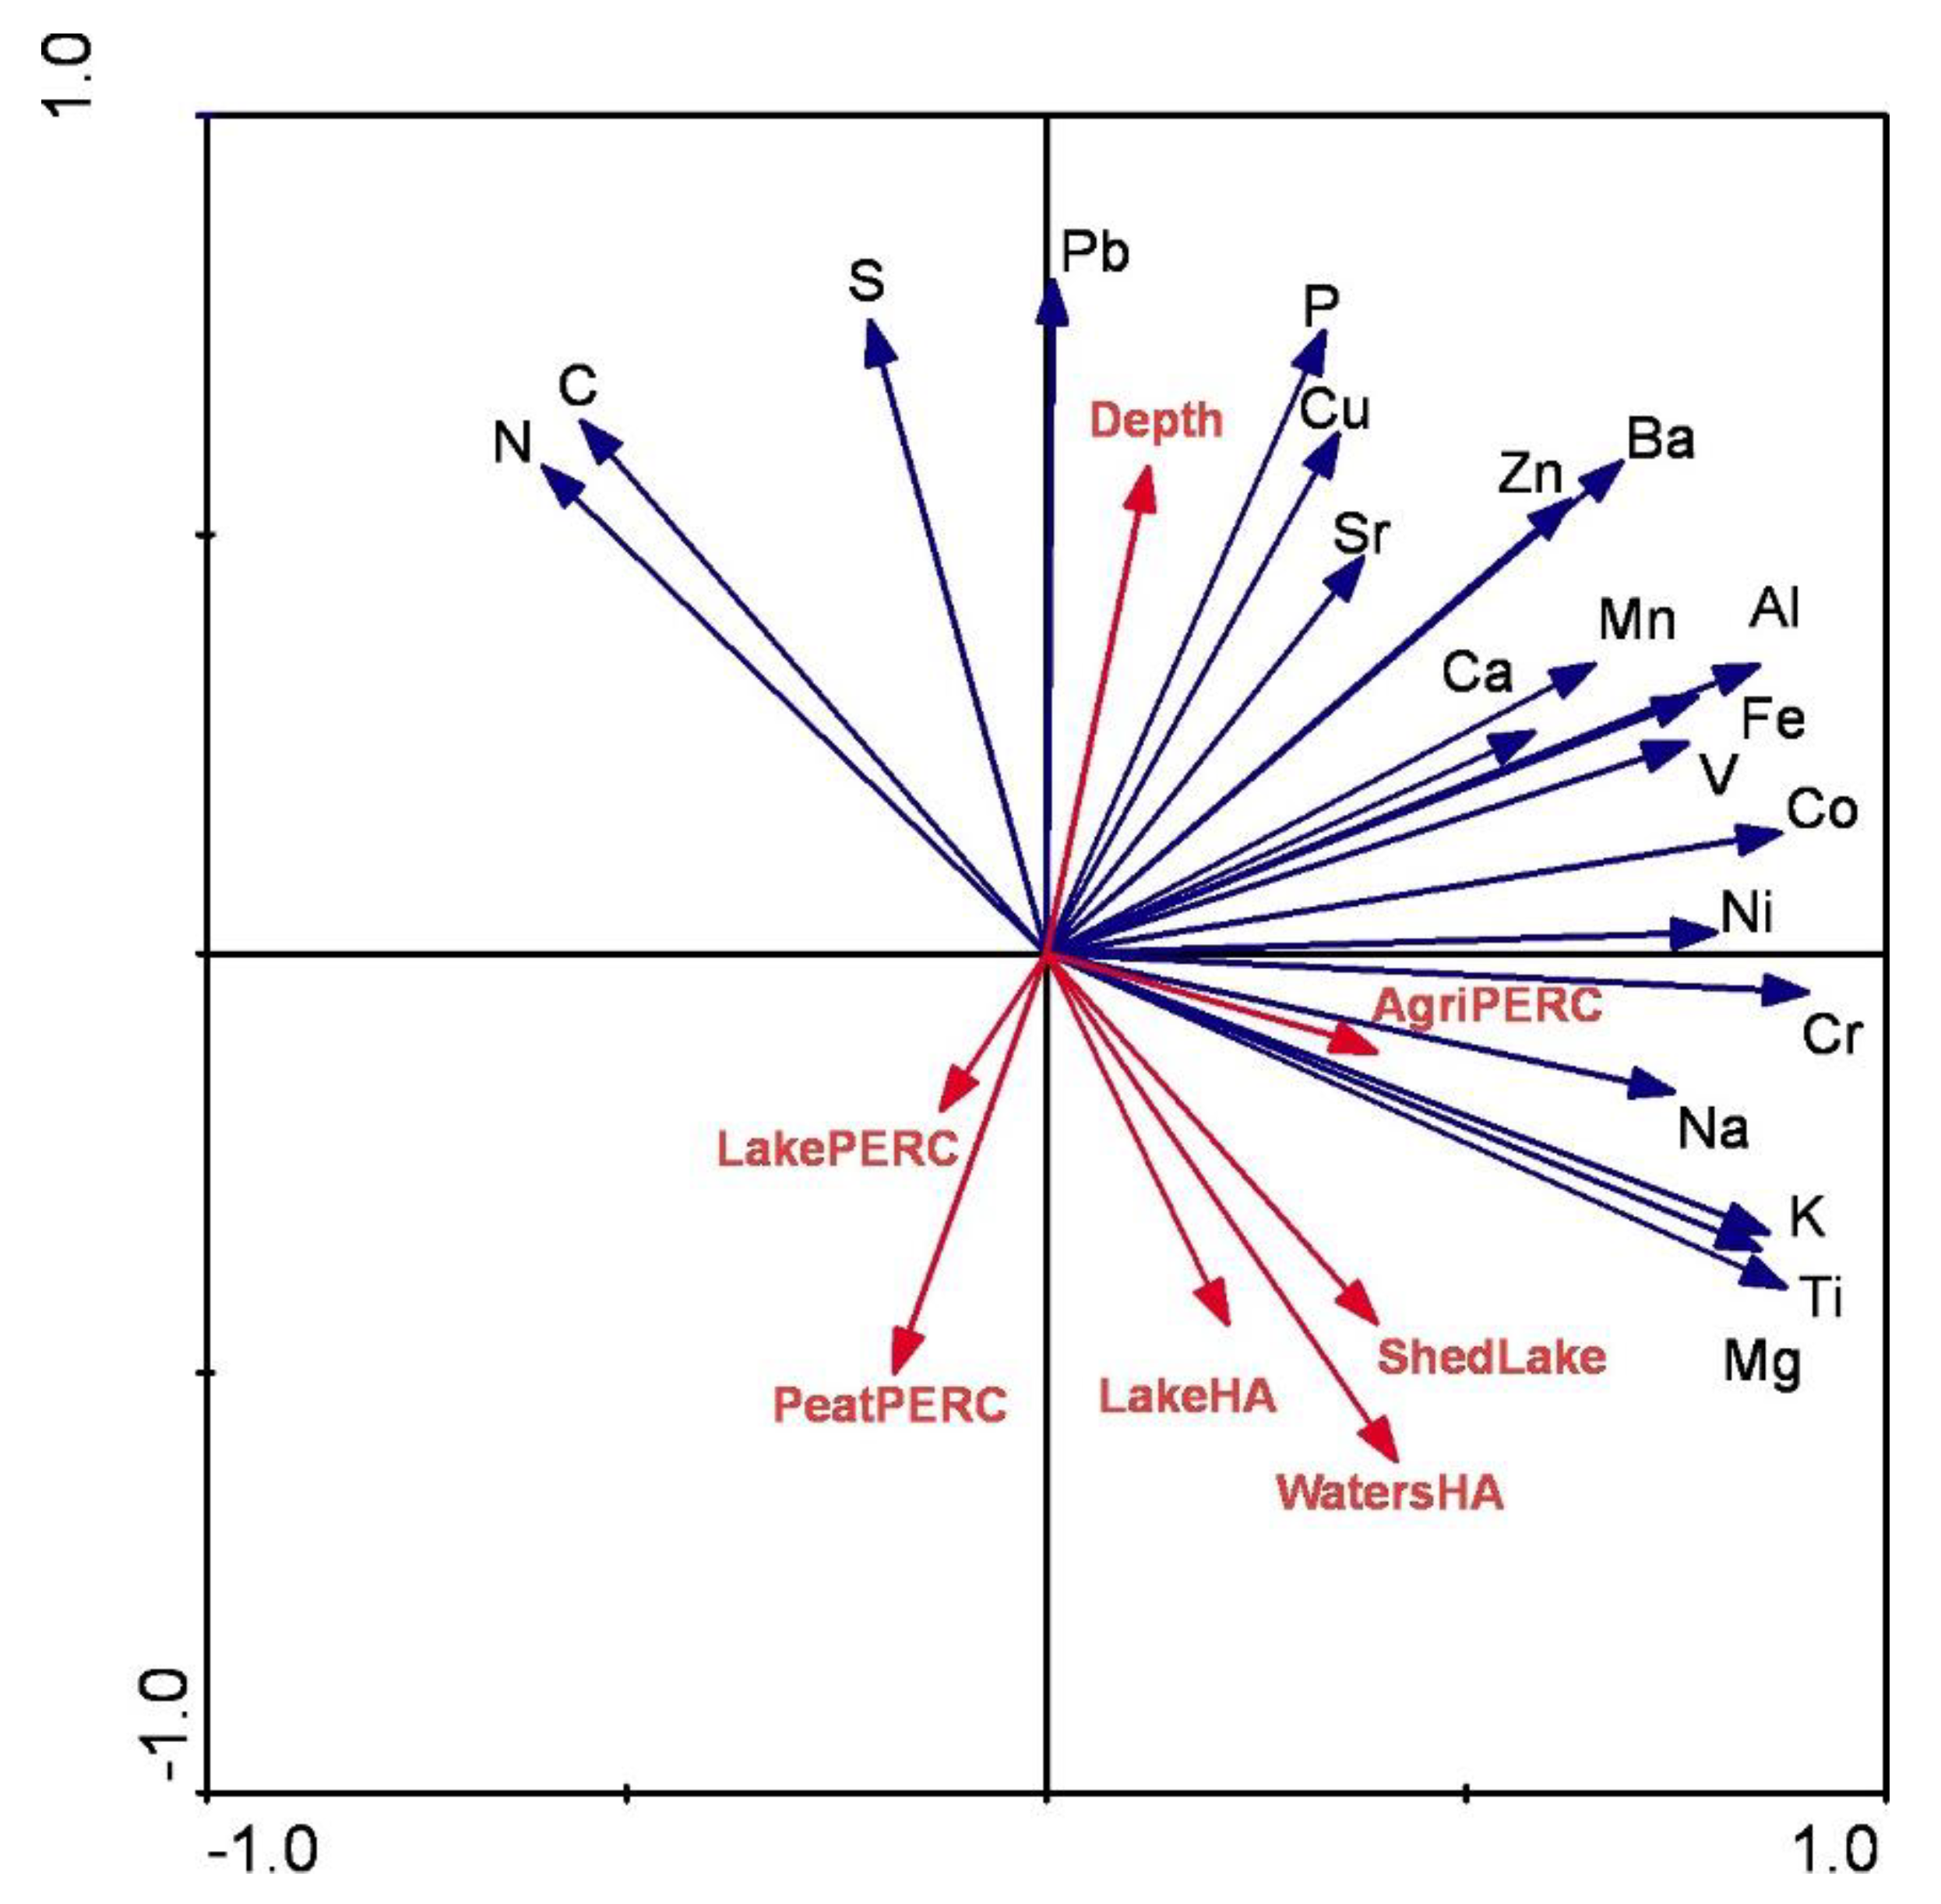
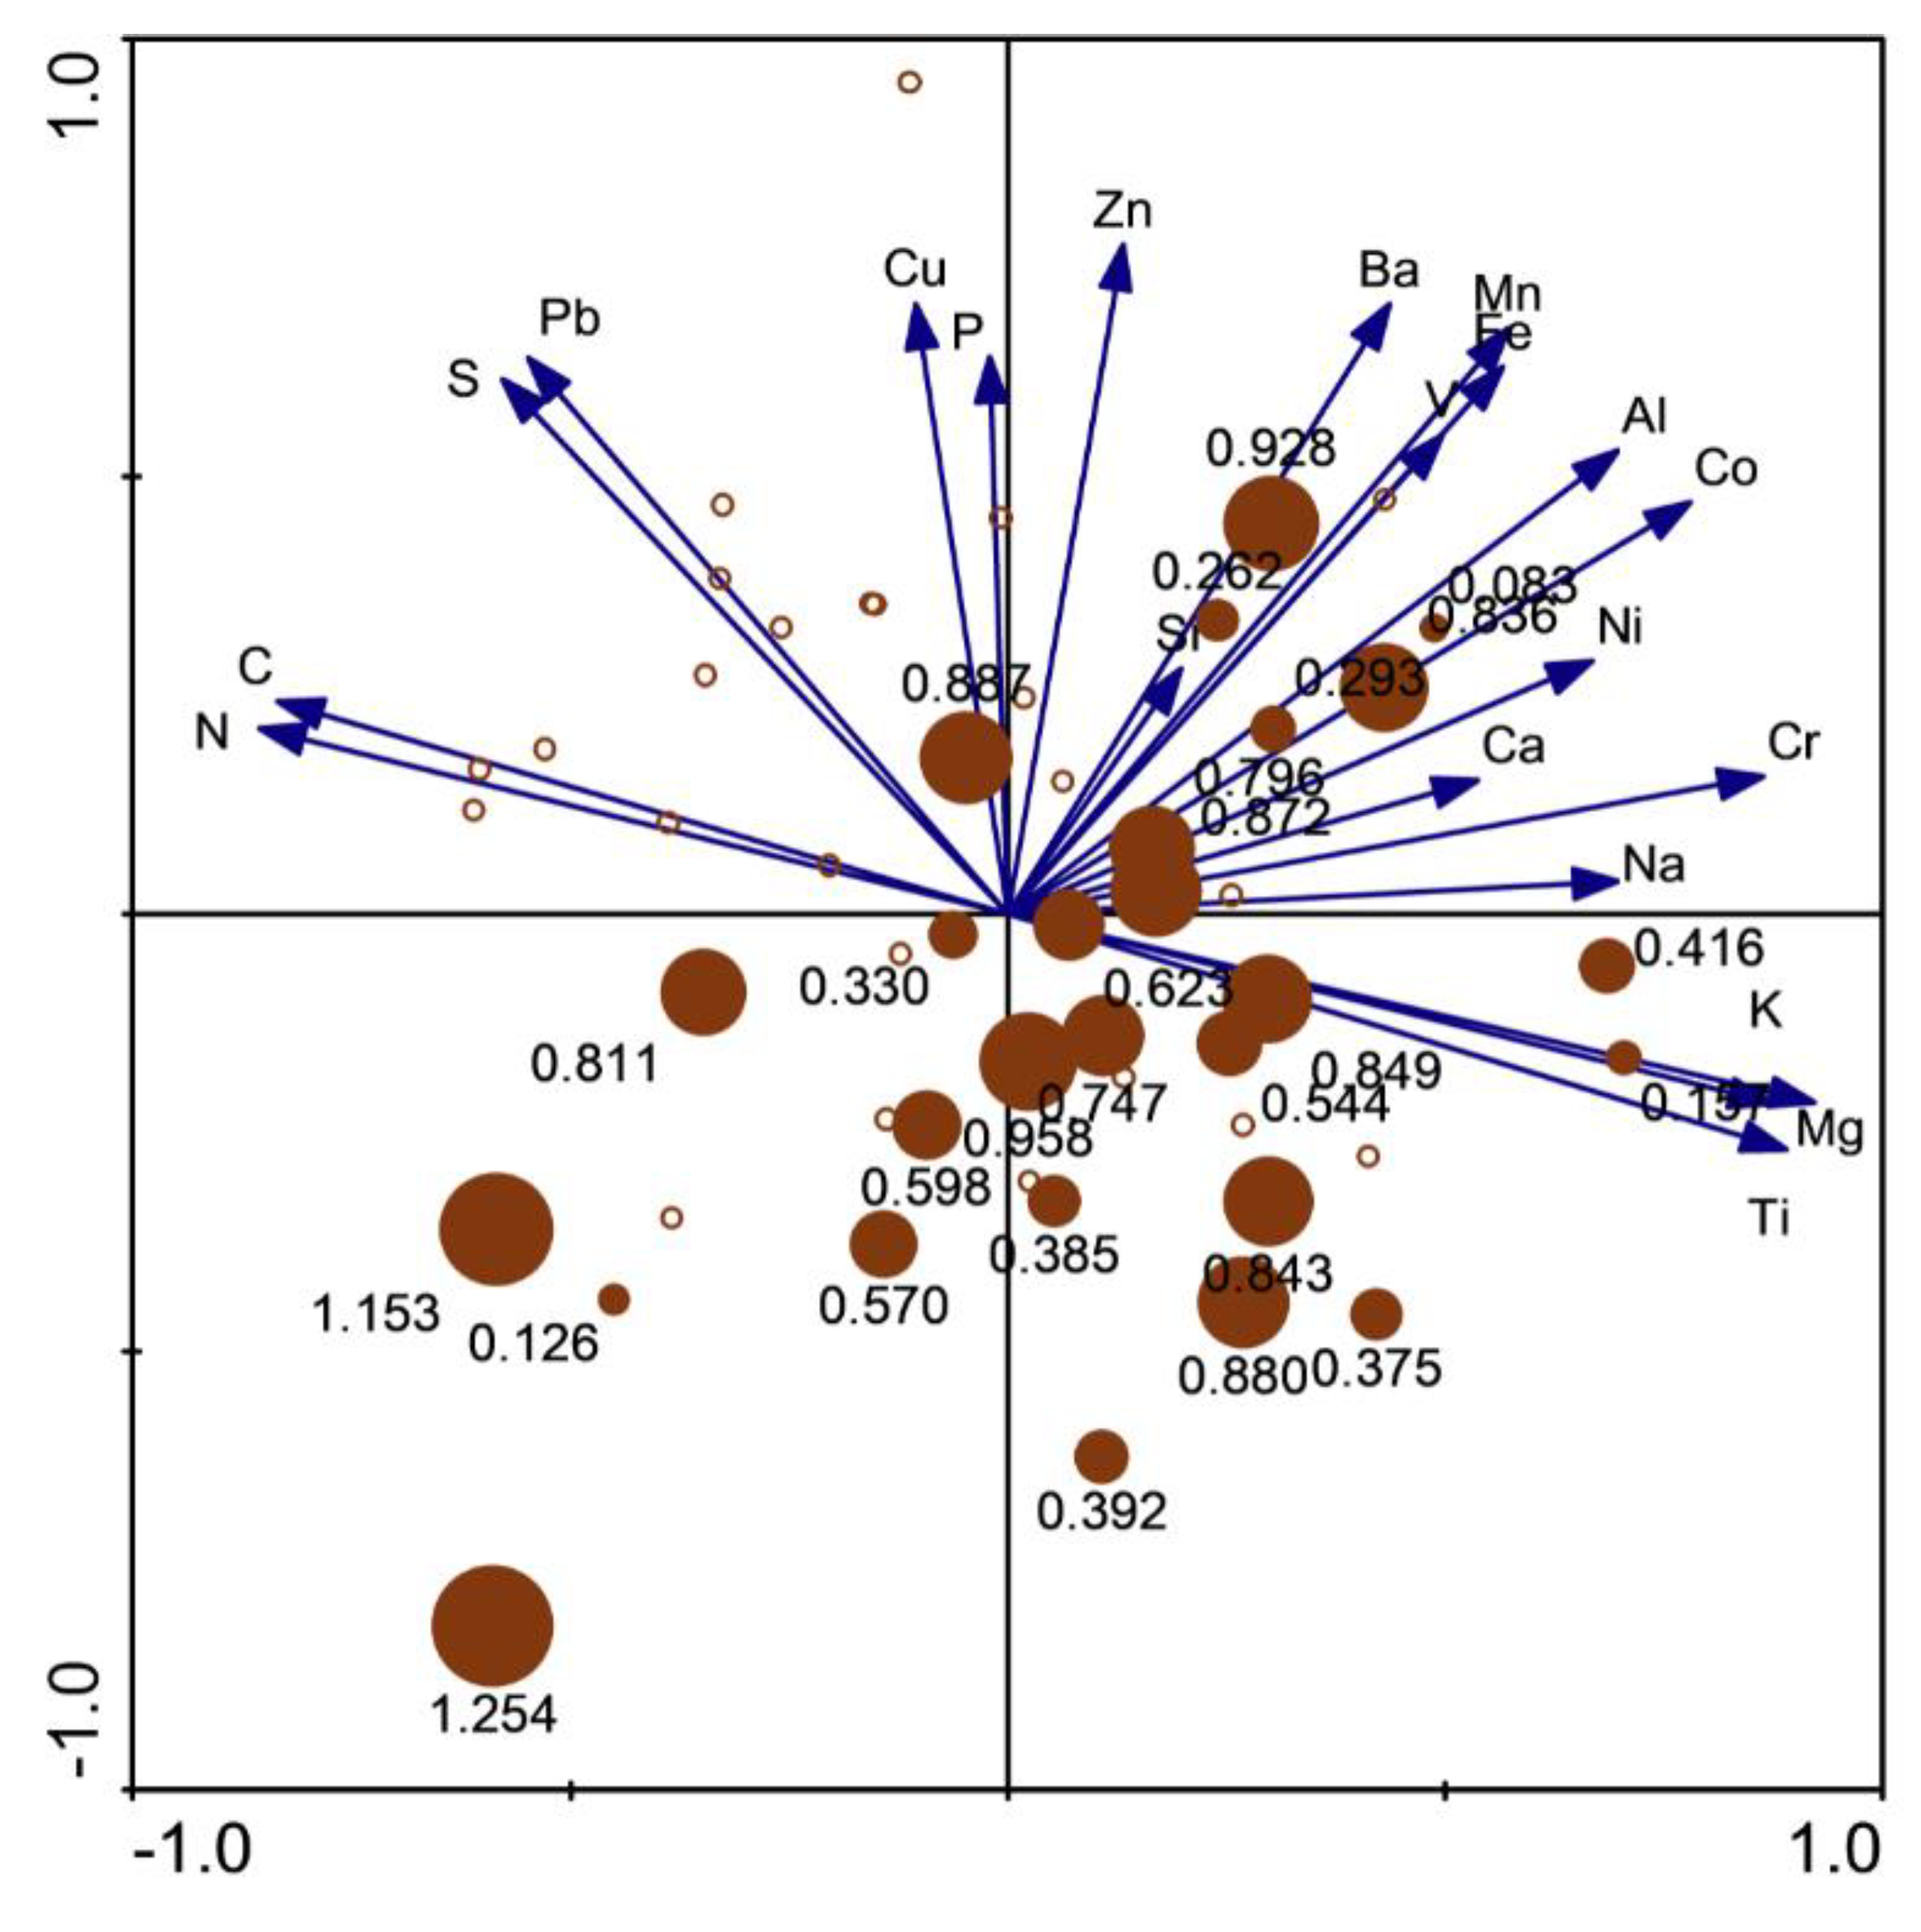
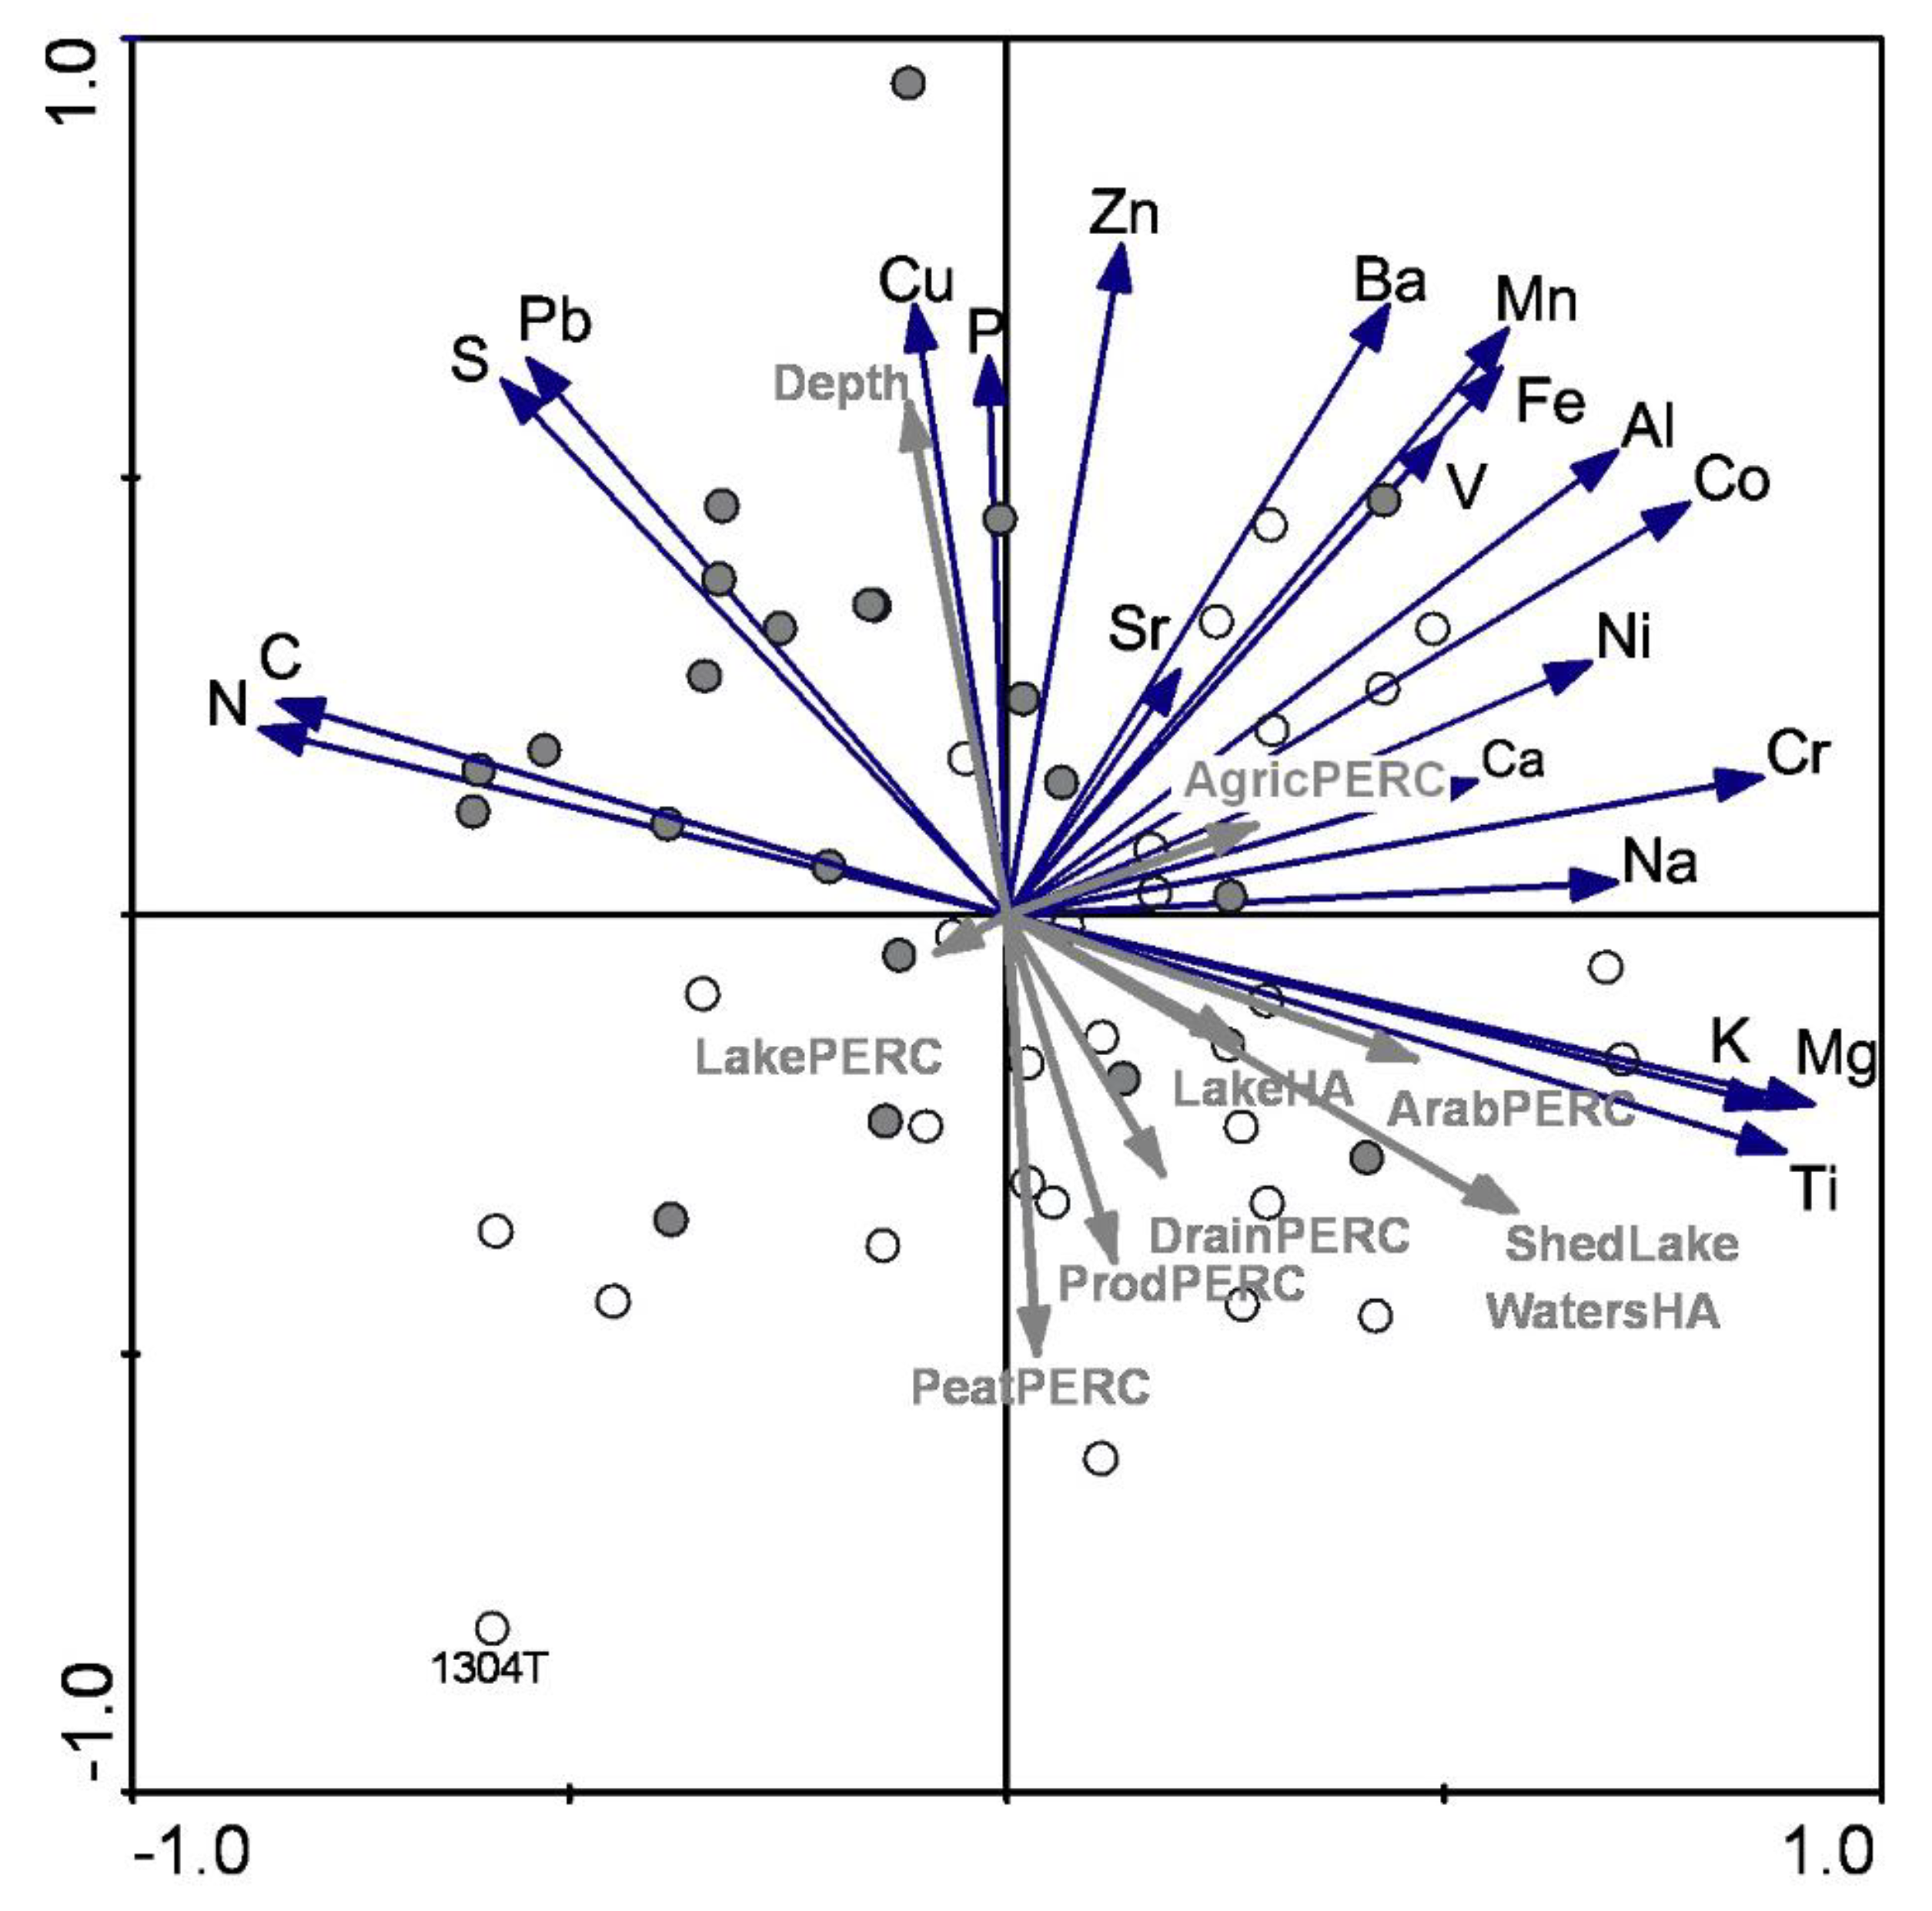
3.3. Sediment Quality vs. Environmental Variables

Ordinations were used to visualize the differences in sediment chemical composition between impacted and reference lakes in both bottom-section and top-section sediments. Linear response-based ordinations were employed due to the short gradients and the likelihood of linear, rather than unimodal, responses of sediment chemistry to disturbances.
A PCA plot of the bottom sediment chemical compositions is shown in Figure 9. Similar to what was found by directly comparing chemical compositions (Table 5), there was a slight difference in sediment quality between the lake groups in the bottom sediments; the impacted lakes plotted in the lower part of the diagram, whereas the reference lakes plotted in the upper left quadrant. However, there is also considerable overlap between the groups.
The first (horizontal) PCA axis captures 48.5% of the variation in sediment chemistry and separates organic (left: C, N, Pb, S, P) from mineral-rich (right: K, Ti, Cr, Na, Mg) sediments. However, there is another gradient that affects the results. Sediments composed of higher concentrations of trace metals and redox-sensitive elements plot in the upper right quadrant and organic-rich lakes plot in the upper part of the diagram. The second PCA axis (vertical axis) captures 22.8% of the variation in sediment chemistries and separates organic samples rich in trace elements (upper quadrants) from mineral rich sediments (lower quadrants). The predisturbance chemistries of lakes that currently receive waters from peat extraction sites are mostly found in the mineral and trace element-rich quadrants of the plot, while most of the high organic content samples are from the reference lakes.
Figure 10 shows the environmental variables that describe the lake basin superimposed on the PCA plot of elemental concentrations in the bottom sediments. The highest correlations with both PCA Axis 1 (horizontal axis) and Axis 2 (vertical axis) were with the size of the catchment (0.42 and −0.60), a variable with high variation in the dataset. Axis 2 was further correlated with depth at the coring site (0.60), the share of peatlands in the catchment (Peatland%; −0.50), catchment to lake ratio (−0.48), and lake size (−0.42). The PCA ordinations thus indicate that bottom sediments from large lakes with large catchments are naturally enriched in mineral matter (K, Ti, Mg) (lower right quadrant). In addition, lakes with high concentrations of trace elements in their sediments are those with a lower than average percentage of peatlands and lake basins in their catchments (upper right quadrant). These lakes are also deep and currently have a higher-than-average percentage of agricultural land in their catchments. For the bottom sediments studied here, the latter variable translates to a high percentage of fine-grained soils suitable for agriculture (although some agriculture was probably present during the deposition of these bottom sediments).
The PCA ordinations were complemented with redundancy analysis (RDA) runs with Monte Carlo permutations to investigate the statistical significance of the influence of the variables. Forward selection (999 unrestricted permutations) identified catchment size, percentage of peatlands, depth, and agricultural land as a subset of variables that captures 46% of the variation in sediment chemistry. All these variables produced a statistically significant redundancy analysis (RDA) axis (at the 5% level) as a single variable, even after accounting for the other variables. However, the effects of peatland percentage and depth were not well separated (Table 6).
PCA ordination of the chemical composition of the upper most (top) sediments of the cores is shown in Figure 11. These upper core sediments were impacted by global change and modern land use, including peat extraction. Changes in the plot from the predisturbance state are fairly small within peat-extraction impacted lakes (dark grey dots); the sediment samples are concentrated more to the lower right quadrant, which is indicative of sediments with high mineral contents (high Ti, K, Mg, Na, Cr). Similarly, the reference lakes (light grey dots) mostly plot in the upper left quadrant where the sediments are enriched in carbon, nitrogen, and related elements. Here again, the environmental variables correlated with PCA Axis 1 variables and are related to mineral-rich sediments, including the size of the watershed (0.58) and the watershed to lake size ratio (a water residence time surrogate variable, 0.55). Water depth at the coring site had the highest correlation with PCA Axis 2 (0.58), followed by the percentage of peatlands in the watershed (−0.51) and peat extraction percentage (−0.45). Large watersheds in the dataset were intensively drained and have a higher than average percentage of peatlands and peat extraction. In contrast, reference lakes have fewer peatlands (and by definition also less peat extraction) in their catchments than impacted lakes, but their sediments are organic-rich (Figure 12).
When studied with RDA (Table 6, lower panel), forward selection identified catchment size, peatland percentage, agricultural percentage, and depth, as a subset of variables that explains the variation in sediment chemical composition in the upper, recently impacted samples. The effects of the variables were mostly independent of the other variables, but the effect of the percentage of peatlands could not be separated from the effect of depth. The extent of peat extraction was not selected in the forward analysis but explained 6.9% of the chemical results at the p = 0.013 level when supplied as the sole explanatory variable. Other factors may mask this relationship: catchment size, depth, peatland, and fine-grained sediment-related trends controlled sediment composition before the upper sediments were affected by the impact of recent land use. However, peat extraction failed to produce statistically significant relationships (at 1% level) with sediment chemistry when catchment size (p = 0.037), peatland percentage (p = 0.150), or depth at the coring site (p = 0.131) were first accounted for.

4. Discussion

4.1. Patterns in Sediment Accumulation and Factors Affecting Accumulation Rates

Sedimentation patterns in both lake groups correspond to those found in small lakes in general. The overall thickness of postglacial sediments in both impacted and reference lakes was typical of sub-Boreal medium- to small-sized lakes in Fennoscandia where post-isolation deposits of lacustrine gyttja are 1–6 m thick (average c. 2 m) (e.g., [20]). Sediment thickness in the studied lakes is thus moderate and compares with other Finnish lakes (e.g., [16,33]). Equally typical in the present study’s lakes is that sedimentation is generally greater in deeper sub-basins (>5 m) and locations that are sheltered by wind and wave activities. Such basins often have the thickest sections of gyttja as shown by Pajunen [20] and Valpola and Ojala [34]. However, in lakes of the presently studied size, dynamic lake bottom zones are often less well developed than in larger lakes, and a majority of the bottom area is characterized by accumulation (e.g., [22]). In some of the studied lakes there were indications that the wind-driven, deep-water currents may have caused minor asymmetric sedimentation (see e.g., [35]), but this was less common than in larger lakes of complex shape.
The acoustic sub-bottom profiles did not reveal any site, location, or lake basin in the impacted or reference lakes with anomalously thick sedimentary deposits that deviated from the normal long-term sedimentation patterns in these types of lake environments (Table 2). Neither was there any indication of marked resuspension or mass transport of sediments that could be related to significant changes in water level, significant hydrological changes, or the exceptional delivery of material from the catchment. These findings suggest that, while land-use practices were likely to affect sediment accumulation in the receiving water bodies, they did not overwhelm the long-term sedimentation patterns in these lakes.
The present results also show that recent (post-1986 Chernobyl accident) sedimentation in both the reference and impacted lakes was of the order of centimeters rather than tens of centimeters. The deepest Chernobyl Cs peak in the cores was found at 16–18 cm. This is a typical sedimentation rate for Finnish lakes as has been shown by earlier studies (e.g., [16,23,32,36]). Anomalously thick sequences of recently accumulated sediments that could have been associated with recent inputs from allochthonous sediment sources were not observed in any of the studied basins. However, the present study only covers sediment cores from a limited number of locations and does not include material that was lost through the outlet before deposition.
Despite the lack of anomalous sediment thicknesses, recent carbon and dry matter accumulation rates were higher in the presently studied lakes than those reported by Kortelainen et al. [33] and Pajunen [20]. Using a set of 122 lakes, Pajunen [20] and Kortelainen et al. [33] calculated an annual average carbon accumulation rate of 0.2 to 8.5 g m−2 a−1 (dry matter 12–50 g m−2 a−1) when considering lakes as carbon pools and sinks in a boreal environment during the Holocene. However, as presented by Pajunen [20], these estimates were computed for wide range of lake types, averaged by their size classes, and importantly, calculated as an average carbon accumulation over the entire lake. These depositional rates are of the same magnitude as global estimates [37]. However, Pajunen [20] shows that if accumulation rates are calculated for a single core extracted from the main accumulation area of the lake (as done in this study), then the annual rates of dry matter and carbon accumulation are typically 5−7 times higher, or about 50–400 and 1–60 g m−2 a−1, respectively. These values are very similar to the annual accumulation rates calculated for the lakes in this study, indicating that sediment fluxes in both the impacted and reference lakes are within the typically observed range (Figure 6, Table 5).
The effect of peat extraction on carbon accumulation can be studied by comparing the rates of carbon accumulation in peat-extracted and reference lakes. The recent rate of carbon accumulation was similar in the impacted and reference lakes, 36 and 35 g m−2 a−1, respectively. The difference was not statistically significant (p = 0.873). Peat extraction thus seemed to exert no significant effect on carbon accumulation. However, the impacted group of lakes included those with very large catchments and catchment size was found to have an effect on sediment composition. Therefore, a trimmed subset of lakes was select with matching catchment sizes. Here again, carbon accumulation was slightly higher in the impacted lakes (31.4 vs. 30.5 g m−2 a−1) of the trimmed subset, but the difference was not statistically significant. The same was true for dry matter accumulation (247 vs. 204 g m−2 a−1). The trimming by catchment size resulted in similar catchment sizes, depths, drainage intensities, and agricultural intensities between the impacted and reference lakes. However, the impacted lakes remained statistically smaller in the trimmed subset (it was the other way around in the full set) and had somewhat more peatlands and less upstream water bodies in their catchments than the reference lakes. These remaining differences should increase accumulation rates in the impacted lakes and are not likely mask the effect of peat extraction on sedimentation in the group-wise comparisons.
Similar to the between-group comparisons, linear correlations, partial linear correlations, and plots of accumulation rates against individual environmental variables did not reveal any clear patterns between the environmental factors and recent (post-1986) dry matter or carbon accumulation rates. Only weak positive correlations were found between the percentage of agricultural land in the basin and carbon accumulation as well as between lake size and accumulation of dry matter. The extent of peat extraction was not statistically correlated with carbon accumulation, even when other environmental variables were accounted for first. Thus, there seems to be no obvious environmental factors to explain the variation in carbon or dry matter accumulation between the lakes.

4.2. Factors Affecting the Chemical Composition Differences

Differences in the chemical composition of upper (recent) sediments and lower (pre-industrial and pre-land-use) sediments showed that the bottom sediments were richer in K, Na, Mg, and Ti but poorer in P, S, and Pb. The vertical distributions of the HNO3-extractable elemental concentrations in the sediment cores changed in all lakes during the past decades, regardless of the lake group. The compositions changed upwards towards more mineral-rich sediments with lower C and N concentrations. Sediments characterized by increased concentrations of Al, Ti, K, Na, and Mg were more pronounced in the impacted lake group. In contrast, concentrations of the redox-sensitive elements, such as Fe, Mn, and Sr increased more in the reference lakes. The change in sediment composition indicates widespread human land-use-influenced lake sediment chemistry in the region. Sediment chemistry was also likely to be affected by global climate and environmental change, which are seen in the sediment sequences regardless of the type of land-use practices that have affected the catchments. In accordance with Kauppila et al. [11], the results also indicate that separating the effects of peat extraction from other land-use practices on sediment composition is difficult, especially when the stressors are often spatially and temporally superimposed. A recent increase in the erosion of mineral matter within the catchment has been frequently described in Finland [38,39,40], using varved lake sediments.
When the changes in sediment composition were studied based on chord distances calculated between the bottom and top results for each lake (data not shown), the average bottom-to-top differences were similar for both lake groups (0.18). At the level of individual lakes, the extent of peat extraction was not significantly correlated with the bottom-to-top change in sediment chemical composition (Pearson r = 0.227, p = 0.466). Here again, the size of the catchment and the lake were correlated with the chemical change (catchment size: r = −0.356, p = 0.009; lake size: r = −0.434, p = 0.001). The relationships are not strong and are negative, i.e., larger watersheds and lakes are associated with a smaller chemical change.
This study shows that peat extraction does not cause organic sedimentation at a scale detectable within the sediment record. Mineral erosion is an indication of human interference by different land uses, and these land uses should be studied in more detail. Ditches in both forested and agricultural areas usually reach the mineral soil, fostering the erosion on fine-grained sediments. In forestry, ditch maintenance is usually done after 40 years [41] and often increases loading of nutrients and sediment (e.g., [42]). The ditched area of peatlands was quite similar in both lake groups but slightly higher in the impacted group in the original data set. The maintenance schedule of ditching was not investigated in this study. The latest studies show that the ditching for forestry has more long-term effects than previously known. The loading of N and P may especially increase several decades after initial drainage [43].

4.3. Factors Affecting Sediment Quality

The study lakes were typically affected by several types of land use, but there were slight differences between the impacted and reference lakes. Intense trenching and draining of lake catchment areas for forestry in Finland generally started around late 1950s when machinery was introduced for the purpose [44]. Approximately 50% of Finnish peatlands are currently drained for forestry, while 32% of mires are in a natural state, about 13% are protected by law; whereas, ~3% are in agricultural use, and less than 1% is used for peat extraction (e.g., [8]). Most catchments of small Finnish lakes are, therefore, affected by multiple land-use practices some of which are spatially and temporally overlapping. These practices are generally independent of catchment size, but in very small catchments, one land use could be superimposed on another. The area of peatlands drained for forestry is typically the largest contributing factor in the catchments of our impacted lake group and agriculture in the reference-group lakes. During this study, only the presence or absence of peat extraction was considered as a selective environmental factor.
Multivariate ordinations based on sediment chemical variables support the observation that average sediments in the two lake groups differed in the pre-impact catchments. This is shown by bottom sediments from the lake cores plotting in different quadrants of the PCA analysis. However, there was considerable overlap between the groups in the pre-impact state especially in the middle of the gradient. The division was mainly between mineral rich and organic rich sediments with the current peat-extraction impacted lakes falling into the mineral-rich group prior to the effects of intensive land use. Indeed, it was the size of the catchment that explained the largest part of the variation (18.3%) in the predisturbance sediment composition in redundancy analysis (RDA) when constrained to a single variable. Other forward-selected variables that explained predisturbance sediment compositions were depth at the coring site (10.1%) and the proportion of peatlands in the catchment (8.0%), followed by the amount of arable land (8.5%). There likely was some agriculture present during the deposition of these lower core sediments, but the arable land variable was based on the modern distribution of this land-use type. However, a surrogate variable for agricultural land use is soil types suitable for agriculture (fine-grained soils) when used to explain predisturbance sediment composition. In contrast to the largely unexplained variation in the accumulation rates, there seems to be factors to explain the differences in sediment chemical composition between the lakes.
The overall differences between the two groups of lakes change little in the recent sediments, despite the drastic geochemical changes from the predisturbance conditions. Sediments in lakes that receive waters from peat extraction sites have not become more organic. In fact, they became less organic-rich, and the division between organic-rich reference lakes and mineral-rich impacted lakes is clearer. The forward-selected environmental variables that explain variations in recent sediment chemistry are statistically similar to predisturbance sediments, catchment size (19.8%), depth at the coring site (10.7%), the share of peatlands (7.3%), and agricultural land (6.9%). Peat extraction areas and their influence cannot be separated from that of the other variables.
We finally note that we have investigated changes in the rate of sediment accumulation and quality and have not measured or systematically monitored limnological or hydrological changes in the studied lakes. We only consider temporal changes in the suspended load and sediment accumulation (sedimentation) and not the potential impacts associated with leaching and the load of dissolved nutrients (P, N) from peatland areas to downstream waters. Such studies of the impacts of peat extraction on water quality—which are often site-specific—have been conducted in several locations around Finland and often indicate that changes in nutrient concentration are related to seasonal runoff characteristics (e.g., [12,45,46]). Interestingly, Daza-Secco et al. [12] did not find any differences in sedimentary testate amoebae communities between the peat-extraction impacted and reference lakes or between the periods prior and after the start of peat extraction. Their main conclusion was that either there are no significant increases in the amount of organic matter influx and accumulation in these lakes, or that dislodged amoeboid protists are retained upstream and do not reach downstream lake basins. The results of the present study are clearly in line with these observations.

5. Conclusions

This study examined 51 lakes that were subdivided into two groups, including lakes impacted by peat extraction and reference lakes that were not affected by peat extraction but were impacted by other land-use activities. The hypothesis was that sediment thickness, recent rates of sedimentation (post 1986), and sediment geochemistry would differ (1) between the two groups of lakes and (2) between upper (post-1986) sediments affected by anthropogenic land-use activities and bottom core sediments that pre-date significant land-use activities. A primary objective was to determine if peat extraction was the main land-use stressor that could explain differences in the sediment chemical assemblages. The results showed that:
  • Sedimentation patterns in both lake groups correspond to those found in small lakes in general; the sediment in the studied lakes was of moderate thickness and was comparable to other Finnish lakes.
  • The acoustic sub-bottom profiles did not reveal any site, location, or basin in the impacted or reference lakes with anomalously thick sediments that deviated from normal long-term sedimentation patterns in these types of lake environments.
  • Recent (post-1986 Chernobyl accident) sedimentation in reference and impacted lakes was consistently of the order of centimeters rather than tens of centimeters.
  • The calculated recent carbon and dry matter annual accumulation rates were similar to other studies, indicating that sediment fluxes in both the impacted and reference lakes were within the typical range.
  • Differences in the chemical compositions of the sediments occurred between the lake groups already during the pre-industrial period and before the signs of intensive land use; however, the vertical distributions of the HNO3-extractable elemental concentrations in the sediment cores showed marked changes in sediment composition in all lakes during the past decades, regardless of the lake group. These changes indicate widespread human land-use influence on lake sediments in the region, which are likely due to global climate and environmental change.
  • Sediment composition between the two groups of lakes only differed a little within the recent sediments of the two lake groups. Sediments in lakes that receive waters from peat extraction sites have not become more organic. That is, organic-rich reference lakes and mineral-rich impacted lakes clearly differed also in the recent sediment layers.
  • Statistically significant relations between the analyzed environmental factors and recent (post-1986) dry matter or carbon accumulation rates were not identified.
Studies with long sediment cores and/or site-specific multicore analyses could be the next phase in the analysis of the lake basins; these studies could include the identification of pre-human land use and environment settings as a starting point accompanied by sediment studies from streams and rivers.

Author Contributions

Conceptualization, T.K. and S.E.V.; formal analysis, T.K., J.M., and A.E.K.O.; investigation, T.V. and J.M.; methodology, T.V., T.K., J.M., A.E.K.O., and S.E.V.; project administration, T.V. and S.E.V.; supervision, A.E.K.O. and S.E.V.; visualization, T.V.; writing—original draft, T.V., T.K., J.M. and A.E.K.O.; writing—review & editing, A.E.K.O. and S.E.V. All authors have read and agreed to the published version of the manuscript.

Funding

This research received no external funding.

Acknowledgments

The authors wish to thank Kari Tiitta, Pekka Forsman, and Kari Savolainen from GTK for the field work activities and Satu Vuoriainen for cesium analyses.

Conflicts of Interest

The authors declare no conflict of interest.

Appendix A

Table A1. Summary of acoustic profiles of the impacted and reference lakes in the present study.
LakeIdTypeAcoustic Quality (Good/Average/Poor)Sediment Thickness <2, 2–4, >4 m
Halmejärvi1310IGood2–4
Hietalampi1402RGood2–4
Eitikka1410RGood2–4
Lintulampi1610RGood2–4
Lehmilampi1305RGood2–4
Haapajärvi1302IGood2–4
Valkeislampi1405RGood2–4
Päsmäri1302IGood2–4
Jänkkärä1311RGood2–4
Iso-Musta1401IGood<2
Moskulanlampi1403RGood<2
Pitkänjärvi1404RGood<2
Kotjonjärvi1404IGood<2
Kangaslampi1401RGood<2
Salahminjärvi1301IAverage>4
Ylemmäinen1405IAverage2–4
Viitalampi1609RAverage2–4
Iso-Pajunen1410IAverage<2
Kolunjärvi1610IAverage<2
Hirvijärvi1402IAverage<2
Tiisijärvi1409RAverage<2
Leväjärvi1609IAverage<2
Patananjärvi1607RAverage<2
Haukilampi1307RAverage<2
Suojärvi1403IAverage<2
Kurranjärvi1605IAverage<2
Viitastenjärvi1606RAverage<2
Valkiaisjärvi1603RAverage<2
Hamarinjärvi1602IAverage<2
Kaitavesi1408IPoor2–4
Ilkonlampi1309IPoor2–4
Levänen1311IPoor<2
Osmanginjärvi1308IPoor<2
Ohenjärvi1309RPoor<2
Saukkojärvi1409IPoor<2
Pieni-Musta1407IPoor<2
Hepojärvi1307IPoor<2
Sanginjärvi1603IPoor<2
Sexsjön1608RPoor<2
Kortejärvi1604RPoor<2
Järvitalonjärvi1605RPoor<2
Leuvanjärvi1606IPoor<2
Narssjön1608IPoor<2
Sääksjärvi1607IPoor<2

Appendix B

Table A2. Quality classification of 137Cs dating, estimates for different sediment age–depth levels, and the rate of deposition for pre- and post-1986 sediments in the studied impacted and reference lakes.
LakeIDTypeQuality of 137Cs AnalysisEstimated Depth (cm) of the AD 1986 Chernobyl 137Cs PeakAverage Rate of Deposition (mm/yr) between 1986 and 2013, 2014, or 2016Estimated Number of Years in the Modern Sample (0-1 cm)Estimated Date (Decade) for the Sediment Depth of 15 cmMaximum 137Cs Concentration (Bq/kg)
Salahminjärvi1301Iaverage103.321970489.89
Päsmäri1302Igood31718601061.44
Jyrkkä 1302Raverage93219701069.44
Sarvijärvi1303I-n/d 156.64
Iso Kiuloinen1303R-n/d 147.03
Joutenjärvi1304Iaverage41.3619001478.78
Kokko-Valkeinen1304Raverage3.51.2618805921.71
Uitamonjärvi1305Igood51.7519303730.08
Lehmilampi1305Rgood51.7519305363.70
Vehkaputti1306Iaverage51.751930780.07
Hepojärvi1307Igood31718603389.62
Haukilampi1307Rgood82.6319607277.04
Osmanginjärvi1308Ipoor3171860284.29
Ilkonlampi1309Iaverage82.6319601767.56
Ohenjärvi1309Raverage62419501300.46
Halmejärvi1310Iaverage72.3419501287.73
Peurajärvi1310Rpoor3171860926.88
Levänen1311Igood62419503872.93
Jänkkärä1311Raverage317186010,381.34
Iso-Musta1401Igood31718608712.19
Kangaslampi1401Rgood41.36190035,531.21
Hirvijärvi1402Ipoor155119851538.62
Hietalampi1402Rgood51.7519304004.22
Suojärvi1403Ipoor41.3619002881.29
Moskulanlampi1403Raverage113.72197511,086.68
Kotjonjärvi1404Iaverage4.51.5519201072.31
Pitkänjärvi1404Rgood41.361900873.82
Ylemmäinen1405I-n/d 1002.03
Pieni-Musta1407Ipoor51.7519301895.74
Saukkojärvi1409Ipoor51.7519301427.64
Tiisjärvi1409Rpoor124219802239.18
Iso-Pajunen1410I-n/d 322.70
Eitikka1410Rgood103.321970483.69
Hamarinjärvi1602Iaverage72.331950271.95
Sanginjärvi1603I-n/d 229.18
Valkiaisjärvi1603Rpoor154.721985397.81
Kortejärvi1604R-n/d 48.4
Kurranjärvi1605Igood41.361900186.33
Järvitalonjärvi1605R-n/d 95.76
Leuvanjärvi1606Iaverage51.751930120.28
Viitastenjärvi1606Raverage3171870292.23
Sääksjärvi1607Iaverage51.7519201145.29
Patananjärvi1607Raverage82.6319601941.82
Narssjön1608Iaverage72.3319501469.29
Sexsjön1608Raverage72.3319501584.57
Leväjärvi1609Iaverage113.7219751112.30
Viitalampi1609Rpoor175.3219901838.07
Kolunjärvi1610Igood62419502089.38
Lintulampi1610Rgood51.75193012,762.43

Appendix C

Table A3. Summary table of Euclidean distances (p-values) between the bottom–top pairs calculated based on log-transformed chemical data presenting the overall chemical change and the summary table of Spearman’s rank order correlations presenting the bottom-to-top changes in individual elements (change in concentration relative to bottom concentration) related to the environmental variables (depth at coring point, drained peatlands (proportion of the catchment area), peatland (proportion of the catchment area), peat extraction (proportion of the catchment area), lake proportion (proportion of the catchment area), agriculture (proportion of the catchment area), watershed area (ha), lake area (ha), and watershed: lake ratio).
p-Values
Depth at coring pointDrained peatlandPeatlandPeat extracti-onLake propor-tionAgricul-tureWatershedLake areaWatershed: lake ratio
Al 0.968310.151570.856260.517040.0198770.34970.435770.0321180.33276
Ba 0.0482260.957940.442870.0429540.821950.214590.668340.985830.53519
Ca 0.0112760.759830.0093070.0042790.0977660.521030.0426990.029550.37666
Co 0.563980.267360.777210.569080.9880.107330.268850.403270.73112
Cr 0.89990.202770.826210.738790.283210.0172730.177170.0451460.77098
Cu 0.874990.783540.299810.980080.258610.172160.536750.361920.052014
Fe 0.188880.312460.21850.889470.697110.95840.0809740.238480.26194
K 0.403580.0685960.863240.0937540.787460.0050910.286930.163570.81411
Mg 0.473850.0786570.916240.152120.554370.0023020.376310.296370.83622
Mn 0.700080.119690.511510.693330.0441380.723080.810650.0529170.27623
Na 0.268220.110110.931260.0503680.92420.230310.458570.276740.86071
Ni 0.652480.0958910.851090.644580.733220.0139710.636440.524460.85441
P 0.291930.278330.0019320.484220.752050.148210.267840.437460.70878
Pb 0.585350.744580.230120.710322.06 × 10−50.0045430.915570.0449830.016727
S 0.258480.752410.549090.483840.844540.351370.34020.903530.15435
Sr 0.0245520.848570.0169410.0042650.337460.739230.0619610.108230.32114
Ti 0.172730.287220.774580.0762680.998620.0630480.721360.348180.35922
V 0.982390.706660.66410.865740.144050.841480.0221190.0110240.35877
Zn 0.918640.348560.741610.233760.293350.0558730.177360.947690.046081
N 0.637050.0639660.515230.569490.628350.407590.152460.0442720.83219
C 0.433430.247950.145630.676710.129250.532450.0035210.0014660.34421
EUCL0.532660.486720.891240.15360.43890.0539620.225110.453720.38826
Spearman’s Rank Order Correlations
Al −0.00570.199750.0254850.090982−0.31906−0.13103−0.10934−0.294810.13566
Ba −0.27802−0.007420.107670.279140.031658−0.173310.0602320.00250.087092
Ca −0.352120.0429980.354010.386270.22986−0.090120.279470.299160.12392
Co −0.08270.15513−0.03980.0799970.002116−0.22371−0.15465−0.1172−0.04833
Cr 0.0180610.1778−0.030890.046897−0.15015−0.32582−0.1882−0.276380.040944
Cu −0.022590.0386420.145130.0035130.15796−0.19036−0.086760.12777−0.26837
Fe −0.18699−0.14142−0.171860.0195550.054729−0.00734−0.2419−0.16474−0.15688
K −0.11950.25210.0242350.232580.037924−0.37933−0.14901−0.194170.033078
Mg −0.102570.243710.0147990.199480.08305−0.40991−0.12401−0.146150.029084
Mn 0.055269−0.21636−0.09218−0.055450.277630.0498320.0337040.26739−0.15232
Na −0.157980.222010.0121380.270210.013387−0.1676−0.10402−0.152160.024687
Ni 0.0645940.23112−0.026410.064844−0.04793−0.33577−0.06644−0.089380.025817
P −0.15046−0.151660.416310.098197−0.044440.201370.154980.108940.052521
Pb −0.07822−0.045820.16767−0.052230.54913−0.38389−0.014920.27658−0.32735
S 0.16119−0.04437−0.08416−0.098280.027589−0.13057−0.13361−0.01705−0.19843
Sr −0.314590.0268640.326750.38640.13436−0.046810.258180.223160.13893
Ti −0.193920.148920.0402840.24562−0.00024−0.25715−0.05015−0.131440.12848
V −0.00317−0.05292−0.06105−0.02379−0.203410.028138−0.31382−0.34653−0.1286
Zn −0.01467−0.131330.046373−0.166380.14706−0.26425−0.18811−0.00923−0.27523
N −0.06767−0.256290.091375−0.079910.0680350.116140.199320.27747−0.02981
C −0.11212−0.16150.202630.0586220.21106−0.087680.393890.426120.13251
EUCL−0.09230.100660.0198370.204830.11196−0.27422−0.17465−0.10838−0.12469

References

  1. Shukla, P.R.; Skea, J.; Buendia, E.C.; Masson-Delmotte, V.; Pörtner, H.-O.; Roberts, D.C.; Zhai, P.; Slade, R.; Connors, S.; van Diemen, R.; et al. Climate Change and Land: An IPCC Special Report on Climate Change, Desertification, Land Degradation, Sustainable Land Management, Food Security, and Greenhouse Gas Fluxes in Terrestrial Ecosystems. 2019. Available online: https://www.ipcc.ch/srccl/ (accessed on 12 August 2019).
  2. Limpens, J.; Berendse, F.; Blodau, C.; Canadell, J.G.; Freeman, C.; Holden, J.; Roulet, N.; Rydin, H.; Schaepman-Strub, G. Peatlands and the carbon cycle: From local processes to global implications—A synthesis. Biogeosciences 2008, 5, 1475–1491. [Google Scholar] [CrossRef] [Green Version]
  3. Väliranta, M.; Lohila, A.; Minkkinen, K.; Ojanen, P.; Sannel, B. Soiden ja turpeen taloudellinen hyödyntäminen ja käyttömuotojen aiheuttama säteilypakote. Geologi 2019, 71, 141–146. (In Finnish) [Google Scholar]
  4. Roberts, N.; Fyfe, R.M.; Woodbridge, J.; Gaillard, M.-J.; Davis, B.A.S.; Kaplan, J.O.; Marquer, R.; Mazier, F.; Nielsen, A.B.; Sugita, S.; et al. Europe’s lost forests: A pollen-based synthesis for the last 11,000 years. Sci. Rep. 2018, 8, 716. [Google Scholar] [CrossRef] [PubMed]
  5. Stephens, L. ArchaeoGLOBE Project. Archaeological assessment reveals Earth’s early transformation through land use. Science 2019, 365, 897–902. [Google Scholar] [CrossRef] [PubMed] [Green Version]
  6. Jenny, J.-P.; Koirala, S.; Gregoy-Eaves, I.; Francus, P.; Niemann, C.; Ahrens, B.; Jung, M.; Brovkin, V.; Baud, A.; Ojala, A.E.K.; et al. Human and climate influences on global sediment transfers during the past 10,000 years. Proc. Natl. Acad. Sci. USA 2019, 116, 22972–22976. [Google Scholar] [CrossRef] [PubMed] [Green Version]
  7. Cris, R.; Buckmaster, S.; Bain, C.; Reed, M.S. Global Peatland Restoration Demonstrating Success; IUCN UK National Committee Peatland Programme: Edinburgh, UK, 2014; p. 35. ISBN 978-0-9570572-3-4. [Google Scholar]
  8. Turunen, J. Development of Finnish Peatland area and carbon storage 1950–2000. Boreal Environ. Res. 2008, 13, 319–334. [Google Scholar]
  9. Clarke, D.; Rieley, J.O. Strategy for Responsible Peatland Management, 6th ed.; International Peatland Society: Jyväskylä, Finland, 2019; p. 35. [Google Scholar]
  10. Kondelin, H. Environmental impacts of mire utilization. In Finland—The Land of Mires; Lindholm, T., Heikkilä, R., Eds.; Finnish Environment: Helsinki, Finland, 2006; pp. 193–204. [Google Scholar]
  11. Kauppila, T.; Ahokas, T.; Nikolajev-Wikström, L.; Mäkinen, J.; Tammelin, M.H.; Meriläinen, J.J. Aquatic effects of peat extratcion and peatland forest drainage: A comparative sediment study of two adjanced lakes in Central Finland. Environ. Earth Sci. 2016, 75, 1–18. [Google Scholar] [CrossRef] [Green Version]
  12. Daza-Secco, E.; Haimi, J.; Vähäkuopus, T.; Ojala, A.E.K.; Valpola, S.; Meissner, K. Testate amoebae as a potential tracer of organic matter dislodged from peat extraction areas. Use of testaceans to trace matter from peatlands to lakes. Boreal Environ. Res. 2020, 25, 19–37. [Google Scholar]
  13. National Land Survey of Finland (NLS) Base Map Database. Available online: https://tiedostopalvelu.maanmittauslaitos.fi/tp/kartta?lang=en (accessed on 1 January 2013).
  14. Finnish Catchment Data. Finnish Environmental Institute (SYKE) Open Information. https://www.syke.fi/openinformation. metadata. Available online: http://geoportal.ymparisto.fi/meta/julkinen/dokumentit/catchment_areas.pdf (accessed on 1 January 2012).
  15. AVI Lupa-Information Service. Available online: https://tietopalvelu.ahtp.fi/Lupa/ (accessed on 1 May 2018).
  16. VALUE-Catchment Delineation Tool. Finnish Environmental Institute (SYKE). Available online: http://paikkatieto.ymparisto.fi/value/ (accessed on 1 January 2018).
  17. Corine Land Cover 2018. Finnish Environmental Institute (SYKE) Open Information. https://www.syke.fi/openinformation. metadata. Available online: http://geoportal.ymparisto.fi/meta/julkinen/dokumentit/CorineLandCover2018_en.pdf (accessed on 1 January 2018).
  18. Hertta Service, Finnish Environment Institute Environmental Data. Available online: Syke.fi/avointieto (accessed on 1 January 2016).
  19. Peatland Boundaries–Dataset of Geological Survey of Finland; (internal use); Geological Survey of Finland: Espoo, Finland, 2018.
  20. Pajunen, H. Järvisedimentit kuiva-aineen ja hiilen varastona. Tutk. Rep. Investig. 2004, 160, 308. (In Finnish) [Google Scholar]
  21. Mäkinen, J.; Pajunen, H. Correlation of carbon with acid-soluble elements in Finnish lake sediments: Two opposite composition trends. Geochem. Explor. Environ. Anal. 2005, 5, 169–181. [Google Scholar] [CrossRef]
  22. Håkanson, L.; Jansson, M. Principles of Lake Sedimentology; Springer: Berlin, Germany, 1983; p. 316. [Google Scholar]
  23. Kansanen, P.H.; Jaakkola, T.; Kulmala, S.; Suutarinen, R. Sedimentation and distribution of gamma-emitting radionuclides in bottom sediments of southern Lake Päijänne Finland, after the Chernobyl accident. Hydrobiologia 1991, 222, 121–140. [Google Scholar] [CrossRef]
  24. Appleby, P.G. Radiometric dating of sediment records in European mountain lakes. J. Limnol. 2000, 59, 1–14. [Google Scholar] [CrossRef]
  25. Wright, S.M.; Howard, B.J.; Strand, P.; Nylén, T.; Sickel, M.A.K. Prediction of Cs-137 deposition from atmospheric nuclear weapons tests within the Arctic. Environ. Pollut. 1999, 104, 131–143. [Google Scholar] [CrossRef]
  26. Klaminder, J.; Appleby, P.; Crook, P.; Renberg, I. Post-deposition diffusion of 137Csin lake sediment: Implications for radiocaesium dating. Sedimentology 2012, 59, 2259–2267. [Google Scholar] [CrossRef]
  27. Ojala, A.E.K.; Luoto, T.P.; Virtasalo, J.J. Establishing a high-resolution surface sediment chronology with multiple dating methods–testing 137Cs determination with Nurmijärvi clastic-biogenic varves. Quat. Geochronol. 2017, 37, 32–41. [Google Scholar] [CrossRef]
  28. Ojala, A.E.K.; Francus, P.; Zolitschka, B.; Besonen, M.; Lamoureux, S. Characteristis of sedimentary varve chronologies–A review. Quat. Sci. Rev. 2012, 43, 45–60. [Google Scholar] [CrossRef]
  29. Zolitschka, B.; Francus, P.; Ojala, A.E.K.; Schimmelmann, A. Varves in lake sediments—A review. Quat. Sci. Rev. 2015, 117, 1–41. [Google Scholar] [CrossRef]
  30. Hammer, Ø.; Harper, D.A.T.; Ryan, P.D. PAST: Paleontological statistics software package for education and data analysis. Palaeontol. Electron. 2001, 4, 1–9. [Google Scholar]
  31. Ter Braak, C.J.; Šmilauer, P. CANOCO Reference Manual and CanoDraw for Windows User’s Guide: Software for Canonical Community Ordination (Version 4.5); Microcomputer Power: Ithaca, NY, USA, 2002. [Google Scholar]
  32. Ilus, E.; Saxén, R. Accumulation of Chernobyl-derived 137Cs in bottom sediments of some Finnish lakes. J. Environ. Radioact. 2005, 82, 199–221. [Google Scholar] [CrossRef]
  33. Kortelainen, P.; Pajunen, H.; Rantakari, M.; Saarnisto, M. A large carbon pool and small sink in boreal Holocene lake sediments. Glob. Chang. Biol. 2004, 10, 1648–1653. [Google Scholar] [CrossRef]
  34. Valpola, S.E.; Ojala, A.E.K. Post-glacial sedimentation rate and patterns in six lakes of the Kokemäenjoki upper watercourse, Finland. Boreal Environ. Res. 2006, 11, 195–211. [Google Scholar]
  35. Mäkinen, J.; Ojala, A. Sedimentation dynamics and metal loading in Lake Pyhajarvi, Finland. J. Paleolimnol. 2013, 50, 1–13. [Google Scholar] [CrossRef]
  36. Laamanen, L.; Mäkinen, J.; Koivuhuhta, A.; Nilivaara-Koskela, R.; Karppinen, A.; Hellsten, S. Kaivosvesiä vastaanottavien vesistöjen hallinta ja kunnostaminen. KaiHali-hankkeen loppuraportti. Suomen Ympäristökeskuksen Raportteja 2019, 38, 194. [Google Scholar]
  37. Mendonca, R.; Müller, R.A.; Clow, D.; Verpoorter, C.; Raymond, P.; Tranvik, L.J.; Sobek, S. Organic carbon burial in global lakes and reservoirs. Nat. Commun. 2017, 8, 1694. [Google Scholar] [CrossRef] [PubMed] [Green Version]
  38. Tiljander, M.; Saarnisto, M.; Ojala, A.E.K.; Saarinen, T. A 3000-year palaeoenvironmental record from annually laminated sediment of Lake Korttajärvi, central Finland. Boreas 2003, 26, 566–577. [Google Scholar] [CrossRef]
  39. Ojala, A.E.K.; Alenius, T. 10,000 years of interannual sedimentation recorded in the Lake Nautajärvi (Finland) clastic-organic varves. Palaeogeogr. Palaeoclimatol. Palaeoecol. 2005, 219, 285–302. [Google Scholar] [CrossRef]
  40. Saarni, S.; Muschitiello, F.; Weege, S.; Brauer, A.; Saarinen, T. A late Holocene record of solar-forced atmospheric blocking variability over Northern Europe inferred from varved lake sediments of Lake Kuninkaisenlampi. Quat. Sci. Rev. 2016, 154, 100–110. [Google Scholar] [CrossRef]
  41. Minkkinen, K. Effects of Forestry Drainage on the Carbon Balance and Radiative Forcing of Peatlands in Finland; Department of Forest Ecology, University of Helsinki: Helsinki, Finland, 1999; p. 42. [Google Scholar]
  42. Kenttämies, K. Tilanne ja tavoitteet metsätalouden vesistökuormituksen vähentämiseksi. Metsäntutkimuslaitoksen Tied. 2003, 886, 9–16. (In Finnish) [Google Scholar]
  43. Nieminen, M.; Sallantaus, T.; Ukonmaanaho, L.; Nieminen, T.M.; Sarkkola, S. Nitrogen and phosporous concentrations in discharge from drained peatland forests are increasing. Sci. Total Environ. 2017, 609, 974–981. [Google Scholar] [CrossRef]
  44. Päivänen, J. Suot Ja Suometsät–Järkevän Käytön Perusteet; Metsäkustannus Oy: Hämeenlinna, Finland, 2007; p. 368. (In Finnish) [Google Scholar]
  45. Kløve, B. Characteristics of nitrogen and phosphorus loads in peat mining wastewater. Water Res. 2001, 35, 2353–2362. [Google Scholar]
  46. Puustinen, M.; Koskiaho, J.; Peltonen, K. Influence of cultivation methods on suspended solids and phosphorus concentrations in surface runoff on clayey sloped fields in boreal climate. Agric. Ecosyst. Environ. 2005, 105, 565–579. [Google Scholar] [CrossRef]
Figure 1. Spatial distribution of the originally selected 62 study lakes.
Geosciences 10 00313 g001
Figure 2. The boundaries and comparison of the 3rd level catchment area (purple line) and the lake upper catchment area (blue and orange raster). The 3rd level catchment area data are open-access, ready-to-use data [14], and the lake upper catchment areas was modelled with the VALUE-catchment delineament tool [16].
Geosciences 10 00313 g002
Figure 3. The accumulation rates were studied from the post-1986 sediment sections of the cores (left panel), whereas the top–bottom sediment sections were defined independently of the dating results based on the changes in element composition alone (right panel). (A,B) presents examples for impacted lake ((A), Lake Levänen) and reference lake ((B), Lake Lehmilampi).
Geosciences 10 00313 g003
Figure 4. Example of an echo sounding profile and interpretation from Lake Halmejärvi (ID 1310 impacted).
Geosciences 10 00313 g004
Figure 5. Cesium (137Cs) profiles of the studied lake sequences with black curves representing impact lakes and red curves representing reference lakes. Stars indicate the depth of Chernobyl-derived cesium fallout with different dating quality classifications. All concentration are expressed as Bq kg−1.
Geosciences 10 00313 g005
Figure 6. The average dry matter content in relation to average carbon content in the presently studied lake sediments compared with a dataset of lake sequences (area < 10 km2, sediment depth 0–30 cm, n = 570) from Finland [20].
Geosciences 10 00313 g006
Figure 7. Annual average carbon and dry matter accumulation rates for the post-1986 period in the impacted and reference lakes.
Geosciences 10 00313 g007
Figure 8. Carbon accumulation rates for the post-1986 period (g m−2 a−1) compared to four environmental variables, with (a) peat extraction area (%), (b) catchment area (ha), (c) ditched peatland area (%), and (d) water depth at coring site.
Geosciences 10 00313 g008
Figure 9. PCA plot of predisturbance (bottom) samples and chemical components results; log10 transformation used.
Geosciences 10 00313 g009
Figure 10. PCA plot of predisturbance (bottom) samples, chemical component results, and environmental variables (log10 transformation was used). In the predisturbance state, agricultural land use acts as a surrogate variable for fine-grained soils suitable for agriculture.
Geosciences 10 00313 g010
Figure 11. PCA plot of the top (recent, human-impacted) samples, showing the peat extraction percentages. Reference lakes (no peat extraction) concentrate in the upper left quadrant of high organic content.
Geosciences 10 00313 g011
Figure 12. Sediment chemistry-based PCA plot of top (recent, human-impacted) samples, element concentrations, and environmental variables. Filled circles = reference lakes.
Geosciences 10 00313 g012
Table 1. The summary of land-use properties of catchment areas for all lakes (impacted n = 29, reference n = 22) and for the trimmed subset (impacted n = 9, reference n = 10).
Catchment and Lake Properties Peatland Data, % per Catchment AreaCLC Data, % per Catchment Area
Catchment area (ha)Lake area (ha)Max depth mAverage depth mWater depth at coring sitePeatland %Ditched peatland %Peat extraction %Agricultural areas %Water bodies %
ALL LAKES
Impacted (n = 29)
Avg16,8311317.02.44.33386445
Median3548584.01.93.03388314
Min28431.40.60.915560.200
Max146,88552936.17.322.058100171615
Reference (n = 22)
Avg779738.63.67.319620711
Median277289.13.47.21279027
Min3471.41.50.500000
Max552117015.66.220.86410006649
TRIMMED SUBSET
Impacted (n = 9)
Avg1195356.32.74.73391835
Median1284244.22.23.03191713
Min28482.20.91.0167910.00
Max26837911.55.011.556100171615
Reference (n = 10)
Avg9031038.53.55.920870313
Median8621269.13.46.617920210
Min19171.81.51.3257000
Max197617015.66.210.04310001130
p (same mean)0.4250.008 0.5050.0610.370n/a0.9010.063
p (same median)0.4380.037 0.4870.0660.713n/a0.7670.093
Table 2. Average post-1986 accumulation rates of certain elements in the impacted and reference lakes (n = 44 lakes). Elements at the top of the table accumulate more rapidly in the reference lakes, while those at the bottom of the table accumulate more rapidly in impacted lakes.
Accumulation Rate g m−2 a−1
Impacted lakesReference lakesRatio Impacted: Reference
Pb0.0040.0080.55
S0.6220.8380.74
N2.4062.8090.86
C35360.98
Zn0.0270.0261.07
Cu0.0050.0051.10
P0.3610.2651.36
Co0.0040.0021.60
Al5.1113.1181.64
Ni0.0060.0041.64
Mn0.2010.1221.65
Fe9.7465.5931.74
DM3521971.79
Sr0.0110.0061.79
V0.0150.0081.79
Ba0.0380.0211.83
Cr0.0110.0052.12
Ca1.7500.8022.18
Na0.1000.0432.33
K0.7520.2503.01
Mg1.6880.5043.35
Ti0.4640.1363.41
Table 3. Linear (Pearson) correlations of environmental variables with carbon and dry matter accumulation for all lakes and for the trimmed subset.
C g m−2 a−1DM g m−2 a−1
All Lakes (43)Trimmed Subset Lakes (19)All Lakes (43)Trimmed Subset Lakes (19)
VariablePearsonp-valuePearsonp-valuePearsonp-valuePearsonp-value
Catchment ha−0.0490.755−0.0010.9970.2090.1790.0710.774
Drained %−0.2500.1060.0320.8950.0330.8360.1440.556
Peatland %−0.0820.6010.1820.4560.0680.6650.0540.826
Peat prod. %0.0600.7030.0170.9440.0260.8670.0120.960
Lake %0.0200.899−0.2150.376−0.1380.376−0.1790.465
Agric %0.3520.0210.2160.3750.0700.6540.2870.234
Lake ha−0.0800.610−0.0280.9090.3330.029−0.1010.682
Catch: Lake0.0210.8950.0180.9420.1100.4810.1980.416
Depth m−0.1130.476−0.1720.4810.1890.231−0.1660.497
Table 4. Partial linear correlations and the associated p-values of peat extraction percentage with carbon accumulation after controlling for other variables for the full 43-lake set (left) and the 19-lake trimmed subset (right).
43 Lakes19 Lakes
Controlling forLinear correlationp-valueLinear correlationp-value
Drained %0.1240.4320.0150.952
Peatland %0.1070.499−0.1160.648
Lake %0.0660.680−0.0530.834
Agric %0.0980.5350.0500.842
Catch. ha0.0540.7350.0180.954
Lake ha0.0510.749−0.0230.982
Catch: Lake0.0620.6970.0130.960
Depth m0.0260.868−0.0400.876
Table 5. Averages for the small lakes from selected Mäkinen & Pajunen Finland (FI) [21] data, the impacted (top and bottom) and reference lakes (top and bottom), temporal changes and their relative differences (if the value is negative, the average is higher in the reference group).
FI DataImpacted LakesReference LakesImpacted vs. Reference
TopBottomGrowth %TopBottomGrowth %Relative bottom difference %Relative top difference %
Almg/kg18,90013,15110,6182414,44012,80313−17−9
Bamg/kg13399782811810216−24−16
Camg/kg45004670392119400238225317
Comg/kg910735973742
Crmg/kg352721262319211014
Cumg/kg20151322211730−23−28
Femg/kg27,90025,20321,5031726,12920,181297−4
Kmg/kg230016991016671132767483350
Mgmg/kg3700355823705022041609374761
Mnmg/kg7004544101158847424−14−23
Namg/kg20027119638207160292231
Nimg/kg15171242171234−50
Pmg/kg13911123100112130312544−20−14
Pbmg/kg7191522503253−52−62
Smg/kg235924362008214575309848−35−47
Srmg/kg3033282033318−110
Timg/kg81897469141610484264360
Vmg/kg35393126413227−3−4
Znmg/kg837971111198639−18−34
N%111−1111−1−20−28
C%141618−122022−10−18−19
Table 6. Forward selected subsets of variables that explain the chemical composition of the predisturbance (upper panel) and recent (lower panel) sediments. Peat extraction (Prod %) is also shown for recent sediments. The table shows percentages of explained variation in sediment chemistry and the associated p-values when the variables are supplied as sole variables or with the other variables as covariables. With covariables, the explained variation is after fitting the covariable.
Forward Sel. Variablep-Value% ExpldCovar.p-Value% ExpldCovar.p-Value% ExpldCovar.p-Value% Expld
Catch. ha0.00118.3Peat %0.00127.1Depth0.00119.2Agri %0.00120.6
Peat %0.0168.0Catch. ha0.00118.0Depth0.0595.20Agri %0.0078.4
Depth0.00310.1Catch. ha0.00511.1Peat %0.0167.3Agri %0.00211.9
Agri %0.0028.5Catch ha0.00111.1Peat %0.0058.9Depth0.00310.4
Catch. ha0.00119.8Depth0.00120.2Peat %0.00124.9Agri %0.00123.5
Peat %0.0157.3Catch. ha0.00113.2Depth0.0844.5Agri %0.0068.0
Depth0.00210.7Catch. ha0.00211.2Peat %0.0098.0Agri %0.00211.5
Agri %0.0166.9Catch. ha0.00311.2Depth0.0117.8Peat%0.0117.5
Prod %0.0136.9Catch. ha0.0375.8Depth0.1503.3Peat %0.1313.8

