A National-Scale Assessment of Population and Built-Environment Exposure in Tsunami Evacuation Zones


Abstract
1. Introduction
2. Materials and Methods
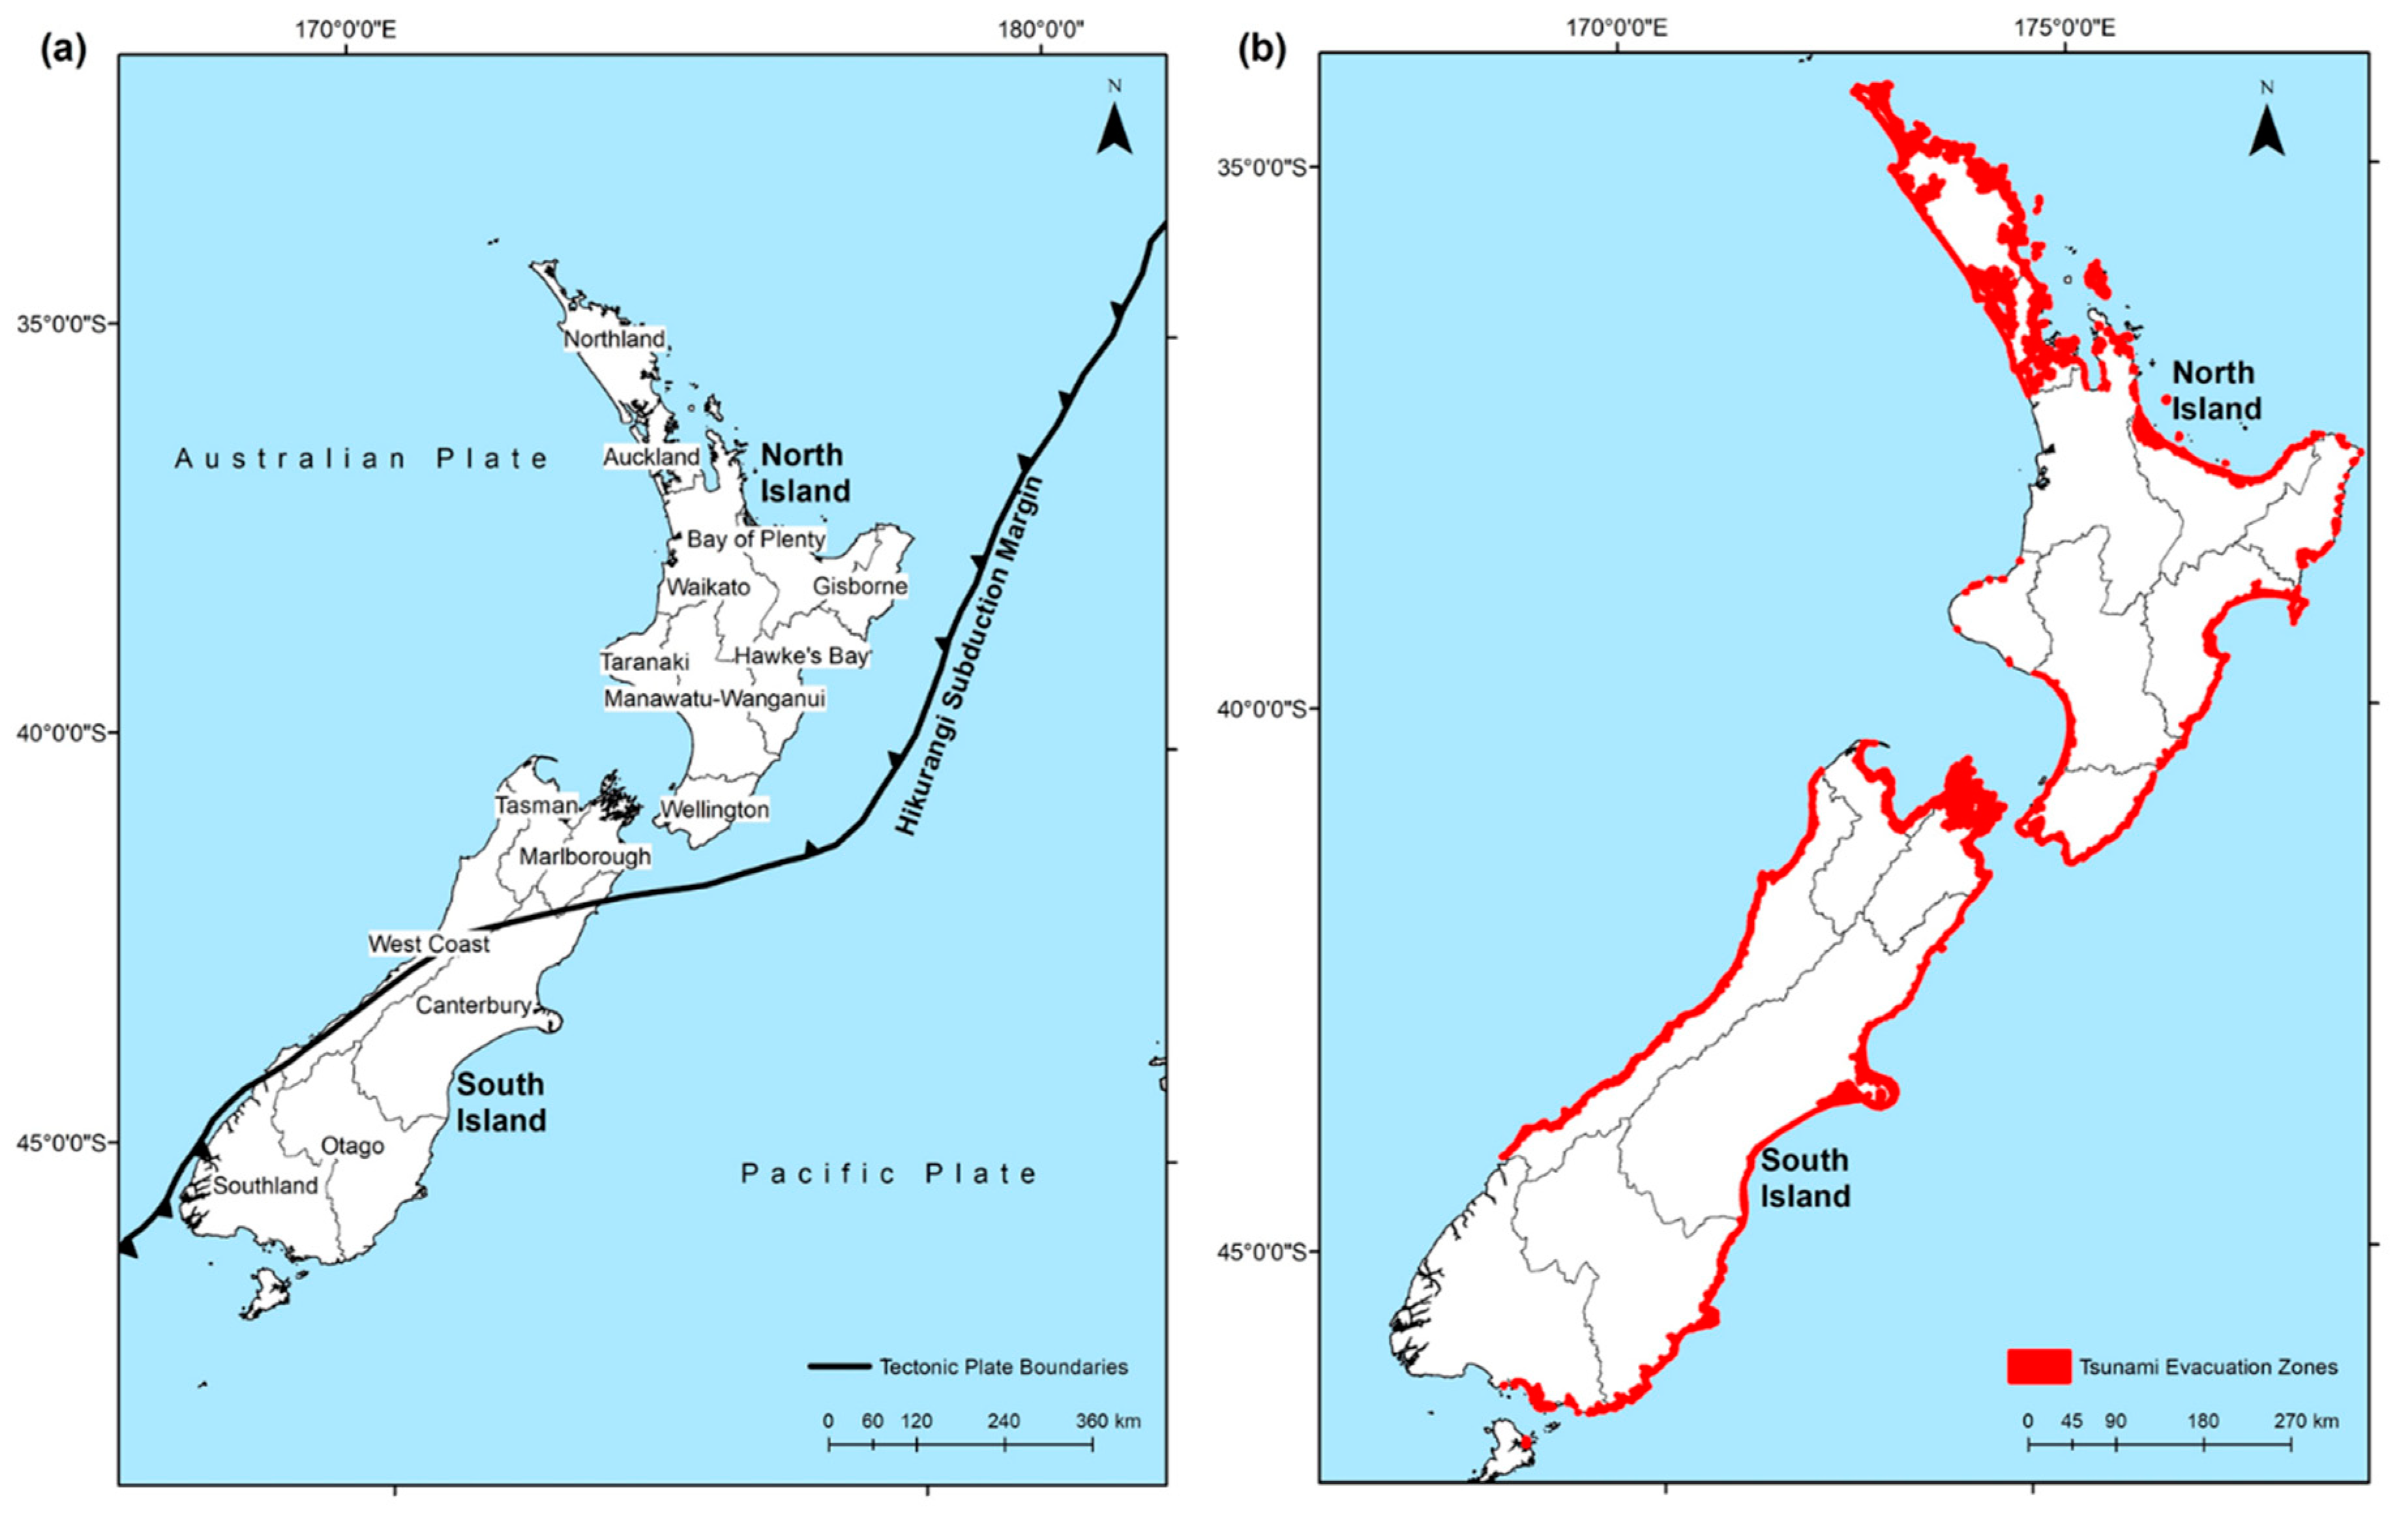
2.1. Regional Setting
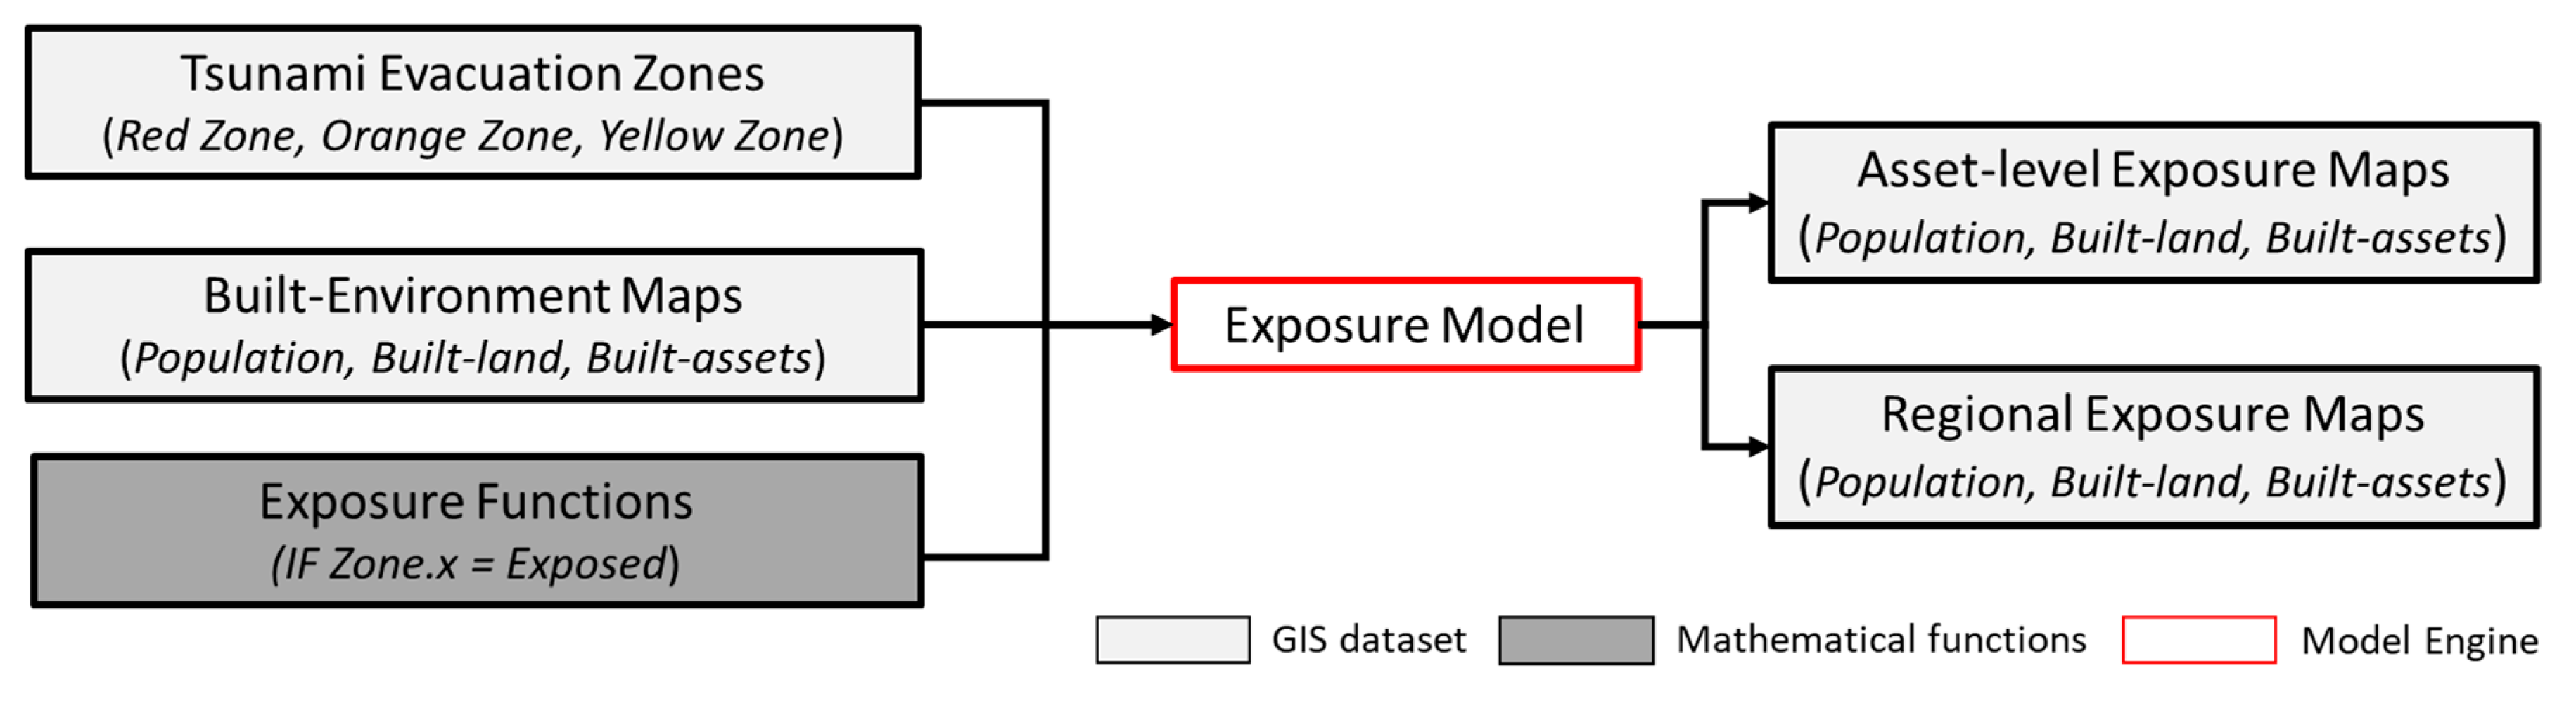
2.2. Exposure Mapping Methodology
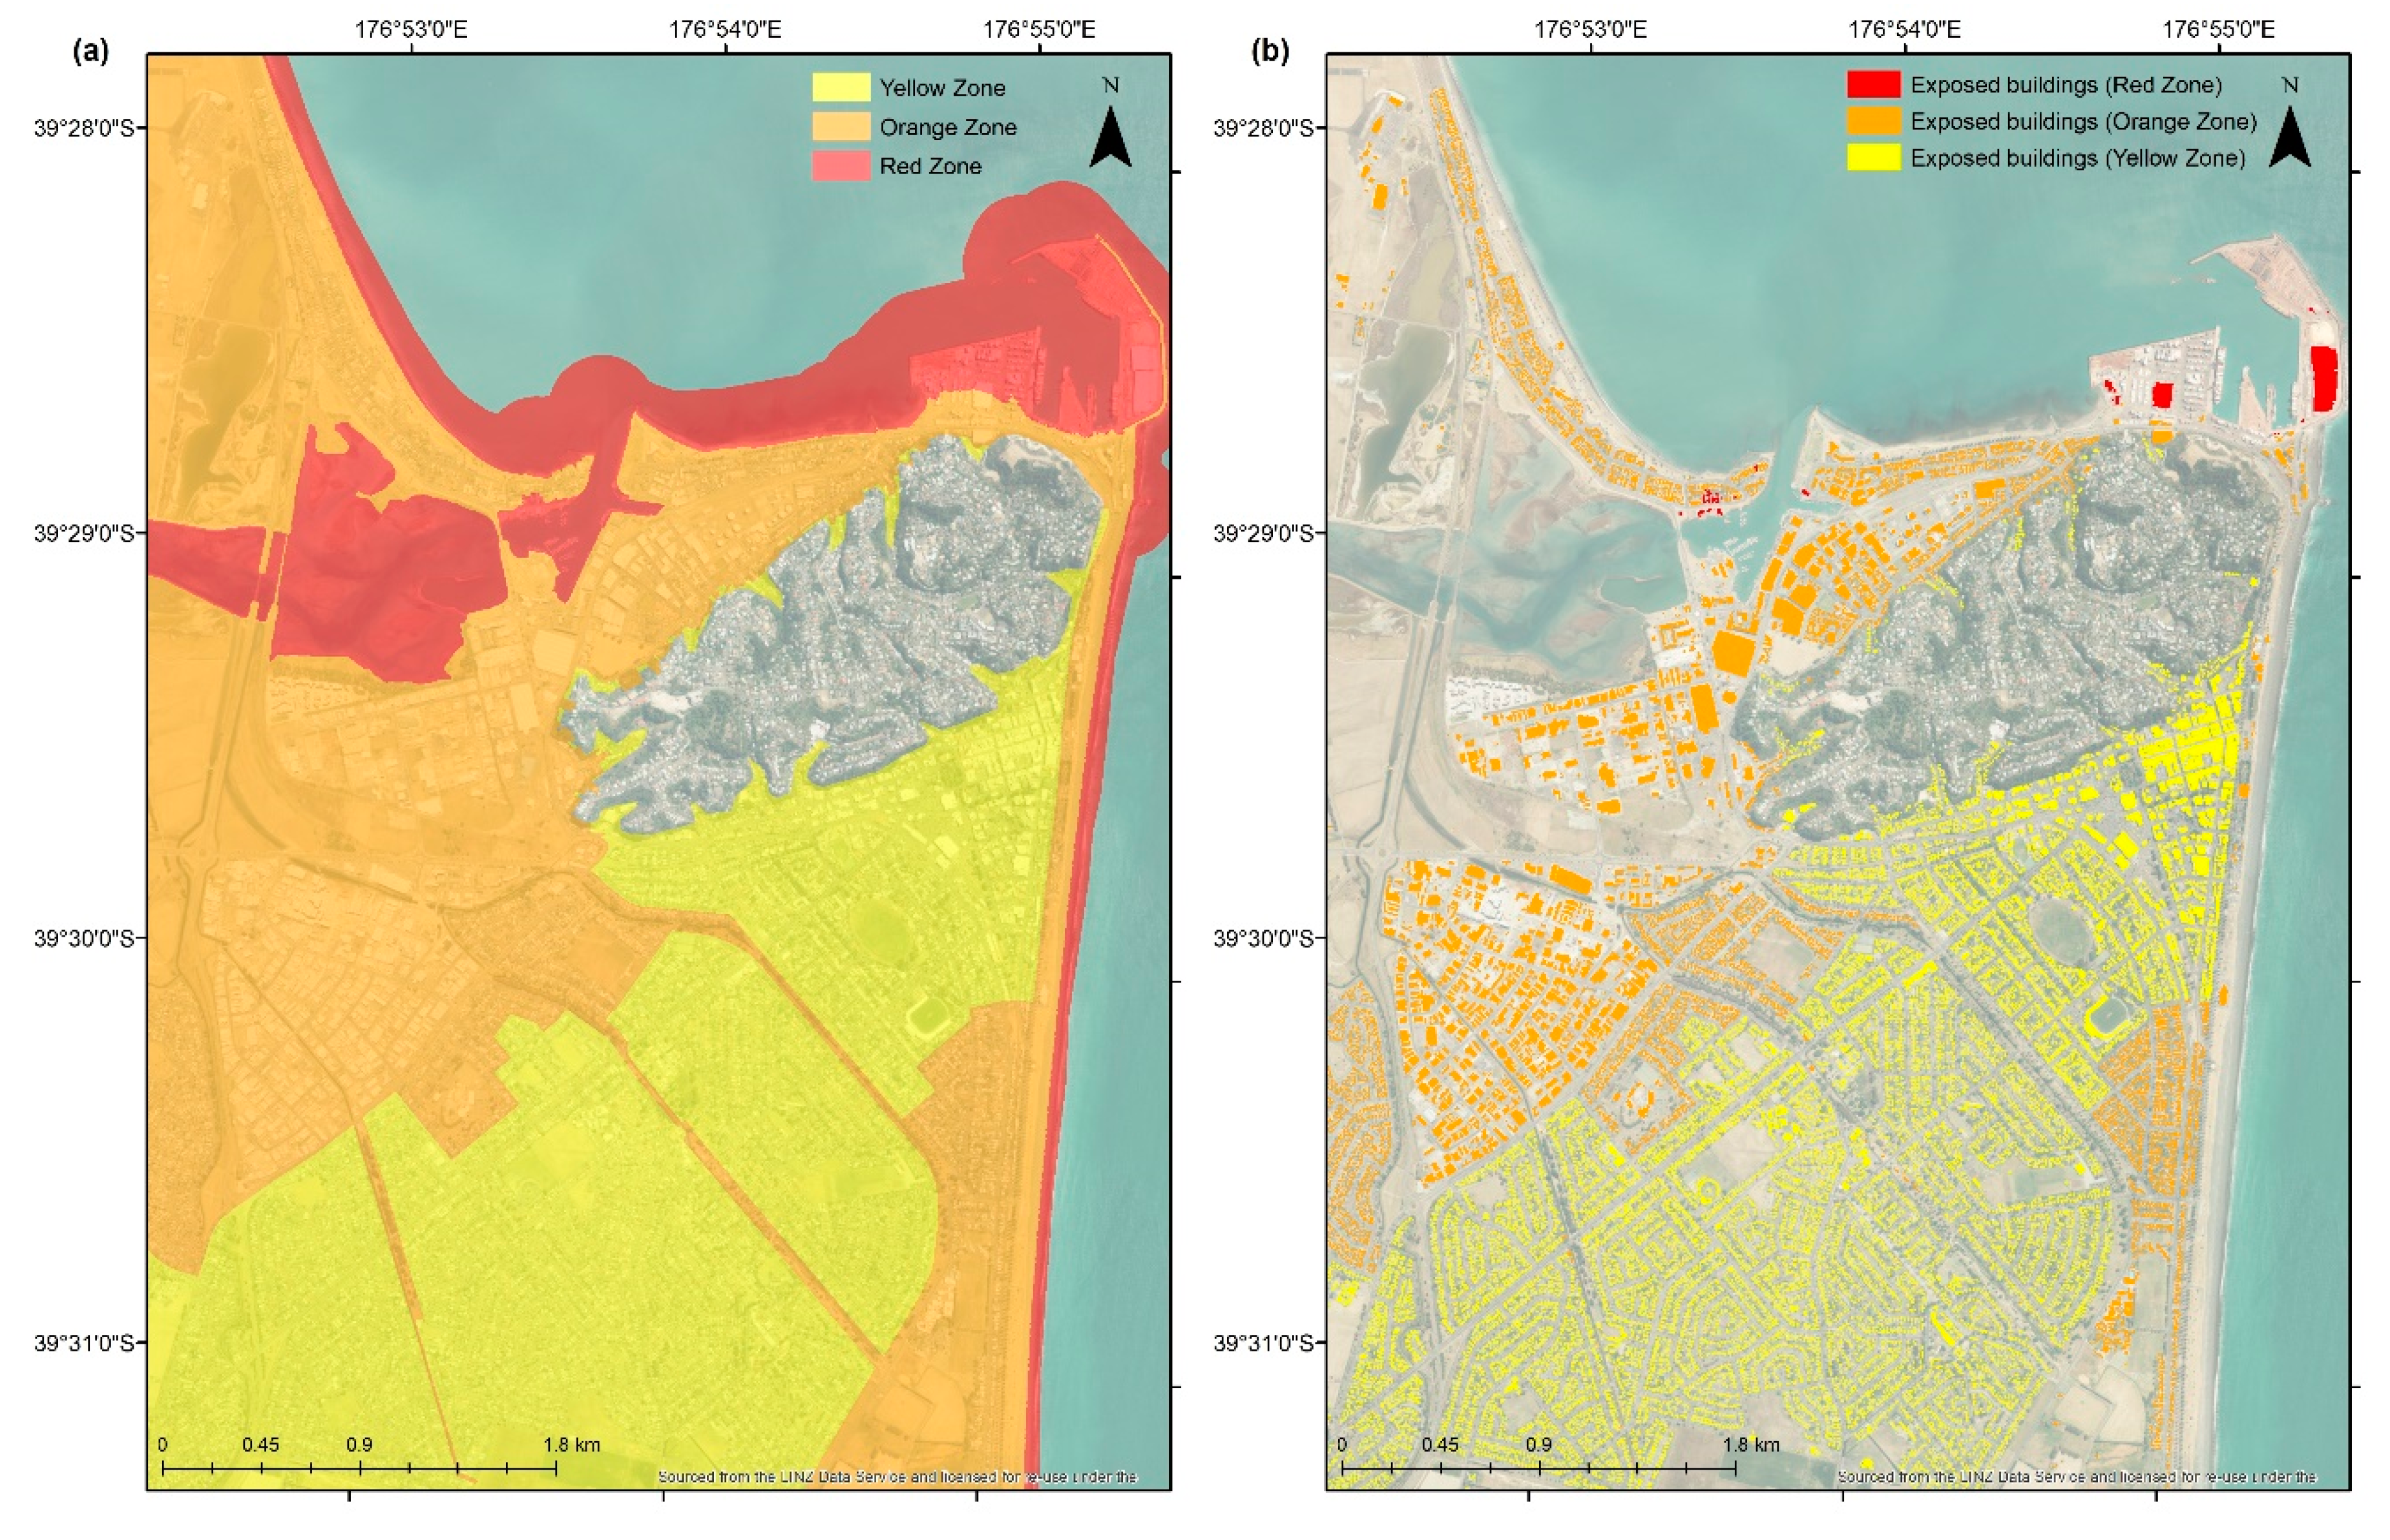
2.3. Tsunami Evacuation Zone Maps
2.4. Built-Environment Maps
2.5. Exposure Assessment
3. Results
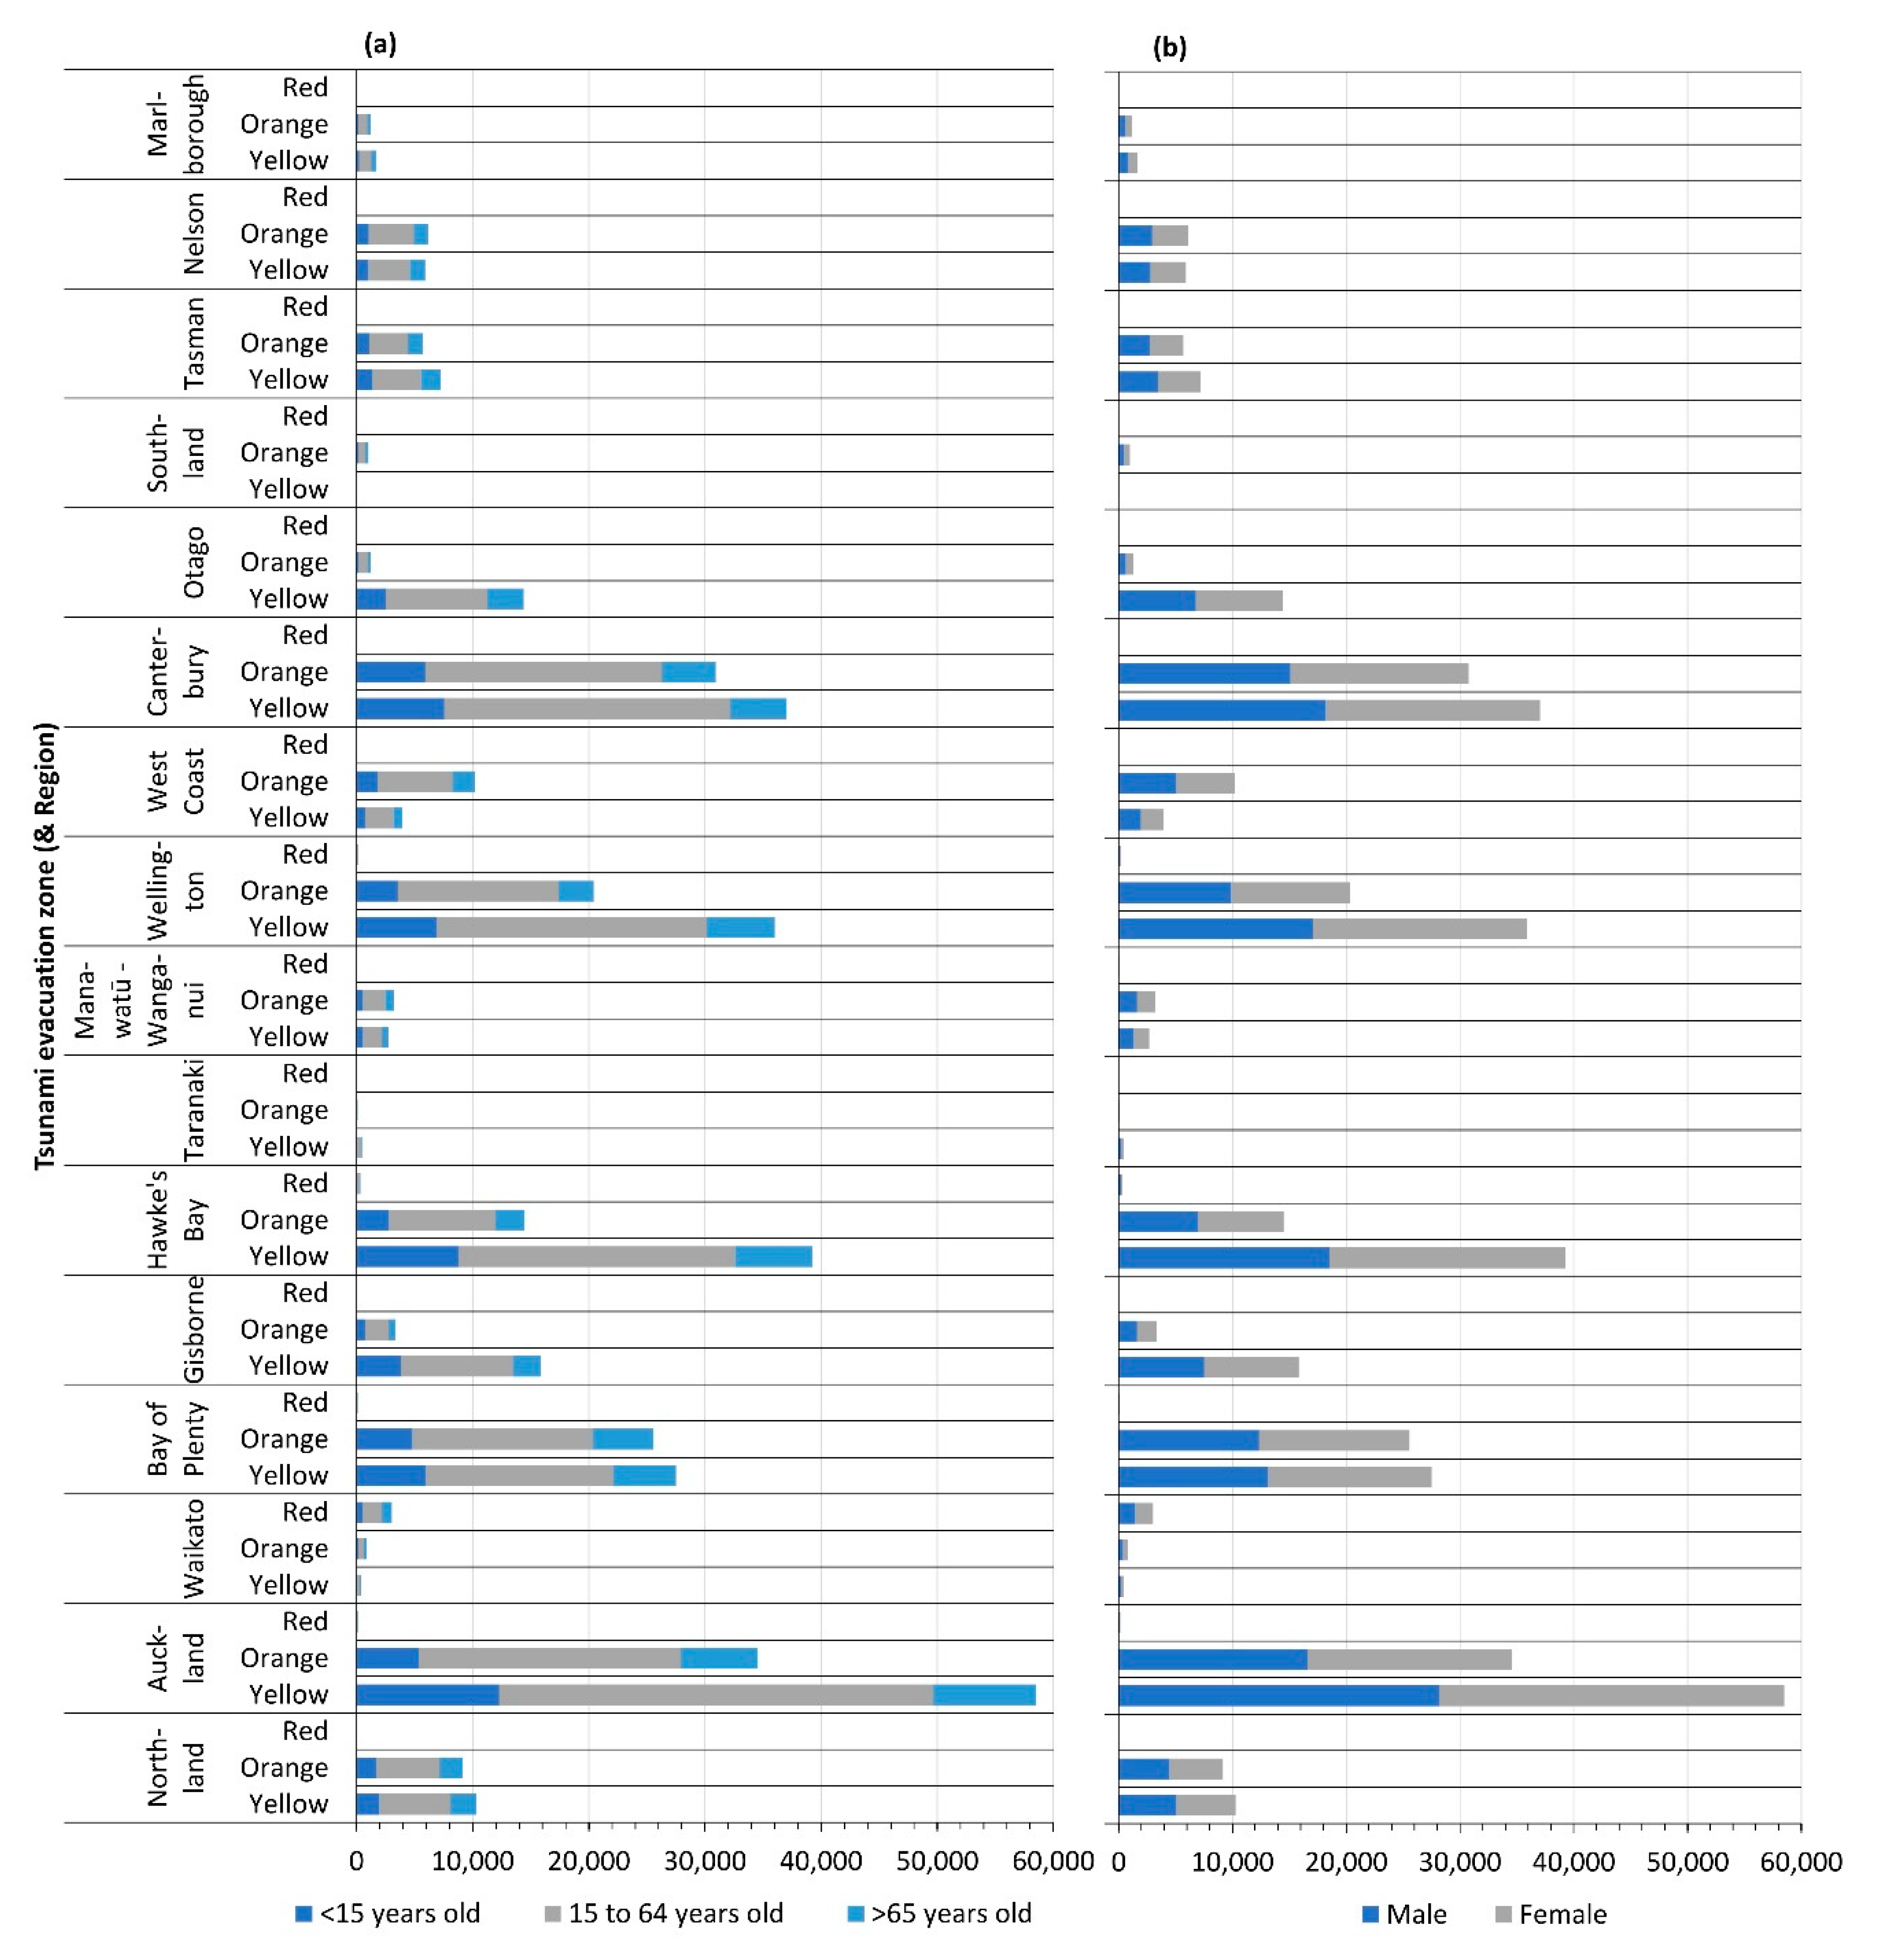
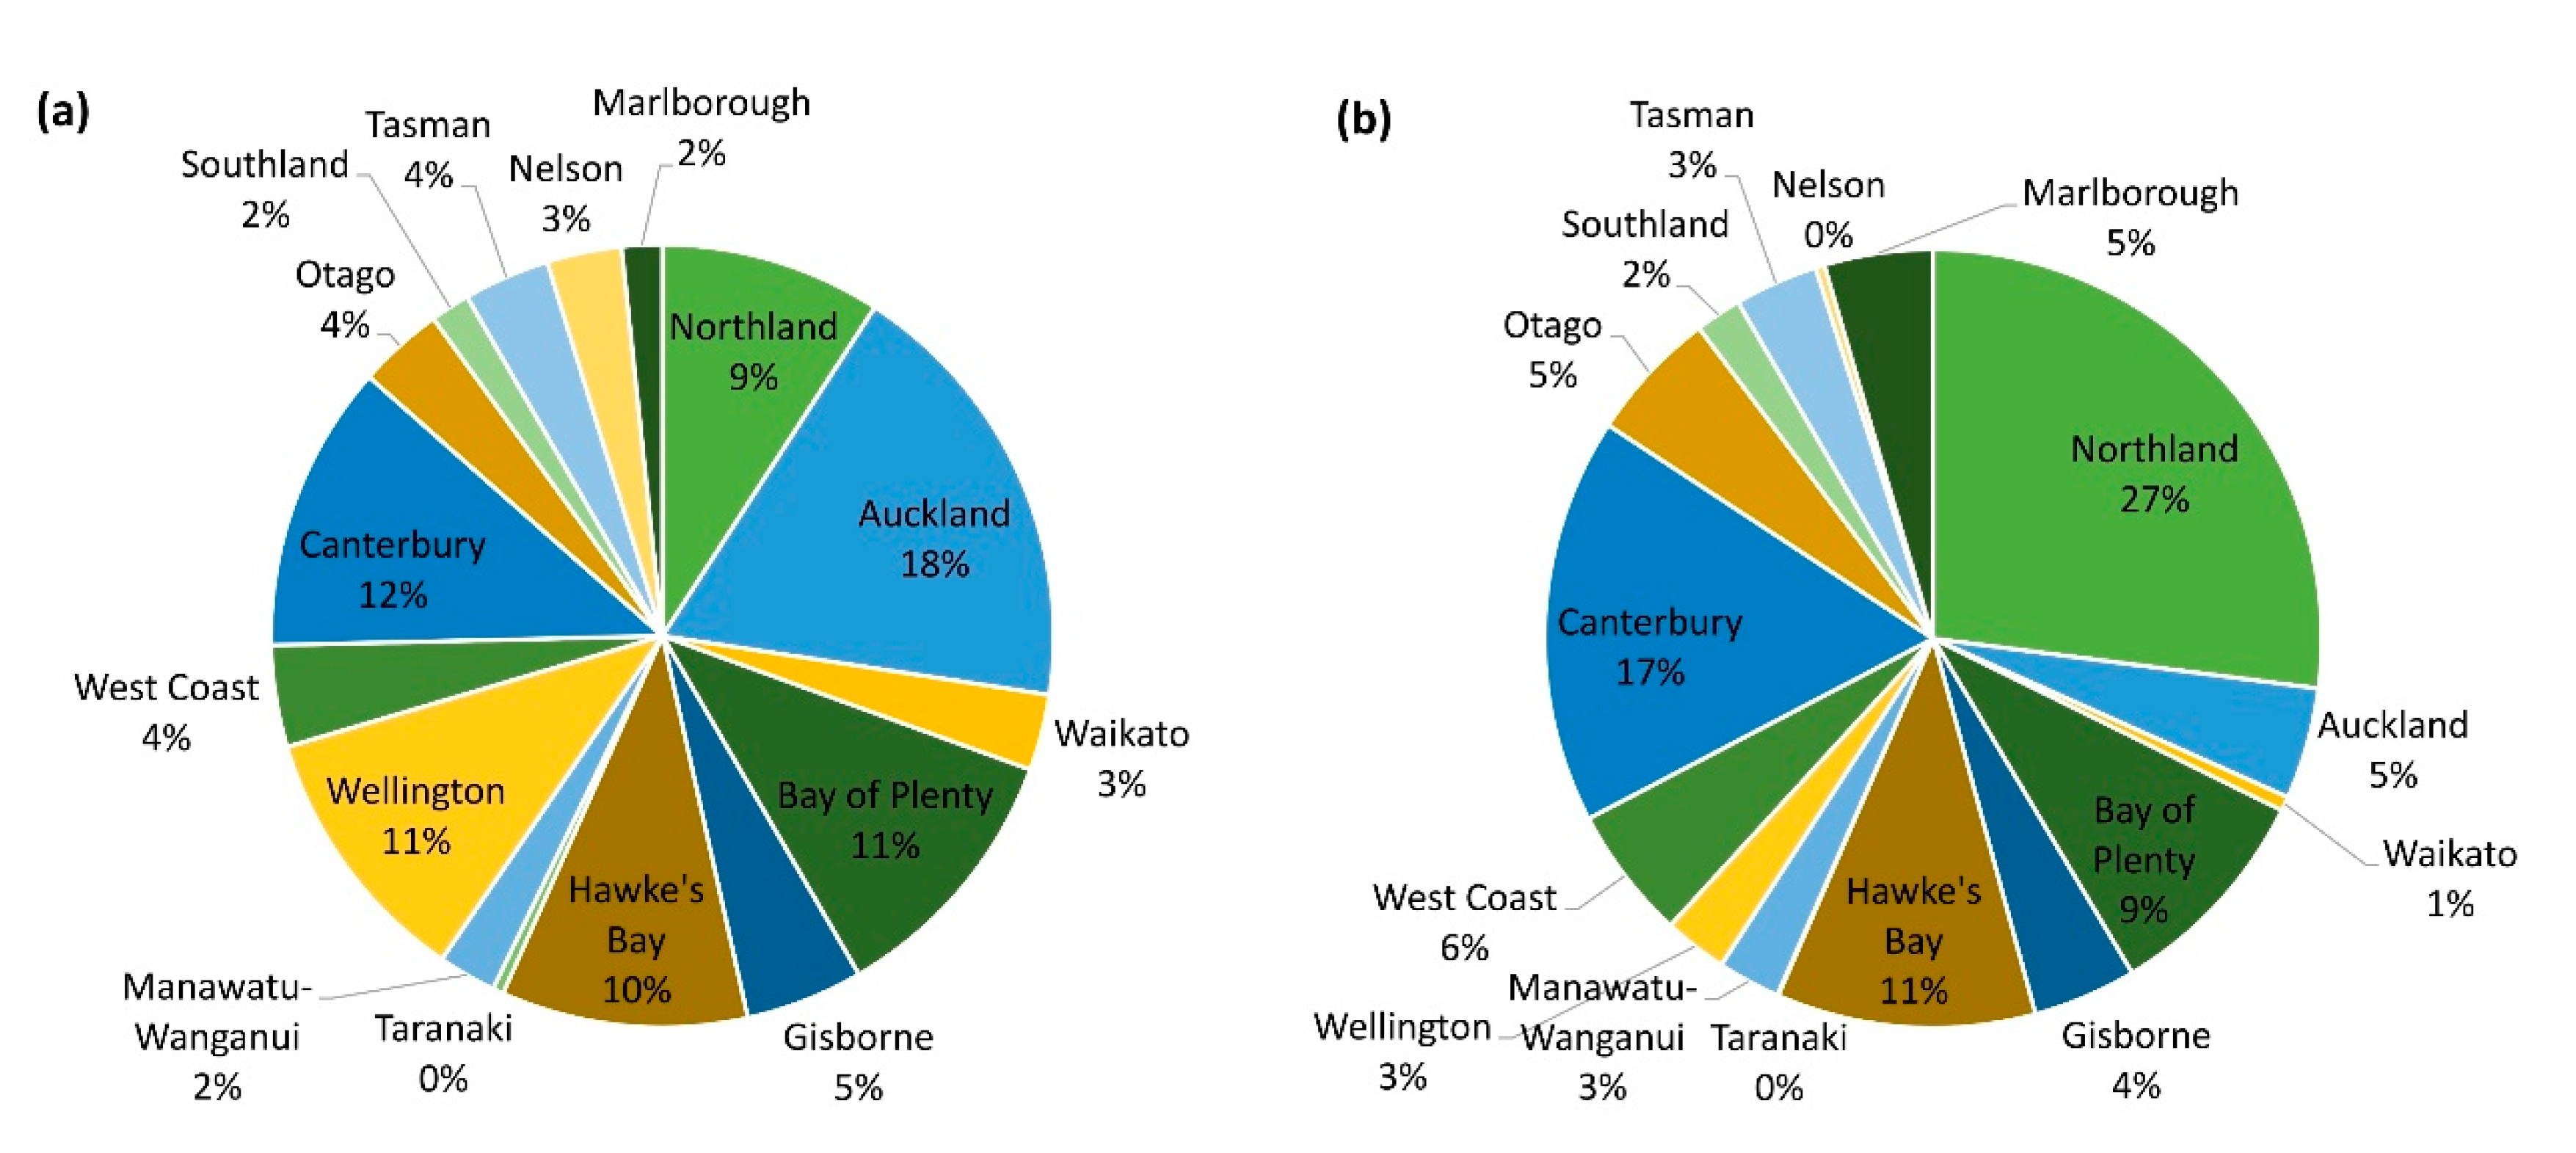
3.1. Population
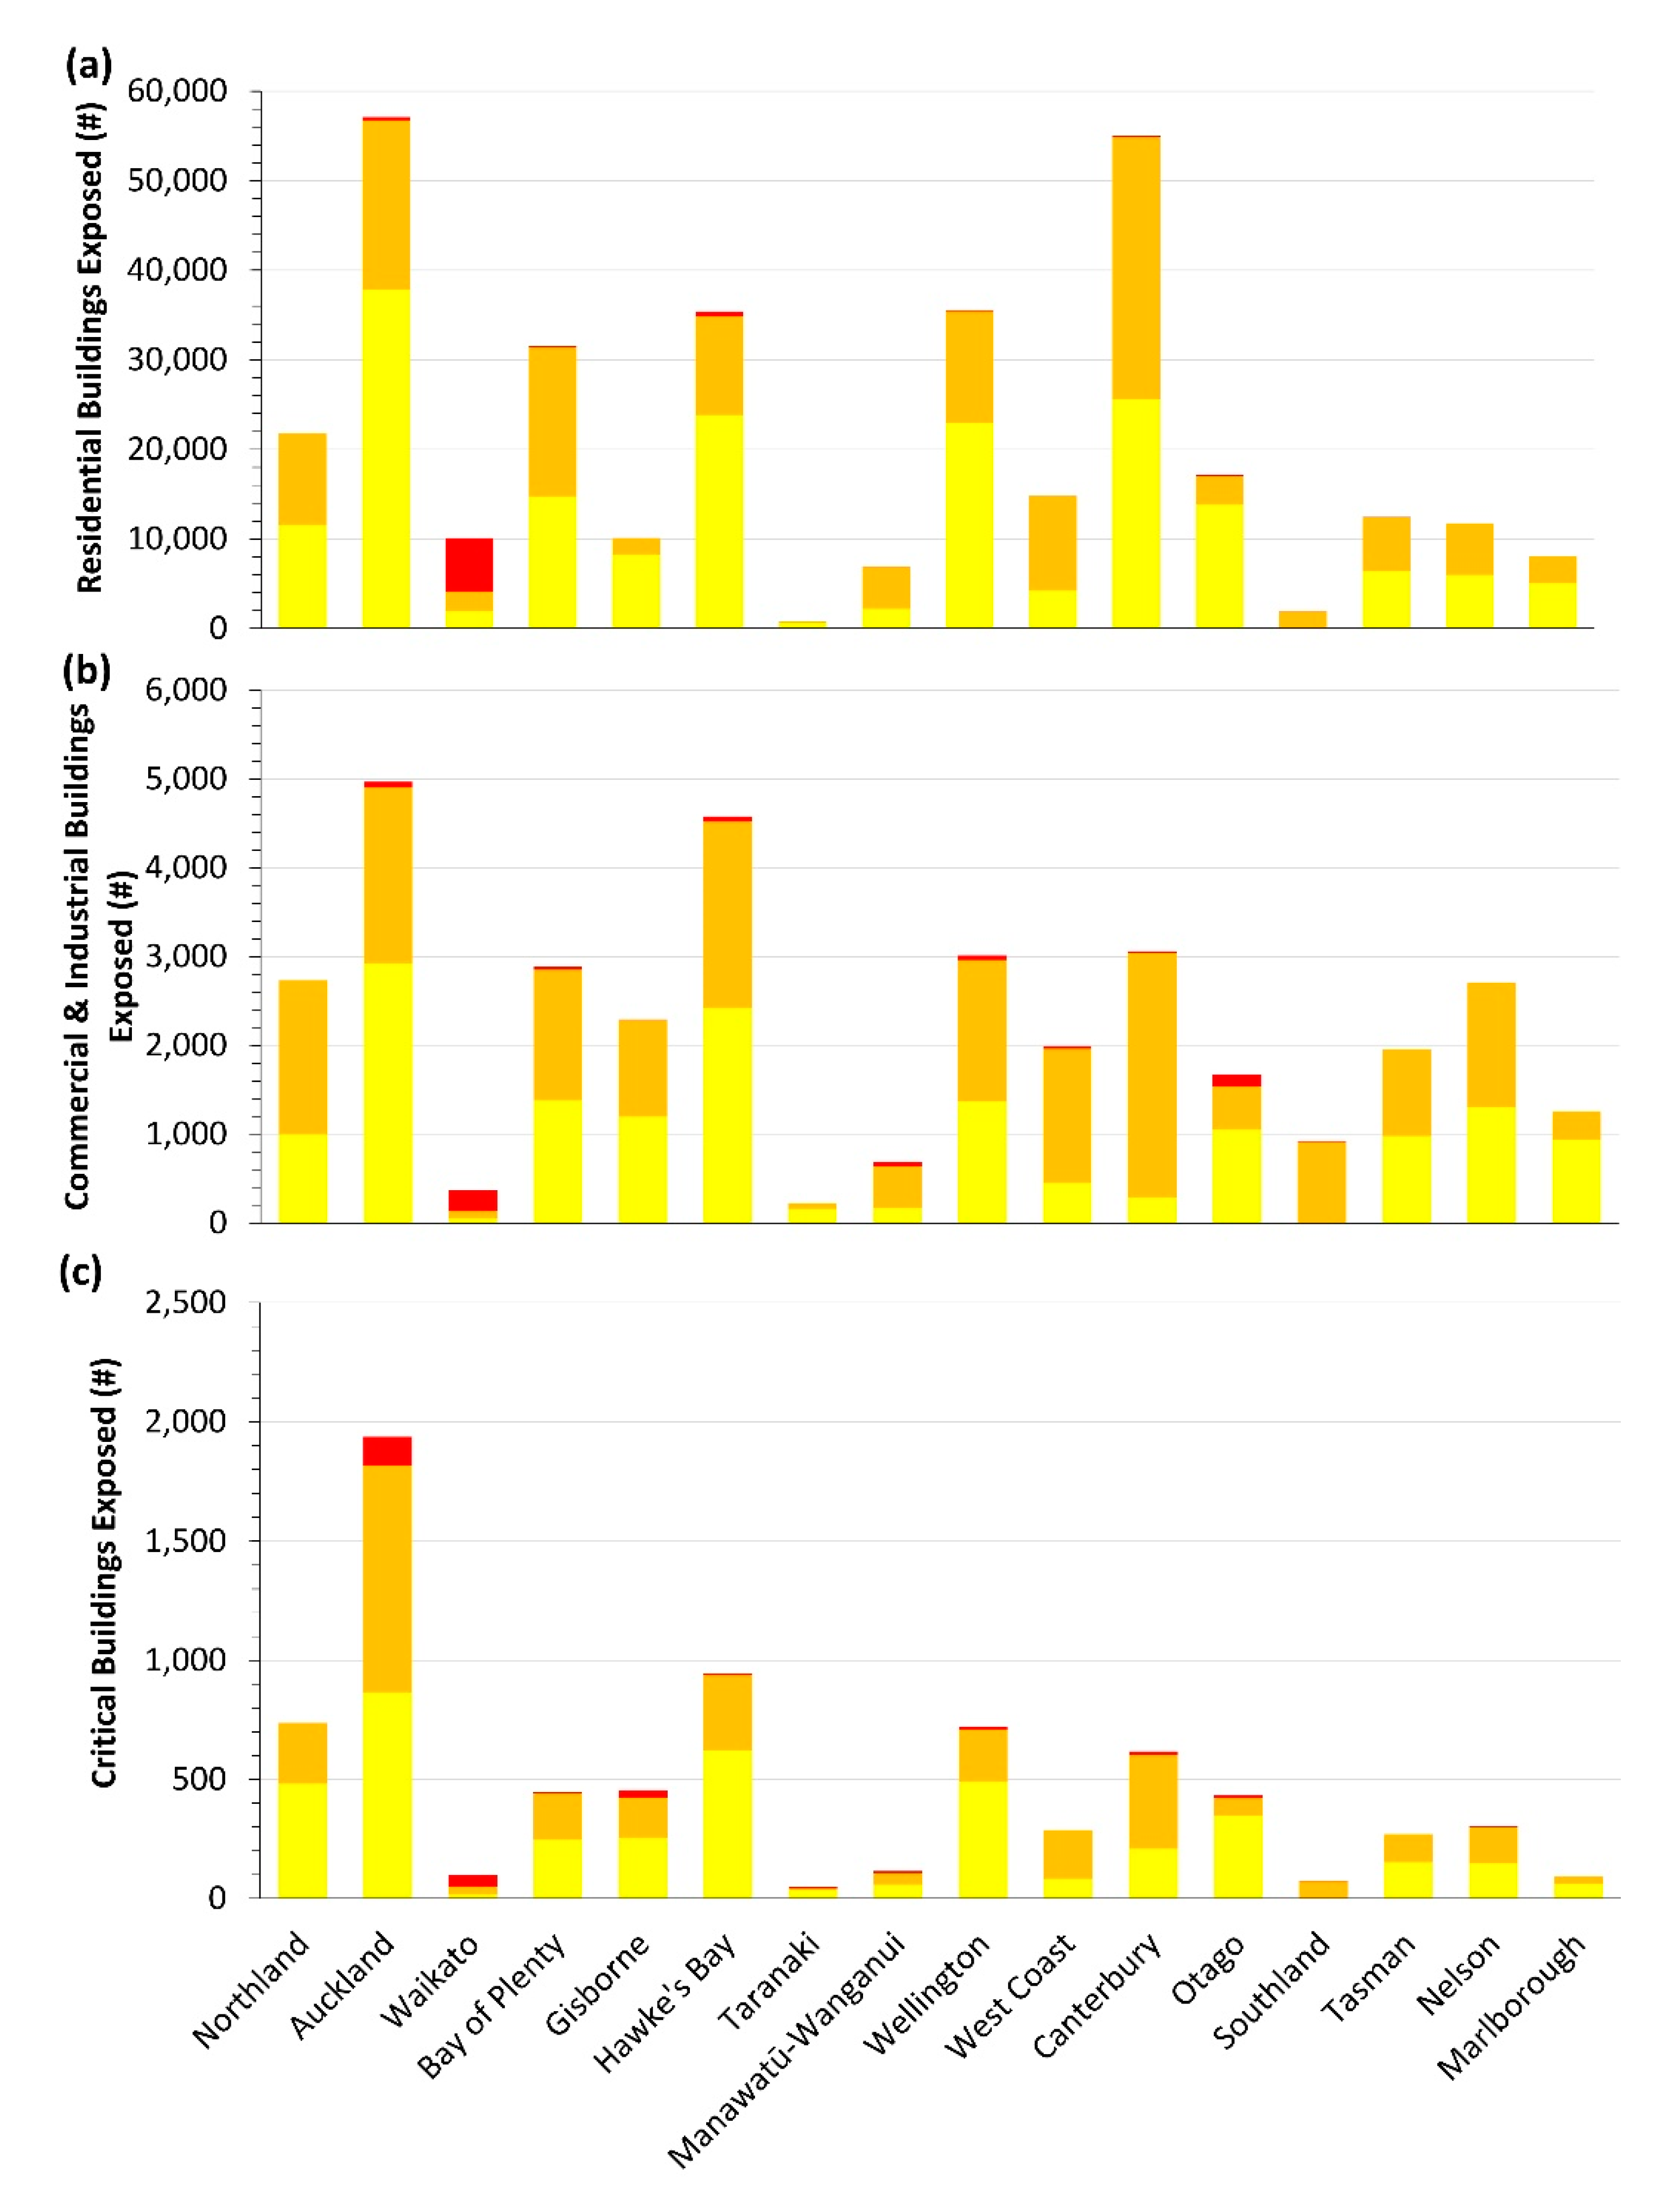
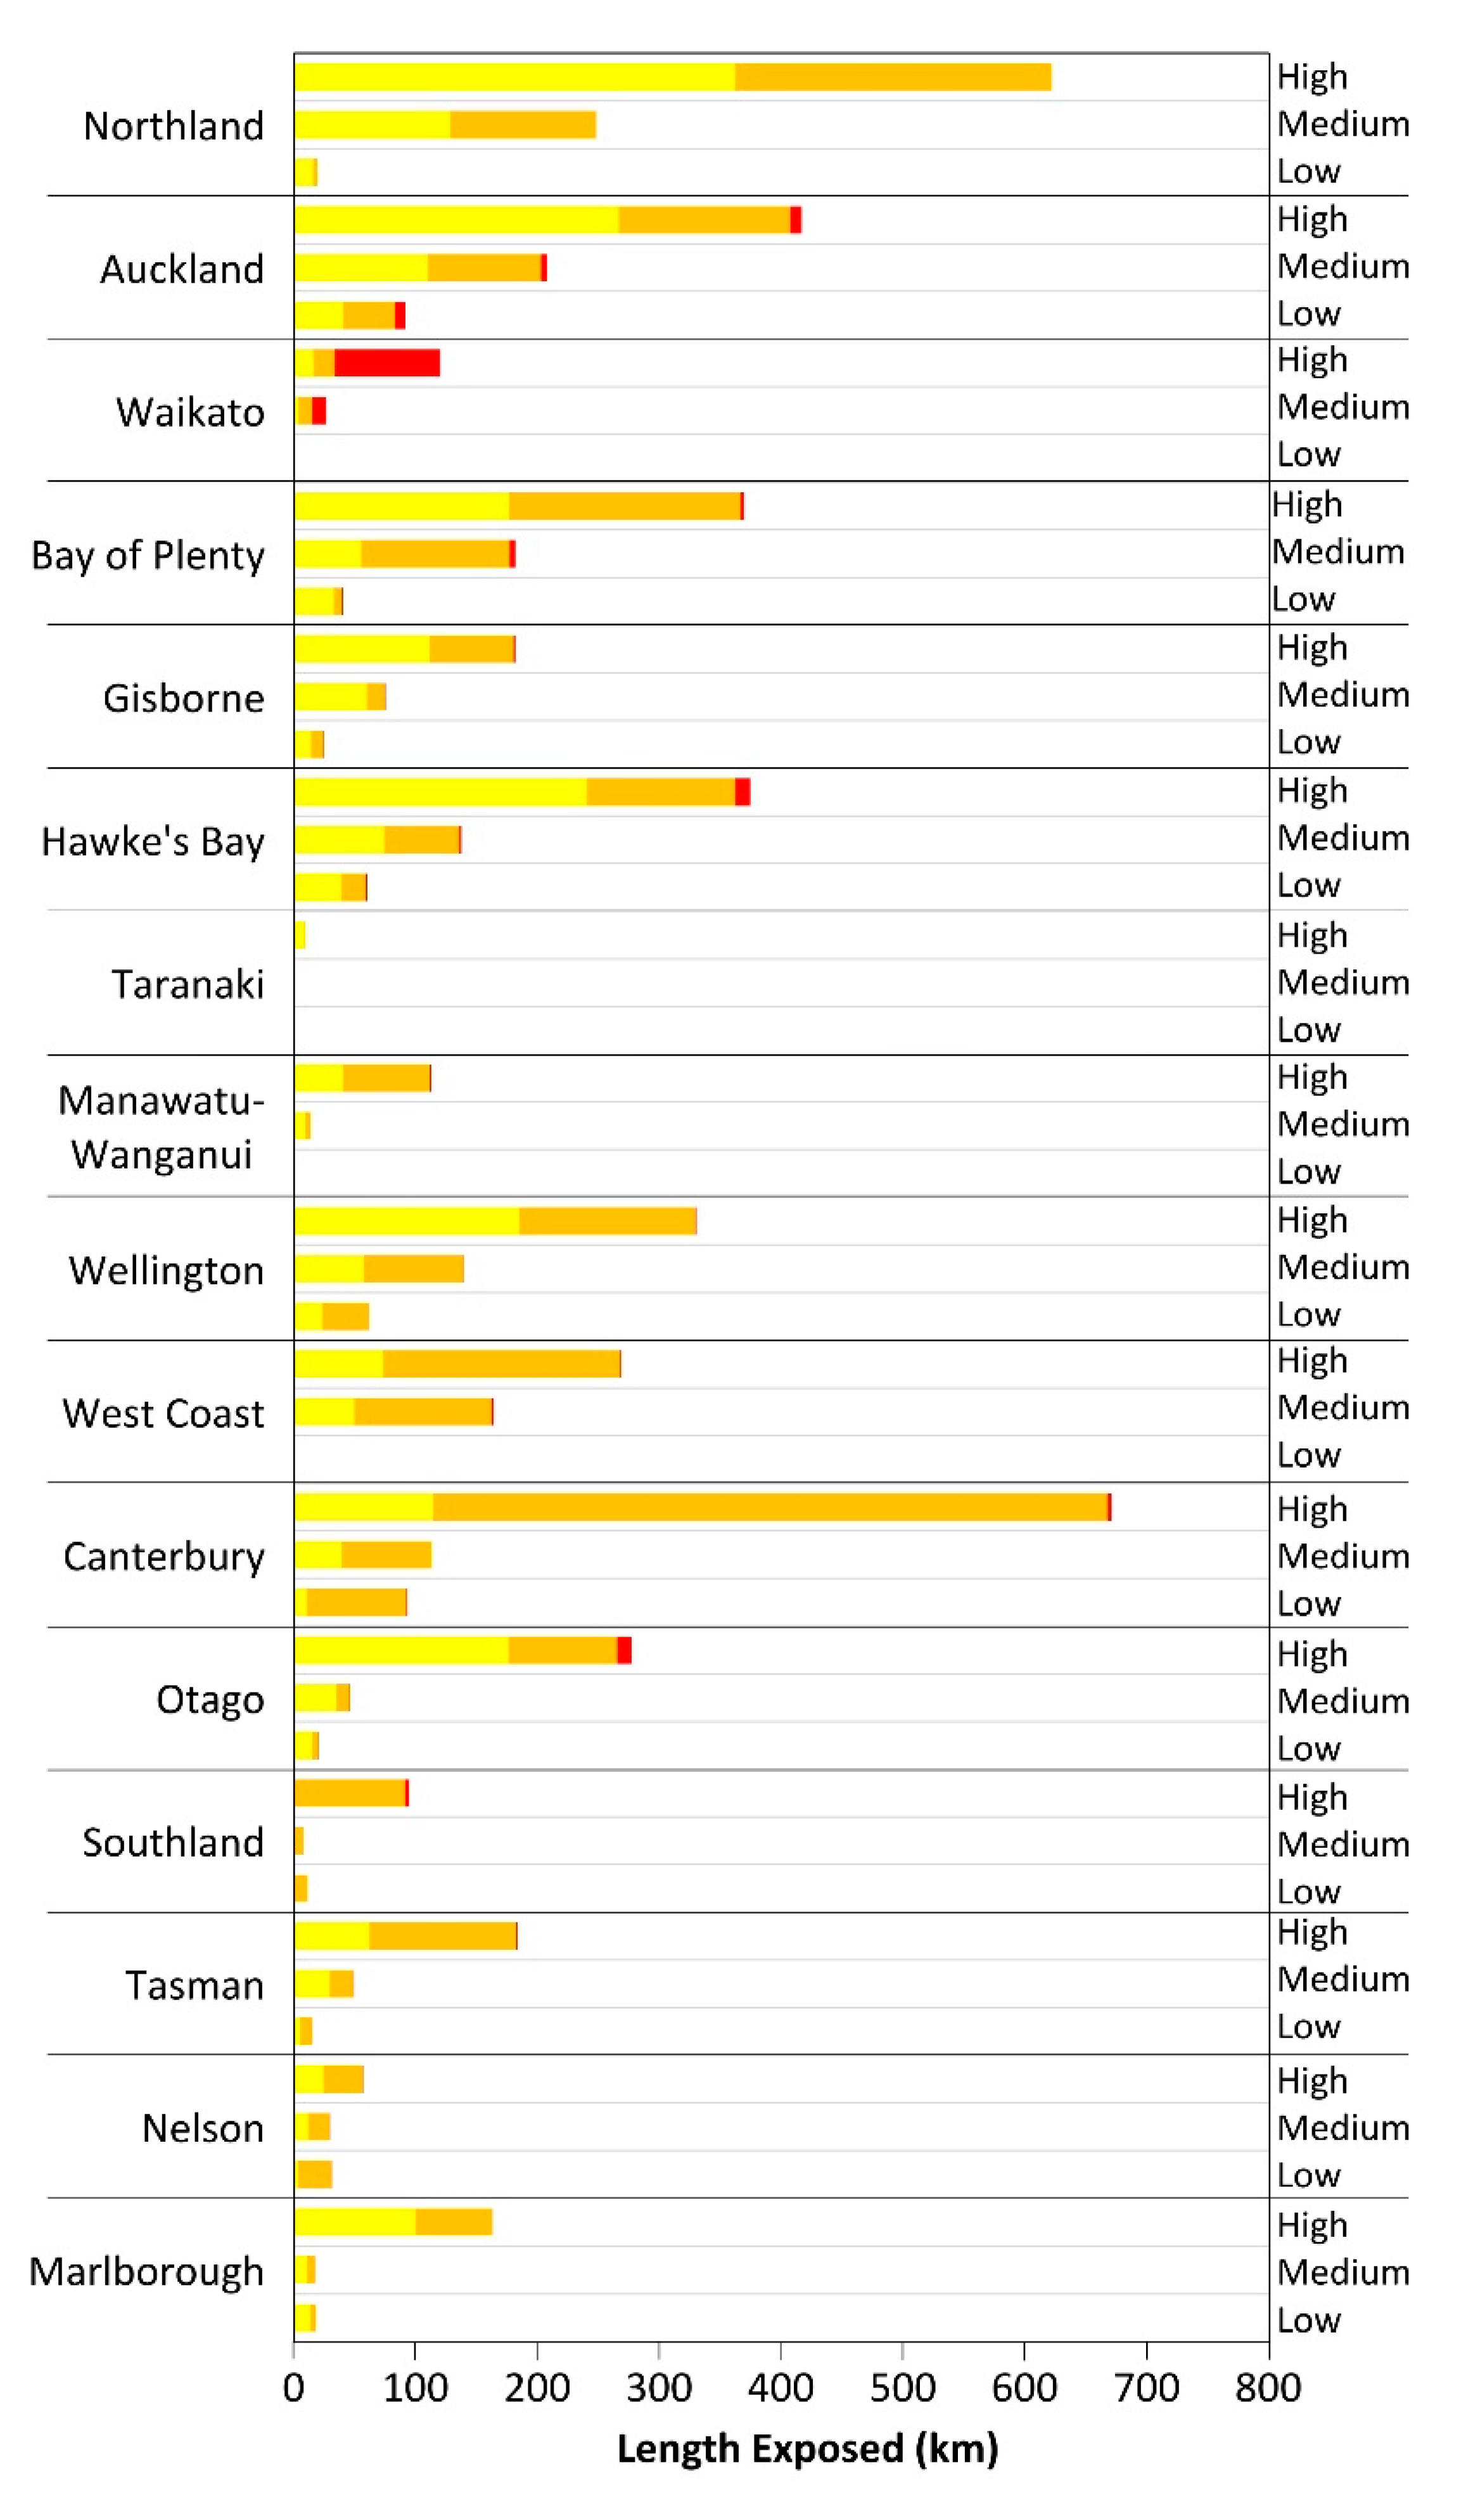
3.2. Built Environments
3.2.1. Land
3.2.2. Building and Infrastructure Assets
4. Discussion
5. Conclusions
Supplementary Materials
Author Contributions
Funding
Acknowledgments
Conflicts of Interest
References
- Scheer, J.S.; Varela, V.; Eftychidis, G. A generic framework for tsunami evacuation planning. Phys. Chem. Earth 2012, 49, 79–91. [Google Scholar] [CrossRef]
- Imamura, F.; Boreta, S.P.; Suppasri, A.; Muhari, A. Recent occurrences of serious tsunami damage and the future challenges of tsunami disaster risk reduction. Prog. Disast. Sci. 2019, 1, 100009. [Google Scholar] [CrossRef]
- Gusiakov, V. Tsunami History. In The Sea; Harvard University Press: Cambridge, MA, USA, 2009; pp. 23–53. ISBN 9780674031739. [Google Scholar]
- Wegscheider, S.; Post, J.; Zosseder, K.; Mück, M.; Strunz, G.; Riedlinger, T.; Muhari, A.; Anwar, H.Z. Generating tsunami risk knowledge at community level as a base for planning and implementation of risk reduction strategies. Nat. Hazards Earth Syst. Sci. 2010, 11, 249–258. [Google Scholar] [CrossRef]
- Kurowski, M.J.; Hedley, N.; Clague, J.J. An assessment of educational tsunami evacuation map designs in Washington and Oregon. Nat. Hazards 2011, 59, 1205. [Google Scholar] [CrossRef]
- Smart, G.M.; Crowley, K.H.M.; Lane, E. Estimating tsunami run-up. Nat. Hazards 2015, 80, 1933–1947. [Google Scholar] [CrossRef]
- Leonard, G.S.; Power, W.L.; Lukovic, B.; Smith, W.D.; Johnston, D.M.; Langridge, R.; Downes, G. Interim Tsunami Evacuation Planning Zone Boundary Mapping for the Wellington and Horizons Regions Defined by a GIS-Calculated Attenuation Rule; GNS Science: Wellington, New Zealand, 2009. [Google Scholar]
- Imamura, F. Tsunami modeling: Calculating inundation and hazard maps. In The Sea: Tsunami; Bernard, E.I., Robinson, A.R., Eds.; Harvard University Press: London, UK, 2009. [Google Scholar]
- Synolakis, C.E.; Bernard, E.N.; Titov, V.V.; Kânoğlu, U.T.K.U.; Gonzalez, F.I. Validation and Verification of Tsunami Numerical Models. Pure Appl. Geophys. 2008, 165, 2197–2228. [Google Scholar] [CrossRef]
- Goda, K.; De Risi, R. Multi-hazard loss estimation for shaking and tsunami using stochastic rupture sources. Int. J. Dis. Risk Red. 2018, 28, 539–554. [Google Scholar] [CrossRef]
- Freire, S.; Aubrecht, C.; Wegscheider, S. Advancing tsunami risk assessment by improving spatio-temporal population exposure and evacuation modeling. Nat. Hazards 2013, 68, 1311–1324. [Google Scholar] [CrossRef]
- Triantafyllou, I.; Novikova, T.; Charalampakis, M.; Fokaefs, A.; Papadopoulos, G.A. Quantitative Tsunami Risk Assessment in Terms of Building Replacement Cost Based on Tsunami Modelling and GIS Methods: The Case of Crete Isl., Hellenic Arc. Pure Appl. Geophys. 2019, 176, 3207–3225. [Google Scholar] [CrossRef]
- Mas, E.; Koshimura, S.; Imamura, F.; Suppasri, A.; Muhari, A.; Adriano, B. Recent Advances in Agent-Based Tsunami Evacuation Simulations: Case Studies in Indonesia, Thailand, Japan and Peru. Pure Appl. Geophys. 2015, 172, 3409–3424. [Google Scholar] [CrossRef]
- Wang, H.; Mostafizi, A.; Cramer, L.A.; Cox, D.; Park, H. An agent-based model of a multimodal near-field tsunami evacuation: Decision-making and life safety. Transp. Res. Part C Emerg. Technol. 2016, 64, 86–100. [Google Scholar] [CrossRef]
- Fraser, S.A.; Wood, N.J.; Johnston, D.M.; Leonard, G.S.; Greening, P.D.; Rossetto, T. Variable population exposure and distributed travel speeds in least-cost tsunami evacuation modelling. Nat. Hazards Earth Syst. Sci. 2014, 14, 2975–2991. [Google Scholar] [CrossRef]
- Ministry of Civil Defence and Emergency Management. National Emergency Management Agency, Tsunami Evacuation Zones: Director’s Guideline for Civil Defence Emergency Management Groups [DGL08/08]; Ministry of Civil Defence and Emergency Management: Wellington, New Zealand, 2008. [Google Scholar]
- Schmidt, J.; Matcham, I.; Reese, S.; King, A.; Bell, R.; Henderson, R.; Smart, G.; Cousins, J.; Smith, W.; Heron, D. Quantitative multi-risk analysis for natural hazards: A framework for multi-risk modelling. Nat. Hazards 2011, 58, 1169–1192. [Google Scholar] [CrossRef]
- Clark, K.; Howarth, J.; Litchfield, N.; Cochran, U.; Turnbull, J.; Dowling, L.; Howell, A.; Berryman, K.; Wolfe, F. Geological evidence for past large earthquakes and tsunamis along the Hikurangi subduction margin, New Zealand. Mar. Geol. 2019, 412, 139–172. [Google Scholar] [CrossRef]
- Fraser, S.A.; Power, W.L.; Wang, X.; Wallace, L.M.; Mueller, C.; Johnston, D.M. Tsunami inundation in Napier, New Zealand, due to local earthquake sources. Nat. Hazards 2014, 70, 415–445. [Google Scholar] [CrossRef]
- Power, W.; Wallace, L.; Wang, X.; Reyners, M. Tsunami Hazard Posed to New Zealand by the Kermadec and Southern New Hebrides Subduction Margins: An Assessment Based on Plate Boundary Kinematics, Interseismic Coupling, and Historical Seismicity. Pure Appl. Geophys. 2012, 169, 1–36. [Google Scholar] [CrossRef]
- Power, W.; Downes, G.; Stirling, M. Estimation of Tsunami Hazard in New Zealand due to South American Earthquakes. Pure Appl. Geophys. 2007, 164, 547–564. [Google Scholar] [CrossRef]
- Power, W. Review of Tsunami Hazard in New Zealand (2013 Update); GNS Science: Wellington, New Zealand, 2013; pp. 1–222. [Google Scholar]
- De Lange, W.P.; Healy, T.R. New Zealand tsunamis 1840–1982. N. Z. J. Geol. Geophys. 1986, 29, 115–134. [Google Scholar] [CrossRef]
- Borrero, J.C.; Goring, D.G. South American Tsunamis in Lyttelton Harbor, New Zealand. Pure Appl. Geophys. 2015, 172, 757–772. [Google Scholar] [CrossRef]
- Paulik, R.; Stephens, S.A.; Bell, R.G.; Wadhwa, S.; Popovich, B. National-Scale Built-Environment Exposure to 100-Year Extreme Sea Levels and Sea-Level Rise. Sustainability 2020, 12, 1513. [Google Scholar] [CrossRef]
- Dymond, J.R.; Shepherd, J.D.; Newsome, P.F.; Belliss, S. Estimating change in areas of indigenous vegetation cover in New Zealand from the New Zealand Land Cover Database (LCDB). N. Z. J. Econ. 2017, 41, 56–64. [Google Scholar] [CrossRef]
- Statistics New Zealand. 2013 Census Usually Resident Population Counts. Available online: http://archive.stats.govt.nz/browse_for_stats/population/census_counts/2013CensusUsuallyResidentPopulationCounts_HOTP2013Census.aspx (accessed on 25 February 2020).
- Lin, S.-L.; Cousins, J.; King, A. Development of New Zealand exposure dataset for use in loss modelling. In Proceedings of the Australian Structural Engineering Conference (ASEC), Brisbane, Australia, 22–25 November 2016; pp. 476–485. [Google Scholar]
- González-Riancho, P.; Aliaga, B.; Hettiarachchi, S.; González, M.; Medina, R. A contribution to the selection of tsunami human vulnerability indicators: Conclusions from tsunami impacts in Sri Lanka and Thailand (2004), Samoa (2009), Chile (2010) and Japan (2011). Nat. Hazards Earth Syst. Sci. 2015, 15, 1493–1514. [Google Scholar] [CrossRef]
- Suppasri, A.; Mas, E.; Charvet, I.; Gunasekera, R.; Imai, K.; Fukutani, Y.; Abe, Y.; Imamura, F. Building damage characteristics based on surveyed data and fragility curves of the 2011 Great East Japan tsunami. Nat. Hazards 2013, 66, 319–341. [Google Scholar] [CrossRef]
- Tarbotton, C.; Dall’Osso, F.; Dominey-Howes, D.; Goff, J. The use of empirical vulnerability functions to assess the response of buildings to tsunami impact: Comparative review and summary of best practice. Earth Sci. Rev. 2015, 142, 120–134. [Google Scholar] [CrossRef]
- Paulik, R.; Lane, E.; Williams, S.; Power, W. Changes in Tsunami Risk to Residential Buildings at Omaha Beach, New Zealand. Geosciences 2019, 9, 113. [Google Scholar] [CrossRef]
- Weibe, D.M.; Cox, D.T. Application of fragility curves to estimate building damage and economic loss at a community scale: A case study of Seaside, Oregon. Nat. Hazards 2014, 71, 2043–2061. [Google Scholar] [CrossRef]


| Element Category | Object Type | Attributes | Units | Geometry | Data Owner |
|---|---|---|---|---|---|
| Land | Land Cover | Use Category, Area | km2 | Polygon | Government Research Institute |
| Buildings | Building | Population (age, gender), Use Category | - | Polygon | Government Research Institute, Central Government, Local Government, Private Sector |
| Transport | Roads | Length, Use Category Traffic Volume | km | Line | Central Government |
| Railway | Length | km | Line | Central Government | |
| Airports | Area | km2 | Polygon | Central Government |
| Element | Attributes | Exposure Metric | Evacuation Zone | Total | |||
|---|---|---|---|---|---|---|---|
| Yellow | Orange | Red | |||||
| Population | Age | <15 years old | Count (#) | 53,796 | 29,887 | 617 | 84,300 |
| 15–65 years old | 163,101 | 107,310 | 2278 | 272,689 | |||
| >65 years old | 44,274 | 30,866 | 1007 | 76,147 | |||
| Gender | Male | 125,260 | 81,544 | 1929 | 208,733 | ||
| Female | 135,754 | 86,323 | 1987 | 224,064 | |||
| Land | Built-Up | Area (km2) | 177 | 158 | 17 | 353 | |
| Production | 1128 | 1126 | 100 | 2354 | |||
| Buildings | Residential | Residential | Count (#) | 230,702 | 160,626 | 7774 | 399,102 |
| Retirement Home | 373 | 139 | 0 | 512 | |||
| Commercial and Industrial | Commercial | 5151 | 5514 | 300 | 10,965 | ||
| Industrial | 13,262 | 15,687 | 495 | 29,444 | |||
| Critical | Hospital and Medical | 275 | 186 | 9 | 470 | ||
| Emergency Management | 368 | 228 | 1 | 597 | |||
| Government | 1680 | 1647 | 202 | 3529 | |||
| Infrastructure Utility | 204 | 453 | 53 | 710 | |||
| Education | 2523 | 1092 | 28 | 3643 | |||
| Other | - | 19,823 | 18,454 | 2834 | 41,111 | ||
| Roads | High Traffic Volume | National | Length (km) | 122 | 173 | 4.7 | 300 |
| Regional | 91 | 88 | 6.7 | 186 | |||
| Medium Traffic Volume | Arterial | 266 | 330 | 5.7 | 602 | ||
| Primary Collector | 408 | 426 | 20 | 855 | |||
| Low Traffic Volume | Secondary Collector | 676 | 736 | 31 | 1444 | ||
| Access | 1285 | 1423 | 101 | 2809 | |||
| Not Defined | - | 88 | 79 | 4.6 | 171 | ||
| Railway | - | Length (km) | 137 | 228 | 46 | 411 | |
| Airports | - | Count (#) | 18 | 5 | 0 | 23 | |
© 2020 by the authors. Licensee MDPI, Basel, Switzerland. This article is an open access article distributed under the terms and conditions of the Creative Commons Attribution (CC BY) license (http://creativecommons.org/licenses/by/4.0/).
Share and Cite
Paulik, R.; Craig, H.; Popovich, B. A National-Scale Assessment of Population and Built-Environment Exposure in Tsunami Evacuation Zones. Geosciences 2020, 10, 291. https://doi.org/10.3390/geosciences10080291
Paulik R, Craig H, Popovich B. A National-Scale Assessment of Population and Built-Environment Exposure in Tsunami Evacuation Zones. Geosciences. 2020; 10(8):291. https://doi.org/10.3390/geosciences10080291
Chicago/Turabian StylePaulik, Ryan, Heather Craig, and Benjamin Popovich. 2020. "A National-Scale Assessment of Population and Built-Environment Exposure in Tsunami Evacuation Zones" Geosciences 10, no. 8: 291. https://doi.org/10.3390/geosciences10080291
APA StylePaulik, R., Craig, H., & Popovich, B. (2020). A National-Scale Assessment of Population and Built-Environment Exposure in Tsunami Evacuation Zones. Geosciences, 10(8), 291. https://doi.org/10.3390/geosciences10080291