Abstract
The seismic vulnerability of structures is closely related to changes in the degree of soil saturation that may cause significant changes in volume and shear strength, and consequently, bearing capacity. This paper aims to consider this issue during the strong earthquake that struck Southern Italy on 23 November 1980 (Ms = 6.9) and affected the Campania and Basilicata regions. Several 3D numerical finite element models were performed in order to consider the effects of soil–structure interaction (SSI) on a representative benchmark structure. In particular, the role of the water level depth is herein considered as one of the most significant parameters to control the shear deformations inside the soil, and thus the performance of the superstructure. Results show the importance of considering the water level for buildings on shallow foundations in terms of settlements, base shear forces and floor displacements.
1. Background
The historical 23 November 1980 Irpinia–Basilicata (Southern Italy) earthquake (Ms = 6.9) showed the importance of assessing seismic risk for Italian communities. In particular, earthquake vulnerability depends on the mechanisms occurring inside the superficial layers that filter the input motion from the bedrock. Many parameters may drive these mechanisms, such as soil properties, bedrock characteristics, layers depth, stratification and water level. In particular, the effects caused by water level may modify the vertical pressures on the soil layers, as observed and discussed by [,]. Other contributions showed the importance of controlling the water table as a soil improvement [,]. In addition, the correlation between shallow groundwater levels and liquefaction occurrence is proposed by [] for the May 2006 earthquake at Yogyakarta (Indonesia). In addition, [] showed the effects of water level on analytical indexes for liquefaction susceptibility, while [] investigated the effects of water table level during the recent Emilia Romagna earthquake, where the oscillations were shown to be limited to less than 2 m.
In this regard, there are many approaches to measure the depth of the water table. One of the most common consists of applying piezometers that are typically inserted into the soil at different depths below the surface with measurements made manually or automatically with a continuous registration []. As shown in [], other interesting issues are the density, the frequency of measurement sites, the spatially interpolating point data and the extrapolating of the water table depth procedures. In this regard, interpreting redoximorphic features [] is another common methodology in routine soil surveys. More extended approaches that allow for the prediction of the variation of shallow water table are based on climatic records, field evidences from soil morphology and properties, outputs of physically based water balance models and combinations of the different approaches. Soil morphology is particularly valuable for interpreting water table dynamics in the soil profile [], and simulation models were recently proposed (e.g., []).
After the 23 November 1980 Irpinia–Basilicata earthquake, several contributions considered the various mechanisms of rupture [,,,,] and estimated damages [], which focused on the effects of spectral accelerations [,,] or quantified the consequences [,,], and proposed several models [,]. Even with such extended literature, information regarding the level of the water table was not registered; this paper proposes numerical simulations of 3D models with different water levels in order to investigate the role of this parameter on the seismic vulnerability of the structure, which was previously investigated []. In particular, the effects of water level are relevant especially in the case of shallow foundations, since they are more sensitive to the change of the vertical stresses due to changing water level. For example, [] showed that structures with shallow foundations on soft soils are expected to experience big damages and losses due to soil–structure interaction (SSI), which can be beneficial, detrimental or uninfluential on the seismic vulnerability. In addition, [] showed that considering SSI for unreinforced masonry (URM) buildings with shallow foundations is non-negligible and that taking into account the inelastic behaviour of the soil foundation system may lead to smaller structural displacements. Furthermore, [] focused on the mechanisms at the base of the permanent deformation of the soil to conclude that buildings founded on shallow foundations are particularly vulnerable to seismically induced settlements.
With this background, the present paper aims firstly at covering the lack of information regarding the position of the water level during the Irpinia–Basilicata earthquake by presenting a case study to assess the most detrimental water level conditions under which the earthquake may have occurred. Secondly, this paper proposes an attempt to generalize the outcomes presented to other seismic assessments by accounting the water level position, which is an important source of uncertainty, and sometimes underestimated or even neglected. The methodology applied in this paper consists of performing advanced 3D finite element models of the entire system (soil + foundation + structure) that allow consideration of the soil nonlinear mechanisms of shear deformation. In particular, different positions of water level were considered in order to assess several saturated conditions among the homogenous 20 m layer selected in the previous work []. The structural configuration performed is representative of the Italian residential buildings that were mainly damaged during the Irpinia–Basilicata earthquake, and consists of a reinforced concrete (RC) structure with infilled masonry walls. In particular, the documentary sources are based on two main typologies of technical data preserved in local archives: the “Scheda A” and “Scheda B” (Figure 1), which report the damages to the buildings and were fundamental tools to detect the level of damage to the buildings, [,]. These were used to summarize the data from the surveys that were carried out in two phases: the first, to evaluate the conditions of the entire building (Scheda A) and the second, to verify the effects on each housing unit (Scheda B) []. Other important documents are the recovery plans (named “Piani di Recupero”) of the historical centres, and sources used to analyse the outcomes of the earthquake at the urban scale. For an extended literature review, please refer to []. Results in terms of settlements, accelerations, base shear forces and floor displacements are calculated in order to assess the most detrimental positions of the water level.
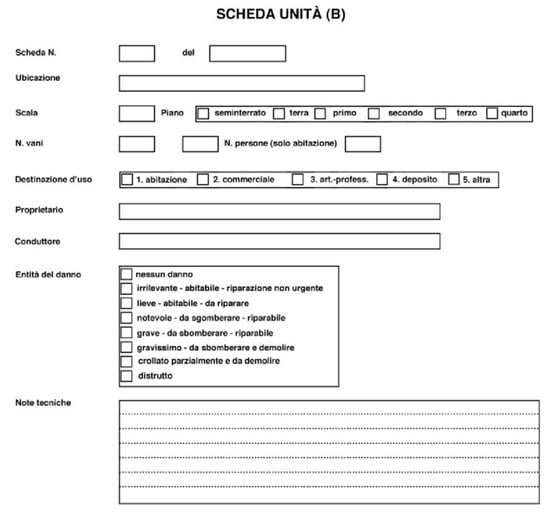
Figure 1.
Example of Scheda B [].
2. The Irpinia–Basilicata Earthquake
The 23 November 1980 Irpinia–Basilicata earthquake (Figure 2) may be considered one of the strongest earthquakes recorded in Italy [,,,,,,], causing profound changes in communities and extended damages to civil structures and infrastructures. In particular, [] conducted an extended literature review showing that the knowledge of the damages focused on some of Campania’s and Basilicata’s most heavily damaged towns, but without a systematic study. In particular, estimations assessed that approximately 1.85 million buildings were involved in the event, with 75,000 destroyed, 275,000 seriously damaged and 480,000 slightly damaged. In addition, the environmental effects induced by the 23 November 1980 Irpinia–Basilicata earthquake were also significantly severe since primary and secondary effects (such as hydrological variations and liquefaction-induced mechanism) brought important natural modifications to the natural conditions [], such as ground deformations, slopes, landslides, lateral displacements and settlements, which were extensively documented by several contributions [,,,,,,].
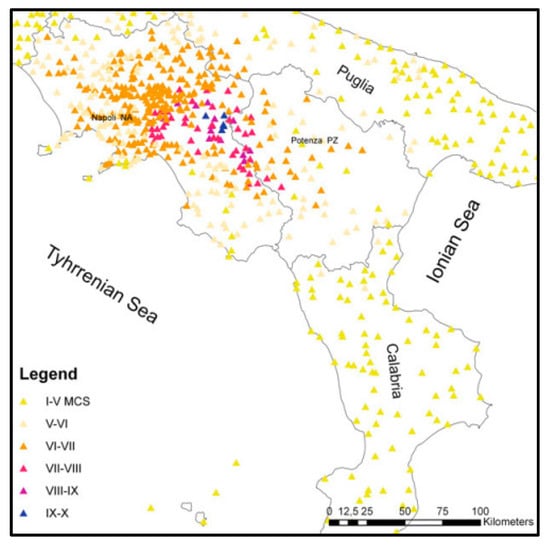
Figure 2.
Macroseismic field of the 23 November 1980 Irpinia–Basilicata earthquake [] (MCS= Mercalli Cancani Sieberg scale).
The damaged buildings consisted mostly of reinforced concrete (RC) structures characterised by infilled masonry walls (IMWs), the object of this paper (see next section). Specific studies were carried on as recovery plans (named “Piani di Recupero”) and described the procedures to recover the historical centres. These plans are useful as sources of information regarding the seismic effects at the urban scale [,,,,,,].
3. Methodology
SSI consists of several mechanisms that define the mutual behaviour of the soil, the foundation and the building, and consequently affect the structural performance. The water level depth modifies the vertical pressures in the soil and thus the shear mechanisms that cause soil deformations and settlements at foundation levels, and, consequently, stresses in the superstructures that affect the whole behaviour of the system. The proposed 3D finite element models (Figure 3) aim to reproduce these complex nonlinear mechanisms to represent realistically the behaviour of the entire system (soil + foundation + structure). This goal is particularly challenging because of the mutual effects of two sources of nonlinearity: the shear mechanisms in the soil and the structural behaviours. The study proposed here is based on the previous contribution [], here extended to consider the role of water level depth.
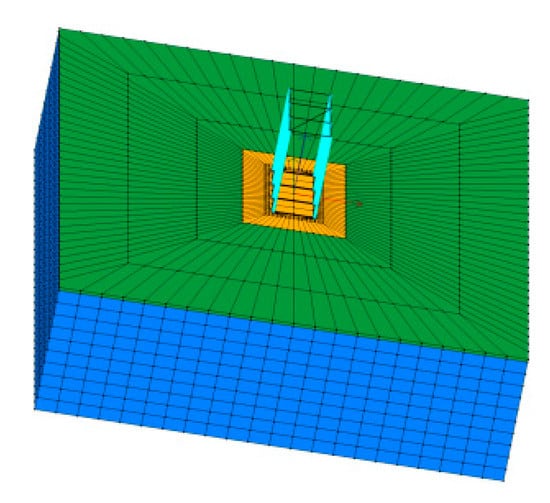
Figure 3.
Mesh 2: soil–structure interaction (SSI) model; uniform soil layer (blue), infill (green) and foundation (yellow) [].
The input motion performed (Figure 4), selected from the Italian Accelerometric Archive [], consists of the registration at the Sturno (STN) station (latitude: 41.0183°, longitude: 15.1117°) in Avellino, Campania, which is defined on soil B (following the Eurocode 8 classification); more details are available in [].
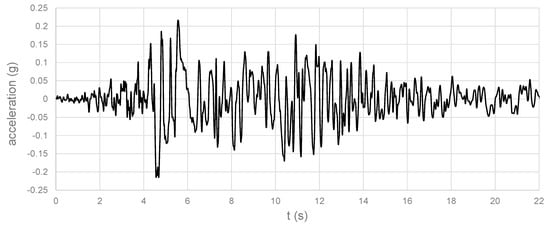
Figure 4.
Selected input motion (longitudinal direction) [].
The tridimensional (3D) models performed are based on the u–p formulation (u is the displacement of the soil skeleton and p is the pore pressure), defined in detail in [] and []. The Pressure Depend Multi Yield02 model [,], selected to represent the soil layer, consists of a multi-yield-surface plasticity framework that may reproduce the mechanism of cycle-by-cycle permanent shear strain accumulation in incoherent soil materials, as shown in []. The model is based on the definition of several parameters, such as the low-strain shear modulus, the friction angle, shear wave velocity and permeability, shown in Table 1. In particular, an equivalent uniform linear layer was adopted in order to calculate the soil fundamental periods []. Note that the paper aims to reproduce a historical event and geotechnical parameters for superficial layers are currently not available for the Irpinia–Basilicata earthquake, as specified in []. The data that are necessary to be implemented in a numerical model require material characterizations with in situ tests that are impossible 40 years after the earthquake occurred, since soil materials and hydraulic conditions have changed significantly. Therefore, the values in Table 1 were defined on the available information (mainly []) and the free-field study that was carried out in [].

Table 1.
Soil characteristics.
Figure 5 shows the water levels performed, corresponding to the six numerical models that were performed in this study. The dimensions of the mesh were calibrated with a calibration procedure [] and the final ones were 118.4 × 124.4 × 20.5 m. A total of 31,860 nodes and 35,868 20-node BrickUP elements were applied, following the previous contributions [,,]. As explained in [], S2 is implemented amongst the soil materials that were considered in Table 1.
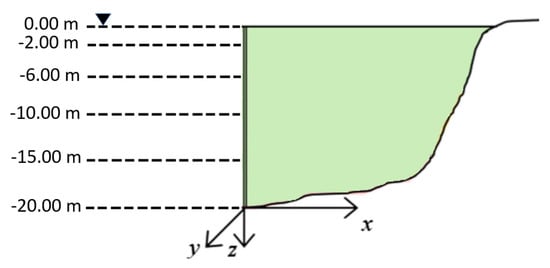
Figure 5.
Performed water levels.
Boundary conditions are fundamental when SSI analyses are carried out, especially to represent correctly the development of pore pressures. The penalty method with a tolerance value of 10−4 was chosen to ensure strong constrain conditions without computational problems associated with conditioning of the system of equations (more details in [,]). Base boundaries (20.5 m depth) were considered rigid and all the directions were constrained. In order to allow shear deformations, longitudinal and transversal directions were left unconstrained in correspondence with the lateral boundaries, while the vertical direction (described by the third Degree of Freedom (DOF) of the nodes) was constrained. Hydraulic conditions were defined on the fourth DOF of each node that were blocked during the gravity analyses (step 1) and then released when hydraulic conditions were applied (more details in [,]).
The structure consists of an RC building with infill masonry walls (RCIMW) as a benchmark, in order to represent the Italian residential buildings that were mostly damaged during the 1980 Irpinia–Basilicata earthquake, and already studied in []. Figure 6 shows the structural scheme consisting of 4 × 2 columns (4 columns in the transversal direction (spaced 8 m apart) and 2 columns in the longitudinal direction (spaced 10 m apart) and 3 floors (a 3.4 m-storey height, 10.2 m total height). RCMIW is a typical Italian system based on two schemes (Figure 6): RC concrete columns and beams are superposed on vertical masonry walls. It is worth noting that the structural configuration performed here is a simplified version of frame-type buildings because detailed information should have required material characterizations with in situ tests that are almost impossible after 40 years from the earthquake, since the conditions of the materials could have changed significantly. Both vertical and horizontal elements are composed by RC concrete columns and beams, respectively, and characterized by fibre section models. Concrete02 material (Figure 7a,b []) is chosen to model the core and the cover portions. A total of 30 bars are used and represented by Steel02 material (Figure 7c []). The masonry walls are modelled as equivalent diagonal elastic Beam Column elements [,], in both longitudinal and transversal directions. The masonry walls properties are selected based on the Italian code provisions, as shown in []. Table 2 shows the vibration periods of the structure with and without the infill masonry walls, related to the fixed-base condition (no SSI effects included). It is worth seeing that the masonry walls affect the structural natural period (from 0.3012 to 0.2085 s), since they increase the lateral stiffness of the whole structure (as shown in []).
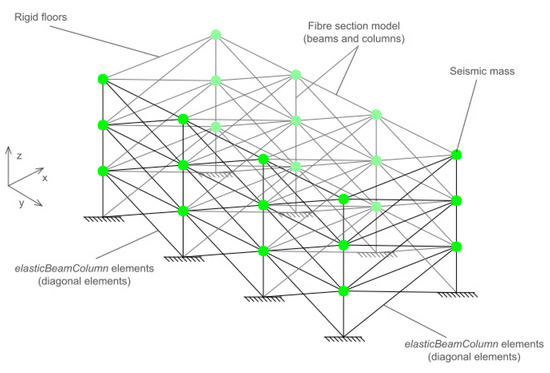
Figure 6.
Structural 3D model [].
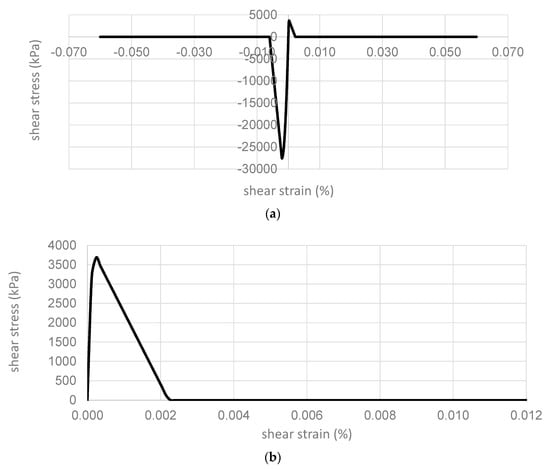
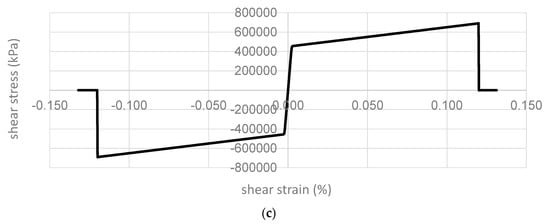
Figure 7.
Shear stress vs. shear strain relationship for Concrete02: core (a) and cover (b) and Steel02 (c) [].
Table 2.
Structural periods; reinforced concrete (RC), infill masonry walls (IMWs).
The foundation is modelled as a 0.50 m-deep rectangular concrete raft foundation (28.4 × 34.4 m) in order to represent recurring shallow foundation typologies for residential buildings. The foundation considered is assumed to be rigid, by tying all the columns base nodes together with those of the soil domain surface, using equalDOF [,]. The foundation is modelled with an equivalent concrete material, by applying the Pressure Independent Multi-Yield model [,] (Table 3). The first 0.5 m-deep soil layer around the foundation is modelled with a backfill defined by the Pressure Depend Multi Yield model [,] and Table 4 shows the adopted parameters, such as the low-strain shear modulus, the friction angle and the permeability. The number of yield surfaces is equal to 20.
Table 3.
Foundation.
Table 4.
Infill soil characteristics.
4. Results
This section shows the results of the models performed, focusing on the performance of the soil, the foundation and the structure. The vertical stresses in the soil depend on the weight of the water for those models where the material is submerged and saturated conditions occur. It is worth noting that the effects connected with the water level can potentially be related with liquefaction occurrence, which is not considered in this paper because no historical relevancies of such phenomenon were found in the literature.
4.1. Soil Results
Significant values of the main soil parameters are herein compared in correspondence with different positions and different water depths, with particular attention to the role of water level. Figure 8, Figure 9, Figure 10, Figure 11 and Figure 12 show the relationship between the effective confinement pressures and the shear stress at various depths in correspondence with model-10 m that was chosen herein to underline the two different conditions of saturated and dry soil. It is worth noticing the role of the water in generating several levels of confinement and the increase of the shear stress with the soil depth. In order to ensure that liquefaction did not occurred, the pore pressure ratio (ru), defined as the ratio between the total pore pressure and the total overburden pressure [,], was calculated and it was verified that the maximum value (0.57) was significantly smaller than 1, the value that is considered for liquefaction occurrence. Figure 7 and Figure 8 show the conditions of dry soil and that the effective confinement pressures depend on the vertical stresses. The role of the water in increasing the effective confinement is shown in Figure 10, Figure 11 and Figure 12, where it is possible to see the maximum level reached for the several depths: approximately 170, 220 and 250 kPa corresponding to depths of 11.50, 15.50 and 19.50 m, respectively.
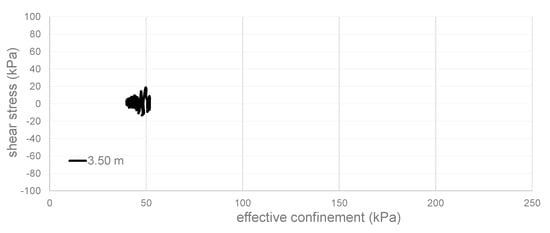
Figure 8.
Model-10 m: effective confinement vs. shear stress at 3.50 m depth.
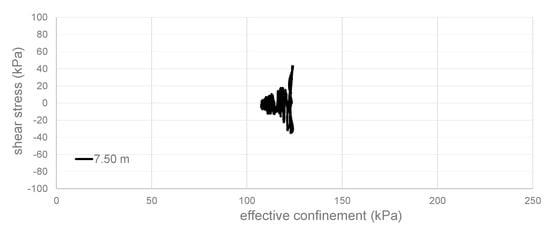
Figure 9.
Model-10 m: effective confinement vs. shear stress at 7.50 m depth.
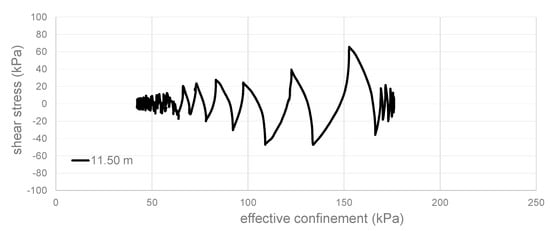
Figure 10.
Model-10 m: effective confinement vs. shear stress at 11.50 m depth.
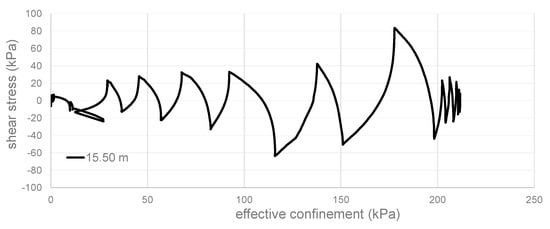
Figure 11.
Model-10 m: effective confinement vs. shear stress at 15.50 m depth.
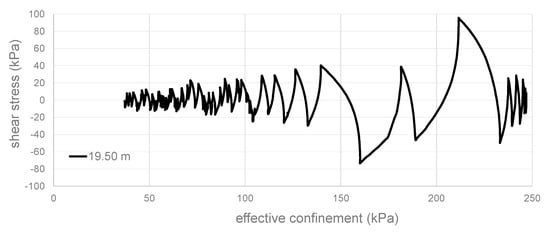
Figure 12.
Model-10 m: Effective confinement vs. shear stress at 19.50 m depth.
Figure 13 and Figure 14 show the acceleration time histories in correspondence with the two extreme conditions (fully saturated and dry) at the surface and at −16.5 m depth. It is worth seeing that in the lower layers, dry conditions (water level at −20 m, Figure 14) are shown to be more detrimental while at the surface fully saturated conditions show large acceleration values (Figure 13).
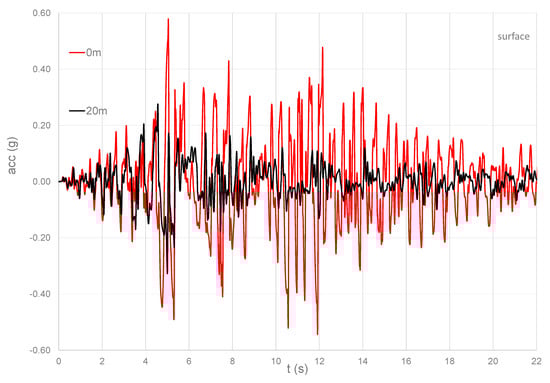
Figure 13.
Acceleration time histories at the surface for model-0 m and model-20 m.
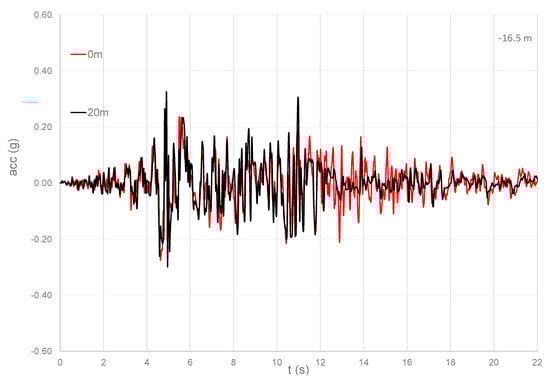
Figure 14.
Acceleration time histories at −16.5 m depth model-0 m and model-20 m.
4.2. Foundation Results
Foundation settlements (mainly differential) are one of the most significant causes of damage, depending on several parameters, like material quality, geometry of the structure, amount of openings, type of foundation or the actual state of preservation. Figure 15 shows the time history of absolute settlements (in the centre of the foundation) for the various models, demonstrating the role of the water level depth in the development of settlements. It is worth noting that the settlements start in correspondence with the peak of the input motion (compare with Figure 4); they increase and then they remain stable around the residual values (Table 5). These values were verified to be lower than the condition defined as serviceability level SLS1 (1/25) in the New Zealand code (NZS 1170.0:2002). It is worth considering that the calculated values are not comparable with liquefaction occurrence (compare with the values assessed in [,]).
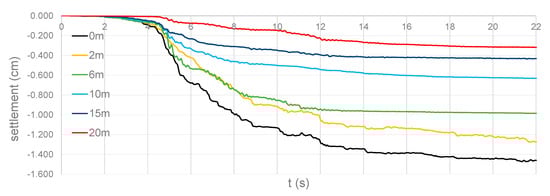
Figure 15.
Foundation settlements.
Table 5.
Foundation settlements.
Figure 16 shows the normalized foundation tilt time histories, defined as the ratio between the differential foundation settlements and the width (along the longitudinal direction: 15 m). It is worth seeing that the tilts are related with the water level depths (maximum values: 1.20% and 0.60% for water levels at the surface and at −2 m depth, respectively). In addition, the main tilts are shown between 5–12 s, where the water level at the surface is shown to be at the most detrimental condition. At the end of the motion, the values of the tilts (particularly for 0 and −2 m) increase due to shear resistance and associated accumulation of permanent deformations in the soil []. It is important to notice that these nonlinear mechanisms were reproduced thanks to the 3D numerical models performed, which implemented advanced material models and procedures developed inside the OpenSees platform [,]. The permanent deformations in the soil and the foundation tilts are both responsible for transferring significant stress to the superstructure and thus contribute to the SSI effects (shown in [,,]) and described in the next section.
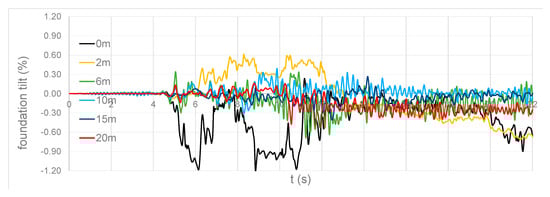
Figure 16.
Foundation tilts.
4.3. Structural Results
This section investigates the role of the water level on the structural performance in terms of shear forces at the base of the column and floor displacements at the top of the structure. Figure 17 and Figure 18 show the relationship between the longitudinal displacements and base shear forces in the fully saturated case (0 m) and the dry case (20 m). It is worth noticing the different values of the displacements, due to the levels of deformations that occur in the soil, in correspondence with the two different water levels and that depend on the local soil effects, as discussed in []. The fully saturated case shows values of displacement that are more than two times the ones that occur for the dry case. The values of the shear forces are different as well, with maximum values of 390 kN for the case of 0 m (Figure 17 and []) and 307 kN for the case of 20 m (Figure 18). In particular, the maximum tensile stresses are approximately 65 kPa (for Model-0 m) and 53 kPa (for model-20 m), corresponding to two different levels of damage and thus the potential collapse mechanisms of the masonry wall [].
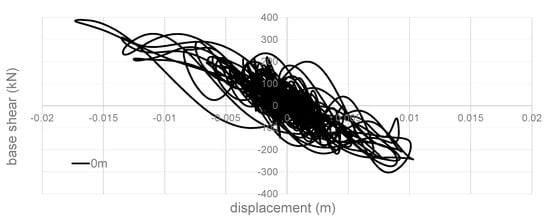
Figure 17.
Model-0 m: base shear.
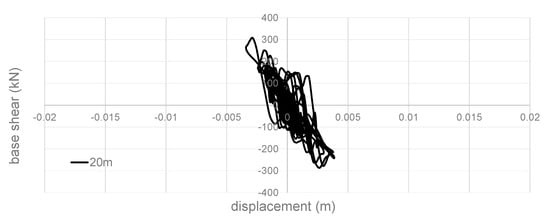
Figure 18.
Model-20 m: base shear.
To consider the effects of the structural performance, Figure 19 shows the time histories of the floor displacements (for all the performed models) in correspondence with the top of the building. Table 6 shows the maximum displacements, demonstrating that in the case of fully saturated conditions (0 m), maximum displacements are more than four times the values reached for the dry conditions (20 m). Comparing the results in correspondence with the different levels, it is possible to see that the peak values (around 6 and 12 s) of the displacements are reached for the highest positions of the water level (at the surface and −2 m). Regarding the values of the displacements at the end of the transient, intermediate water level positions (−6, −10 and −15 m) are shown to be the most detrimental conditions. These results may depend on the delay in developing permanent deformations due to the highly nonlinear mechanisms, both in the soil and in the structure. The results also show the importance of performing the 3D advanced models to represent realistically the interaction between soil deformability and structural flexibility.
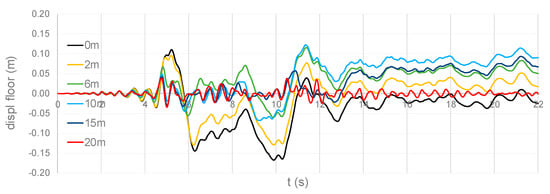
Figure 19.
Top displacement time histories.
Table 6.
Maximum top displacements.
5. Discussion
The results demonstrated the role of the water level in modifying the response of the entire system (ground–foundation–structure), with particular attention to the consequences on the structure. In this regard, as shown in [], the presence of the masonry infill walls increases the lateral stiffness and introduces different mechanisms that significantly modify the seismic behaviour, and thus the structural vulnerability of the structure. In particular, the role of the shallow foundation is important in affecting the global stability of the system, being particularly sensitive to the nonlinear soil behaviour (such as gapping, sliding and uplift) that may lead to an unconservative prediction of the superstructure response, as shown in []. The role of the water level was demonstrated to be relevant, especially in correspondence with the base floors, which are characterized by large displacements that contribute to the failure of the diagonal elements (representing the masonry infill walls). In this regard, the global behaviour of the system is affected by the complex of mutual nonlinear effects of the soil and of the structure that is generally recognized as SSI, and that depends on the dynamic characteristics of the structure and the foundation soil. By this way, performing 3D advanced nonlinear numerical models was fundamental in order to assess realistic estimations of the structural vulnerability.
6. Conclusions
The paper investigates the role of the water level on a typical Italian building during the 23 November 1980 Irpinia–Basilicata earthquake by performing several 3D numerical models of the entire system (soil–foundation–structure). The finite element models were built with the advanced computational framework OpenSeesPL in order to assess the several mechanisms known globally as soil–structure interaction (SSI). The results show that the shear mechanisms and the consequent permanent deformations inside the soil are driven by the presence of the water. Therefore, knowing the position of the water level (and eventually how it changes during the seasons) is fundamental in order to assess the seismic vulnerability of structural configurations. In the case of masonry buildings, the water level may affect significantly the whole stability of the buildings, both in terms of settlements (absolute or tilts) and the failure mechanisms in correspondence with the structural wall. Although the findings are limited to the specified conditions performed, they may potentially be useful to propose formulations within code provisions.
Funding
This research received no external funding.
Conflicts of Interest
The author declares no conflict of interest.
References
- Wang, C.Y.; Dreger, D.S.; Wang, C.H.; Mayeri, D.; Berryman, J.G. Field relations among coseismic ground motion, water level change and liquefaction for the 1999 Chi-Chi (Mw 7.5) earthquake, Taiwan. Geophys. Res. Lett. 2003, 30. [Google Scholar] [CrossRef]
- Charlie, W.A.; Doehring, D.O. Groundwater table mounding, pore pressure, and liquefaction induced by explosions: Energy-distance relations. Rev. Geophys. 2007, 45. [Google Scholar] [CrossRef]
- Nishiwaki, K.; Yasuhara, K.; Komine, H.; Murakami, S. Displacement and countermeasures for existing structure with rising groundwater levels. In Proceedings of the 8th Japan National Symposium on Environmental Geotechnology, Shanghai, China, 2–5 June 2009; pp. 381–384. [Google Scholar]
- Yasuda, S.; Ishikawa, K. Effect of lowering the ground water table as the countermeasure against liquefaction-induced damage to houses. J. Jpn. Assoc. Earthq. Eng. 2015, 15, 205–219. [Google Scholar]
- Hartantyo, E.; Brotopuspito, S.K. Sismanto; Waluyo. Correlation of shallow groundwater levels with the liquefaction occurrence cause by May 2006 earthquake in the south volcanic-clastic sediments Yogyakarta, Indonesia. Int. J. Appl. Sci. 2014, 5, 1–8. [Google Scholar]
- Chung, J.W.; Rogers, J.D. Influence of assumed groundwater depth on mapping liquefaction potential. Environ. Eng. Geosci. 2013, 19, 377–389. [Google Scholar] [CrossRef]
- Santisi d’Avila, M.P.; Lenti, L.; Martino, S.; Romeo, R.W. Nonlinear Numerical Simulation of the Soil Seismic Response to the 2012 Mw 5.9 Emilia Earthquake Considering the Variability of the Water Table Position. Bull. Seismol. Soc. Am. 2019, 109, 505–524. [Google Scholar] [CrossRef]
- Morgan, C.P.; Stolt, M.H. A comparison of several approaches to monitor water-table fluctuation. Soil Sci. Soc. Am. J. 2004, 68, 562–566. [Google Scholar] [CrossRef]
- Calzolari, C.; Ungaro, F. Predicting shallow water table depth at regional scale from rainfall and soil data. J. Hydrol. 2012, 414, 374–387. [Google Scholar] [CrossRef]
- Simonson, G.H.; Boersma, L. Soil morphology and water table relations: II. Correlaion between annual water table fluctuations and profile features. Soil Sci. Soc. Am. J. 1972, 36, 649–653. [Google Scholar] [CrossRef]
- Morgan, C.P.; Stolt, M.H. Soil morphology-water table cumulative duration relationships in Southern New England. Soil Sci. Soc. Am. J. 2006, 70, 816–823. [Google Scholar] [CrossRef]
- He, X.; Vepraskas, M.J.; Skaggs, R.W.; Lindbo, D.L. Adapting a drainage model to simulate water table levels in coastal plain soils. Soil Sci. Soc. Am. J. 2002, 67, 1722–1731. [Google Scholar] [CrossRef]
- Westaway, R.; Jackson, J. Surface faulting in the Southern Italian Campania-Basilicata earthquake of 23 November 1980. Nature 1984, 312, 436–438. [Google Scholar] [CrossRef]
- Cotecchia, V. Ground deformations and slope instability produced by the earthquake of 23 November 1980 in Campania and Basilicata. In Proceedings of the International Symposium Engineering Geology Problems in Seismic Areas, Bari, Italy, 13–19 April 1986; Volume 5, pp. 31–100. [Google Scholar]
- Del Prete, M. Examples of mudslides hazard in Southern Apennines (Italy). Ann. Geofisica 1993, 36, 71–80. [Google Scholar]
- Esposito, E.; Gargiulo, A.; Iaccarino, G.; Porfido, S. Distribuzione dei fenomeni franosi riattivati dai terremoti dell’Appennino meridionale. Censimento delle frane del terremoto del 1980. In Proceedings of the International Convention on Prevention of Hydrogeological Hazards, Torino, Italy; 1998; pp. 409–429. [Google Scholar]
- Pantosti, D.; Valensise, G. Source geometry and long-term behavior of the 1980 fault based on field geologic observations. Ann. Geofisica 1993, 36, 41–49. [Google Scholar]
- Gizzi, F.T.; Potenza, M.R.; Zotta, C. 23 November 1980 Irpinia–Basilicata earthquake (Southern Italy): Towards a full knowledge of the seismic effects. Bull. Earthq. Eng. 2012, 10, 1109–1131. [Google Scholar] [CrossRef]
- Nunziata, C.; Costa, G.; Marrara, F.; Panza, F. Validted Estimation of Response Spectra for the 1980 Irpinia Earthquake in the Eastern Area of Naples. Earthquake Spectra 2000, 16. [Google Scholar] [CrossRef]
- Ameri, G.; Emolo, A.; Pacor, F.; Gallovič, F. Ground-Motion Simulations for the 1980 M 6.9 Irpinia Earthquake (Southern Italy) and Scenario Events. Bull. Seismol. Soc. Am. 2011, 101, 1136–1151. [Google Scholar] [CrossRef]
- Westaway, R.; Jackson, J. The earthquake of 1980 November 23 in Campania–Basilicata (Southern Italy). Geophys. J. R. Astron. Soc. 1987, 90, 375–443. [Google Scholar] [CrossRef]
- Bernard, P.; Zollo, A. The Irpinia (Italy) 1980 earthquake: Detailed analysis of a complex normal faulting. J. Geophys. Res. 1989, 94, 1631–1648. [Google Scholar] [CrossRef]
- Porfido, S.; Esposito, E.; Michetti, A.M.; Blumetti, A.M.; Vittori, E.; Tranfaglia, G.; Guerrieri, L.; Ferreli, L.; Serva, L. Areal distribution of ground effects induced by strong earthquakes in the Southern Apennines (Italy). Surv. Geophys. 2002, 23, 529–562. [Google Scholar] [CrossRef]
- Porfido, S.; Alessio, G.; Gaudiosi, G.; Nappi, R.; Spiga, E. The resilience of some villages 36 years after the Irpinia-Basilicata (Southern Italy) 1980 earthquake. In Proceedings of the 4th WLF, Ljubljana, Slovenia, 29 May–2 June 2017; Mikoš, M., Vilímek, V., Yin, Y., Sassa, K., Eds.; Springer: Cham, Switzerland, 2017; pp. 121–133. [Google Scholar] [CrossRef]
- Pingue, F.; De Natale, G. Fault mechanism of the 40 seconds subevent of the 1980 Irpinia (Southern Italy) earthquake from levelling data. Geophys. Res. Lett. 1993, 20, 911–914. [Google Scholar] [CrossRef]
- Ascione, A.; Mazzoli, S.; Petrosino, P.; Valente, E. A decoupled kinematic model for active normal faults: Insights from the 1980, MS = 6.9 Irpinia earthquake, Southern Italy. Geol. Soc. Am. Bull. 2013, 125, 1239–1259. [Google Scholar] [CrossRef]
- Mina, D.; Forcellini, D. Soil–Structure Interaction Assessment of the 23 November 1980 Irpinia Basilicata Earthquake. Geosciences 2020, 10, 152. [Google Scholar] [CrossRef]
- Khosravikia, F.; Mahsuli, M.; Ghannad, M.A. The effect of soil—Structure interaction on the seismic risk to buildings. Bull. Earthq. Eng 2018, 16, 3653–3673. [Google Scholar] [CrossRef]
- Cavalieri, F.; Correia, A.A.; Crowley, H.; Pinho, R. Dynamic soil-structure interaction models for fragility characterisation of buildings with shallow foundations. Soil Dyn. Earthq. Eng. 2020, 132, 106004. [Google Scholar] [CrossRef]
- Dashti, S.; Bray, J.D.; Pestana, J.M.; Riemer, M.; Wilson, D. Mechanisms of seismically induced settlement of buildings with shallow foundations on liquefiable soil. J. Geotech. Geoenviron. Eng. ASCE 2010, 136, 151–164. [Google Scholar] [CrossRef]
- Gizzi, F.; Masini, N. Il terremoto irpino del 23 Novembre 1980 a Tursi: Dal dato parametrico a quello descrittivo. In Tursi, La Rabatana; Fonseca, C.D., Ed.; Fondazione Sassi Matera: Matera, Italy, 2004; pp. 305–316. [Google Scholar]
- Benedetti, D.; Petrini, V. On seismic vulnerability of masonry buildings: Proposal of an evaluation procedure. L’Industria Costr. 1984, 18, 66–78. [Google Scholar]
- Postpischl, D.; Branno, A.; Esposito, E.; Ferrari, G.; Marturano, A.; Porfido, S.; Rinaldis, V.; Stucchi, M. The Irpinia earthquake of November 23, 1980. Atlas Isoseismal Maps Ital. Earthq. 1985, 114, 152–157. [Google Scholar]
- Porfido, S.; Esposito, E.; Vittori, E.; Tranfaglia, G.; Michetti, A.M.; Blumetti, M.; Ferreli, L.; Guerrieri, L.; Serva, L. The geological evidence for earthquakes induced effects in the Southern Apennines (Italy). Surv. Geophys. 2002, 23, 529–562. [Google Scholar] [CrossRef]
- Locati, M.; Camassi, R.; Rovida, A.; Ercolani, E.; Bernardini, F.; Castelli, V.; Caracciolo, C.H.; Tertulliani, A.; Rossi, A.; Azzaro, R.; et al. DBMI15, the 2015 Version of the Italian Macroseismic Database; INGV: Rome, Italy, 2016. [Google Scholar] [CrossRef]
- Porfido, S.; Alessio, G.; Avallone, P.; Gaudiosi, G.; Lombardi, G.; Nappi, R.; Salvemini, R.; Spiga, E. The 1980 Irpinia-Basilicata earthquake: The environmental phenomena and the choices of reconstruction. In Proceedings of the EGU General Assembly 2016, Vienna, Austria, 17–22 April 2016. [Google Scholar]
- Serva, L.; Esposito, E.; Guerrieri, L.; Porfido, S.; Vittori, E.; Comerci, V. Environmental Effects from some historical earthquakes in Southern Apennines (Italy) and macroseismic intensity assessment. Contribution to INQUA EEE scale project. Quat. Int. 2007, 173, 30–44. [Google Scholar] [CrossRef]
- Porfido, S.; Esposito, E.; Guerrieri, L.; Vittori, E.; Tranfaglia, G.; Pece, R. Seismically induced ground effects of the 1805, 1930 and 1980 earthquakes in the Southern Apennines, Italy. Ital. J. Geosci. 2007, 126, 333–346. [Google Scholar]
- Blumetti, A.M.; Esposito, E.; Ferreli, L.; Michetti, A.M.; Porfido, S.; Serva, L.; Vittori, E. New data on the novembre 23, 1980, M 6.9, Irpinia-Lucania earthquake (Southern Apennine) coseismic surface effects. Studi Geol. Camerti 2002, 2002, 19–27. [Google Scholar]
- Carulli, G.B.; Migliacci, A.; Onofri, R.; Porfido, S. Indagini geologiche ed ingegneristiche in prospettiva sismica a S. Michele di Serino (AV). Rend. Della Soc. Geol. Ital. 1981, 4, 161–164. [Google Scholar]
- Cotecchia, V.; Nuzzo, G. Hydrological study of the upper valley of the Sele and Ofanto River struck by the Novembre 23, 1980 earthquake. Geol. Appl. Idrogeol. 1986, 21, 65–95. [Google Scholar]
- Esposito, E.; Pece, R.; Porfido, S.; Tanfaglia, G. Hydrological anomalies connected to earthquakes in Southern Apennines (Italy). Nat. Hazards Earth Syst. Sci. 2001, 1, 137–144. [Google Scholar] [CrossRef]
- Galli, P. New empirical relationships between magnitude and distance for liquefaction. Tectonophysics 2000, 324, 169–187. [Google Scholar] [CrossRef]
- Rossi, M. Situazione, Problemi e Prospettive Dell’area più Colpita dal Terremoto del 23/11/1980; Einaudi: Torino, Italy, 1981. [Google Scholar]
- Verderosa, A. Legge 219/81 Ovvero la Distruzione Legalizzata Dei Centri Storici. In Civiltà Altirpina; Trimestrale, Anno I/lug-dic.90; 1990. Available online: http://verderosa.files.wordpress.com/2008/01/civilto-altirpinia1990.pdf (accessed on 13 June 2020).
- AAVV. Indagini di Microzonazione Sismica CNR-PFG; CNR-PFG: Rome, Italy, 1983; p. 221. [Google Scholar]
- Gimma, M.G. I Piani di Recupero nei Centri Storici, in Atti del Convegno e Mostra Roma; Bema Editrice: Roma, Italy, 1987. [Google Scholar]
- Giuffrè, A. Centri storici in Zona Sismica, Analisi Tipologica Della Danneggiabilità e tecnichedi Intervento Conservativo, Castelvetere sul Calore; in Studi e ricerche. Sulla sicurezza sismica dei Monumenti. Master’s Thesis, Università La Sapienza, Facoltà di Architettura, Roma, Italy, 1988. [Google Scholar]
- Ordine Architetti Avellino. Immagini di architettura 1980−1990; Jacelli: Avellino, Italy, 1991. [Google Scholar]
- ITACA. ITalian ACcelerometric Archive (1972−2011); Version1.1. 2011. Available online: http://itaca.mi.ingv.it/ItacaNet/ (accessed on 13 June 2020).
- Zienkiewicz, O.C.; Chan, A.H.C.; Pastor, M.; Paul, D.K.; Shiomi, T. Static and dynamic behavior of soils: A rational approach to quantitative solutions: I. Fully saturated problems. Proc. R. Soc. Lond. Ser. A 1990, 429, 285–309. [Google Scholar]
- Elgamal, A.; Lu, J.; Forcellini, D. Mitigation of Liquefaction-Induced lateral deformation in sloping stratum: Three-dimensional Numerical Simulation. J. Geotech. Geoenvironmental Eng. 2009, 135, 1672–1682. [Google Scholar] [CrossRef]
- Lu, J.; Elgamal, A.; Yang, Z. OpenSeesPL: 3D Lateral Pile-Ground Interaction, User Manual, Beta 1.0; 2011. Available online: http://soilquake.net/openseespl/ (accessed on 13 June 2020).
- Mazzoni, S.; McKenna, F.; Scott, M.H.; Fenves, G.L. Open System for Earthquake Engineering Simulation, User Command-Language Manual; OpenSees Version 2.0; Pacific Earthquake Engineering Research Center, University of California, Berkeley: Berkeley, CA, USA, 2009; Available online: http://opensees.berkeley.edu/OpenSees/manuals/usermanual (accessed on 13 June 2020).
- Yang, Z.; Elgamal, A.; Parra, E. A computational model for cyclic mobility and associated shear deformation. J. Geotech. Geoenviron. Eng. 2003, 129, 1119–1127. [Google Scholar] [CrossRef]
- Kramer, S.L. Geotechnical Earthquake Engineering; International Series in Civil Engineering and Engineering Mechanics; William, J., Ed.; Prentice-Hall: Upper Saddle River, NJ, USA, 1996. [Google Scholar]
- Forcellini, D.; Gobbi, S.; Mina, D. Numerical Simulations of Ordinary Buildings with Soil Structure Interaction. In Proceedings of the SEMC 2016, Alphose Zingoni, Insights and Innovations in Structural Engineering, Mechanics and Computation, Cape Town, South Africa, 5–7 September 2016; pp. 364–369, ISBN 978-1-138-02927-9. [Google Scholar]
- Forcellini, D. Cost Assessment of isolation technique applied to a benchmark bridge with soil structure interaction. Bull. Earthq. Eng. 2017. [Google Scholar] [CrossRef]
- Forcellini, D. Seismic Assessment of a benchmark based isolated ordinary building with soil structure interaction. Bull. Earthq. Eng. 2018. [Google Scholar] [CrossRef]
- Forcellini, D. Numerical simulations of liquefaction on an ordinary building during Italian (20 May 2012) earthquake. Bull. Earthq. Eng. 2019. [Google Scholar] [CrossRef]
- Forcellini, D. Soil-structure interaction analyses of shallow-founded structures on a potential-liquefiable soil deposit. Soil Dyn. Earthq. Eng. 2020, 133, 106108. [Google Scholar] [CrossRef]
- Furtado, A.T.; Rodrigues, H.; Arede, A.; Varum, H.; Grubisic, M.; Sipos, T.K. Prediction of the earthquake response of a three-storey infilled RC structure. Eng. Struct. 2018, 171, 214–235. [Google Scholar] [CrossRef]
© 2020 by the author. Licensee MDPI, Basel, Switzerland. This article is an open access article distributed under the terms and conditions of the Creative Commons Attribution (CC BY) license (http://creativecommons.org/licenses/by/4.0/).