Article

The Discovery of the Theater of Akragas (Valley of Temples, Agrigento, Italy): An Archaeological Confirmation of the Supposed Buried Structures from a Geophysical Survey

1
Department of Human, Social and Educational Science, University of Molise, Via De Sanctis, 86100 Campobasso, Italy
2
Institute of Heritage Sciences, National Council of Researches, Via Salaria Km. 29,300, Monterotondo St., 00015 Rome, Italy
3
Department of Human Science, University of Catania, Piazza Dante 32, 95100 Catania, Italy
*
Author to whom correspondence should be addressed.
Geosciences 2020, 10(5), 161; https://doi.org/10.3390/geosciences10050161
Submission received: 27 March 2020 / Revised: 27 April 2020 / Accepted: 28 April 2020 / Published: 29 April 2020

Abstract

:
The theater of the ancient city of Akragas has been researched for centuries and, in 2016, a multidisciplinary and multi-scale research work that involved topographic studies, analysis of satellite images, geomorphological characterization of the land, archaeological surveys, and non-invasive geophysical surveys led to its discovery. In this work, a comparison between the archaeological structures hypothesized by geophysical results and the archaeological structure excavated is presented. The area of about 5.500 m2 was investigated using electrical resistivity tomography (ERT). The survey highlighted a series of resistivity highs arranged on concentric semicircles defining perfectly the presence of an articulate building attributable to a theatrical complex of imposing dimensions (diameter of about 95 m). Archaeological excavation led to the identification of the summa cavea with the discovery of foundation-level structures arranged on a semicircle, on which the tiers were located, and cuts in the rock with seat imprints. The overlap of the technical layouts obtained from the documentation of archaeological excavation on the modelled resistivity maps shows the perfect correspondence between the features of the resistivity highs and the ancient structures actually found.

1. Introduction

The city of Agrigento is located in southeastern Sicily (Italy) (Figure 1a). From the geological point of view, the area is characterized by the presence of a regressive Pleistocenic succession consisting of clay, sand, and calcarenite. From below upwards, it is possible to distinguish a basement from the Miocene and Pliocene epoch followed, in transgression by white marl (Trubi Formation) and, further up, by clayey marly terrains (Mt. Narbone and Agrigento formations). Closing the lithostratigraphic succession, Sicilian and Thyrrenian terraced marine deposits and debris, alluvial and coastal deposits can be observed [1]. Choice of the site for setting of the city of Akragas (ancient name of Agrigento) was suggested by the presence of calcarenitic escarpments that provided a natural protection by enemies and the raw material for building construction.
The frontier position with the Punic-controlled territories that occupied the western area of the island in the archaic and classical ages constituted the fortune of the city, which, in classical times, was one of the most important and richest Sicilian polis (city) [2,3,4].
After the battle of Himera, in 480 B.C., the monumental urban structure was completed, marked by regular blocks of 35 × 130 m (Figure 1b) realized on imposing terraces, the main temples were built (Figure 1c,d), and the fortifications were completed. The economic system of the city was based on the exploitation of the chora (the territory outside the walls), on the trade of oil and wine with Carthage, on the organizations of important manufactures such as ceramics and, probably, textiles. After the defeat with Carthaginians, at the end of the fifth century B.C., the city was affected by a new period of monumentalization at the end of the fourth century, under the reign of Agatocle or the tyranny of Finzia (284–279 B.C.). Thus, the first theatrical structure was built, the space of the agora was rearranged with the construction of the imposing substructures to the west of this, and the housing quarters were implemented. At the same time, however, the artisan structures seem to abandon the city and the wealth of the polis, that was founded on the latifundium cultivated with wheat, moves to the countryside. As a consequence, the urban center increases the monumentalization of public spaces, the demographic rate seems likely to decrease, and artisan quarters and workshops for ceramic production close.
At the beginning of the second century B.C., after the Roman conquest of Agrigento, the city saw a new process of monumentalization of the central public space with the realization of the second phase of the theater, a wider organization of the sacred space around the agorà, the construction of two porticoed squares relative to the sanctuary of the Hellenistic-roman temple and the so-called sacellum of Faride which is flanked by the large building on which the church of S. Nicola was later built.
The theater of the ancient city of Akragas has been researched for centuries [5]. Its existence was reported by Frontinus, a Roman scholar of the end of the first century A.D. In his work, he narrates the expedient of Alcibiades who, in order to occupy the city during the Athenian expedition in Sicily, gathered all the citizens of Agrigento in the theater; although the story is erroneous because the episode is historically referred to Catania, the testimony of the existence of a theater in Akragas remains. In the sixteenth century, moreover, the scholar of antiquity Tommaso Fazello, in his writing De rebus Siculis, claims to have seen the remains of the theater, no more levelled, near the church of S. Nicola [6]. The Dutch traveller D’Orville, in the Sicula work of 1764, affirms that such a magnificent city, like the other Greek cities, could not have a theater building [7]. He thought to identify the remains reported by Fazello at the so-called Oratorio di Falaride. In the following years, this was the most suspected area. Muenter believed that the Cistercian Convent had obliterated the structures [8], the Pancrazi, however, already in 1751, confessed to have not traced the exact point [9]. It is not excluded that D’Orville has seen the surfacing remains of the ekklesiasterion (Figure 1b), which will be brought to light only in the 1960s, when the excavations, before the realization of the Museum, will reveal the articulated archaeological stratigraphy of this neuralgic area of the ancient city. Other hypotheses arose from the observation of the natural morphology of the territory, such as that of De Saint Non, which in 1785 placed the theater in a basin to the North [10] while Rezzonico proposed Poggio Meta [11], based on the toponym, as a site of a hippodrome.
Subsequently, starting from the forties of the last century, Griffo posed the problem of the site several times, oscillating between the suspect semicircular and sloping form of Ravanusella square in the modern city, and Poggio Meta, based on aerofotogrammetry [12,13,14].
In 2014, research conducted jointly by the Valley of the Temples Park, the Polytechnic of Bari, the Universities of Catania, Enna, Molise, and the Institute for Technologies Applied to Cultural Heritage (now recalled Institute of Heritage Sciences) of the National Council of Researches of Italy led to the discovery of the theater of Akragas [2,15,16]. The work was realized on several levels and with different techniques of analysis such as topographic studies, analysis of satellite images, geomorphological characterization of the land, geophysical surveys, and archaeological surveys. The non-invasive investigation played a significant role in providing detailed information on the exact location and size of the structure. In this work, a comparison between the archaeological structures hypothesized on the basis of geophysical surveys and the archaeological structure excavated is presented.

2. Materials and Methods

Non-invasive geophysical methods are a useful tool for the reconnaissance of buried structures into the soil [17,18]. The magnetic method, the induced electromagnetic technique, electrical resistivity tomography (ERT) and ground penetrating radar (GPR) are commonly employed to discover potential subsurface targets that could be related to ancient remnants.
The definition of the physical parameter to measure and analyze for the ideal characterization of a target in a definite context represents the principal problem during geophysical survey planning. Features such as the probable type, dimensions, and depth of the submerged bodies, the logistics of the investigated area, and the geological characterization of the soil must be carefully taken into consideration. In the examined case study, the electrical resistivity tomography (ERT) was evaluated as the best technique to meet the specific challenge of the survey mainly considering the uneven topography, the supposed height of structures (at least 4 m), and the physical properties of the potential remains (resistive targets). Numerous successful ERT applications are available in the current specialized literature [19,20,21,22,23,24,25,26,27,28,29,30,31].
The method involves the measurement of the electrical resistivity, a parameter that allows to readily distinguish the presence of buried archaeological structures, in principle, from the encompassing ground matrix [22,25,32,33]. In near surface prospections, as in the archaeological investigations, the dipole-dipole (DD) array is often used due to the sensitivity to lateral bounding of vertical features. Current and voltage dipoles are placed at a distance a apart and the space between dipoles is an integer multiple k of a. The DD apparent resistivity ρa, expressed in Ohm meter (Ω m), is thus given by
ρa = πak(k + 1)(k + 2)(Δφ/I)
where I is the intensity of the injected current and Δφ is the potential drop.
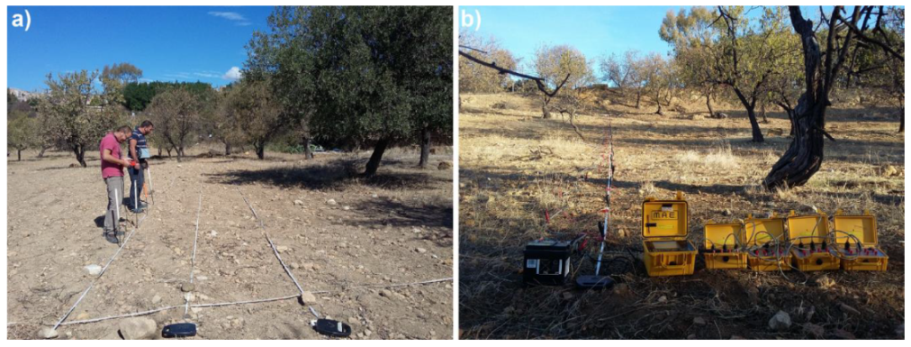
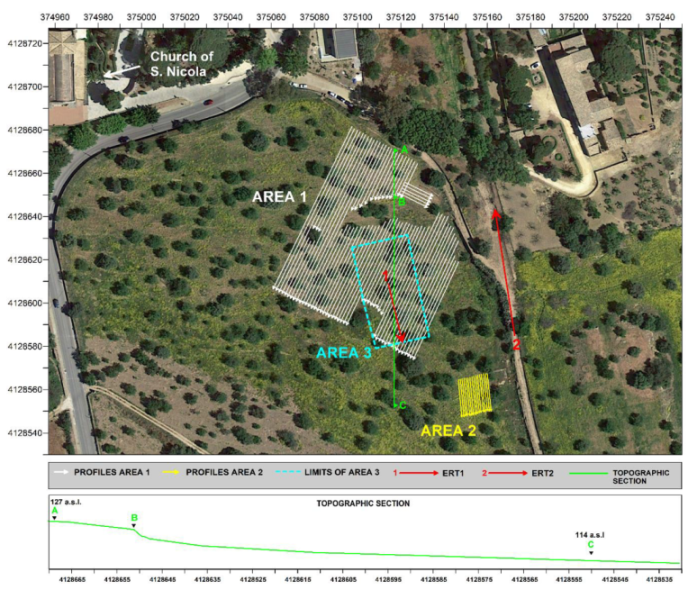
To collect apparent resistivity data, in a first step, a four-electrode device, the Elmes ADD-01 resistivity meter (Figure 2a), was used for a swift survey in area 1 and area 2 (Figure 3). It is an alternating current dynamic system in which two energizing probes, connected to a current generator, are used to inject current into the ground and two potentiometric probes, connected to a measuring/control unit, measure the potential drop. The two operators are separated as the two portable boxes are interconnected via wireless radio frequency device. A 50 W low power generator characterizes it and a current sine wave is generated at a frequency selectable between 8 and 33 Hz. The intensity of the exciting current can be selected on the control unit in the range 1–400 mA. A bandpass filter in the acquisition board allows eliminating unwanted noise.
During data acquisition 1 m long dipoles were placed at a step a of 1 m along each profile with k equal to 1.
Area 1 was surveyed implementing 70 DD parallel profiles, mainly NNE–SSW oriented and equally spaced at 1.5 m, with different length. An area of approximately 5.200 m2 was covered and about 3200 apparent resistivity values were measured. The survey area is characterized by a sloping and constant surface from north to south and, as evidenced by the topographic profile shown in Figure 3, in the central part (point B of the profile) there is an escarpment of about 3 m affected by sliding of materials from the top to the lower level. Its size is represented by the gap in the data acquisition grid at that point.
Area 2 was analyzed through 16 DD parallel, N–S oriented, 20 m long, and 1 m spaced profiles. An area of 300 m2 was surveyed.
Taking into account the preliminary results, in a second phase, a static multi-electrode resistivity meter (M.A.E. A3000E, www.mae-srl.it) (Figure 2b) was used in area 3 (Figure 3) with the purpose to get a wide data coverage in depth and to better reconstruct probable buried archaeological structures. A total of 40 DD profiles, 31 m long, were acquired implementing 1 m long dipoles with k equal to 15, reaching a pseudo-depth of 8 m. Each profile consisted of 330 measurements, thus totaling 13,200 data points. Profiles in the grid were acquired in two directions (ENE–WSW and NNW–SSE) with a spacing ranging between 1 and 2 m. Area 3 covered an area of about 1200 m2. In addition, a single vertical section was realized in the eastern sector of the study area in order to understand the ancient viability in that point (line 2 in Figure 3). In order to increase the resistivity contact between the electrodes and ground due to the dry condition of the terrain a conductive solution (water with a constant concentration of salt) was used to fill holes. Moreover, the M.A.E. transmitter uses a square wave as an energization signal and current (maximum 5 A), voltage (up to 700 V, 1400 V peak to peak), automatic compensation of the spontaneous potential (from −5 to + 5 V), energization with square wave with times (from 100 ms upwards) can be programmable.
Data acquisition was undertaken in July 2016 and it required 3 weeks of work involving four operators.
In order to convert apparent resistivities into real electrical resistivities a numerical inversion was used. While many approaches follow the classic deterministic routine [34,35,36,37,38,39,40,41], in this case, instead, the probability-based ERT inversion (PERTI) method [42] was applied. It was derived directly from the principles of the probability tomography [43,44] and, as outlined in previous applications [45,46,47,48,49,50], the method has proved to be useful to delineate location and shape of the most probable near surface sources of the anomalies.
The inversion procedure is based on a formula, which provides the resistivity at any point of the surveyed volume as a weighted average of the apparent resistivity data [42]. The weights are obtained as the Frechet derivatives of the apparent resistivity function of a homogeneous half-space, where a resistivity perturbation is produced in an arbitrary small cell of the discretized surveyed volume. The main features of the PERTI method are unnecessity of a priori information; full, unconstrained adaptability to any kind of dataset; independence from data acquisition techniques and spatial regularity; capability to resolve complex continuous resistivity variation. A direct consequence of not requiring a priori information and iterative processes is, for the PERTI method, the uselessness of the computation of the route mean square (RMS) error between measured and modelled apparent resistivity values. In fact, the resulting RMS error, whatever it is, can never be lowered within the PERTI scheme.

3. Results

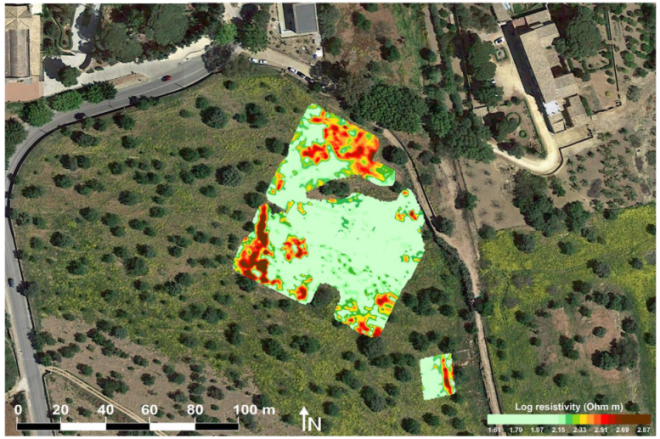
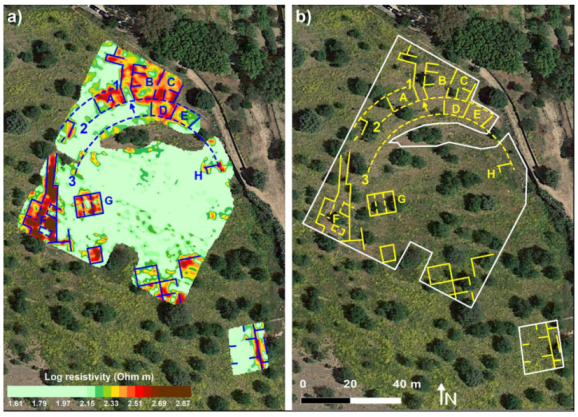
The superficial modelled resistivity map relative to 1 m in depth, obtained by the apparent resistivities measured through the Elmes ADD-01 resistivity meter, shows the most interesting results. Several regular pattern of resistivity highs, in the range of 180–800 Ωm, are highlighted (Figure 4). In order to accommodate the wide resistivity range detected inside the data set and to better show order of magnitude changes frequently appeared, a common logarithmic scale was used for visualization of resistivity maps. In the representation, low resistivity values were uniformed and are associated with the green color, high resistivity values are instead combined with shades of red. The resistivity map shows, in the northern part of the surveyed area, high resistivity values arranged on three concentric semicircles indicated in Figure 5 with dotted lines. Although the presence of possible collapses, blocks dislocated from their original position, and more recent constructions has inhibited the perfect definition of submerged structures, the presence of an articulated building ascribable to a theatrical complex of imposing dimensions with a diameter equal about to 95 m is very clear.
In the northern area it is possible to identify, within the high resistivity zone, some alignments that define probable internal divisions articulated radially (spaces A–E in Figure 5). High resistive elements can be associated with walls, room limits, even if defined in a fragmented way.
Taking into consideration the modelled map of the subsoil and its interpretation, immediately after the geophysical survey, at the end of July 2016, archaeo-stratigraphical excavations were carried out in targeted points and today the activities are still in progress.
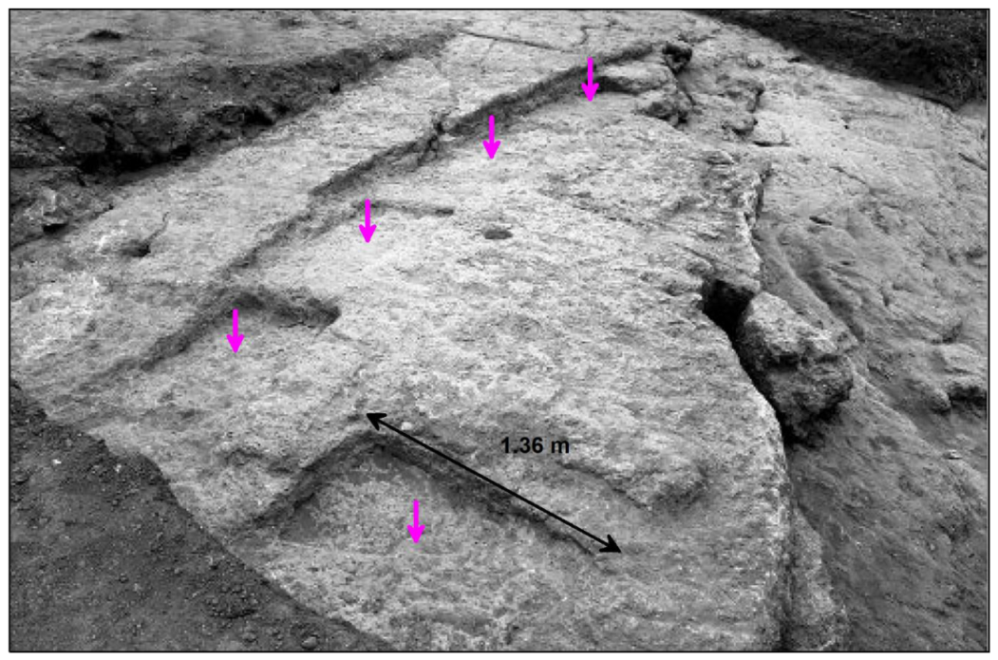
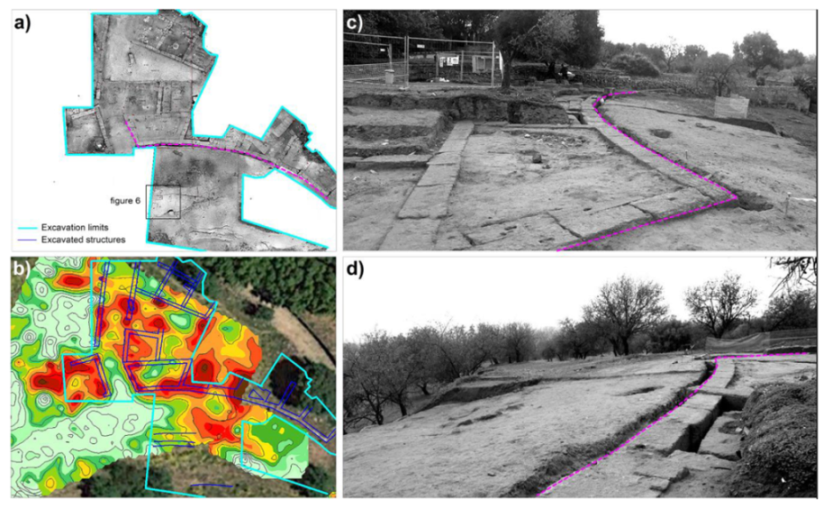
The archaeological excavation conducted in the northern portion of the building led to the identification of the summa cavea of the theater. The higher bleachers for spectators, with the finding of structures at the level of foundation level arranged on a semicircle on which the steps were located were also brought to light. They are in correspondence with the outermost radial resistivity highs signed with numbers 1 and 2 in Figure 5. Cuts in the rock with footprints of seats were found in proximity of the innermost high resistive pattern number 3 (Figure 6 and Figure 7).
Several compartments of the upper connected rooms of the structure were discovered (for instance in correspondence of A-C resistivity highs in Figure 5) and one of the entrances to the complex, that puts it in communication with the agorà behind it, was also identified (at the point indicated with an arrow in Figure 5).
Furthermore, a complex overlap of buildings was evidenced by the discovery of monumental structures that were later built following the decommissioning of the theater.
The superimposing of the plan obtained from the documentation of the archaeological excavation on the resistivity map shows the perfect correspondence between the supposed features of the resistivity highs and the structure actually brought to light (Figure 7).
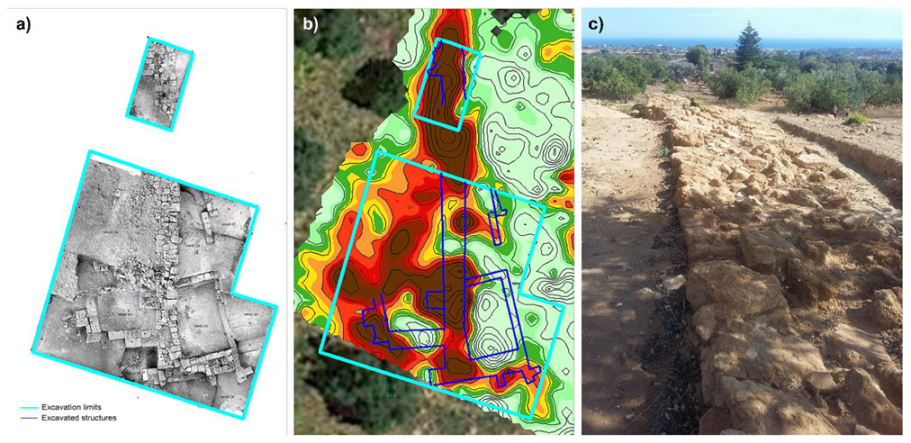
In the southwestern sector, at the west of the theater, there is a considerable regular pattern of resistivity highs, north–south oriented, that seems to indicate the presence of walls of significant size in proximity of the semicircle 1. In the western side, regular resistive features, not orthogonal to the previous ones, were detected and internal division may be imaged (F in Figure 5). In the eastern part of it, medium resistivity values seem to be connected to the previous ones. An excavation realized in this point brought to light the analemma of the theater, a wall placed at the ends of the cavea with the function to determine the practicable spaces between the cavea and the scene. Superimposed on it, in archaeological layers of late levels, elements of a large public building were found whose foundations were identified at about 3 m in depth.
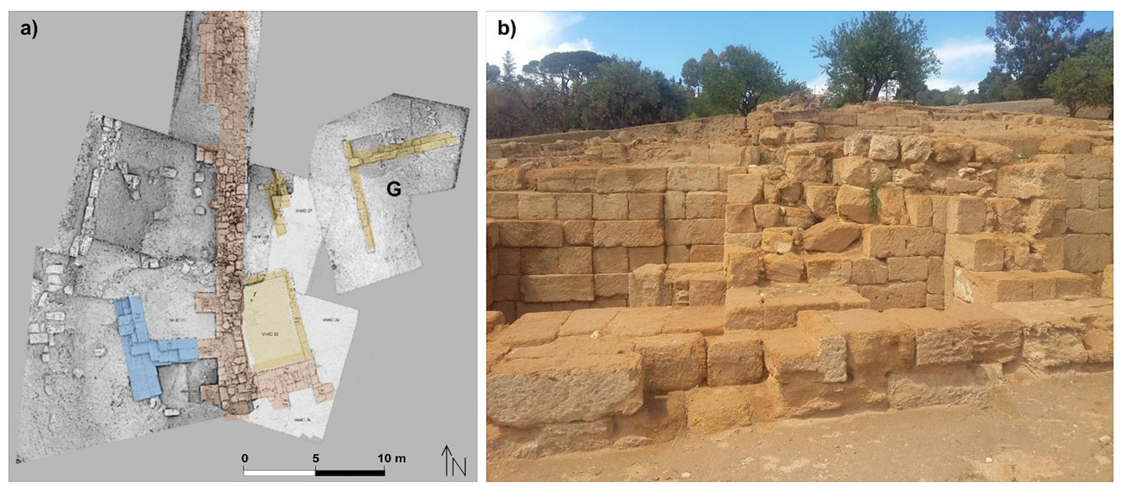
In Figure 8, the orthophoto of the excavation test was compared with the modelled electrical resistivity map relative to 1 m in depth: the analysis of the plans, despite the fact that many archaeological structures were discovered at depths greater than 1 m, predictively highlighted the presence of the walls outlining their continuation in the western portion not yet investigated. The subsequent excavation revealed in this area a complex stratification of structures with at least three important architectural phases: the terracing walls probably representing the first urban structure of the first half of the fifth century B.C. (not yet dated with precision); the structures of a first theater; the extension of a second theater (see Figure 9 with phase colors). The excavation allowed a confirmation of the presence of remains in relation to the detected high resistivity features and a greater clarification of the types of structures and their chronologies highlighting the construction history of this excavation sector, which was fundamental to understand in a more complex interpretation the completely constructive history of the theater.
No resistivity highs were detected within the scene such as to be attributed to stone constructions, except for two resistive nuclei (signed in Figure 5 with letters G and H) that are symmetrical with respect to the center of the theater and aligned on the same line. The resistive feature G has been partially excavated (Figure 9) and the structure seems to belong to the first phase of the theater. The function of it is still being understood and analyzed in the current state of the archaeological excavation.
In the southern part of the analyzed area, outside the supposed structure of the theater, a regular pattern of resistivity highs is highlighted that probably indicate the presence of housing facilities. A corner of a superficial room has been partially excavated in that point at this stage of archaeological research.
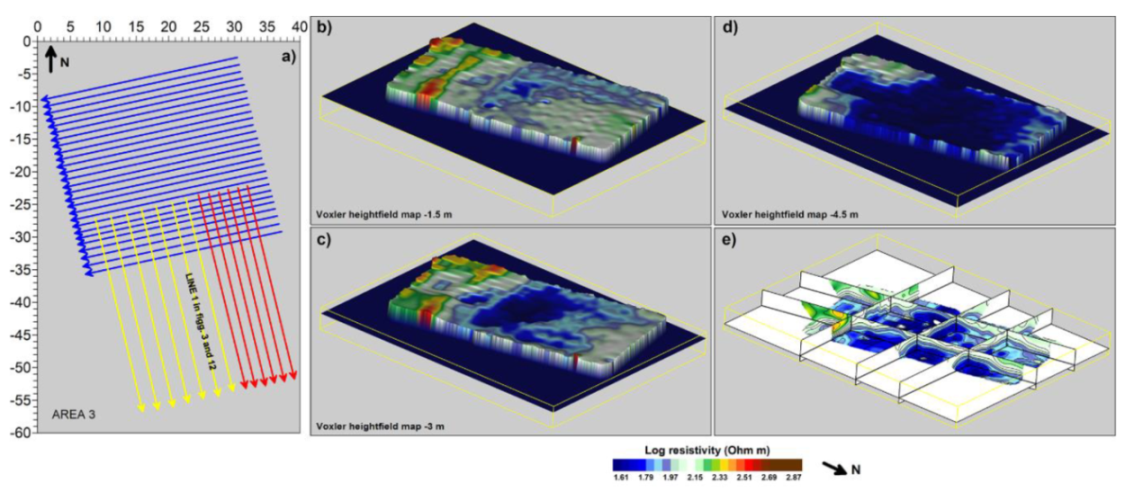
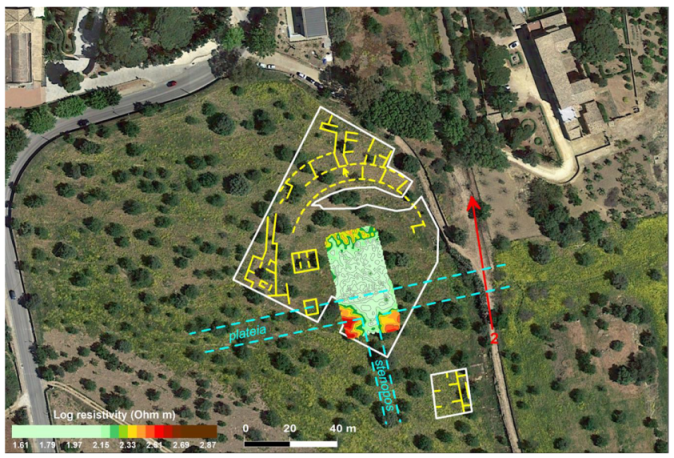
The survey realized in the center of the theater (area 3) was carried out with the purpose to better understand the archaeological structures and the stratigraphy of the scene. The inversion of the whole dataset has provided a 3D reconstruction of the investigated volume. In Figure 10, heightfield maps at selected depths and examples of sections of the 3D resistivity model are reported. The representation puts in evidence the dominance of low resistivity values in most of the investigated area with a significant decreasing at 4 m in depth where a layer of clays should be located. In the southern part, high resistivity values occur. The most significant slice of the 3D modelled resistivity volume was obtained at a depth of 3.5 m (Figure 11). As in the previous maps, the color scale of the representation was modified by assigning the green color to the values below the medium value of resistivity. In the southern portion, in correspondence with the center of the theater, two high resistive nuclei were identified which attest the presence of the corner of two structures facing each other in the cavea. They are placed at the intersection of the stenopos (NNW–SSE road), the resistivity lows placed between the two structures, large 8 m, and the plateia (the main EEN–WWS road) that connected the theater to the other sectors of the city (white dotted lines in Figure 11). This result allowed redefining the urban layout of the monumental area.
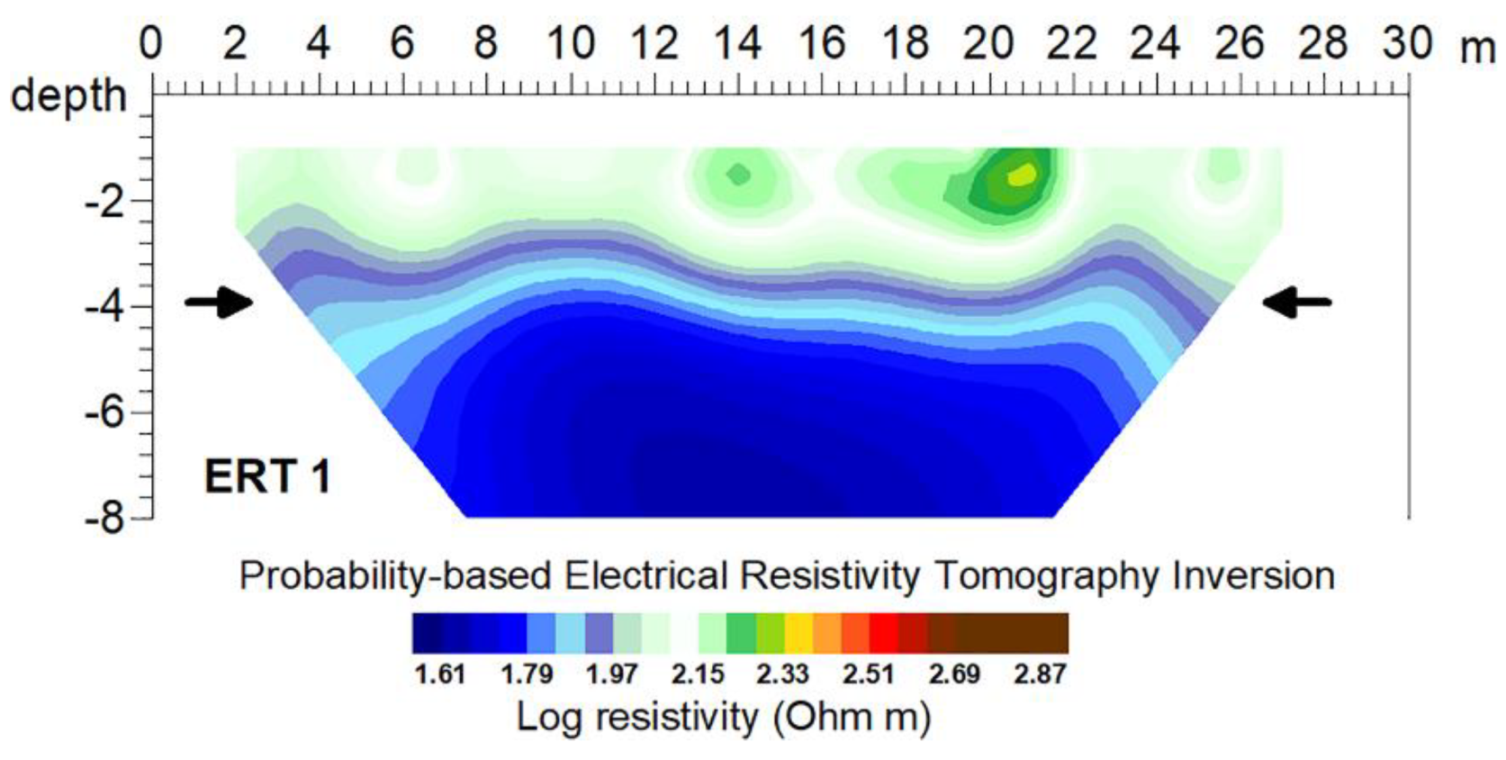
In addition, some vertical sections were analyzed with the aim of clarifying the complex stratigraphy of the site (Figure 12 and Figure 13). ERT 1 (Line 1 in Figure 3) belongs to the dataset of area 3. The section provides evidence for the presence of a clear passage from medium/high resistivity layers to low resistivity ones (in blue in the images), probably clay, at an average depth of 4 m. It leads to suppose that the step plane in phase with the theater had to be at a lower level than the current floor (Figure 12). ERT 2 (Line 2 in Figure 3), on the eastern terrace of the theater, shows, at the intersection with the hypothetical plateia, a gradual deepening of the high resistive layer, providing evidence of a likely passage from the northern block of the city to the southern one (Figure 13). The high resistive values at the origin of the section may be interpreted as buried archeological structures delimiting the southern part of the plateia while the low resistivity values at depths below to 4 m attest the presence of a clayey terrain.
Finally, the results obtained in Area 2, as expected, provided evidence in the southern part of the theater and the plateia a series of resistivity highs, probably belonging at a buried building, in accordance with the orientation of structures in that part of the city.
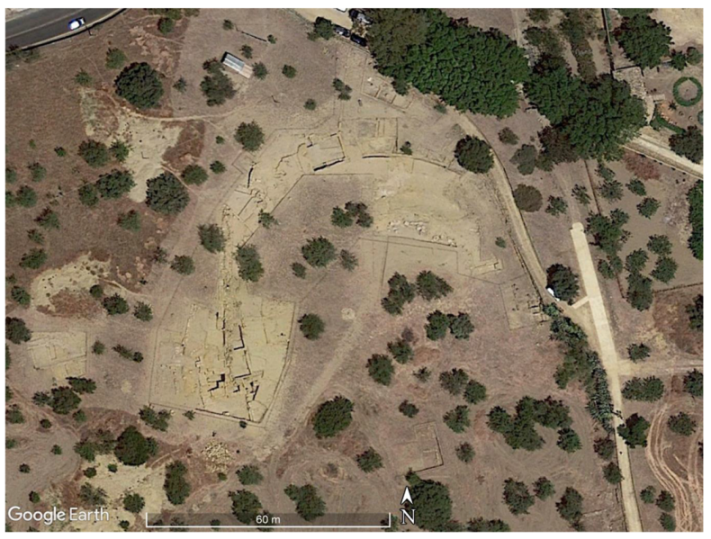
The Google EarthTM satellite image acquired in 2019 shows all sectors of the theater brought to light until now (Figure 14).

4. Conclusions

The success of the discovery of theater of Agrigento is due to a greater attention to an integrated approach between analyses of urban topography, study of written sources, reworking of data emerging from excavations and previous investigations, and from an intensive use of geophysics. The latter has allowed, from the early stages of the project, to outline the limits of the building and to be able to plan the excavation intervention on a construction that appeared to be known in geophysical results in most of its structures.
In the excavation of the theater, in particular, all the phases of the life of the city were found from that of the fifth century, represented by rectilinear terraces, to the two phases of the theater, to the moments of dismantling the building, perhaps in the fifth century A.D. The phases of depredation to build the medieval city of Agrigento and the church of S. Nicola between the VII and the XII century A.D. were also identified. Through the investigations carried out from 2016 it was possible to make a new reading of the history of the city adding new elements about the organization of the terraces, blocks, and roads within the investigated sector of the city.

Author Contributions

Conceptualization, M.C., P.M. and L.M.C.; methodology, M.C. and P.M.; software, M.C. and P.M.; validation, M.C., P.M. and L.M.C.; formal analysis, M.C. and P.M.; investigation, M.C., V.G., A.D.M.; resources, M.C. and P.M.; data curation, M.C. and V.G.; writing—original draft preparation, M.C. and L.M.C.; writing—review and editing, M.C., P.M. and L.M.C.; supervision, M.C., P.M. and L.M.C.; project administration, M.C., P.M. and L.M.C.; funding acquisition, M.C., P.M. and L.M.C. All authors have read and agreed to the published version of the manuscript.

Funding

This research received no external funding.

Acknowledgments

Special thanks to from the Director of the Valley of the Temples Park, Giuseppe Parrello, and the park’s archaeologists Valentina Camineci, Concetta Parrello, and Maria Serena Rizzo for the fruitful collaboration during the research activities.

Conflicts of Interest

The authors declare no conflict of interest.

References

  1. Colecchia, V.; Fiorillo, F.; Pagliarulo, R.; Reina, A. Caratteri geologici della Valle dei templi (Agrigento). Geol. Appl. Idrogeol. 1996, 31, 335–347. [Google Scholar]
  2. Caliò, L.M.; Caminneci, V.; Livadiotti, M.; Parello, M.C.; Rizzo, M.S. (Eds.) Agrigento. Nuove ricerche Sull’area Pubblica Centrale; Edizioni Quasar: Roma, Italy, 2017. [Google Scholar]
  3. Lepore, G.; Caliò, L.M. Agrigento: Archaeology of an ancient city. Urban form, sacred and civil spaces, productions, territory. In Proceedings of the 19th International Congress of Classical Archaeology, Archaeology and Economy in the Ancient World, Bonn, Germany, 22–26 May 2018; Bentz, M., Heinzelmann, M., Eds.; Propylaeum: Heidelberg, Germany, 2019; Volume 41. [Google Scholar]
  4. De Cesare, M.; Portale, E.C. Il Santuario di Zeus Olympios nel quadro urbano dell’antica Akragas. Archeol. Class. 2019, 70, 1–27. [Google Scholar]
  5. Camiceci, V. Una trepida attesa lunga cinque secoli: La scoperta del teatro di Agrigento. In Agrigento. Nuove Ricerche Sull’area Pubblica Centrale; Caliò, L.M., Caminneci, V., Livadiotti, M., Parello, M.C., Rizzo, M.S., Eds.; Edizioni Quasar: Roma, Italy, 2017; pp. 9–14. [Google Scholar]
  6. Fazello, T. De Rebus Siculis Decades Duae; Panormi: Palermo, Italy, 1558. [Google Scholar]
  7. D’Orville, J.P. Sicula, Quibus Siciliae Veteris Rudera, Additis Antiquitatum Tabulis Illustrantur. Edidit, et Commentarium ad Numismata Sicula, XX Tabulis Aeneis Incisa, et ad Tres Inscriptiones Majores, Geloam, Tauromenitanam, et Rheginam; nec non Minorum Inscriptionum Syllogen, Orationem in Auctoris Obitum, et Praefationem Adjecit Petrus Burmannus Secundus; Apud Gerardum Tielenburg: Amsterdam, The Netherlands, 1724; pp. I–II. [Google Scholar]
  8. Muenter, F. Viaggio in Sicilia di Federico Muenter Tradotto dal Tedesco dal Tenente Colonnello D’artiglieria cav. D. Francesco Peranni con Note e Aggiunte del Medesimo; Tipografia Francesco Abbate: Palermo, Italy, 1823; p. I. [Google Scholar]
  9. Pancrazi, G.M. Le Antichità Siciliane Spiegate Colle Notizie Generali di Questo Regno. La Storia Particolare di Quelle Città Delle Quali Si Riportano ed Illustrano gli Antichi Monumenti; Stamperia Alessio Pellecchia: Naples, Italy, 1751; pp. I–II. [Google Scholar]
  10. de Saint Non, J.C.R. Voyage Pittoresque ou Description des Royaumes de Naples et de Sicile Ornée de Cartes, Plans, Vues, Figures; Vignettes et cul de Lampes; Clousier: Paris, France, 1781. [Google Scholar]
  11. della Torre di Rezzonico, C.G. Viaggio della Sicilia; Gli eredi Abbate Editori: Palermo, Italy, 1828. [Google Scholar]
  12. Griffo, P. Ebbe Agrigento un teatro nell’antichità? In Akragas. Bollettino di Studi, Scoperte ed Attività Varie; Soprintendenza alle Antichità di Agrigento: Agrigento, Italy, 1947; p. 5. [Google Scholar]
  13. Griffo, P. Bilancio di Cinque Anni di Scavi Nelle Province di Agrigento e Caltanissetta; Atti Accademia Scienze, Lettere e Arti di Agrigento; Dimora: Agrigento, Italy, 1953; Volume VIII, p. 142. [Google Scholar]
  14. Griffo, P. Del Teatro Greco di Agrigento; Dioniso: Agrigento, Italy, 1954; Volume VII, p. 141. [Google Scholar]
  15. Caliò, L.M. Il teatro di Agrigento e lo sviluppo della città monumentale. In THEAOMAI, Teatro e Società in Età Ellenistica, Proceedings of the Atti Delle XI Giornate Gregoriane, Agrigento, Italy, 2–3 December 2017; Caminneci, V., Parello, C., Rizzo, S., Eds.; All’Insegna del Giglio: Sesto Fiorentino, Italy, 2019; pp. 201–230. [Google Scholar]
  16. Cozzolino, M.; Di Meo, A.; Gentile, V. Il ruolo della diagnosi non invasiva nella scoperta del teatro ellenistico dell’antica Akragas, Agrigento. In Agrigento. Nuove Ricerche Sull’area Pubblica Centrale; Caliò, L.M., Caminneci, V., Livadiotti, M., Parello, M.C., Rizzo, M.S., Eds.; Edizioni Quasar: Roma, Italy, 2017; pp. 129–136. [Google Scholar]
  17. Witten, A.J. Handbook of Geophysics and Archaeology; Equinox Pub: London, UK, 2006. [Google Scholar]
  18. Schmidt, A.; Linford, P.; Lindford, N.; Gaffney, C.; David, A. (Eds.) EAC Guidelines for the Use of Geophysics in Archaeology; Archaeolingua Press: Budapest, Hungary, 2015. [Google Scholar]
  19. Papadopoulos, N.G.; Tsourlos, P.; Tsokas, G.N.; Sarris, A. Two-dimensional and three-dimensional resistivity imaging in archaeological site investigation. Archaeol. Prospect. 2006, 13, 163–181. [Google Scholar] [CrossRef]
  20. Abu Zeid, N.; Balducci, M.; Bartocci, F.; Regni, R.; Santarato, G. Indirect estimation of injected mortar volume in historical walls using the electrical resistivity tomography. J. Cult. Herit. 2009, 11, 220–227. [Google Scholar] [CrossRef]
  21. Bavusi, M.; Giocoli, A.; Rizzo, E.; Lapenna, V. Geophysical characterisation of Carlo’s V Castle (Crotone, Italy). J. Appl. Geophys. 2009, 67, 386–401. [Google Scholar] [CrossRef]
  22. Compare, V.; Cozzolino, M.; Mauriello, P.; Patella, D. Resistivity probability tomography at the Castle of Zena (Italy). EURASIP J. Image Video Process. 2009, 2009, 693274. [Google Scholar] [CrossRef] [Green Version]
  23. Tsokas, N.G.; Tsourlos, P.I.; Stampolidis, A.; Katsonopoulou, D.; Soter, S. Tracing a major Roman road in the area of ancient Helike by resistivity tomography. Archaeol. Prospect. 2009, 16, 251–266. [Google Scholar] [CrossRef]
  24. Mol, L.; Preston, P.R. The writing’s in the wall: A review of new preliminary applications of electrical resistivity tomography within archaeology. Archaeometry 2010, 52, 1079–1095. [Google Scholar] [CrossRef]
  25. Cozzolino, M.; Di Giovanni, E.; Mauriello, P.; Vanni Desideri, A.; Patella, D. Resistivity tomography in the Park of Pratolino at Vaglia (Florence, Italy). Archaeol. Prospect. 2012, 19, 253–260. [Google Scholar] [CrossRef]
  26. Lentini, M.C.; Pakkanen, J.; Sarris, A. Naxos of Sicily in the 5th Century BC: New Research. In Greek Colonization. New Data, Current Approaches, Proceedings of the Scientific Meeting, Thessaloniki, Greece, 6 February 2015; Veleni, P., Tsagari, D., Eds.; Alpha Bank: Athens, Greece, 2015; pp. 23–35. [Google Scholar]
  27. Tsokas, G.N.; Tsourlos, P.I.; Kim, J.H.; Yi, M.J.; Vargemezis, G.; Lefantzis, M.; Fikos, E.; Peristeri, K. ERT imaging of the interior of the huge tumulus of Kastas in Amphipolis (northern Greece). Archaeol. Prospect. 2018, 25, 347–361. [Google Scholar] [CrossRef]
  28. Supriyadi, A.; Suprianto, A.; Priyantari, N.; Cahyono, B.E.; Sholeha, I. Assessment of validated geoelectrical resistivity methods to reconstruct buried archaeological site (case study: Beteng Site-Sidomekar, Jember Regency). J. Phys. Conf. Ser. 2019, 1153, 012026. [Google Scholar] [CrossRef]
  29. Dabas, M. Theory and practice of the new fast electrical imaging system ARP©. In Seeing the Unseen. Geophysics and Landscape Archaeology; Campana, S., Piro, S., Eds.; CRC Press, Taylor & Francis Group: London, UK, 2009; pp. 105–126. [Google Scholar]
  30. Piroddi, L.; Calcina, S.V.; Trogu, A.; Ranieri, G. Automated Resistivity Profiling (ARP) to explore wide archaeological areas: The prehistoric site of Mont’e Prama, Sardinia, Italy. Remote Sens. 2020, 12, 461. [Google Scholar] [CrossRef] [Green Version]
  31. Chouteau, M.; Vallières, S.; Toe, E. A multi-dipole mobile array for the non-destructive evaluation of pavement and concrete infrastructures: A feasability study. In Proceedings of the International Symposium Non-Destructive Testing in Civil Engineering (NDT-CE 2003), Berlin, Germany, 16–19 September 2003. [Google Scholar]
  32. Clark, A.J. Seeing Beneath the Soil. Prospecting Methods in Archeology; B.T. Batsford: London, UK, 1996. [Google Scholar]
  33. Gaffney, C.; Gater, J. Revealing the Buried Past: Geophysics for Archaeologists; Tempus Publishing: Stroud, UK, 2003. [Google Scholar]
  34. Sasaki, Y. 3-D resistivity inversion using the finite element method. Geophysics 1994, 59, 1839–1848. [Google Scholar] [CrossRef]
  35. Loke, M.H.; Barker, R.D. Rapid least-squares inversion of apparent resistivity pseudosections by a quasi-Newton method. Geophys. Prospect. 1996, 44, 131–152. [Google Scholar] [CrossRef]
  36. Tsourlos, P.; Ogilvy, R. An algorithm for the 3-D inversion of tomographic resistivity and induced polarization data: Preliminary results. J. Balk. Geophys. Soc. 1999, 2, 30–45. [Google Scholar]
  37. Dahlin, T. The development of electrical imaging techniques. Comput. Geosci. 2001, 27, 1019–1029. [Google Scholar] [CrossRef] [Green Version]
  38. Pidlisecky, A.; Haber, E.; Knight, R. RESINVM3D: A 3D resistivity inversion package. Geophysics 2007, 72, H1–H10. [Google Scholar] [CrossRef]
  39. Papadopoulos, N.G.; Tsourlos, P.; Tsokas, G.N.; Sarris, A. Efficient ERT measuring and inversion strategies for 3D imaging of buried antiquities. Near Surf. Geophys. 2007, 5, 349–362. [Google Scholar] [CrossRef]
  40. Marescot, L.; Lopes, S.P.; Rigobert, S.; Green, A.G. Nonlinear inversion of geoelectric data acquired across 3D objects using a finite-element approach. Geophysics 2008, 73, 121–133. [Google Scholar] [CrossRef]
  41. Papadopoulos, N.G.; Tsourlos, P.; Papazachos, C.; Tsokas, G.N.; Sarris, A.; Kim, J.H. An algorithm for fast 3D inversion of surface electrical resistivity tomography data: Application on imaging buried antiquities. Geophys. Prospect. 2011, 59, 557–575. [Google Scholar] [CrossRef]
  42. Mauriello, P.; Patella, D. A data-adaptive probability-based fast ERT inversion method. Prog. Electromagn. Res. 2009, 97, 275–290. [Google Scholar] [CrossRef] [Green Version]
  43. Patella, D. Introduction to ground surface selfpotential tomography. Geophys. Prospect. 1997, 45, 653–681. [Google Scholar] [CrossRef]
  44. Mauriello, P.; Patella, D. Resistivity anomaly imaging by probability tomography. Geophys. Prospect. 1999, 47, 411–429. [Google Scholar] [CrossRef]
  45. Minelli, A.; Cozzolino, M.; Di Nucci, A.; Guglielmi, S.; Giannantonio, M.; D’Amore, D.; Pittoni, E.; Groot, A.M. The prehistory of the Colombian territory: The results of the Italian archaeological investigation on the Checua site (Municipality of Nemocòn, Cundinamarca Department). J. Biol. Res. 2012, 85, 94–97. [Google Scholar] [CrossRef]
  46. Amato, V.; Cozzolino, M.; De Benedittis, G.; Di Paola, G.; Gentile, V.; Giordano, C.; Marino, P.; Rosskopf, C.M.; Valente, E. An integrated quantitative approach to assess the archaeological heritage in highly anthropized areas: The case study of Aesernia (southern Italy). Acta IMECO 2016, 5, 33–43. [Google Scholar] [CrossRef]
  47. Cozzolino, M.; Mauriello, P.; Patella, D. Resistivity Tomography Imaging of the substratum of the Bedestan Monumental Complex at Nicosia, Cyprus. Archaeometry 2014, 56, 331–350. [Google Scholar] [CrossRef] [Green Version]
  48. Valente, E.; Ascione, A.; Ciotoli, G.; Cozzolino, M.; Porfido, S.; Sciarra, A. Do moderate magnitude earthquakes generate seismically induced ground effects? The case study of the Mw = 5.16, 29th December 2013 Matese earthquake (southern Apennines, Italy). Int. J. Earth Sci. 2013, 107, 517–537. [Google Scholar] [CrossRef] [Green Version]
  49. Cozzolino, M.; Longo, F.; Pizzano, N.; Rizzo, M.L.; Voza, O.; Amato, V. Multidisciplinary Approach to the Study of the Temple of Athena in Poseidonia-Paestum (Southern Italy): New Geomorphological, Geophysical and Archaeological Data. Geosciences 2019, 9, 324. [Google Scholar] [CrossRef] [Green Version]
  50. Cozzolino, M.; Mauriello, P.; Moisidi, M.; Vallianatos, F. A Probability Electrical Resistivity Tomography Imaging of complex tectonic features in the Kissamos and Paleohora urban areas, Western Crete (Greece). Ann. Geophys. Italy 2019, 62, 13. [Google Scholar] [CrossRef] [Green Version]
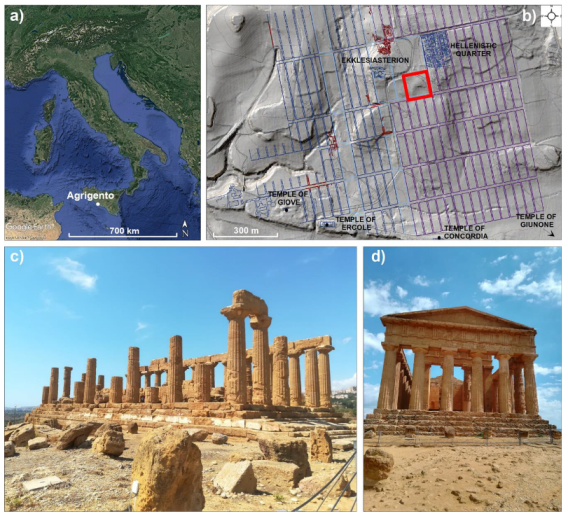
Figure 1. Location of Agrigento on a Google EarthTM satellite image (a), reconstructive map of ancient Agrigento on Laser Imaging Detection and Ranging (LIDAR) analysis (made by G. Pambianchi and F. Pallotta, Camerino University) with indication of the surveyed area in red (modified by Brienza [2]) (b), the Temple of Giunone (c), and Temple of Concordia (d).
Geosciences 10 00161 g001
Figure 2. Data acquisition using the Elmes ADD-01 Resistivity meter (a) and the M.A.E. A3000E Resistivity meter (b).
Geosciences 10 00161 g002
Figure 3. Survey plan on a Google EarthTM satellite image (2016) (top) and a topographic section of the area (bottom).
Geosciences 10 00161 g003
Figure 4. Modelled electrical resistivity map relative to 1 m in depth on a Google EarthTM satellite image (2016): areas 1 and 2 (modified by [16]).
Geosciences 10 00161 g004
Figure 5. Interpretation of the main resistive features with (a) and without (b) the visualization of the electrical resistivity map (modified by [16]).
Geosciences 10 00161 g005
Figure 6. Cuts in the rock with footprints of seats (marked with pink arrows).
Geosciences 10 00161 g006
Figure 7. Orthophoto of the archaeological excavation in the northern sector of the theater (elaboration by A. Fino) (a), overlay of the relief of the structures on the resistivity map (b), the curvilinear wall that delimits the system of connecting rooms seen from the East (c) and the foundation pit with a curvilinear pattern and the foundation walls of the theatrical structures seen from the west (d).
Geosciences 10 00161 g007
Figure 8. Orthophoto of the archaeological excavation in the southwestern sector of the theater (elaboration by A. Fino) (a), overlay of the relief of the structures on the resistivity map (b), analemma (first theater) in a picture taken from north to south (c).
Geosciences 10 00161 g008
Figure 9. Terraces of the first phase (yellow), the first theater (brown), the second theater (blue) (a) and the western analemma (first theater) in a picture taken from east to west (b).
Geosciences 10 00161 g009
Figure 10. Area 3: grid data acquisition (blue, red, and yellow lines are, respectively, spaced 1, 1.5, and 2 m) (a), 3D voxler heightfields maps at 1.5 (b), 3 (c), and 4.5 m (d) in depth and sections of the imaged resistivity volume (e).
Geosciences 10 00161 g010
Figure 11. Modelled electrical resistivity map relative to 3.5 m in depth in relation to the features detected at 1 m in depth (indicated with yellow color).
Geosciences 10 00161 g011
Figure 12. Electrical resistivity tomography (ERT) 1, line 1 in Figure 3.
Geosciences 10 00161 g012
Figure 13. ERT 2, line 2 in Figure 3 and Figure 11.
Geosciences 10 00161 g013
Figure 14. Google EarthTM satellite image acquired in 2019.
Geosciences 10 00161 g014