Article

Geochemistry of Deccan Tholeiite Flows and Dykes of Elephanta Island: Insights into the Stratigraphy and Structure of the Panvel Flexure Zone, Western Indian Rifted Margin

1
Department of Earth Sciences, Indian Institute of Technology Bombay, Powai, Mumbai 400076, India
2
Geological Survey of India, Central Region, State Unit Madhya Pradesh, Jabalpur 482003, India
3
Dipartimento di Scienze della Terra, dell’ Ambiente e delle Risorse (DiSTAR), Università di Napoli Federico II, Complesso Universitario Monte Sant’Angelo, Via Cintia 21 (edificio L), 80126 Napoli (Naples), Italy
4
Thermo Fisher Scientific India Pvt. Ltd., Delphi, B Wing, Hiranandani Business Park, Powai, Mumbai 400076, India
5
Department of Lithospheric Research, University of Vienna, Althanstrasse 14, 1090 Vienna, Austria
6
Natural History Museum, Burgring 7, A-1010 Vienna, Austria
7
Department of Geology, St. Xavier’s College, Mumbai 400001, India
8
Geological Survey of India, Northeastern Region, Shillong 793003, India
*
Authors to whom correspondence should be addressed.
Geosciences 2020, 10(4), 118; https://doi.org/10.3390/geosciences10040118
Submission received: 25 January 2020 / Revised: 20 March 2020 / Accepted: 24 March 2020 / Published: 26 March 2020

Abstract

:
Elephanta Island near Mumbai is an important area for understanding the stratigraphic and structural framework of the Deccan flood basalt province in the tectonically disturbed Panvel flexure zone on the western Indian rifted margin. Elephanta exposes a west-dipping, 66–65 Ma sequence of tholeiitic lava flows and dykes. Geochemical correlations with the thick, horizontal, 66–65 Ma Western Ghats sequence to the east show that lava flows of the Khandala and Ambenali formations are present at Elephanta, with two lava flows probably being locally derived. The Elephanta tholeiites have experienced crystal fractionation and accumulation, particularly of olivine. They have εNd(t) ranging from +5.4 to −7.9 and (87Sr/86Sr)t from 0.70391 to 0.70784, with most tholeiites little contaminated by continental lithosphere, probably lower crust. Field and geochemical data indicate a normal fault along the central part of Elephanta with a 220 m downthrow, consistent with a domino-type block-faulted structure of Elephanta, and the surrounding area as previously known. Seventeen of the 20 analyzed Elephanta intrusions, striking ~N–S, belong to the Coastal dyke swarm of the western Deccan province. Several of these are probable feeders to the Ambenali Formation in the Western Ghats sequence, requiring reconsideration of the current view that the voluminous Wai Subgroup lavas of the Western Ghats were erupted without organized crustal extension. East–west-directed extensional strain was already active at 66–65 Ma along this future (62.5 Ma) rifted continental margin. A young (~62 Ma) ankaramite dyke on Elephanta Island is a probable feeder to the Powai ankaramite flow in the 62.5 Ma Mumbai sequence 20 km to the northwest.

1. Introduction: Flood Basalts, Rifted Continental Margins, and Monoclinal Flexures

Volcanic rifted margins [1,2] form during continental break-up and the birth of new ocean basins, and are associated with voluminous flood basalt magmatism (both extrusive and intrusive) and pronounced extensional tectonics. Major flood basalt provinces located on rifted continental margins are the Karoo province of southern Africa, the Paraná province of South America, the East Greenland and West Greenland provinces, and the Deccan province of India [3,4]. The coastal edges of these continental flood basalt (CFB) provinces show monoclinal flexure zones, in which the kilometers-thick, flat-lying flood basalt sequence of the province’s interior shows significant tectonic dips toward the newly formed ocean [5,6,7]. Rifted continental margins with flood basalts thus provide excellent opportunities to study the interplay of magmatism and extensional tectonics on one hand [8,9,10], and the dynamics of uplift and erosion of the rift shoulders on the other [1].
The Deccan CFB province, presently covering ~500,000 km2 in western and central India, was rapidly constructed at 66–65 Ma (e.g., [11,
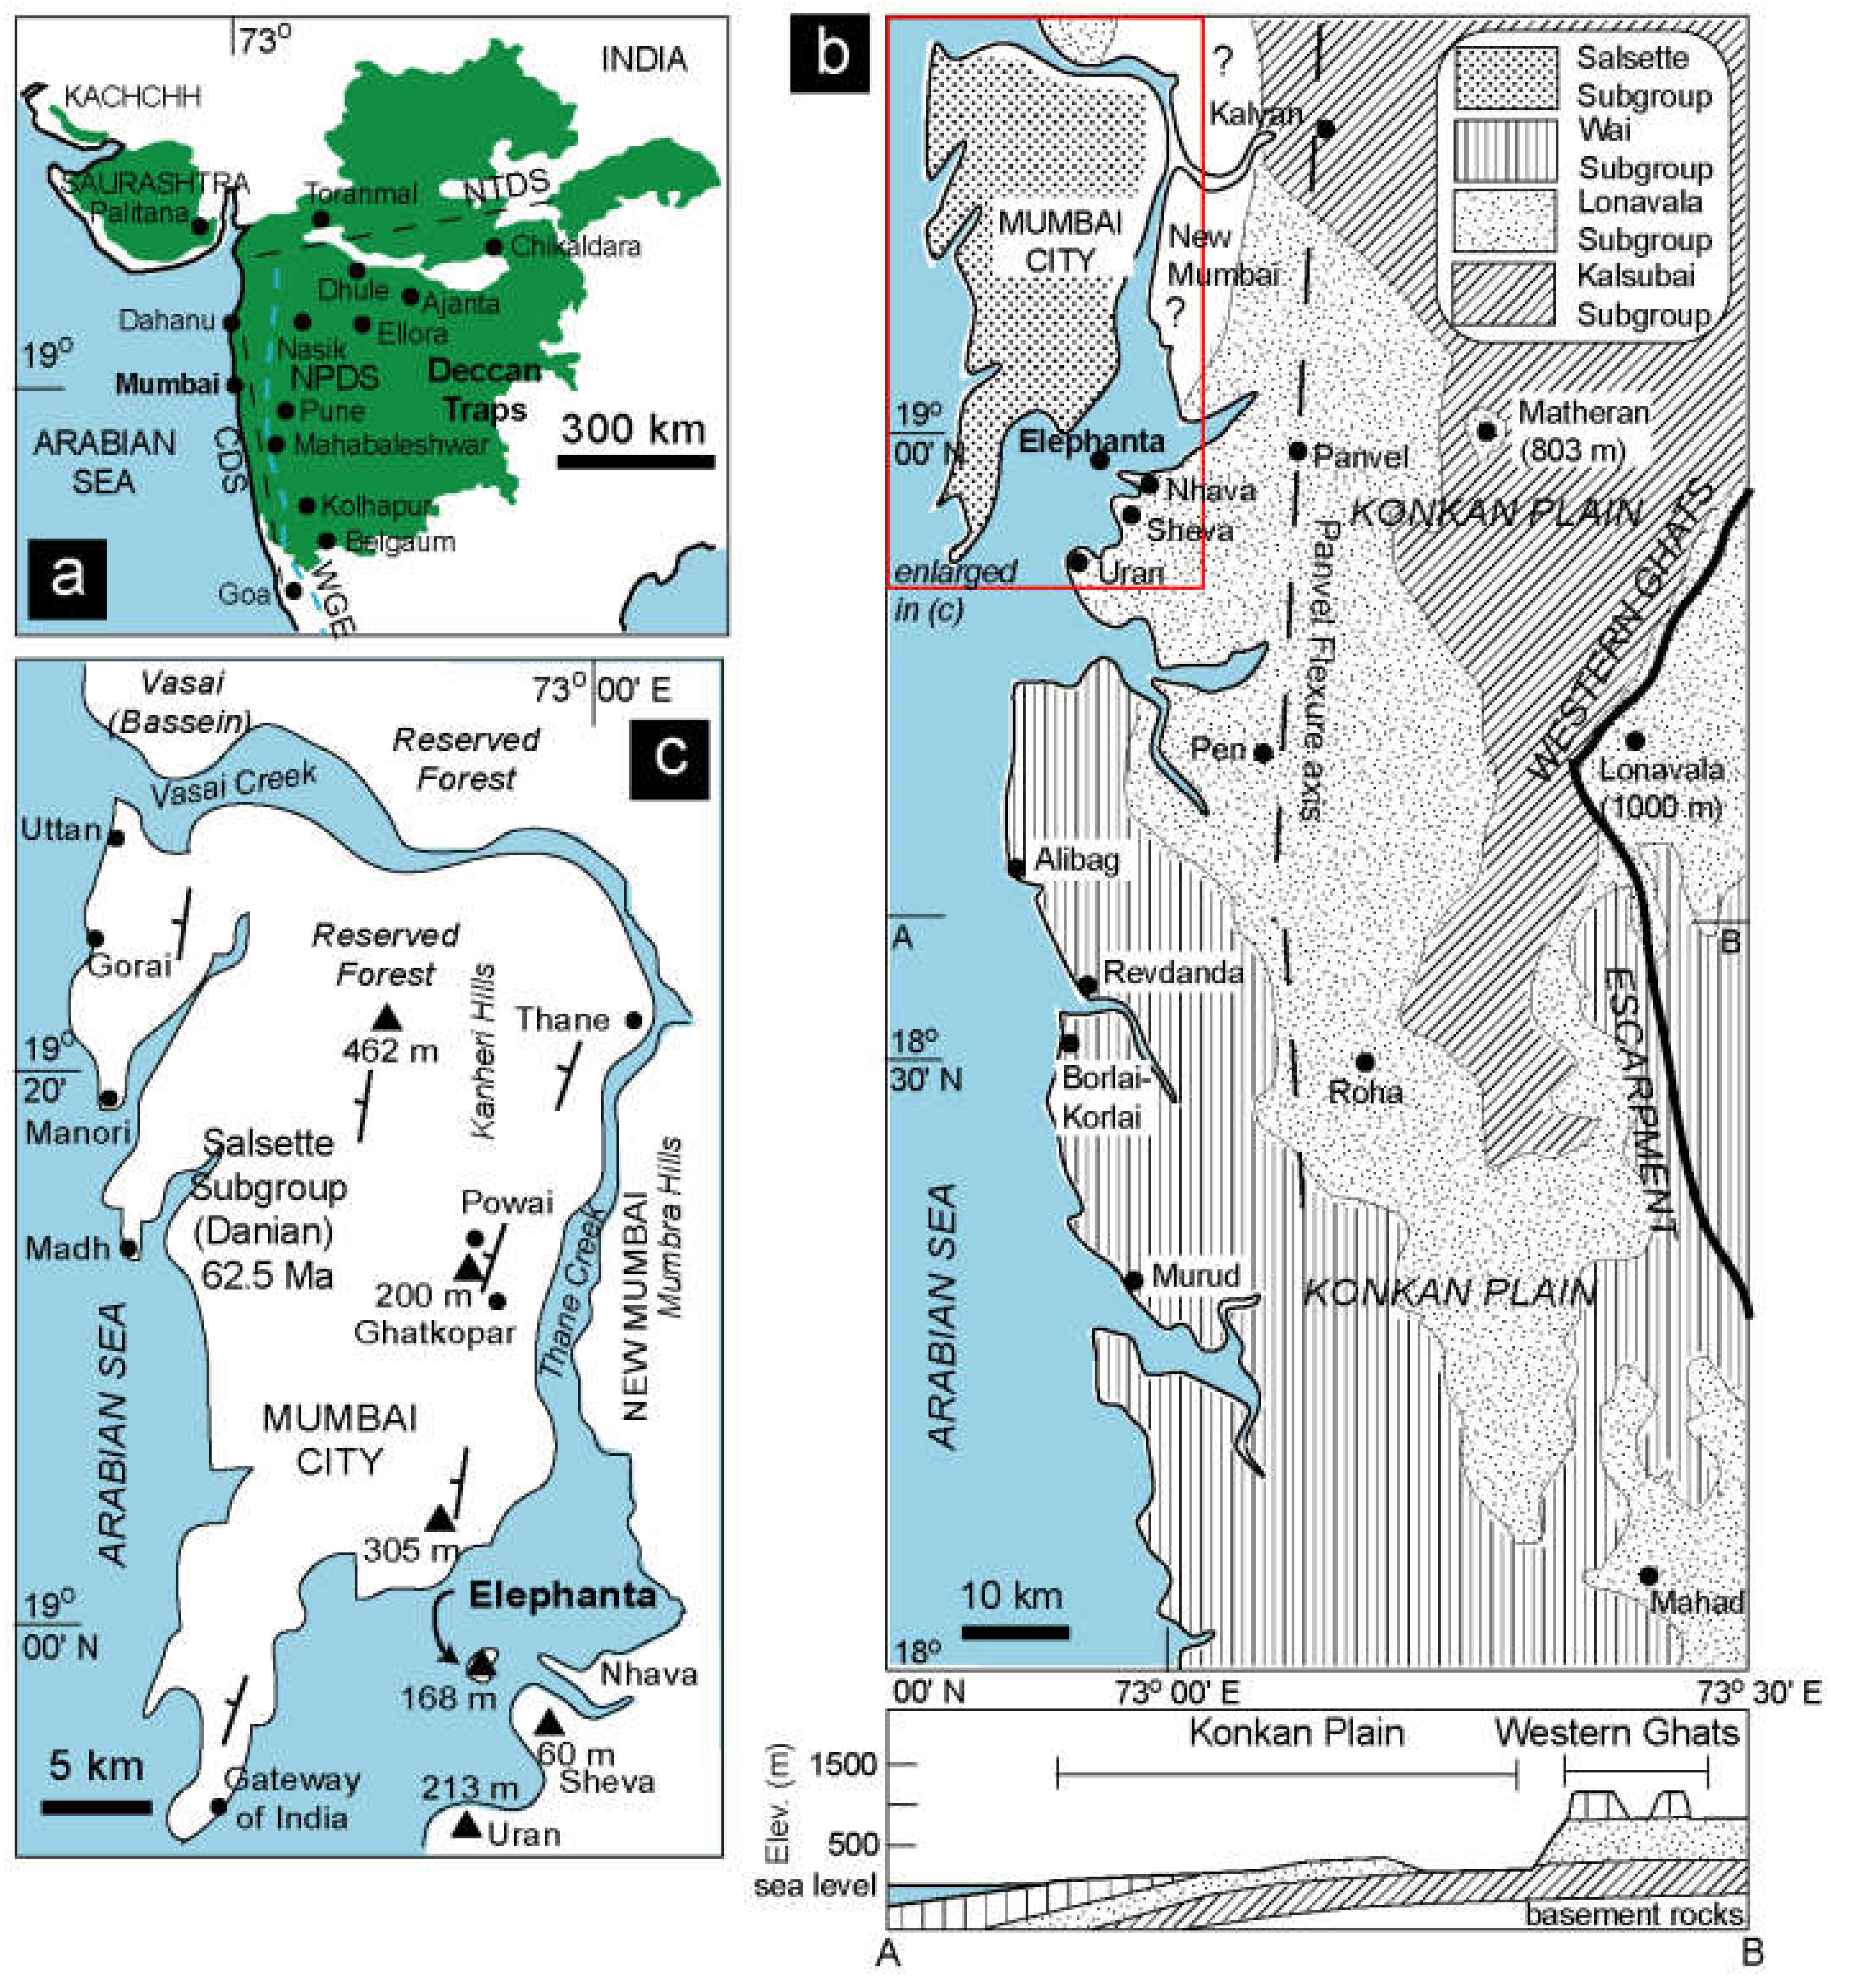
12]) and is best developed in the Western Ghats (WG hereafter) escarpment (Figure 1a). Here, extensive geochemical stratigraphic work over a north–south distance of ~500 km has divided the volcanic sequence into three subgroups and eleven formations with a total stratigraphic thickness of ~3.4 km (e.g., [13,14,15], Table 1). Three major dyke swarms also outcrop in the Deccan province [16,17,18,19] (Figure 1a), namely the ~ENE–WSW-trending Narmada-Tapi swarm in the north-central part of the province, the ~N–S-trending Coastal swarm on the Konkan Plain (the narrow coastal strip between the WG escarpment and the Arabian Sea), and the Nasik-Pune swarm with dykes of several trends in the WG region. The Narmada-Tapi and Coastal dyke swarms are the feeders of some lower and middle stratigraphic formations of the WG sequence, whereas the Nasik-Pune dyke swarm mainly fed lavas of the middle and upper formations [17,18,19]. Several lava flow sequences located in the central, northern, and northeastern parts of the Deccan province broadly correlate with the WG sequence [20,21,22], implying that large-volume lava flows of the WG region may have travelled hundreds of kilometers to these distant areas. The Deccan CFB eruptions were followed by the India–Laxmi Ridge–Seychelles breakup at 62.5 Ma [23,24], with significant Deccan magmatism occurring syn-breakup and continuing post-breakup up to ~61 Ma in Mumbai and the Seychelles [23,25].
The westward extent and continuity of the WG sequence are less well known because the Konkan Plain (Figure 1b) is a structurally disturbed region, being part of the 62.5 Ma rifted continental margin [23]. A major tectonic structure known as the Panvel flexure (Figure 1b) is found here, in which the Deccan volcanic sequence shows a significant seaward dip with block faulting [5,32,33,34]. The island of Mumbai in the westernmost Deccan province (Figure 1a,c) shows a compositionally diverse volcanic sequence (tholeiite, spilite, and rhyolite lava flows and pyroclastics) with mafic and felsic intrusions, dipping west at ~18° (e.g., [35,36,37,38]). The Mumbai tholeiitic flows and dykes show geochemical differences with the WG sequence [39], and the entire Mumbai sequence is 62.5 Ma in age (Danian), as known from palaeontological evidence on inter-lava sedimentary and pyroclastic beds [40,41] and 40Ar/39Ar dating [23,42]. The Mumbai sequence (Salsette Subgroup of [43], Figure 1b,c) is thus significantly younger than, and unrelated to, the WG sequence. To the east of Mumbai, in the Mumbra Hills of the New Mumbai area (Figure 1b,c), Deccan lavas yet unstudied for geochemical stratigraphy dip very gently west (2–3°) and become essentially horizontal further east in isolated tablelands like Matheran (803 m) and the WG escarpment (Figure 1c).
The island of Elephanta near Mumbai (Figure 1b,c) has not yet been studied in terms of its geochemical stratigraphy. Elephanta is situated in the Panvel flexure zone in the transition between the horizontal, tholeiitic, 66–65 Ma WG sequence and the west-dipping, compositionally diverse, 62.5 Ma Salsette Subgroup on Mumbai. The Lonavala and Wai subgroups, forming the higher parts of the WG escarpment, extend westward to immediately east and south of Elephanta on the Konkan Plain [26] (Figure 1b), where they outcrop close to sea level, an effect of the Panvel flexure [18]. Determining the stratigraphic position of Elephanta in the WG sequence, or its independence from the latter, is thus key to understanding the westward continuity of the WG sequence as well as structural disturbances affecting the rifted margin. Here, we present geological, petrographic, mineral chemical, and whole-rock geochemical (major and trace element and Sr–Nd isotope) data on the Deccan flood basalt lava flows and dykes of Elephanta Island. The varied dataset helps to place these flows and dykes in the WG stratigraphic sequence, which improves our understanding of the stratigraphic and structural development of the westernmost Deccan CFB province, in the Panvel flexure zone on the western Indian rifted margin.

2. Geology of Elephanta Island
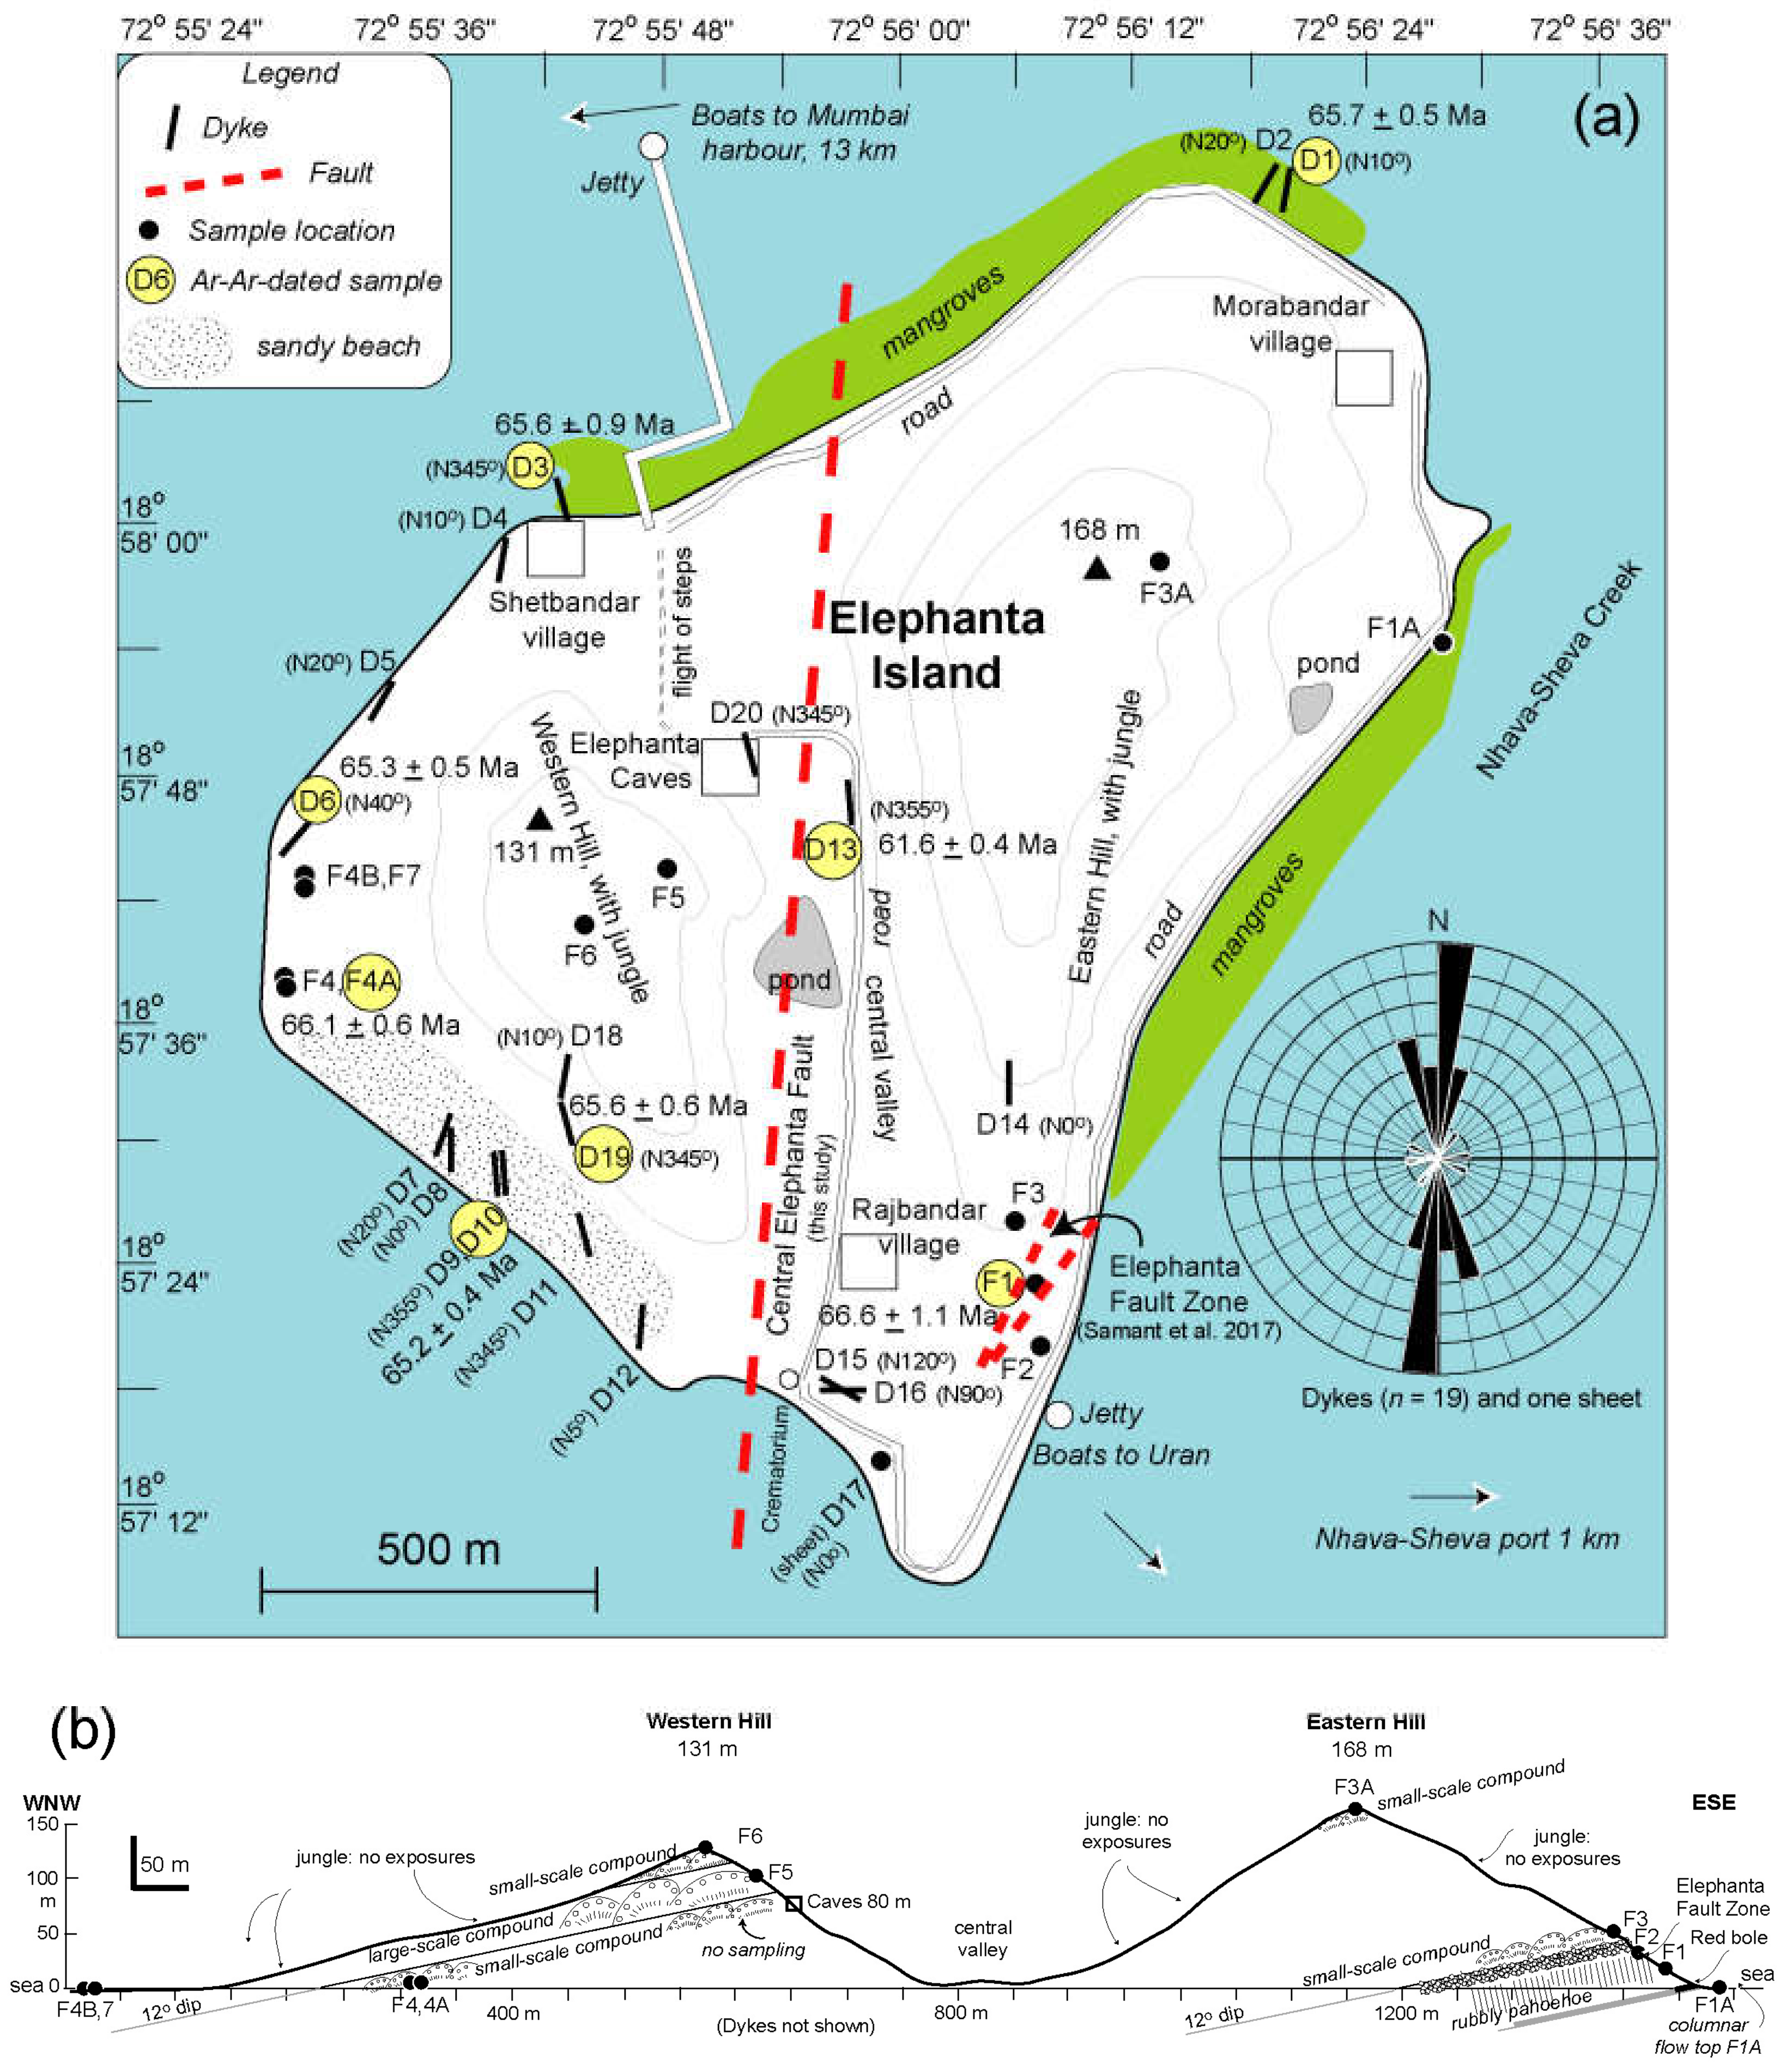
Elephanta Island (
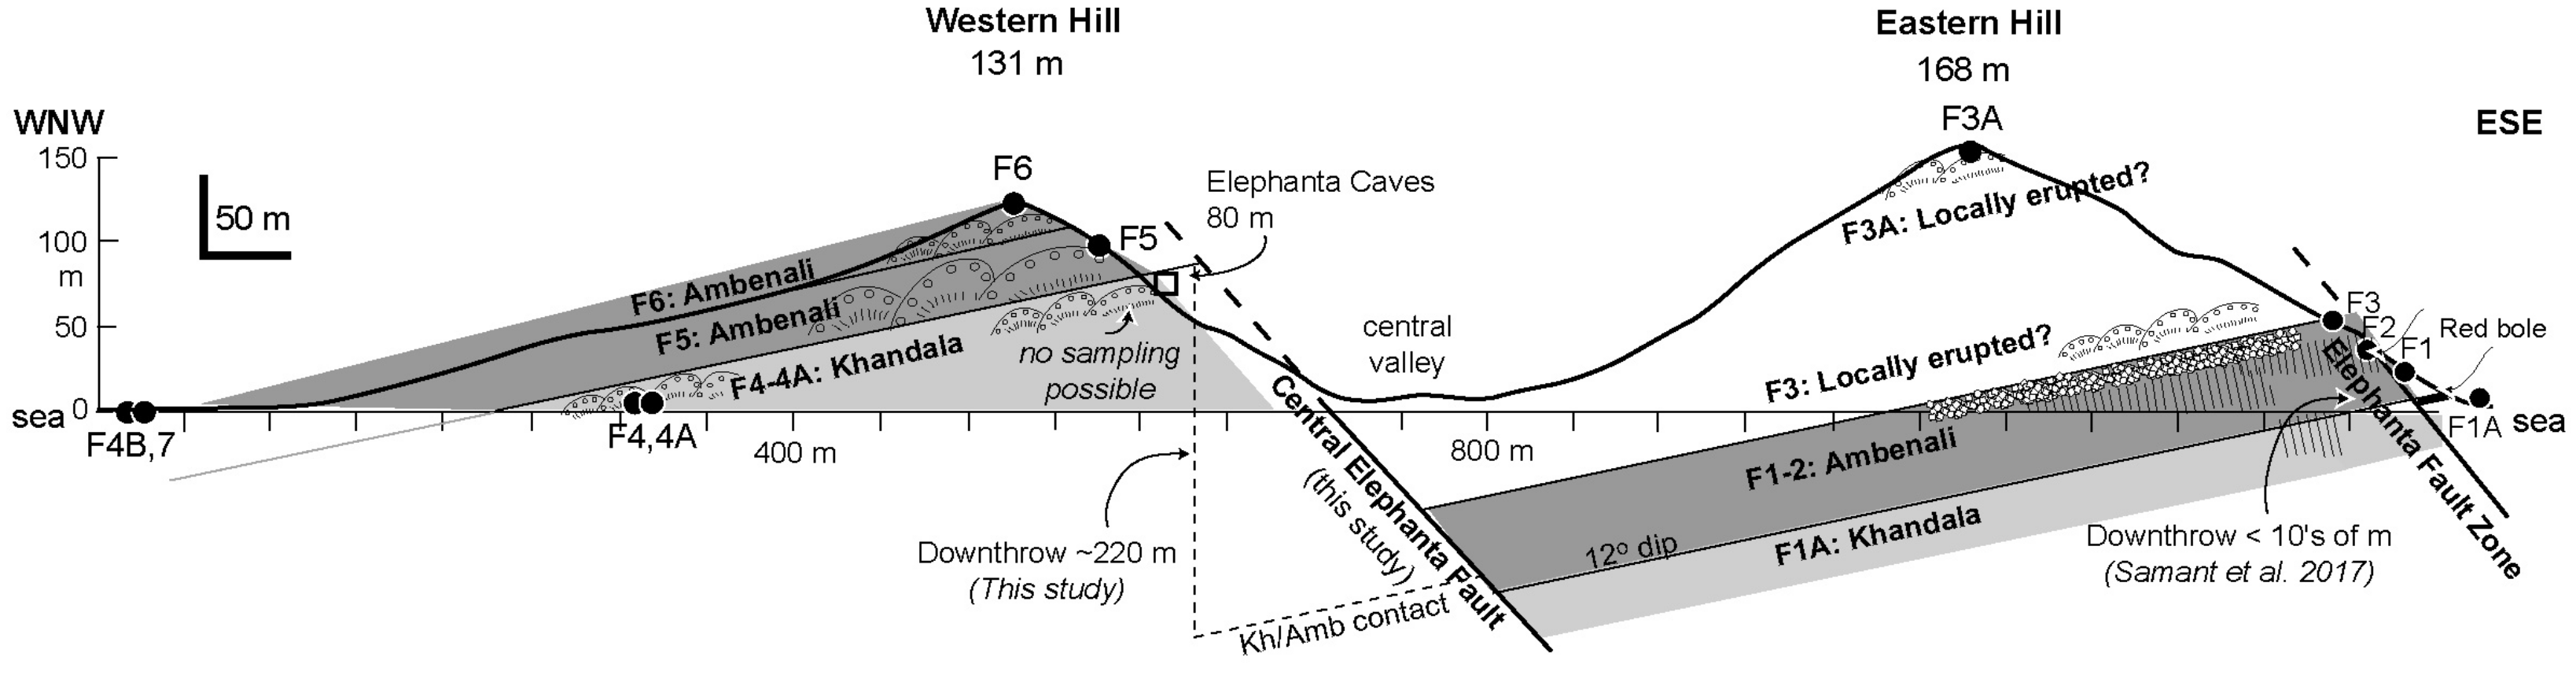
Figure 1c) has an approximately 7 km circumference, and consists of jungle-covered eastern (168 m) and western (131 m) hills separated by a ~N–S-aligned central valley (Figure 2a,b). The island is composed of subaerially erupted tholeiitic lava flows and dykes, with no evolved or pyroclastic rocks, which is in stark contrast to the nearby Mumbai. However, the Mumbai and Elephanta sequences both dip prominently westward, the latter at 12–14° (see interpretative stratigraphic cross-section in Figure 2b). The absence of post-Deccan basalt marine sediments on Elephanta Island (except for its modern peripheral tidal flats) suggests that the island has remained above sea level in post-Cretaceous time. Lava flow morphotypes observed at Elephanta include a 40 m thick rubbly pāhoehoe flow (samples ELF1, 2) in the southeastern part of the island [34], underlain by a columnar-top lava flow (sample ELF1A) exposed in the intertidal zone, the two separated by a red bole. The rubbly pāhoehoe flow is traversed by two subparallel normal faults with an oblique slip toward the east [34]. The rubbly pāhoehoe flow is overlain by compound pāhoehoe flows made up of numerous small flow units or lobes, generally weathered and amygdaloidal [44,45]. Due to jungle and the absence of interbeds or red boles, it is not possible to know the exact number of compound flows in the Elephanta sequence, but our samples ELF3, 3A, 4, 4A, 4B, 5, 6, and 7 (Figure 2b) probably represent only a small number of these.
Many mafic dykes outcrop on Elephanta Island, cutting the lava flows (Figure 2a), as does a small mafic sheet intrusion on the southeastern coast, striking N–S and dipping 45°E. Whereas most dykes are basalts and dolerites, there are also two picrite dykes (ELD9, 10) and an ankaramite dyke (ELD13). No dykes are observed to pass into lava flows, but flows fed by some of these dykes, while eroded away locally, may be preserved in sections elsewhere including the WG escarpment. The depth dimension of the dykes, where seen, indicates them to be dipping steeply east, as expected from their host lava flows dipping gently west because of the Panvel flexure. Like tholeiitic dykes in Mumbai [23,39], the Elephanta dykes show a strong ~N–S preferred orientation (Figure 2a). 40Ar/39Ar ages of 66–65 Ma [46] on two Elephanta lava flows and six dykes (including four tholeiites, a picrite, and an ankaramite) imply that the bulk of the Elephanta sequence formed rapidly, well before continental breakup, and is contemporaneous with the WG sequence. The Elephanta sequence is probably a westward stratigraphic continuation of the WG sequence, downflexed to the Arabian Sea because of the Panvel flexure, and it is this aspect that we evaluate in this study with detailed geochemical–isotopic comparisons and correlations. The Elephanta ankaramite dyke yielded a significantly younger 40Ar/39Ar age of 61.6 ± 0.4 Ma (2σ) than all the others [46], showing that the total duration of Elephanta magmatism was no less than 3.5 Myr and possibly as much as 6 Myr. Interestingly, the young age of the Elephanta ankaramite dyke overlaps with that of the Powai ankaramite flow in Mumbai [23,39], suggesting the dyke to be a potential feeder of that flow [46].

3. Samples and Analytical Methods

Our sample set from Elephanta Island consists of 31 samples, 11 of which (samples ELF1 to ELF7) come from lava flows and the rest (samples ELD1 to ELD20) from dykes (Figure 2a,b); locations of the 31 collected samples (GPS-based coordinates) are given in 
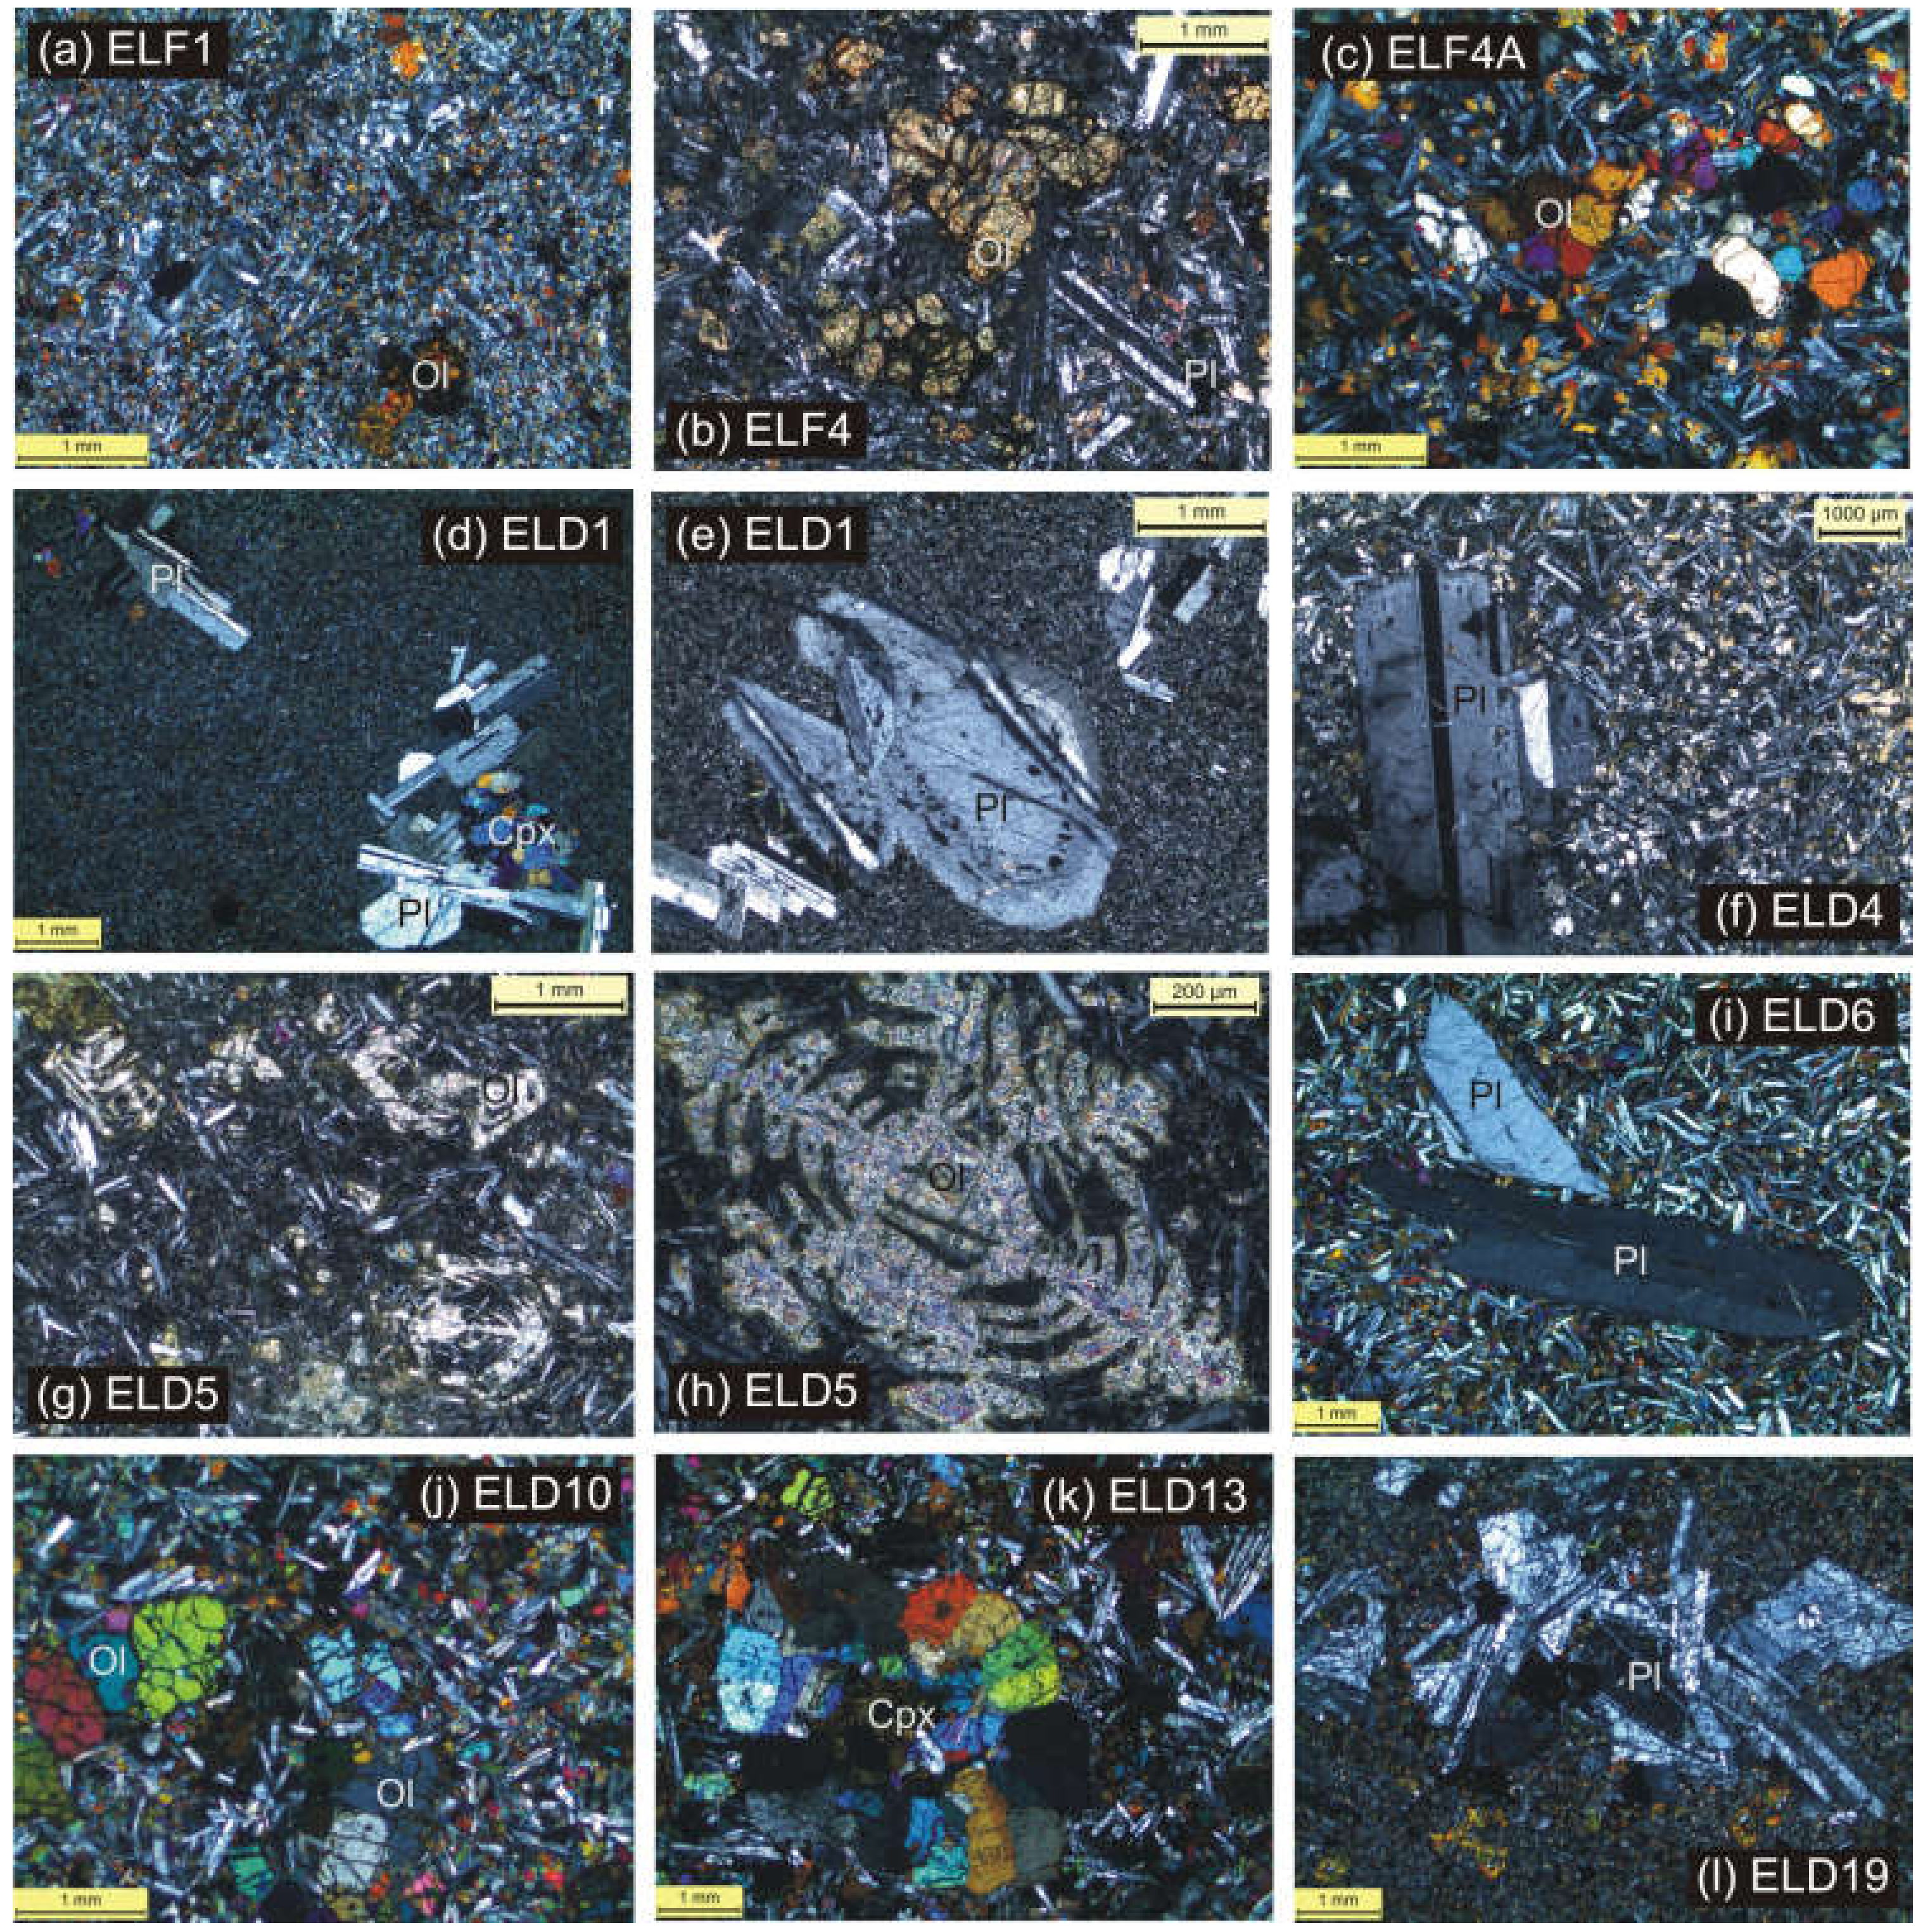
Supplementary Table S1. The samples are dark grey to black, they sometimes contain vesicles and amygdules, and whereas the basalt and dolerite samples are typically aphyric in hand specimen, samples of the picrite and ankaramite dykes are distinctly porphyritic in hand specimen, with abundant subrounded phenocrysts of olivine and clinopyroxene dispersed in a fine-grained groundmass. We took samples of 2–3 kg from each of the distinct rock units, taking care that the samples were representative of the sampled unit and as fresh as possible, without secondary minerals. As we had to sample many of the rock units (particularly the dykes) on the intertidal zone, not all samples are fresh or uniformly fresh. However, we cut slabs and then chips (of total weight of several hundred g) from the freshest interior parts of all samples using a diamond saw, and the rest of the rock material was stored away. The chips were washed with tap water and cleaned with distilled water in an ultrasonic bath. Chips that were ~3 cm in length were used for preparing thin sections for petrographic observations (Figure 3), whereas smaller chips (0.5–1 cm) were used for preparing rock powders of all 31 samples.
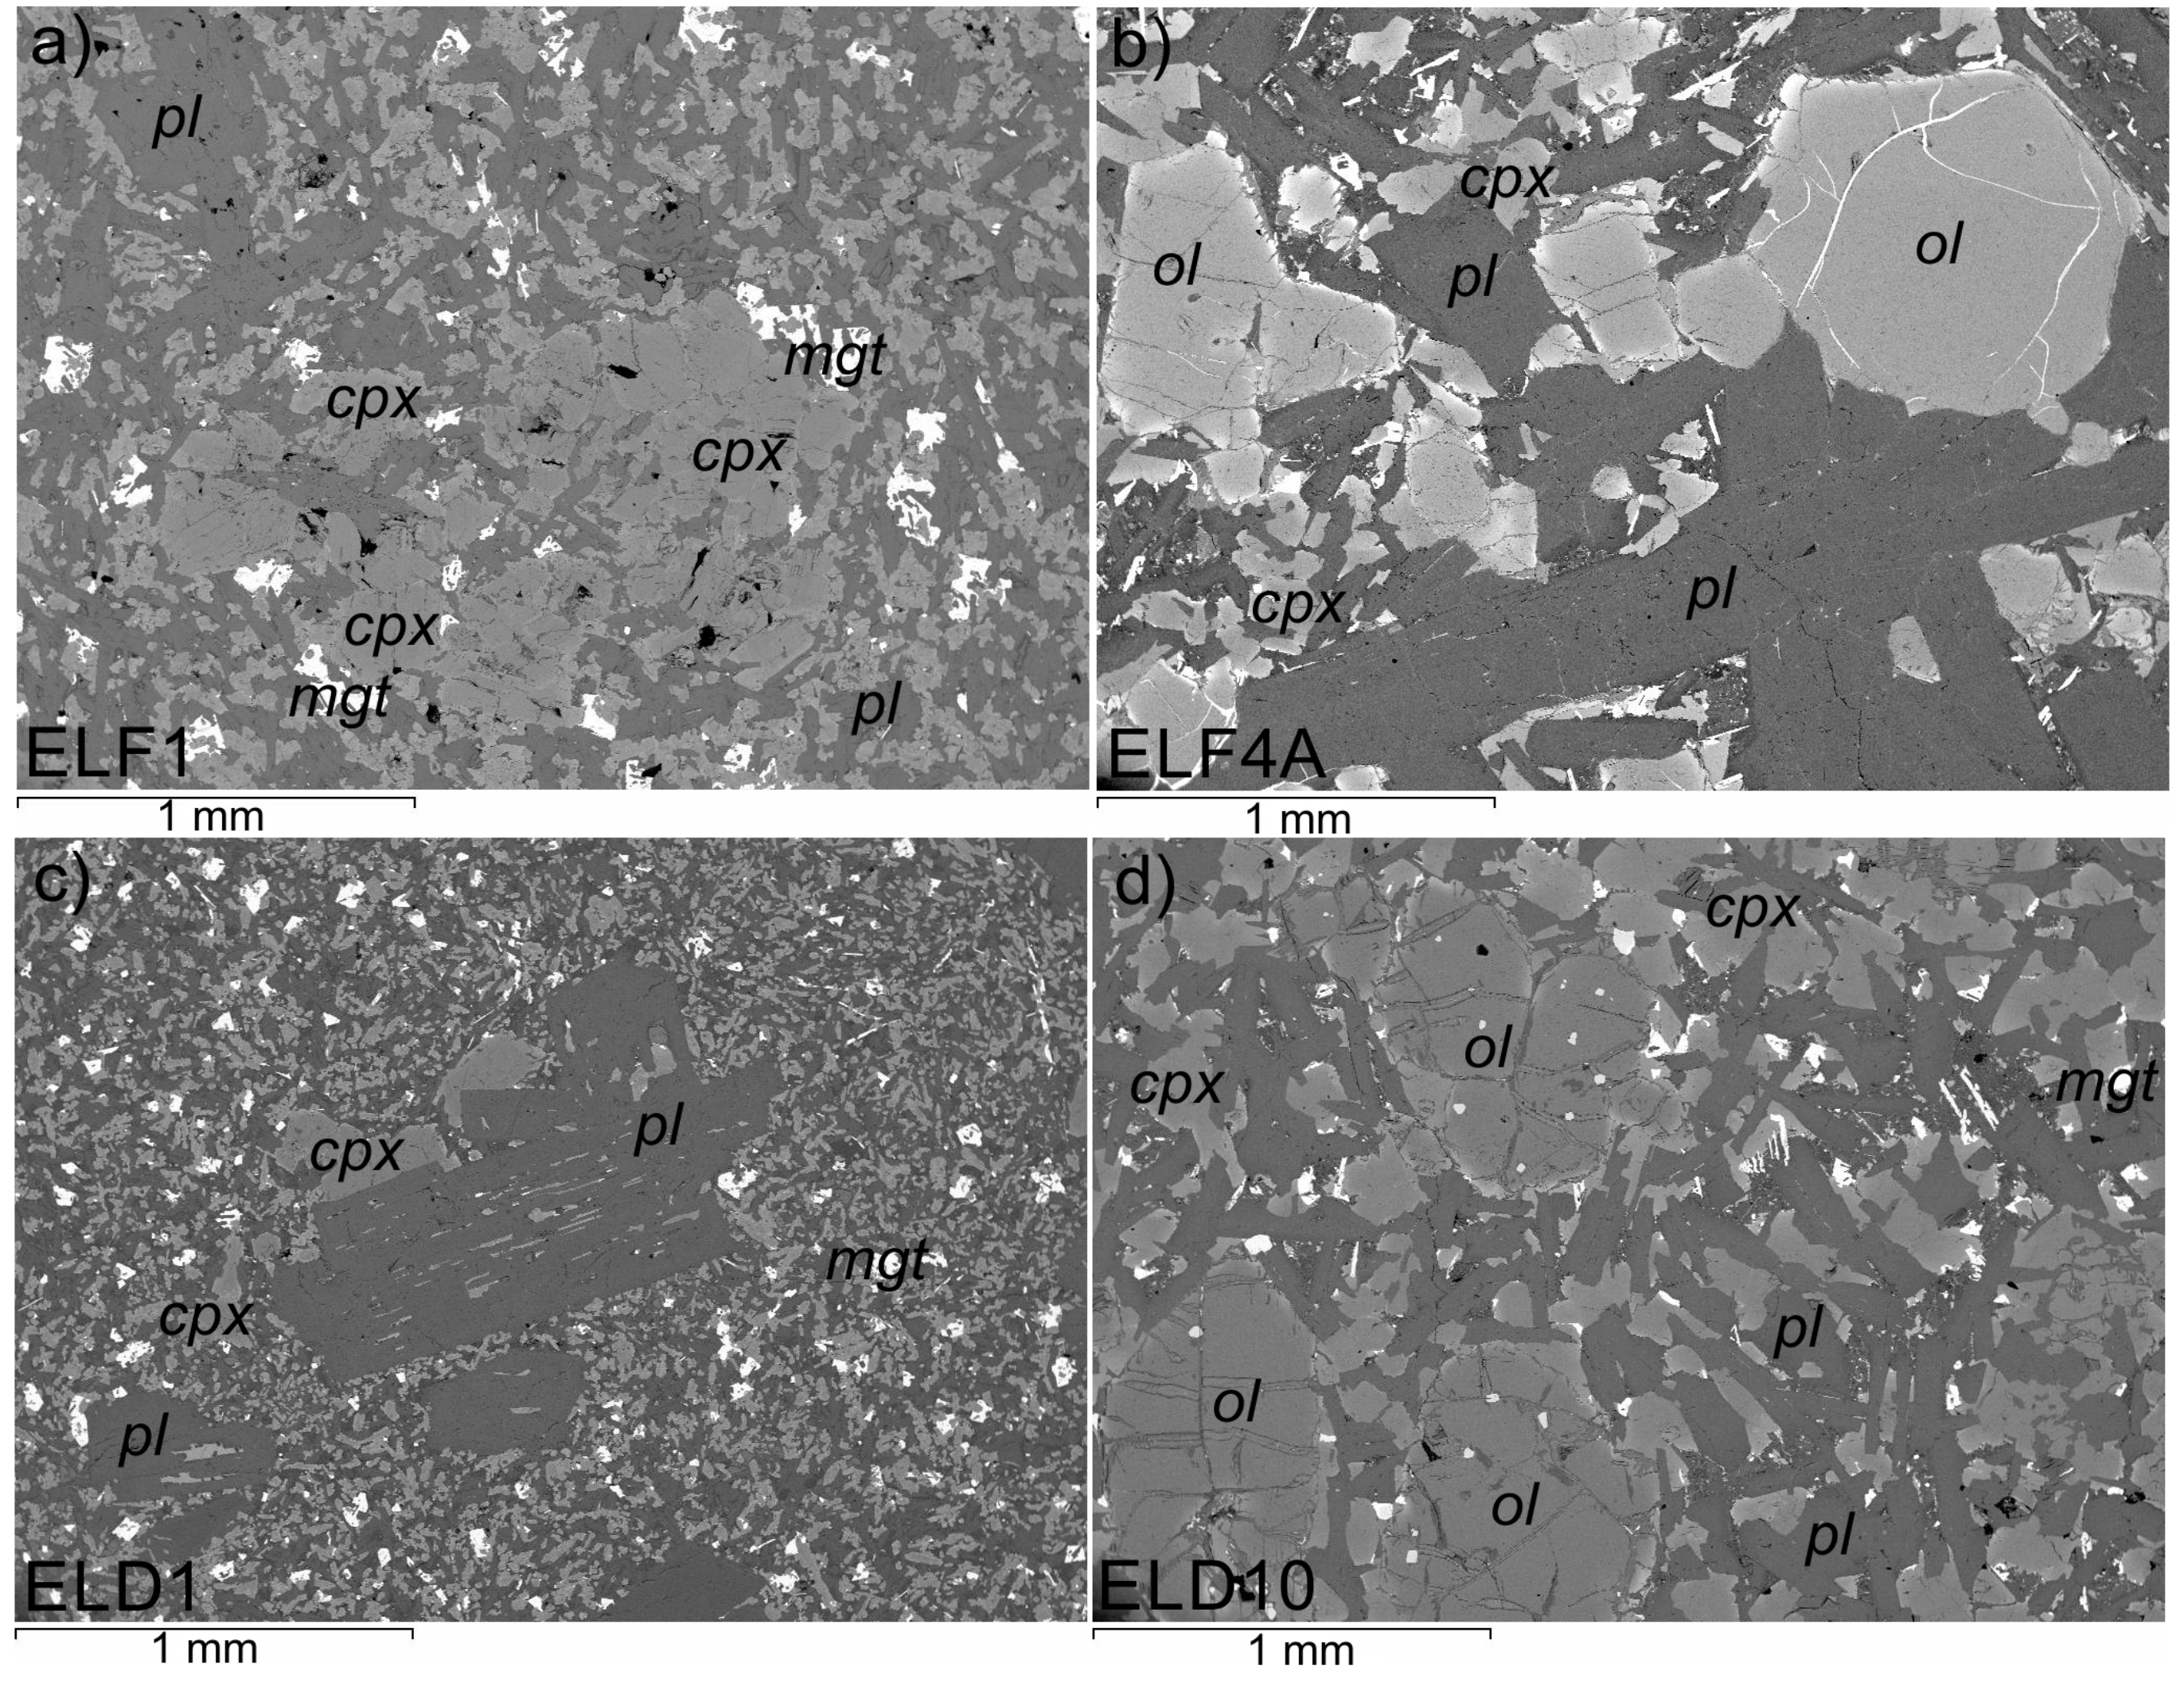
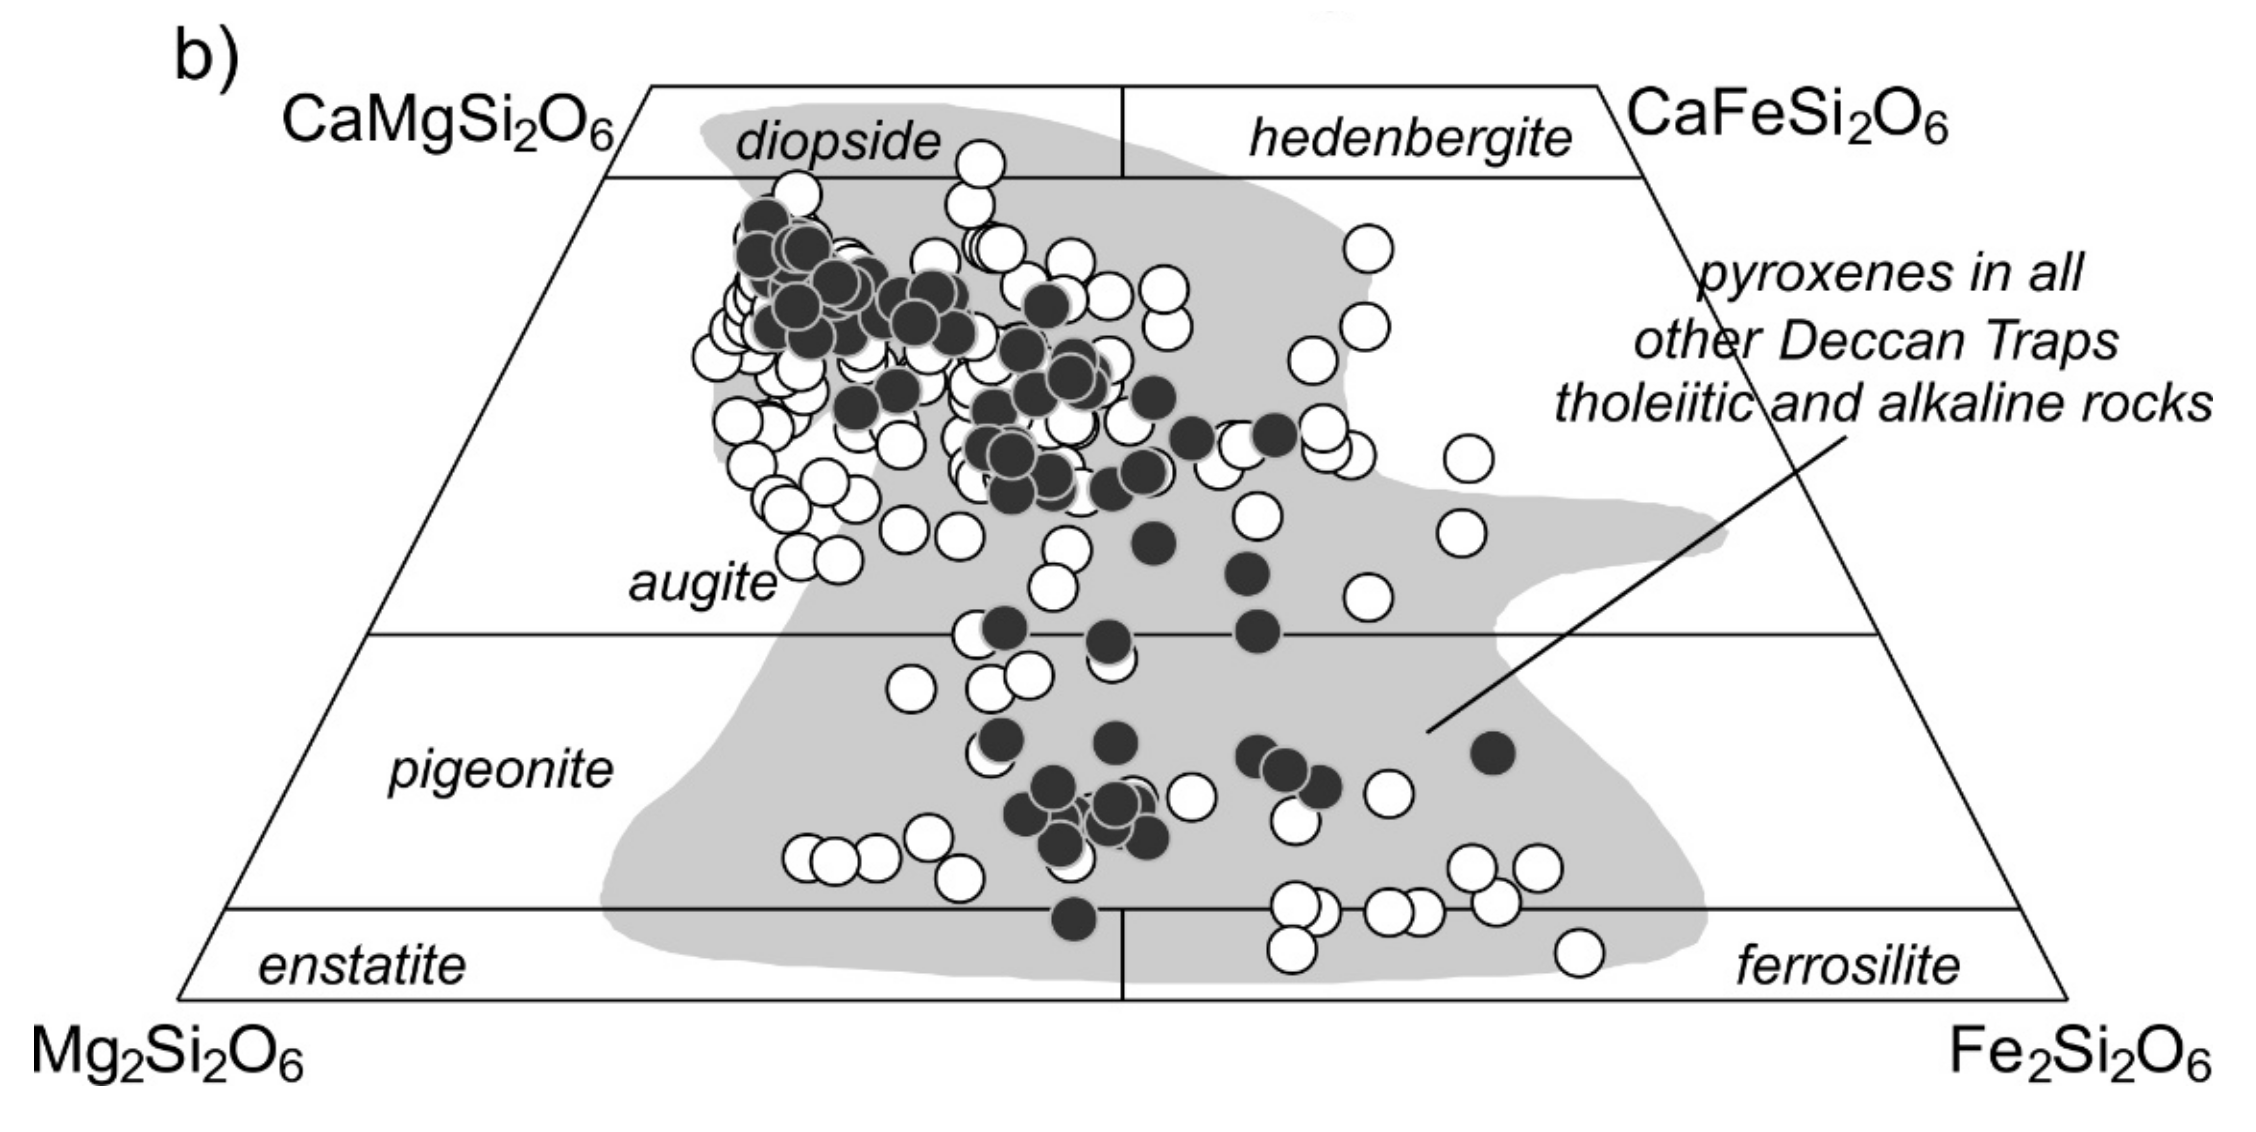
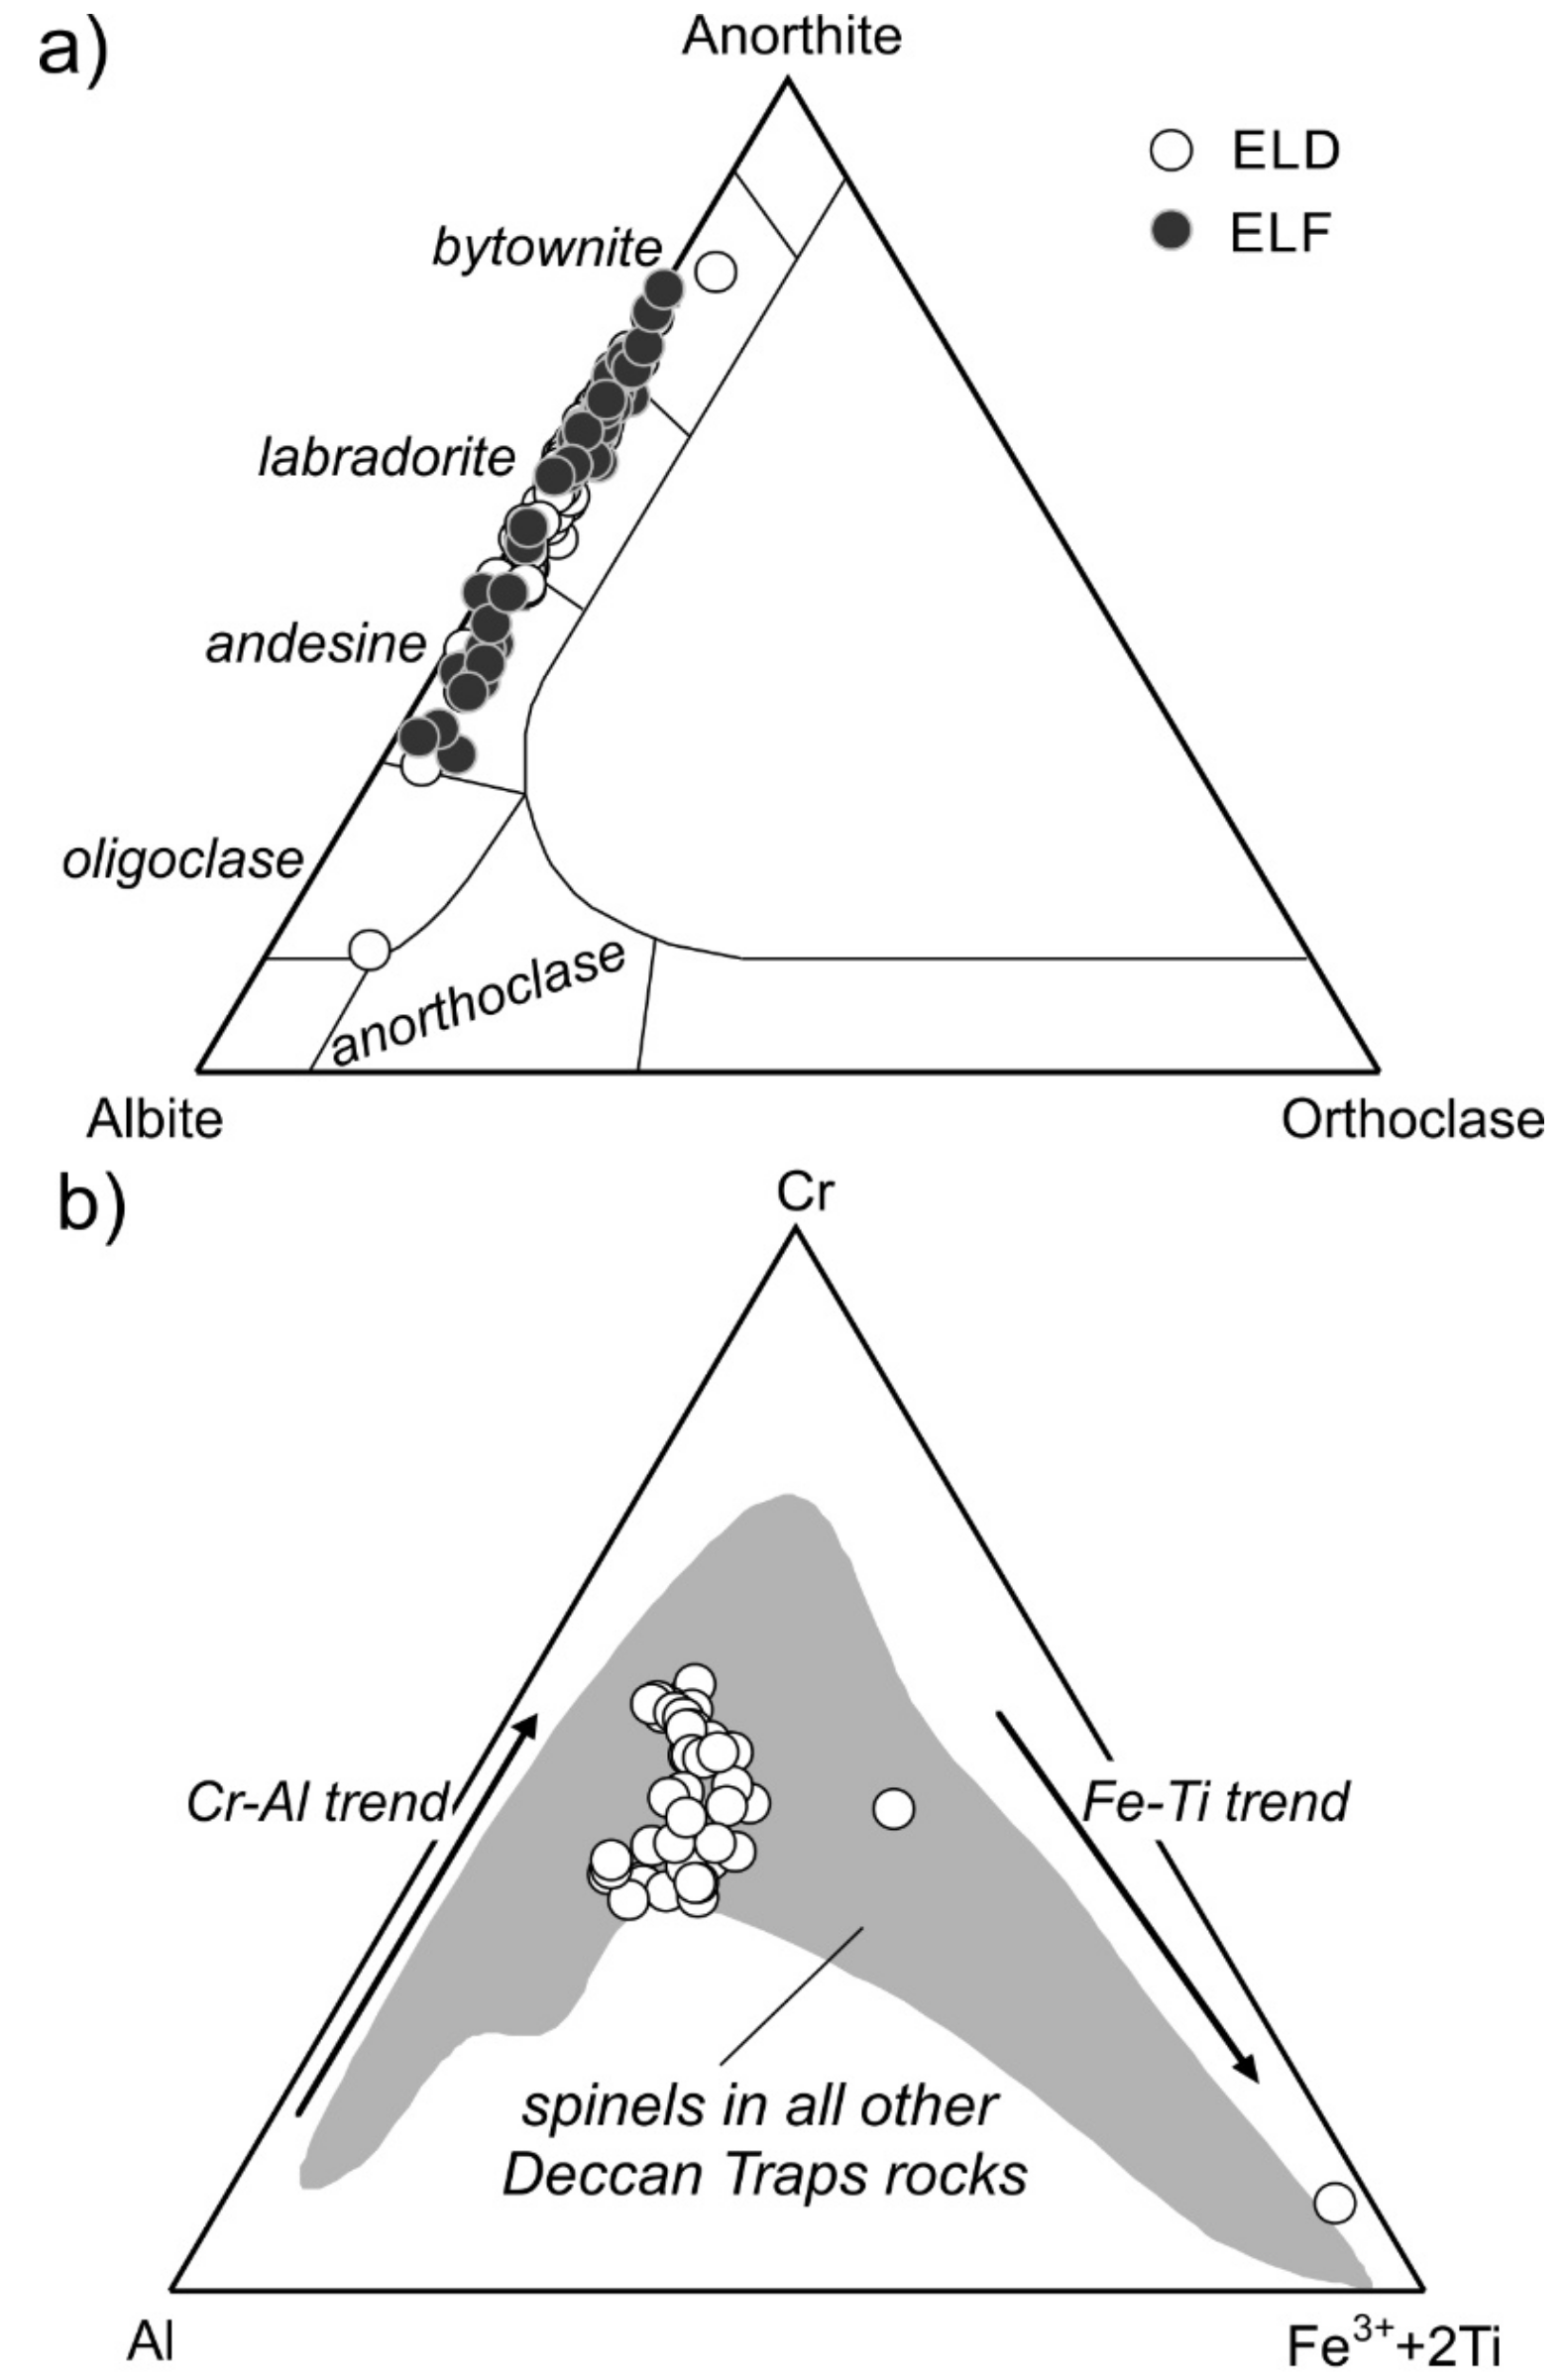
Eleven samples of the Elephanta lava flows and dykes, covering a range of minerals and textural types, were chosen for mineral chemical analysis. Approximately 600 mineral compositions (Supplementary Tables S2–S6) were obtained at the University of Naples, using an Oxford Instruments Microanalysis Unit equipped with an INCA X-act detector and a JEOL JSM-5310 microscope in energy-dispersive spectrometry (EDS). The standard operating conditions included a primary beam voltage of 15 kV, filament current of 50–100 μA and variable spot size from 30,000 to 200,000x magnification, 20 mm WD. Measurements were made with an INCA X-stream pulse processor with Energy software. Energy uses the XPP matrix correction scheme developed by [47], and the pulse pile-up correction. The quant optimization is carried out using cobalt (FWHM, full width at half maximum peak height, of the strobed zero = 60–65 eV). The following standards were used for calibration: anorthite (Ca), San Carlos olivine (Mg), anorthoclase (Si, Al, Na), albite (Na), rutile (Ti), fayalite (Fe), chromite (Cr), serandite (Mn), microcline (K), Durango apatite (P), fluorite (F), barite (Ba), strontianite (Sr), zircon (Zr, Hf), synthetic Smithsonian orthophosphates (La, Ce, Nd, Sm, Y), pure vanadium and niobium (V, Nb), Corning glass (Th and U), sphalerite (Zn), pyrite (S), galena (Pb), sodium chloride (Cl), and pollucite (Cs). The Kα, Lα, or Mα lines were used for calibration, according to the element. Backscattered electron (BSE) images were obtained with the same instrument (Figure 4).
For obtaining major element data, the small chips (~5–10 mm size) of the 31 Elephanta rock samples were cleaned in an ultrasonic bath and ground to powders of <75 μm grain size using a Retsch PM-100 planetary ball mill and stainless steel grinding balls at the Indian Institute of Technology Bombay. Solutions of the sample powders were prepared following the methods described in [45], and analyzed for major elements on a SPECTRO ARCOS inductively coupled plasma atomic emission spectrometer at the Sophisticated Analytical Instrumentation Facility (SAIF), at the Indian Institute of Technology Bombay. U.S. Geological Survey rock standards were dissolved along with the samples, where standards DNC-1, BIR-1, BCR-2, and BHVO-2 were used for calibrating the instrument. Standard W-2a was also analyzed as an unknown to estimate the analytical accuracy. Loss on ignition (LOI) values were determined by heating the rock powders to 1000 °C in platinum crucibles, after overnight drying in an oven at 110 °C to drive away adsorbed moisture (H2O). The major oxide and LOI data are presented in Table 2, along with the reference and measured values for standard W-2a. The reference and measured values for W-2a are generally in good agreement, except for Fe2O3T, whose measured value is ~5% higher than the reference value, suggesting a possible small contamination effect from the steel grinding balls.
To obtain trace element (including rare earth element) data, sample preparation vials (pressure bombs) were soaked for 4–5 h in dilute HNO3 (2–3 %), cleaned ultrasonically in distilled water, and dried. About 60 mg of rock powder was weighed into the vials and ~1.5 mL of HF-HNO3 (2:1) was added to it. Tightly capped vials were ultrasonicated for 45 min and kept overnight on a hot plate at 65 °C. A day later, the vials were opened and dried down, though not to a bone dry condition. Then, ~1 mL of 8 N HNO3 was added. The above process was repeated and 0.5 mL of 8 N HNO3 was added along with a small amount of ultrapure water and the samples were left on a hot plate for a few minutes. Dilutions were made by adding 1 mL of 200 ppb Ru (an internal standard used to determine the instrumental drift) (i.e., 20 ppb Ru in 10 mL Tarson tube and 9 mL of sample solution). The contents of the vial were transferred to a 25 mL volumetric flask with multiple washings and distilled water was added in order to dilute the solution up to the mark. A large suite of trace elements including the rare earth elements (REE) was analyzed at Thermo Fisher Scientific India Pvt. Ltd., Mumbai, using a Thermo Scientific iCAP RQ inductively coupled plasma mass spectrometer (ICPMS). Standard W-2a was also analyzed as an unknown to estimate the analytical accuracy. The full analytical details can be found in V. Patel (Ph.D. thesis in preparation), and the trace element data are presented in Table 3.
A subset of the total 31 flow and dyke samples (the three flows ELF1, ELF4A, and ELF5 from key stratigraphic positions, and eight of the largest, freshest, and petrographically interesting dykes) was analyzed for strontium and neodymium isotopic ratios at the Laboratory of Geochronology, Department of Lithospheric Research, University of Vienna. Digestion of whole-rock powders (150 mg) in a 4:1 mixture of ultrapure HF and HNO3 in tightly screwed Savillex® beakers, kept at 105 °C on a hot plate, was carried out for two weeks to ensure complete leaching of the rare earth elements (REEs). After evaporating the acids, repeated treatment of the residue using HNO3 and 6 N HCl resulted in clear solutions for all samples.
Rb, Sr, Sm, and Nd concentrations were determined from two separate sample aliquots by isotope dilution (ID) using a 87Rb–84Sr and a 147Sm–150Nd spike, respectively. The REE fraction was extracted using AG® 50W-X8 (200–400 mesh, Bio-Rad) resin and 4.0 N HCl. Neodymium and Sm were separated from the REE fraction in a second column set using Teflon powder coated with HdEHP, and 0.22 N HCl and 0.4 N HCl as the elution media, respectively. The Sr and Rb element separation followed conventional techniques using AG® 50W-X8 (200–400 mesh, Bio-Rad) resin and 2.5 N HCl as the elution media. Maximum total procedural blanks were <50 pg for Sm and Nd and <1 ng for Sr and Rb and were taken as negligible.
The purified Nd, Sm, and Sr fractions (~1 μg) were loaded on Re double filaments whereas Rb was loaded on a Ta single filament and run in static mode on a ThermoFinnigan® Triton TI thermal ionization mass spectrometer (TIMS). A 143Nd/144Nd ratio of 0.511843 ± 0.000003 (n = 5) and an 87Sr/86Sr ratio of 0.710250 ± 0.000004 (n = 6) were determined for the La Jolla (Nd) and the NBS987 (Sr) international standards during the period of investigation. Within-run mass fractionation for Nd and Sr isotope measurements was corrected for 146Nd/144Nd = 0.7219 and 86Sr/88Sr = 0.1194, respectively. External uncertainties on the 143Nd/144Nd and 87Sr/86Sr isotope ratios are quoted as 2σ errors. The Sr–Nd isotopic data are presented in Table 4.

4. Results

4.1. Petrography

The Elephanta lava flows and dykes are mostly basalts and dolerites, but also include two picrites (with abundant olivine phenocrysts) and one ankaramite (with clinopyroxene phenocrysts dominant). The rocks display a range of textures (Figure 3 and Figure 4). Olivine forms euhedral to subhedral and zoned phenocrysts or microphenocrysts, or occurs as microlites in the groundmass. Olivine phenocrysts and microphenocrysts often contain small rounded spinel inclusions. Clinopyroxene generally forms subhedral phenocrysts or microphenocrysts, or intergranular crystals in the groundmass. Plagioclase forms euhedral to subhedral lath-shaped crystals. Opaque oxides occur as microphenocrysts or as microlites in the groundmass. Pigeonite and orhopyroxene occur as small grains within the groundmass. Interstitial glass (of rhyolitic composition) and quartz are also sporadically found.
In thin section, flow sample ELF1 shows a very fine-grained texture with a few microphenocrysts of olivine, clinopyroxene, and plagioclase (Figure 3a). Flow sample ELF4 is relatively coarse-grained and shows rounded crystals of olivine and laths of plagioclase (Figure 3b). Flow sample ELF4A contains plagioclase and clinopyroxene (each ~45% modal) and ~10% olivine (Figure 3c). Dyke ELD1 shows a very fine-grained groundmass (grain size <<1 mm) and glomerocrystic aggregates of well-crystallized and fresh plagioclase and clinopyroxene (Figure 3d) as well as some small olivine phenocrysts. A few plagioclase phenocrysts in ELD1 contain concentric zones of melt inclusions (sieve texture) with clear plagioclase rims (Figure 3d,e). Dyke ELD4 contains a few plagioclase phenocrysts forming laths several millimeters long in a much finer-grained groundmass (Figure 3f). Dyke ELD5 shows quench textures, specifically, skeletal (hopper) olivines ~1 mm in diameter, in a glassy base with tiny plagioclase laths (Figure 3g,h). Dyke ELD6 contains a few large (1 cm), well-formed plagioclase phenocrysts in a fine groundmass made up of plagioclase laths forming polygonal areas that enclose glass (Figure 3i). Picrite dyke ELD10 contains many rounded and fractured olivine crystals ~2 mm in size, in a finer groundmass (Figure 3j). Ankaramite ELD13 (Figure 3k) is a striking-looking rock with large glomerocrystic aggregates of twinned clinopyroxene grains (many of which have zones of melt inclusions), and olivine, clinopyroxene, plagioclase, and oxides in the groundmass. Dyke ELD19 contains, in a fine-grained groundmass, glomeroporphyritic aggregates of large (several mm), somewhat altered plagioclase, with microphenocrysts of clinopyroxene (Figure 3l).

4.2. Mineral Chemistry

Olivine has a wide range of composition from Fo87 to Fo45 in picrite samples ELD9 and ELD10 (where Fo = atomic Mg × 100/(Mg + Fe2+)). In the basalt and dolerite samples, olivine compositions range from Fo79 to Fo24 from the cores through the rims to the groundmass microlites (Figure 5a). Increases in manganese and decreases in magnesium are observed from the cores to rims; no reverse zoning is observed. Assuming a KdMg/Fe = 0.30 ± 0.03 [51] (Figure 5a), olivines with the highest Fo contents in flow sample ELF4A are in equilibrium with the bulk-rock composition. Flow sample ELF7 contains olivines too evolved to be in equilibrium with the bulk-rock composition. Among the dykes, the most magnesian olivines in the samples ELD4, 6, 9, and 10 are in equilibrium with the bulk-rock. Olivine-liquid equilibration temperatures were calculated using the geothermometer spreadsheet of [52]. For temperature estimation, we used only olivines falling on the olivine-liquid equilibrium bands. Olivine-liquid equilibration temperatures calculated using the [52] (Equation (22) therein) spreadsheet range from 1318 to 1330 °C in the picrite ELD9, and from 1234 to 1173 °C in the tholeiitic flows and dykes. Similar temperatures (1322 °C for ELD9 and 1220–1176 °C for tholeiitic flows and dykes) have been obtained using whole-rock major element compositions (FeOt, MgO, Na2O, K2O, H2O) [52] (Equation (15) therein). The temperatures were calculated using the pressure values obtained from the clinopyroxene-liquid geothermometer of [52].
Augite-ferroaugite (Ca24Mg55Fe21 to Ca44Mg45Fe11) is the Ca-rich clinopyroxene of Elephanta rocks and is accompanied by groundmass pigeonite (Ca5Mg50Fe45 to Ca20Mg33Fe47) and orthopyroxene (Ca3Mg57Fe40 to Ca3Mg25Fe72) (Figure 5b). TiO2 and Al2O3 contents in augite and ferroaugite are low (0–2.6 wt.% TiO2 and 0.6–5.9 wt.% Al2O3). The pyroxenes of the Elephanta rocks analyzed in this study lie within the field defined by the pyroxenes of Deccan rocks [53,54,55,56] (Figure 5b). Equilibration temperatures of groundmass clinopyroxenes and pigeonites in the Elephanta flows and dykes, based on the two-pyroxene geothermometer of [57], range from ~1100 to 900 °C. Similar temperatures (1113–924 °C) are obtained for groundmass pigeonites using the algorithm of [58]. Temperatures calculated using the clinopyroxene-liquid geothermometer of [52] range from 1202–1172 °C for the picrites to 1195–1123 °C for the basalts and dolerites. Pressure estimates based on the clinopyroxene-liquid geothermometer of [52] and the clinopyroxene barometer of [59] range from 0.1 to 4.0 kbar and from 0.8 to 3.9 kbar, respectively, indicating clinopyroxene crystallization during magma ascent or storage in the shallow crust.
Plagioclase in the Elephanta lava flows and dykes shows a wide range in composition from bytownite (An79) to andesine (An31), with very rare oligoclase (An12; Figure 6a). The iron content (as FeOt) ranges from 0.2 to 1.9 wt.%.
Chromiferous spinel is found as inclusions in olivine and sometimes in clinopyroxene crystals of Elephanta dykes. Its chromium number Cr# (= atomic Cr × 100/(Cr + Al)) ranges from 74 to 60 in the picritic samples (ELD9, 10) and from 62 to 45 in the basalt and dolerite samples. The spinels of picrites show distinct Cr2O3, Al2O3, and FeOt contents and chemical trends compared to the spinels of tholeiitic basalts, which indicate different and unrelated parental magmas. In the Cr–Al–(Fe3+ + 2Ti) diagram (Figure 6b), data for the chromiferous spinels of the Elephanta dykes plot within the field of spinels of Deccan rocks [53,55].
The ubiquitous groundmass Ti–magnetite has ulvöspinel ranging from 1 to 90 mol% in lava flows and from 12 to 88 mol% in dykes (Figure 6c). The Al2O3 concentration in Ti–magnetite ranges from 0.03 to 3.06 wt%. Ilmenite (ilm87-98) has low Al2O3 (<0.5 wt.%) and variable MgO (0.3–4.6 wt.%) contents. Equilibrium temperatures and oxygen fugacities of coexisting magnetite and ilmenite, calculated using the ILMAT program of [60], range from 1131 to 875 °C and from −14.0 to −9.4 logfO2 units for the picrites, and from 1141 to 680 °C and from −20.7 to −9.9 logfO2 units for the basalts and dolerites. The data tightly cluster around the quartz–fayalite–magnetite (QFM) synthetic oxygen buffer at low pressure similar to the values reported for other Deccan rocks [53,54,55,56].

4.3. Whole-Rock Geochemistry: Nomenclature and General Compositional Characteristics

We used the SINCLAS program [49] to obtain the CIPW norms, Mg Numbers (Mg#), and standardized, IUGS-recommended rock names [48] for the samples, based on LOI-free adjusted data. Total iron was divided into Fe2+ and Fe3+ varieties based on the scheme of [61], which is built into the program. Twenty-eight of the 31 Elephanta Island rocks analyzed for major elements are classified as subalkalic basalt including dyke ELD13, which is petrographically an ankaramite. Two samples are classified as picrite (dykes ELD9, 10), in conformity with their olivine-rich and high-MgO nature, whereas a single sample (dyke ELD20) is classified as an alkali basalt, though for only a trace amount of normative nepheline (0.07 wt.%). Subalkalic basalts (and basaltic andesites, not represented at Elephanta Island) constitute the overwhelming majority of Deccan “flood basalts” [14,21,54,55,62].
LOI-free recalculated MgO contents of the Elephanta flows range from 5.69 wt.% (ELF3A) to 10.30 wt.% (ELF7), and Mg# values from 48.9 (ELF3A) to 63.1 (ELF7), where Mg# = [atomic Mg/(Mg + Fe2+)] × 100, assuming Fe2+ to be 85% of total iron. In comparison, recalculated MgO contents of the Elephanta dykes range from 5.37 wt.% (ELD1) to 12.59 wt.% (ELD9), but for many samples, they are 6–8 wt.%. The dykes’ Mg# values range from 43.8 (ELD4) and 45.0–45.1 (ELD1, 8) to 68.3–68.4 (ELD10, 9). Three of the dykes contain a little (1–2 wt.%) normative quartz, whereas all dykes except ELD20 are hypersthene-normative and thus subalkalic.

4.4. Whole-Rock Geochemistry: Alteration

Elements such as Rb, K, and Sr are highly mobile during alteration and weathering, as is Ba during advanced weathering (e.g., [22]). Though material as fresh as possible was collected in the field, outcrop and petrographic observations as well as LOI values indicate considerable alteration in some flows or parts thereof. LOI values range from 0.65–0.95 wt.% (ELF1A, 1) to well over 3 wt.% (ELF5, 6) and as much as 4.62 wt.% (ELF3A) (Table 2). The dykes are generally fresher; LOI values are well below or around 1 wt.% for many dykes, though they reach 3.00 wt.% in ELD5 and 4.43 wt.% in ELD20 (Table 2). This alteration may have resulted in the loss (or gain) of the more mobile elements such as K, Na, Rb, Ba, Sr, and Pb. As noted, many of our dykes outcrop in the intertidal zones along the coast of Elephanta Island, surrounded by many maritime and chemical industries that have severely polluted the sea [44]. Given these issues, we treat the concentrations of the mobile elements with caution, and generally only use the alteration-resistant elements (Ti, Zr, Nb, Y, Th, and the REE) and their ratios as well as isotopic ratios (particularly of Nd) for geochemistry-based interpretations.

5. Geochemical Correlations with the Western Ghats Sequence

5.1. The Need for Geochemical Correlations

Our objective is to evaluate (i) whether the 66−65 Ma Elephanta lava flow sequence is the western continuation of the 66−65 Ma WG sequence, and if so, which specific formations of the latter are represented at Elephanta Island; and (ii) whether the Elephanta dykes themselves could represent feeders to the lava flows of any of the WG stratigraphic formations. The answers to these questions will help in understanding the stratigraphic and structural framework of the western Deccan CFB province.
The physical features of Deccan lava flows are not useful guides to their stratigraphic position. Rubbly pāhoehoe flows that are tens of meters thick and columnar-jointed (“simple” flows of [63]) are characteristic of all formations in the Wai Subgroup [64], thus constituting a 1300 m thickness (Table 1). Such simple flows are also characteristic of the 140 m thick Khandala Formation. Similarly, compound pāhoehoe flows (those made up of numerous small flow-units or lobes, [63]) are found in all five formations of the Kalsubai Subgroup, and are particularly characteristic of the Bushe Formation [65], thus together constituting a >1900 m total stratigraphic thickness (Table 1). Thus, the potential correlatives of the Elephanta rubbly pāhoehoe and compound flows in the WG sequence could be many. Furthermore, the fact that individual WG formations (geochemically defined) may drastically change their physical character laterally complicates attempts at physical correlation. For example, the Khandala Formation flows, forming thick, extensive, columnar-jointed simple flows or sheet lobes in the WG escarpment, are distinctly compound in distant sections such as Ajanta and Ellora (Figure 1a) in the central Deccan [21,66].
Similarly, the petrographically undistinctive nature of the Elephanta tholeiitic flows and dykes also provides no clues to their stratigraphic position. Even picritic horizons occur interspersed at various levels in the WG sequence [14,67,68], and the so-called giant plagioclase basalts found in the WG sequence [14,69] are not encountered on Elephanta Island.
Previous studies of lava sequences exposed in parts of the Deccan lacking an established stratigraphy have employed several types of geochemical data in order to make comparisons with the WG stratigraphic sequence (e.g., [20,21,22,54]). These include (i) binary discriminant diagrams using major and trace elements and element ratios; (ii) multivariate statistical methods (particularly discriminant function analysis); (iii) normalized multielement patterns; and (iv) Sr–Nd–Pb isotopic ratios. The same types of data have been used to systematically correlate mafic dyke swarms to particular WG formations, members, or flows [17,19], and are also used in the present study.

5.2. Binary Diagrams

To compare the Elephanta flow and dyke data to the WG sequence, we employ a plot of Ti/Y vs. Zr/Nb ratios (Figure 7) involving four alteration-resistant incompatible elements. The Zr/Nb ratio is unchanged even during extreme alteration (e.g., [70]), and both ratios are insensitive to the olivine-gabbro fractionation well known for the WG sequence [56,67,71,72]. The two ratios, however, change in opposite directions during crustal contamination. In Figure 7, data for the Lonavala Subgroup basalts (as separate Khandala and Bushe Formations) and the Wai Subgroup basalts are also plotted. These two subgroups are chosen for comparison (see also Table 5) because current geological mapping (Figure 1c) shows these to extend nearly up to Elephanta from the east and south, respectively. None of the Elephanta rock data plot in the Bushe Formation field. On the other hand, most Elephanta flow and dyke data plot in the area of overlap between the Khandala Formation and the Wai Subgroup, and several Elephanta flow data plot in or close to the Khandala Formation field.
In binary plots of Nb/Zr vs. Ba/Y (Figure 8a) and Sr vs. Nb/Zr (Figure 8b) the Elephanta flow and dyke data mainly plot within the areas of overlap between the Khandala, Bushe, and Poladpur formations. However, in a plot of TiO2 vs. Zr/Y (Figure 8c), the data for most samples plot within the area of overlap between the Khandala, Poladpur, and Ambenali formations, and the Bushe Formation is excluded, as in Figure 7.
Binary diagrams are thus seen to have limited utility in correlating the Elephanta flows and dykes with specific WG formations, because substantial overlap exists in the compositional characteristics of several formations and the Elephanta rock data plot in these areas of overlap. However, the usefulness of these plots is in showing unanimously that the Bushe Formation of the middle Western Ghats stratigraphy is not represented at Elephanta Island.

5.3. Discriminant Function Analysis

Discriminant function analysis (DFA) was performed in order to quantitatively evaluate chemical affinities of the Elephanta flows and dykes to the WG formations. For this, a dataset consisting of 623 samples from all formations except the Panhala was processed using the SPSS 7.5 for Windows (Student Version) software. The methodology utilized is essentially the same as followed by earlier workers (e.g., [17]). We did not use any major elements, as these are not useful discriminants due to the large overlaps in them between various WG formations (see e.g., [74]). We also did not use any derived variables (Zr/Y ratio, Mg number, etc.), Pb–Th–U–REE (available for few WG basalts), and Cr (given contamination issues for the WG dataset).
We used the seven trace elements Ba, Nb, Ni, Sc, Sr, Y, and Zr. The WG and Elephanta data were first transformed to standardized values (Z scores). The Z score for a sample for any element is the number of standard deviations it is from the mean. The program calculated the F-statistic (essentially, the ratio of the between-group variability to the within-group variability) for each variable and also the discriminant functions, group centroids, and Mahalanobis distance of each sample from the nearest formation centroid. A lower value for the Mahalanobis distance indicates a greater probability of a sample belonging to a particular formation. For the WG dataset, seven canonical discriminant functions were obtained, accounting for progressively decreasing percentages of the total variance in the dataset. This means that function 1 is a more effective discriminator between the groups (i.e., stratigraphic formations) than function 2, and so on. We used functions 1 and 2 in this paper, as they account for 41.9% and 31.9% of the total variance, respectively.
The formation matches obtained with DFA are given in Table 6 and the results are plotted in Figure 9. Most Elephanta flow samples are correlated with the Khandala and Poladpur formations, with one flow being correlated with the Bhimashankar and Bushe formations each. The dyke samples also include many which correlate with the Khandala and Poladpur formations, one dyke each correlating with the Thakurvadi (ELD7) and Neral (ELD13) formations, and dyke ELD20 correlating with the Mahabaleshwar Formation. Despite these matches, note that ELD13 is a younger (62 Ma) ankaramite dyke, which cannot represent a feeder to the Neral Formation. Additionally, if the Elephanta lava flows indeed represent the Khandala and Poladpur formations, a Thakurvadi match for dyke ELD7, which cuts the Elephanta flows, would be inconsistent with the WG stratigraphy, whereas a Mahabaleshwar Formation match for dyke ELD20 and the Khandala-Poladpur matches for several dykes would be consistent with it.
Previous experience (e.g., [17]) suggests that DFA by itself is insufficient for correlation and must be used in conjunction with other types of evidence (such as normalized multielement patterns and isotopic data) to aid correlation.

5.4. Multielement Patterns

To further evaluate their stratigraphic affinities, the Elephanta flow and dyke data were compared with data for individual flows or members from various WG formations using primitive-mantle-normalized multielement patterns. Several formations that are difficult to discriminate with binary diagrams or DFA nevertheless have distinct multielement patterns. For example, the Ambenali and Poladpur can be distinguished on the basis of the former’s lack of significant Pb peaks. Little-altered samples of the Mahabaleshwar and Poladpur can be distinguished from each other by the former’s normalized K being lower than the normalized Nb and Ta. The Poladpur and Khandala both show sizeable Pb peaks and sometimes Nb–Ta troughs relative to Th and La. They can be mutually distinguished from the overall slope of the pattern from left to right; the Poladpur being almost flat and the Khandala considerably steeper [22,54].
Multielement patterns of Elephanta flows ELF1-2, 5, and 6 are more similar to that of the Ambenali Formation pattern than any other (Figure 10a). One difference is in the sizeable Pb peaks in the Elephanta flows’ patterns, which the Ambenali pattern lacks, as noted. However, except for the Pb peaks, the overall convex-upward shape of the patterns is similar (Figure 10a). Patterns for the flow samples ELF3 (overlying ELF1-2) and ELF3A (overlying ELF3) are more similar to the patterns for some of the members of the Poladpur Formation (such as Visapur or Kusgaon, Figure 10b). In the binary plots (Figure 7 and Figure 8), flow ELF3 does not clearly resemble the Poladpur or any other Deccan formation, whereas flow ELF3A resembles the Poladpur Formation.
The multielement pattern for the Elephanta flow ELF1A, underlying flow ELF1-2, is similar to the patterns for flows of the Khandala Formation (Figure 10c). Note how these patterns, when followed from left to right, show a considerable slope from left to right, whereas the Poladpur pattern in Figure 10c is nearly flat. Similarly, patterns for the Elephanta flow samples ELF4, 4A, 4B, and 7 closely resemble the Khandala patterns, and are not similar to the Poladpur pattern (Figure 10d).
With regard to the Elephanta dykes, picrite dykes ELD9 and ELD10 resemble the Khandala Formation in their multielement patterns (Figure 11a). Dyke ELD1 has a pattern roughly similar to the Bushe Formation pattern, though a significant difference exists (Figure 11b). Dykes ELD4, 7, 8, 15, and 16 have patterns similar to that of the Poladpur Formation, though again not completely, as these patterns are steeper than that of the Poladpur, though not as steep as the Khandala patterns (Figure 11c). A large number of dykes have patterns similar to the Ambenali pattern, notwithstanding the small Pb peaks. These dykes include ELD2, 3, 6, 12, 17 (sheet), and 19 (Figure 11d) as well as dykes ELD11, 14, and 18 (Figure 11e). Finally, dykes ELD5 and 20 have patterns similar to the Mahabaleshwar Formation pattern; note their higher normalized Nb relative to normalized K, though it is not clear to what degree this may be alteration-related (Figure 11f).

5.5. Sr–Nd Isotopic Ratios

Strontium, Nd, and Pb isotopic ratios have been by far the most useful line of evidence in regional correlations among exposed sections or between dykes and flows in the Deccan province (e.g., [17,19,22]). Isotopic ratios of Sr, Nd, and Pb are not affected by fractional crystallization. The Nd isotopic ratios, in particular, are also known to not change appreciably by even high degrees of post-eruption subaerial alteration [22,76,77]), whereas Sr and especially Pb isotopic ratios are prone to such alteration (but see [27,54]). Additionally, the WG sequence shows a great range in initial Sr–Nd isotopic ratios (age-corrected to 65 Ma), with εNd(t) ranging from +8 to –20, and (87Sr/86Sr)t from <0.704 to >0.720 (Figure 12). Several WG stratigraphic formations are well separated in this plot, particularly toward more “enriched” compositions (lower 143Nd/144Nd and higher 87Sr/86Sr).
Of the three Elephanta flows analyzed for the Sr–Nd isotopic ratios, data for the ELF4A plot in the Khandala Formation field, though in its area of overlap with the Thakurvadi Formation field (Figure 12). Note that stratigraphically (Figure 1c), flow ELF4A is most unlikely to represent the Thakurvadi Formation, as the Kalsubai Subgroup does not extend to anywhere near Elephanta. The placement of flow ELF4A in the binary diagrams (Figure 7 and Figure 8) and its normalized multielement patterns (Figure 10) also indicate a Khandala Formation affinity.
On the other hand, Sr–Nd isotopic data for Elephanta flows ELF1 and ELF5 plot well within the Ambenali Formation field, though in its area of overlap with the Mahabaleshwar Formation field. It is noteworthy that the change from Ambenali to Mahabaleshwar magmas in the WG is gradual, with much isotopic overlap, and the upper Ambenali lavas show some Mahabaleshwar-like characteristics [13,72,78]. Binary diagrams and multielement patterns (Figure 7, Figure 8, Figure 10) suggest that Ambenali is the correct choice of the two in all geochemical aspects. We therefore consider the Elephanta flow ELF4A to represent the Khandala Formation and flows ELF1 and ELF5 to represent the Ambenali Formation of the WG sequence.
Whereas eight Elephanta dykes were analyzed for the Sr–Nd isotopic ratios, as many as six (ELD3, 6, 8, 11, 17, 19) are located in the Ambenali Formation field, though in its area of overlap with the Mahabaleshwar Formation field (and also Panhala for ELD8) (Figure 12). Binary plots (Figure 7 and Figure 8) are consistent with an Ambenali Formation match for these dykes, whereas multielement patterns for five of these six dykes (except ELD8) also match those of the Ambenali Formation the most (Figure 11d,e). The ELD8 pattern resembles the Poladpur pattern somewhat more (Figure 11c), but this dyke is not Poladpur-type in its isotopic ratios. Sr–Nd isotopes of Elephanta picrite dyke ELD10 (65.2 Ma, [46]) locate it outside any of the WG formation fields, though somewhat near the Mahabaleshwar Formation field, whereas this dyke is similar to the Khandala in its multielement pattern (Figure 11a). A Bushe Formation affinity for any Elephanta rocks is totally excluded by the isotopic data as well as the elemental data.
Additionally plotted in Figure 12 are the data for tholeiitic dykes of the Coastal swarm of the Deccan, many of which are inferred to be feeders to the Poladpur and Ambenali formations [18,19]; the close similarities of the bulk of the Elephanta tholeiitic dykes to these are evident. There are also tholeiitic dykes in Mumbai with Ambenali-type isotopic compositions [39]; these were later dated at 62.5 Ma [23] and are thus younger than the WG sequence. Similarly, whereas Sr–Nd isotopic data for the Elephanta ankaramite dyke ELD13 plot within the Mahabaleshwar Formation field (Figure 12), this dyke dated at ~62 Ma [46] is much younger than the WG sequence.

6. Petrogenesis

6.1. Fractional Crystallization and Crystal Accumulation

The Elephanta flows and dykes are relatively evolved mafic rocks, which may have evolved by gabbro fractionation from magnesian parental liquids, like the WG sequence [56,67,71,72]. In particular, there is evidence for fractional crystallization and crystal accumulation of olivine. As noted, Elephanta flows ELF4A and especially ELF7, and dykes ELD4, 6, 9, and 10 contain many olivines too Fe-rich to plot on the olivine-liquid equilibrium band [51] (Figure 5a), suggesting that these olivines did not crystallize from a liquid now represented by the bulk rocks. Instead, these olivines crystallized from more evolved melts and were then incorporated into later melts so that the bulk-rock MgO contents and Mg# values of the rocks in which they are found have been raised by such cumulus enrichment.
There is no evidence for polybaric crystallization. The most Mg-rich clinopyroxene compositions (those expected to crystallize deeper) are devoid of AlVI; all the mineral cationic substitutions are typical of low-pressure clinopyroxenes and are consistent with the composition of the host rocks.
The Elephanta rocks also rarely show interstitial glass of rhyolitic composition. A mass balance calculation with the XLFRAC program [79] shows that interstitial rhyolite glass in dyke ELD1 can be produced by 87.6% oxide-gabbro fractionation from the ELD1 bulk composition, the fractionation assemblage comprising 48.6 wt.% plagioclase, 21.9 wt.% clinopyroxene, 18.6 wt.% pigeonite, and 10.9 wt.% magnetite (Table 7).

6.2. Crustal Contamination

The elongated fields defined by the WG stratigraphic formations in Sr–Nd isotopic space (Figure 12) have been interpreted as mixing arrays between Ambenali-like magmas and continental lithospheric materials of various types [27,29,78]. Magmas of the Ambenali Formation with εNd(t) values up to +8 are considered the parental magma type of the WG sequence, as they show transitional-MORB-like chemical characteristics with the least continental lithospheric influence [78,80]) (Figure 12). The Mahabaleshwar Formation magmas have been interpreted as indicating contamination of Ambenali-type magmas by lithospheric materials with low εNd, but also low 87Sr/86Sr, either lithospheric mantle [27,28] or lower crust [78,81]. Most WG formations (except the Ambenali and Mahabaleshwar) contain lavas highly contaminated by continental crust; the Bushe Formation lavas are inferred to have incorporated 20% of old, Rb-rich granitic upper crust [27,28,29].
Whereas the Sr–Nd isotopic arrays in Figure 12 suggested a simple scenario of mixing between an Ambenali-like mantle end member and various continental lithospheric end members, Sr–Pb and Nd–Pb isotopic relationships require two stages of mixing [20]. The first stage took place between an Ambenali end member and high-206Pb/204Pb continental lithosphere (possibly lithospheric mantle) and produced the “common signature” magmas with relatively restricted isotopic (and chemical) variation, common to several of the lower WG formations (Figure 12). The second stage took place between various first-stage mixing products (including the common signature) and low-206Pb/204Pb material (possibly lower crust).
The Bushe Formation affinity of any Elephanta flows or dykes is excluded by the Sr–Nd isotopic data (Figure 12), much like the elemental evidence. The Elephanta rocks are also not significantly enriched in SiO2 (LOI-adjusted SiO2-alkali contents render them subalkalic basalts, and none are even basaltic andesites). Compared to the great Sr–Nd isotopic range covered by the WG sequence, the Elephanta rocks have εNd(t) ranging from +5.4 to −7.9 and (87Sr/86Sr)t from 0.70391 to 0.70784, with data for most samples indicating only small amounts of contamination by continental lithosphere. This suggests that the Khandala-like lava flows ELF4, 4A, 4B, and 7 (of which only 4A was analyzed for isotopes) may have been contaminated by small or moderate amounts of granitic basement. As seen in Figure 13, the multielement patterns of Elephanta flow samples ELF4 and ELF4A can be broadly matched by mixing Ambenali magma with 15% Archaean felsic crust. For most of the other Elephanta samples, only small degrees of contamination, by lower continental crust, are permitted by the data.
The Pb peaks that are present in the multielement patterns of Elephanta rocks that we have matched to the Ambenali Formation (which typically lacks Pb peaks) may have to do with the extreme enrichment of lead in many types of continental crust, so that even a tiny amount of crustal contamination will result in high Pb values in basalt magma (see [20] for a similar argument for the northeastern Deccan).

7. Discussion

7.1. Stratigraphy of Elephanta Island and Eruptive Models for the Western Deccan

It is to be noted that the identified Khandala affinity of flow ELF4A and the Ambenali affinity of flows ELF1 and ELF5 at Elephanta are consistent with the hitherto mapped WG stratigraphy (Table 1, Figure 1c): the Lonavala and Wai Subgroups extend up to just east and south, respectively, of Elephanta Island, albeit brought to sea level by the Panvel flexure [18]. The stratigraphic assignments of the Elephanta flows with the Khandala and Ambenali formations imply that the formations separating these in the WG sequence, namely the Bushe and Poladpur, are absent at Elephanta, implying that the lava flows of these formations did not travel to this area. The paleotopography of the region at 66–65 Ma is unknown, except that it was subaerial, and Elephanta was not an island. Note that the rifted continental margin and attendant block faulting and the Panvel flexure developed only at 62.5 Ma [23,46].
Interestingly, flow ELF4A is a typical compound pāhoehoe flow, with internal features such as meter-sized or smaller flow units and toes, tumuli, squeeze-ups, and vesicle cylinders [44,45]. These features are typical of Bushe Formation lavas [63,65]. Flow ELF4A also has high MgO and low TiO2, one of the Bushe geochemical characteristics [14], and the Bushe Formation of the WG sequence outcrops at Nhava-Sheva (Figure 1b,c), only 1 km east of Elephanta [14,26]. A Bushe affinity for flow ELF4A is, however, ruled out by the binary, multielement, and isotopic plots, all of which identify it with the Khandala Formation (below the Bushe). However, the Khandala Formation flows in the WG escarpment are characteristically thick, columnar-jointed “simple” flows [64,65]. Thus, simple Khandala flows erupted in the WG region and, while travelling westward, experienced a reduction in eruptive flux and in lava supply at their fronts, thus showing a transition into compound flows (implying significantly lower effusion rates). Khandala Formation flows also travelled northeast from the WG region to the central Deccan [21,83], forming sections such as Ajanta and Ellora (Figure 1a), and the same mechanism explains why they are distinctly compound there, albeit on a larger scale (meters to tens of meters) than at Elephanta [63,66]. It follows that the physical features of some of the individual WG formations may vary greatly over long distances, and thus physical features are of limited utility in stratigraphic correlations over hundreds of kilometers. Indeed, recent field studies indicate significant changes in the morphological characters of individual Deccan lava flows over spatial scales of only hundreds or even tens of meters [84,85].
Flows such as ELF3 and ELF3A are compound flows overlying the rubbly pāhoehoe flow ELF1-2 on the eastern hill. The data for ELF3 do not plot in the same formation fields in different binary diagrams, whereas multielement patterns of both resemble the Poladpur patterns, a match with which the binary plots for flow ELF3A (Figure 7, Figure 8 and Figure 9) are consistent. Even then, both flows have Ba contents <<100 ppm, characteristic of the Ambenali Formation (Table 5). The two flows have not been analyzed for isotopes. Though compound, they cannot represent the same flow as ELF4A, which is a Khandala flow. Therefore, we believe that flows ELF3 and ELF3A, which do not closely resemble any of the WG formations, may have erupted from nearby, unexposed feeder dykes, and are of limited areal extent. We can see that dykes ELD4, 7, 8, 15, and 16 are broadly, but not quite, Poladpur-like (Figure 11c); the patterns of dyke ELD15 and flow ELF3 match closely (Figure 14a), as do the patterns of dyke ELD16 and flow ELF3A (Figure 14b). Data for these dyke-flow pairs also plot nearby in many (though not all) binary plots (Figure 7, Figure 8, Figure 9 and Figure 10).
As the Elephanta dykes cut the flow sequence (essentially the Khandala and Ambenali formations), the dykes’ geochemical–isototopic matches must not correlate with any of the older formations. Elephanta dykes correlated with the Ambenali Formation (ELD3, 6, 8, 11, 17, 19) do not violate the WG stratigraphy as these may have fed the Ambenali flows above, now eroded. Similarly, picrite dykes ELD9 and 10 are matched to the Khandala Formation in multielement patterns (Figure 11a), but the latter in the Sr–Nd isotopes is unlike anything seen in the WG sequence. Dykes ELD4, 7, 8, 15, and 16 are broadly matched with the Poladpur Formation in multielement patterns (Figure 11c), but as they have not been analyzed for isotopic ratios, their Poladpur identity is far from confirmed, meaning that there are no apparent stratigraphic contradictions.
Ankaramites are rare in the Deccan volcanic sequence in this region, and thus distinctive. The young ankaramite dyke ELD13 (40Ar/39Ar plateau age of 61.6 ± 0.4 Ma, 2σ) was considered by [46] to be a potential feeder to the Powai ankaramite flow MMF6-7 (40Ar/39Ar plateau age of 62.4 ± 0.3 Ma, 2σ; [23]) which it strongly resembles in its mineral assemblage and texture. The plateau ages of the two rocks differ by only 0.1 Myr, whereas their isochron and inverse isochron ages overlap within the analytical uncertainties. The combined data permit a feeder dyke–lava flow relationship (Figure 14c). A comparison between the normalized multielement patterns of the Powai ankaramite flow samples MMF6-7 and dyke ELD13 is shown in Figure 14c, and some critical geochemical–isotopic ratios are given in the figure for easy comparison. Flow sample MMF7 has a lower εNd(t) than dyke ELD13, though the difference is less than one epsilon unit, considering the analytical uncertainties. The systematically and slightly lower εNd(t) value and higher (87Sr/86Sr)t and Zr/Nb values of the flow MMF7, compared to dyke ELD13, can be explained by a small amount of additional contamination of the dyke magma by felsic basement crust while travelling 20 km toward the north. Along-strike geochemical heterogeneity is known in Deccan mafic dykes tens of kilometers long [31,55].

7.2. A Block-Faulted Structure of Elephanta Island: Evidence from Geochemical Stratigraphy

The Elephanta fault zone described from the southeastern part of the island [34] consists of two subparallel normal faults each with downthrow to the east. Whereas no marker horizons exist that can show the amounts of downthrow, the downthrows are small (less than tens of meters), noting that both faults are exposed entirely in rubbly pāhoehoe flow ELF1-2, which is 40 m thick. The Elephanta fault zone is considered [34] to represent a northerly extension of the Alibag-Uran fault zone ([33]; see also Figure 1c of [46]).
We have observed the basalt at the southern end of the central valley on Elephanta Island to be highly fractured, similar to fractured basalts described from the Uran fault zone [33]. At Elephanta, however, as the central valley has been widened by erosion and most of its length covered up by the only motorable road on the island (Figure 2a), the fault zone is difficult to trace. The geochemical stratigraphy of the Elephanta lava flows established in the present study permits the identification of a large normal fault along the central valley, as follows. The rubbly pāhoehoe flow ELF1-2 at the base of the eastern hill and the compound flows ELF5 and ELF6 at the top of the western hill are Ambenali Formation flows. In fact, flows ELF1 and ELF5 (with εNd(t) of +4.6 and +4.5 and (87Sr/86Sr)t of 0.70410 and 0.70411) are very possibly the same lava flow repeated by faulting (Figure 15). Furthermore, flow ELF4A, which underlies ELF5, is unambiguously a Khandala flow, and flow ELF1A, which underlies ELF1, though not isotopically analyzed, is also classified with the Khandala Formation by all elemental characteristics (Figure 7, Figure 8, Figure 9 and Figure 10, Figure 11c). Hence the difference between the elevation of the Khandala/Ambenali contact on the western hill, and the depth under the western hill of the same contact extrapolated from the eastern hill, gives an easterly downthrow of ~220 m (Figure 15), implying an east-dipping normal fault.
We aptly name this fault the Central Elephanta fault, and the western and eastern hills, which geomorphically are cuestas made up of west-dipping basalt flows, are tilted fault blocks. Similar cuestas which are tilted fault blocks occur in the Mumbai area northwest of Elephanta Island [39,86,87]. They also form the Uran and Nhava–Sheva–Belpada areas south and east of Elephanta Island [33,88], implying that this part of the western Indian rifted margin has been affected by extensive domino-type block faulting, a typical feature of rifted continental margins (e.g., [6,7,89]).

7.3. Tectonic Significance of the Elephanta Dykes

The sheer number of dykes observed on the small Elephanta Island suggests a potential eruptive center (and this number is a minimum, noting the jungle cover over much of the island and human modification of the rest). Some issues faced in unambiguously assigning dykes on the present Konkan Plain to either the Coastal or the Nasik-Pune swarms of the western Deccan province were discussed by [19]. They assigned all dykes west of the Panvel flexure axis, and with trends between N20°W and N20°E, to the Coastal swarm, and dykes east of the Panvel flexure, or dykes west of the flexure but with trends outside the N20°W–N20°E interval, to the Nasik-Pune swarm. The Elephanta dykes are located 20 km west of the Panvel flexure axis (Figure 1c), and by the definitions of [19], as many as 17 dykes, namely ELD1 (N10°), ELD2 (N20°), ELD3 (N345°), ELD4 (N10°), ELD5 (N20°), ELD7 (N20°), ELD8 (N0°), ELD9 (N355°), ELD10 (N355°), ELD11 (N345°), ELD12 (N5°), ELD13 (N355°), ELD14 (N0°), ELD17 (sheet, N0°), ELD18 (N10°), ELD19 (N345°), and ELD20 (N345°), belong to the Coastal swarm. Three dykes ELD6 (N40°), ELD15 (N120°), and ELD16 (N90°) belong to the Nasik-Pune swarm. Of these, ELD15 is a short dyke on the southern coast, and ELD16 is only a centimeters-thick dykelet within ELD15. Thus, Coastal swarm dykes with a strong N–S preferred orientation dominate at Elephanta Island, as they do in Mumbai [39] and areas south and east of Mumbai and Elephanta [18,90,91,92,93].
It has been stated [18] that Poladpur-type feeder dykes in the Konkan strip south of Mumbai strike E–W and therefore do not support organized E–W extension, which only occurred after the bulk of the flood basalt eruptions. Similarly, no preferred orientation for Ambenali-type dykes was found by [19], who argued that lavas of the Lonavala and Wai Subgroups erupted from relatively randomly oriented feeder dykes in the Nasik-Pune area of the WG region, thus implying no organized lithospheric extension prior to the flood basalt volcanism (but see [17]). This scenario is changed by the strong N–S preferred orientation of the Elephanta dykes (Figure 2a), which include several probable Ambenali feeders as supported by their 66-65 Ma ages [46] and geochemical–isotopic characteristics (this study). Examples are dykes ELD3 (N345°), ELD8 (N0°), ELD11 (N345°), and ELD19 (N345°), at a minimum. Swarms of parallel dykes are preferentially emplaced perpendicular to the maximum tensile stress or the least compressive stress in the crust [94]. The N–S-oriented Ambenali feeder dykes at Elephanta thus indicate that organized E–W extension was already in place by the time the Ambenali basalts were erupting, and several millions of years before the eventual 62.5 Ma India–Laxmi Ridge–Seychelles breakup [23,46]. Developing the argument further, a pre-breakup (66–65 Ma), E–W extensional rifting regime, and thinned crustal basement may be the reason why the Ambenali magmas, which show εNd(t) up to +8 and T-MORB-like chemical characteristics [80,95], might have escaped significant contamination by continental lithosphere, especially the crust. In this regard, it is also noteworthy that during the 62.5 Ma breakup, tholeiitic dykes with a strong N–S preferred orientation were emplaced in Mumbai, many of which show Ambenali-like geochemical-isotopic characteristics [39].
Therefore, whereas the dataset of dyke trends and geochemical–isotopic compositions in [19] is extensive, we believe that the tectonic inferences in [19], specifically the lack of organized crustal extension during the Wai Subgroup eruptions (representing ≥50% of the Deccan lava volume, [96]), need reconsideration as the dykes of Elephanta Island were not covered in that study.
As noted by [18], west-dipping lavas of the Poladpur and Ambenali formations exposed in the Konkan area south of Mumbai have been brought to nearly sea level (from high elevations on the WG escarpment) by the Panvel flexure. The flexure must therefore postdate the lavas and feeder dykes of these formations, which is as observed. The flexure has actually been dated to 62.5 Ma by [23], who bracketed it between dipping (thus pre-flexure) lava flows and subvertical (thus post-flexure) dykes in Mumbai, both of which yielded ages of 62.5 Ma and thus imply vigorous, essentially instantaneous extrusive and intrusive magmatism and flexure. Exposed dip dimensions of several 66–65 Ma, originally subvertical, Elephanta dykes (e.g., ELD6, 9, 10; see Figure 3 in [46]) show them to be dipping steeply east, as expected from their being contained in an originally horizontal lava sequence subsequently tilted 12° due west because of the Panvel flexure.

8. Conclusions

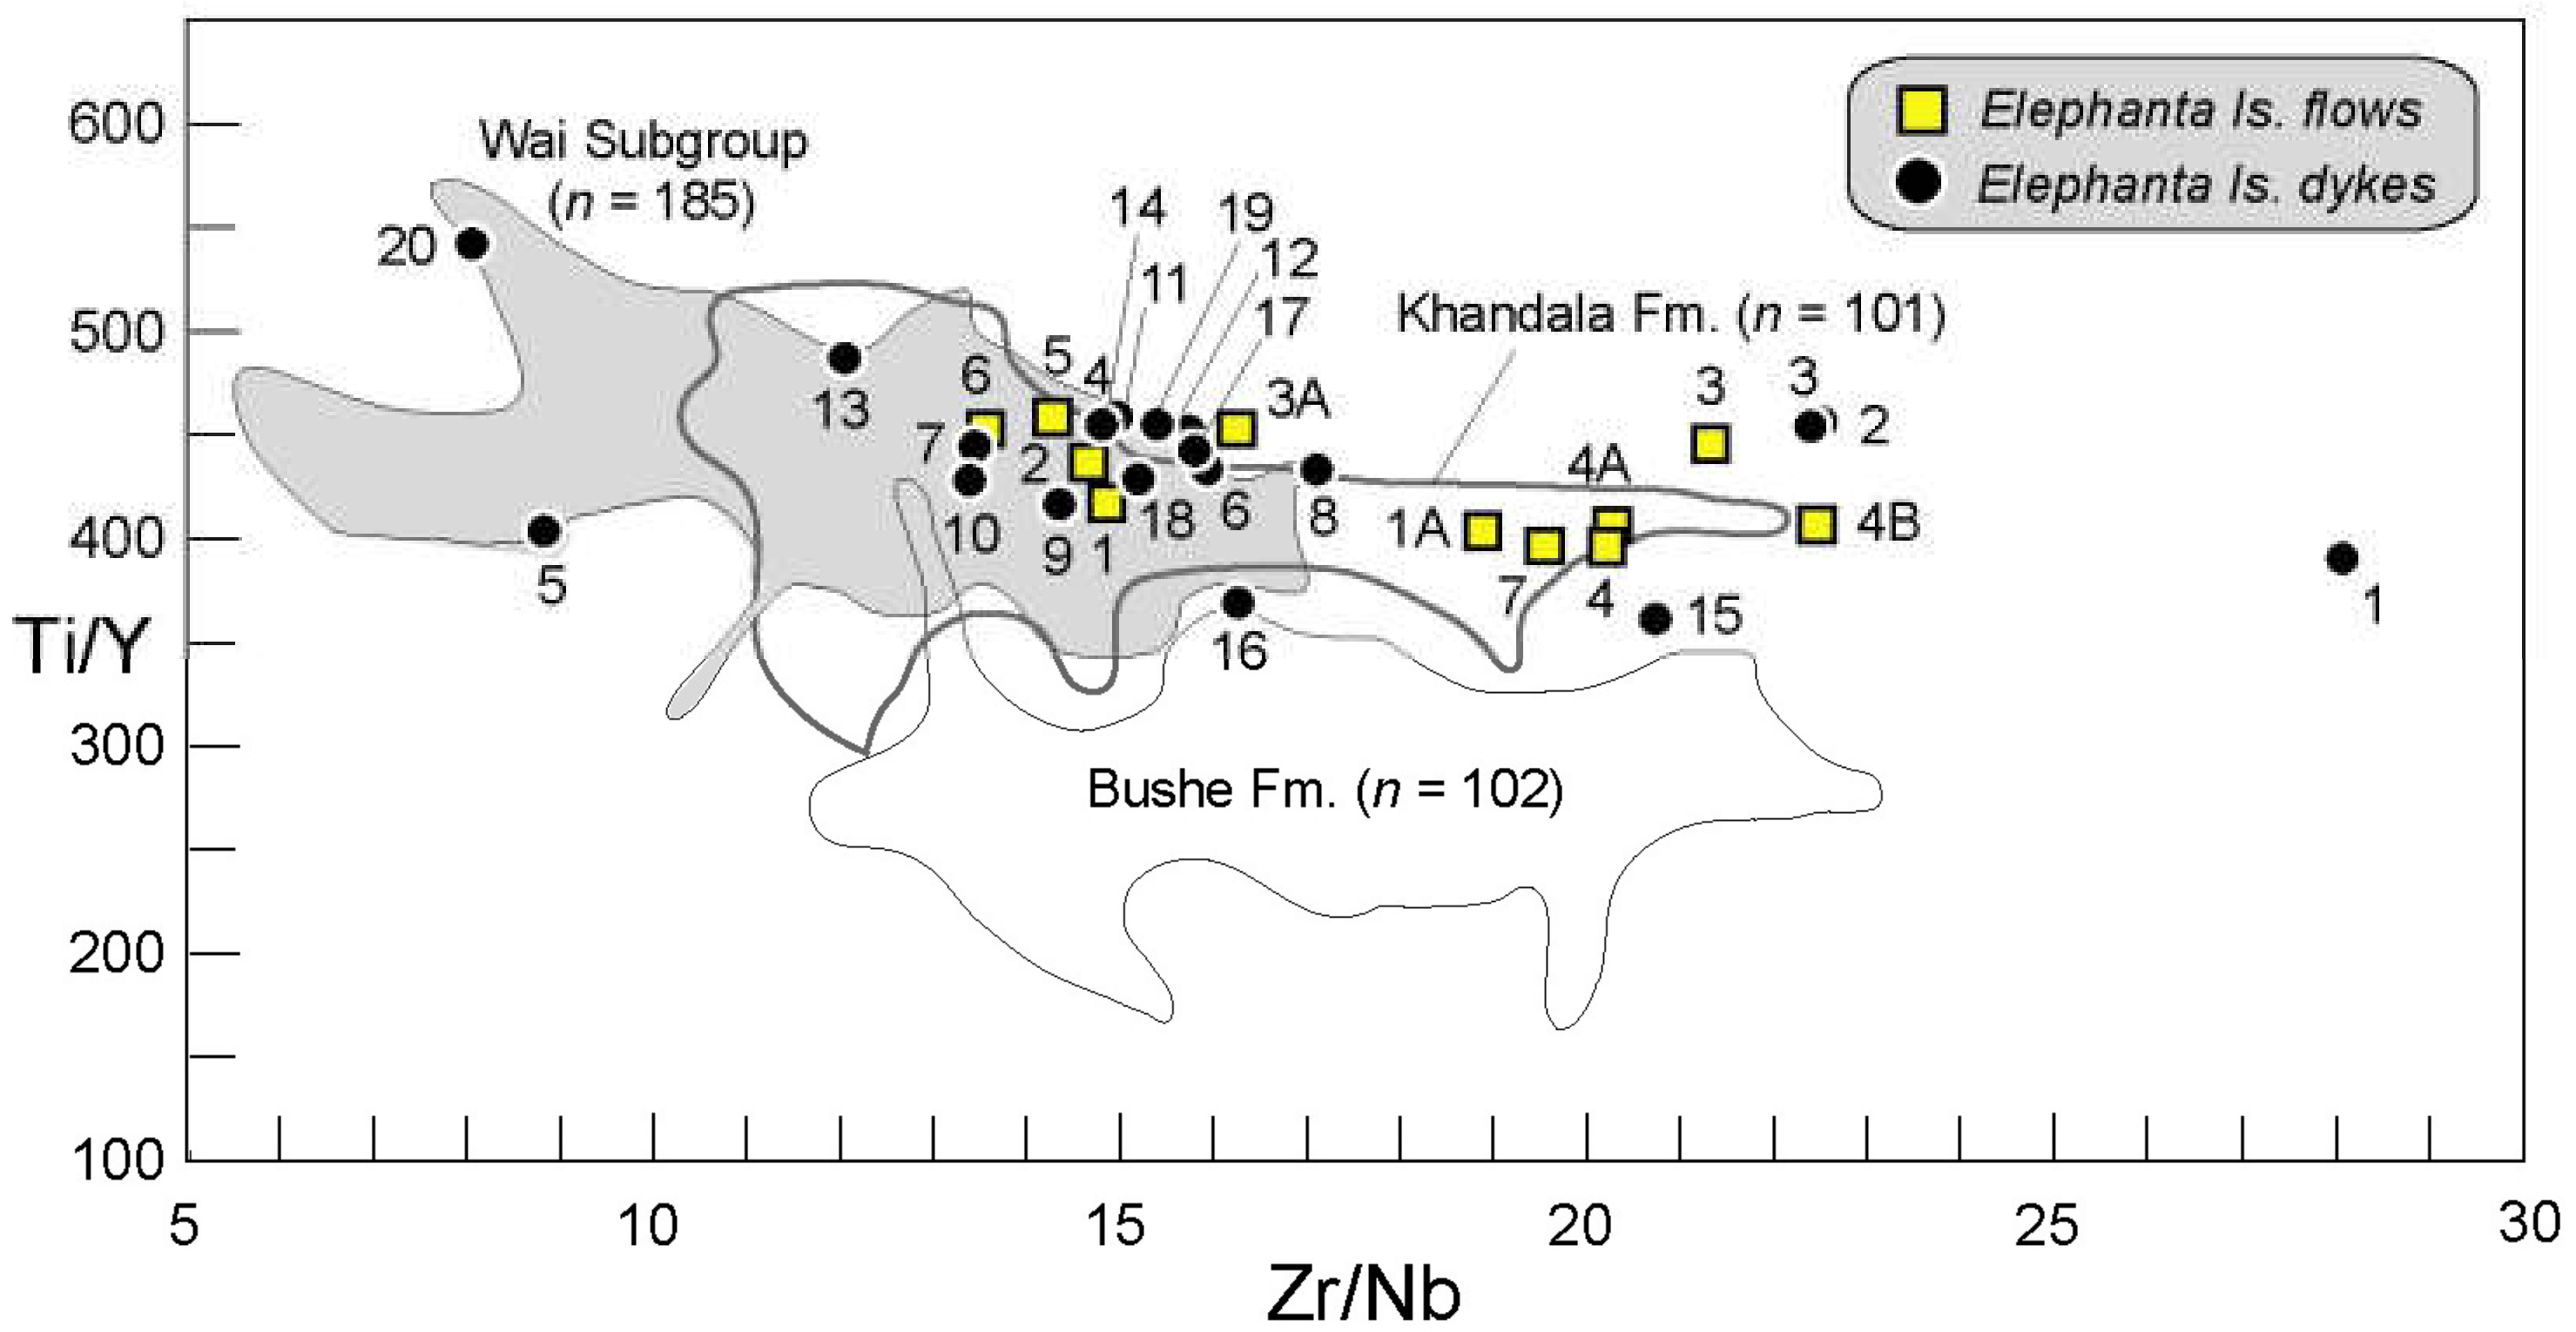
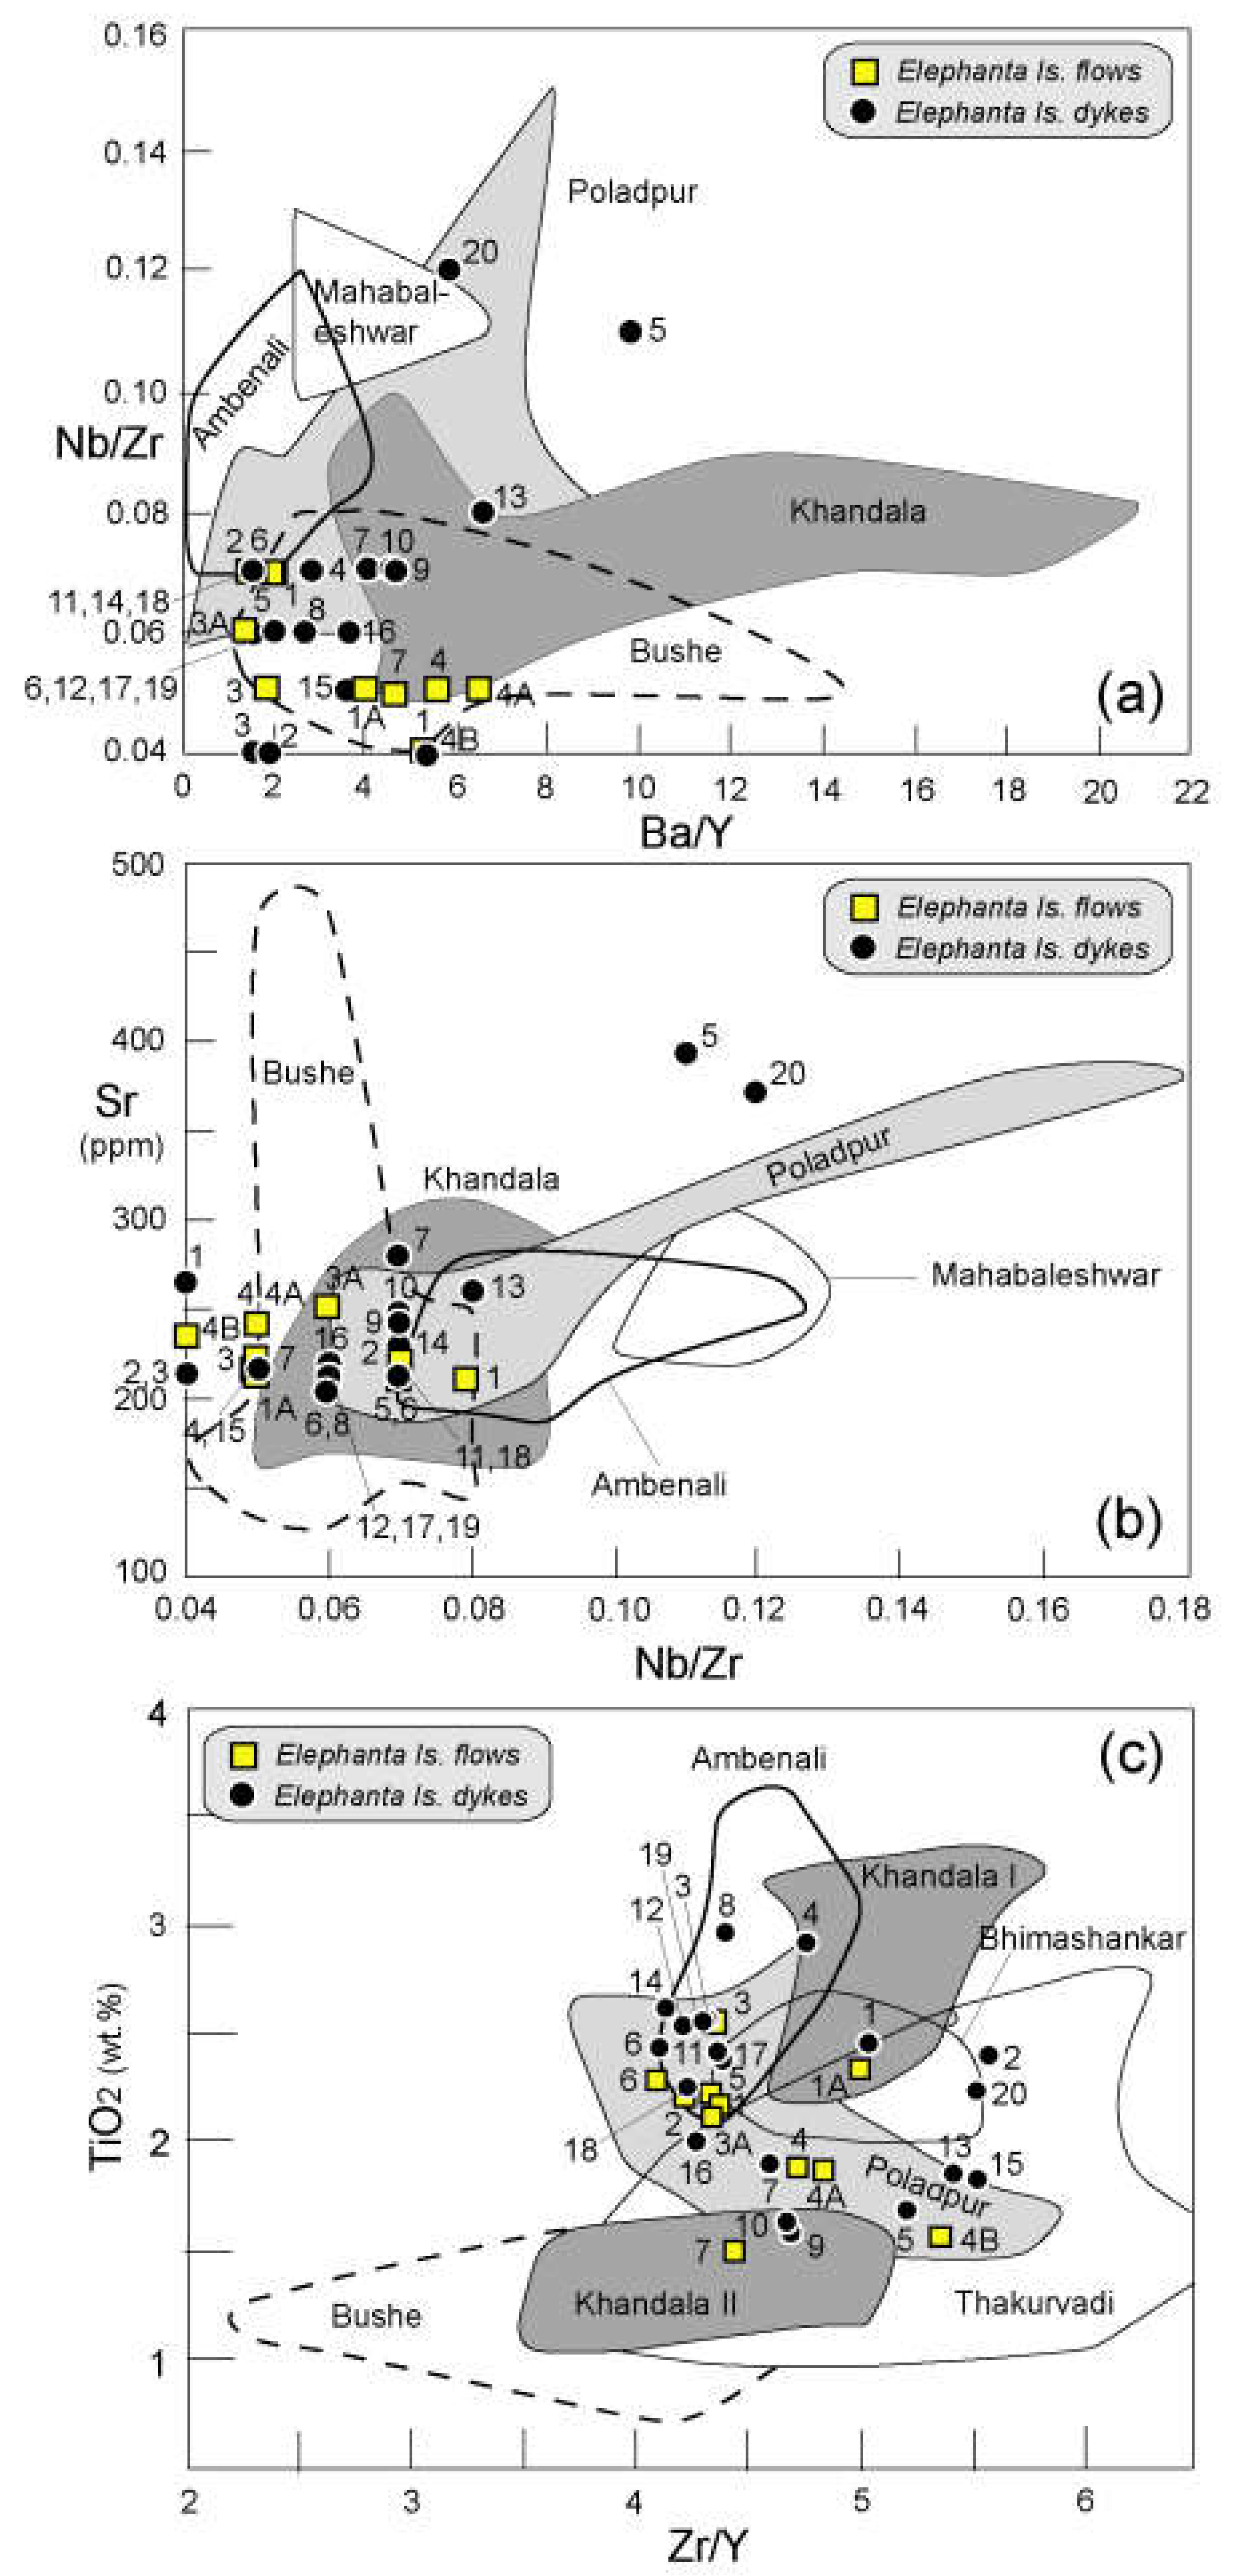
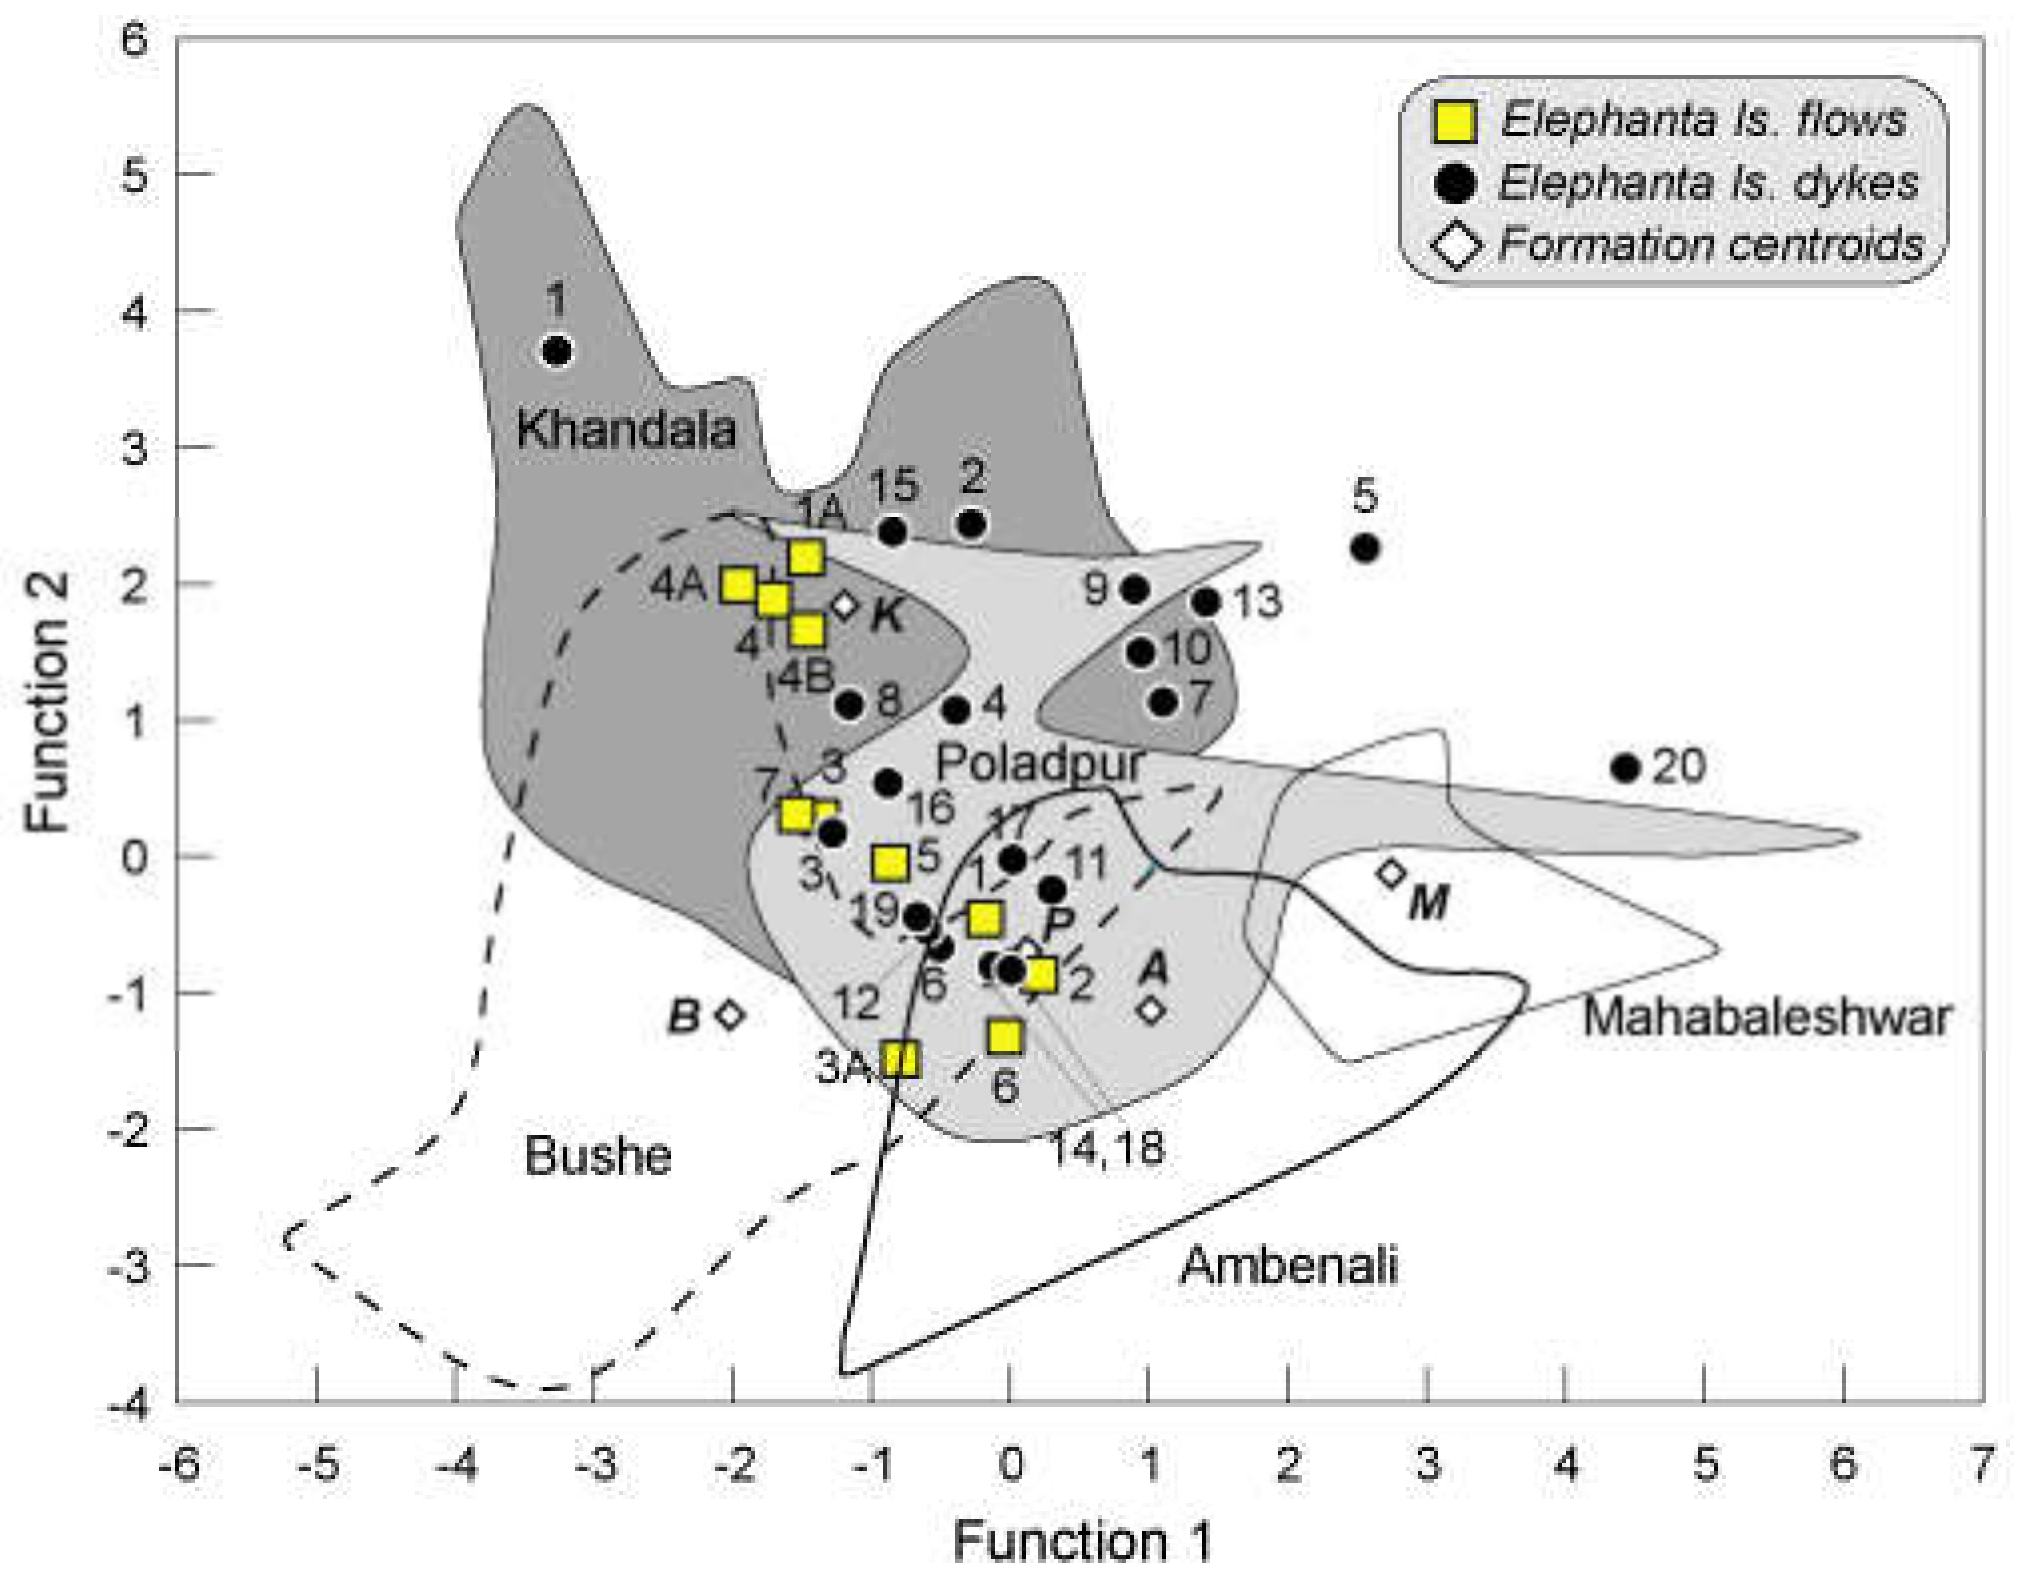
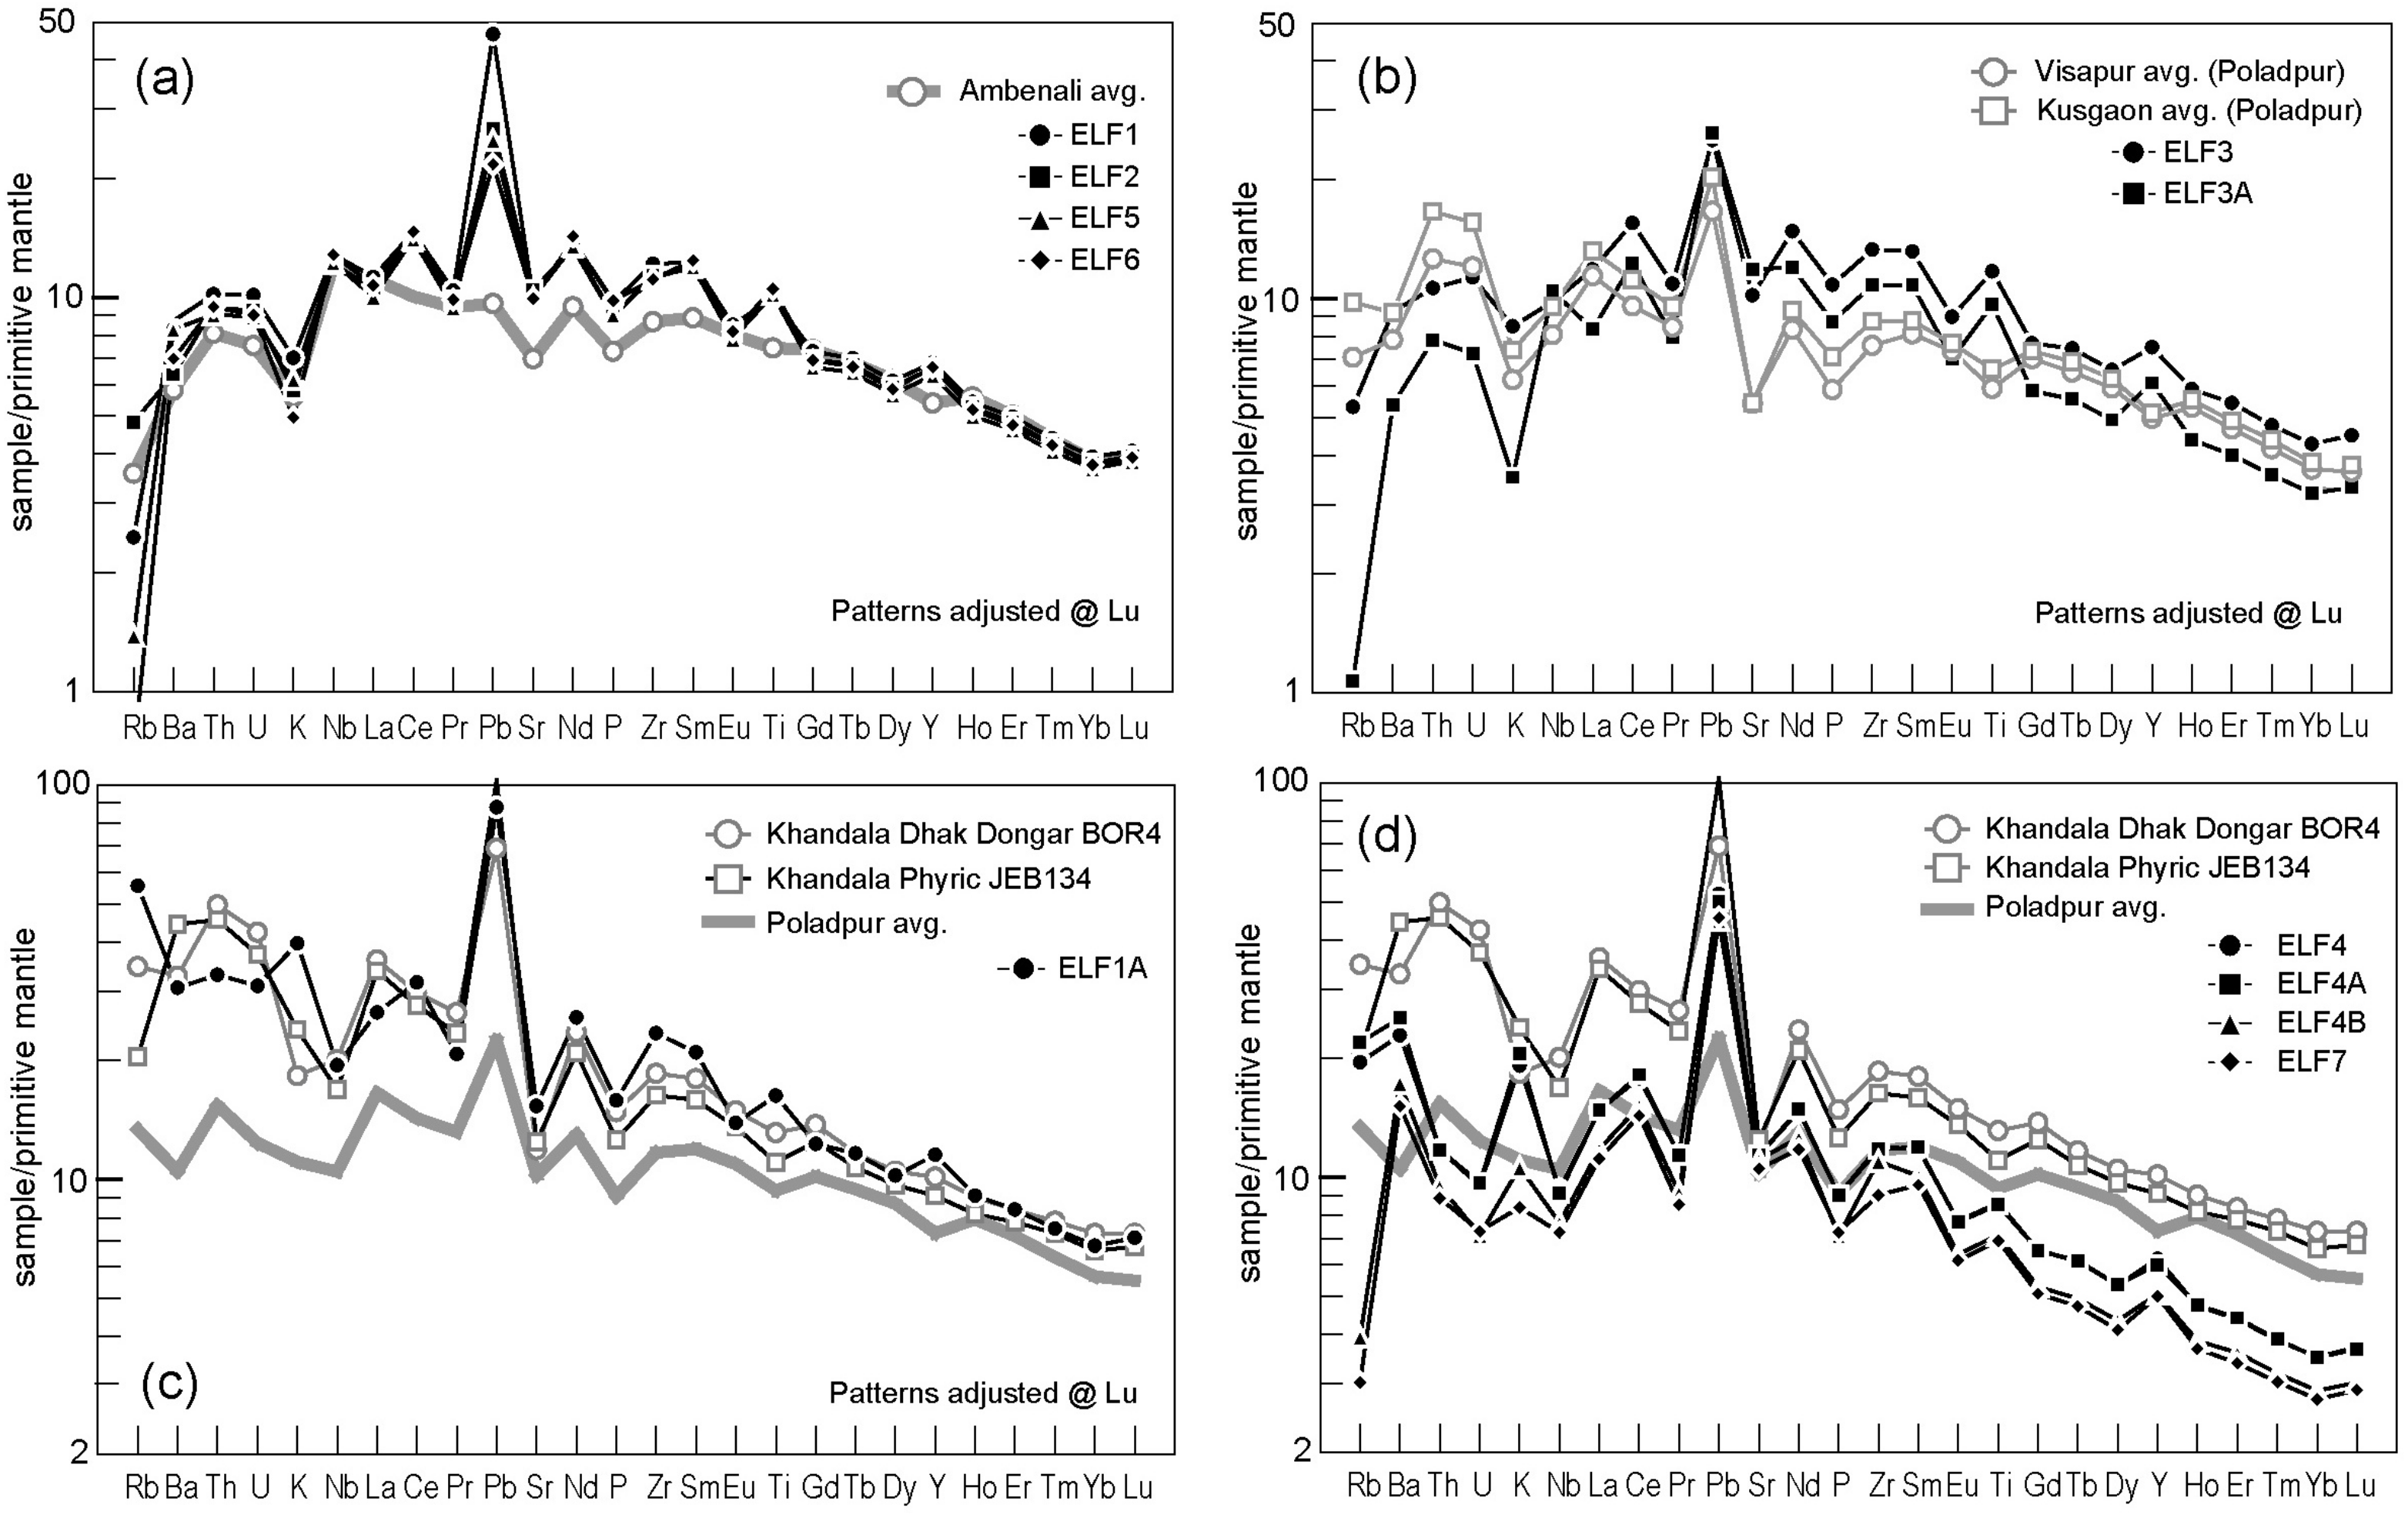
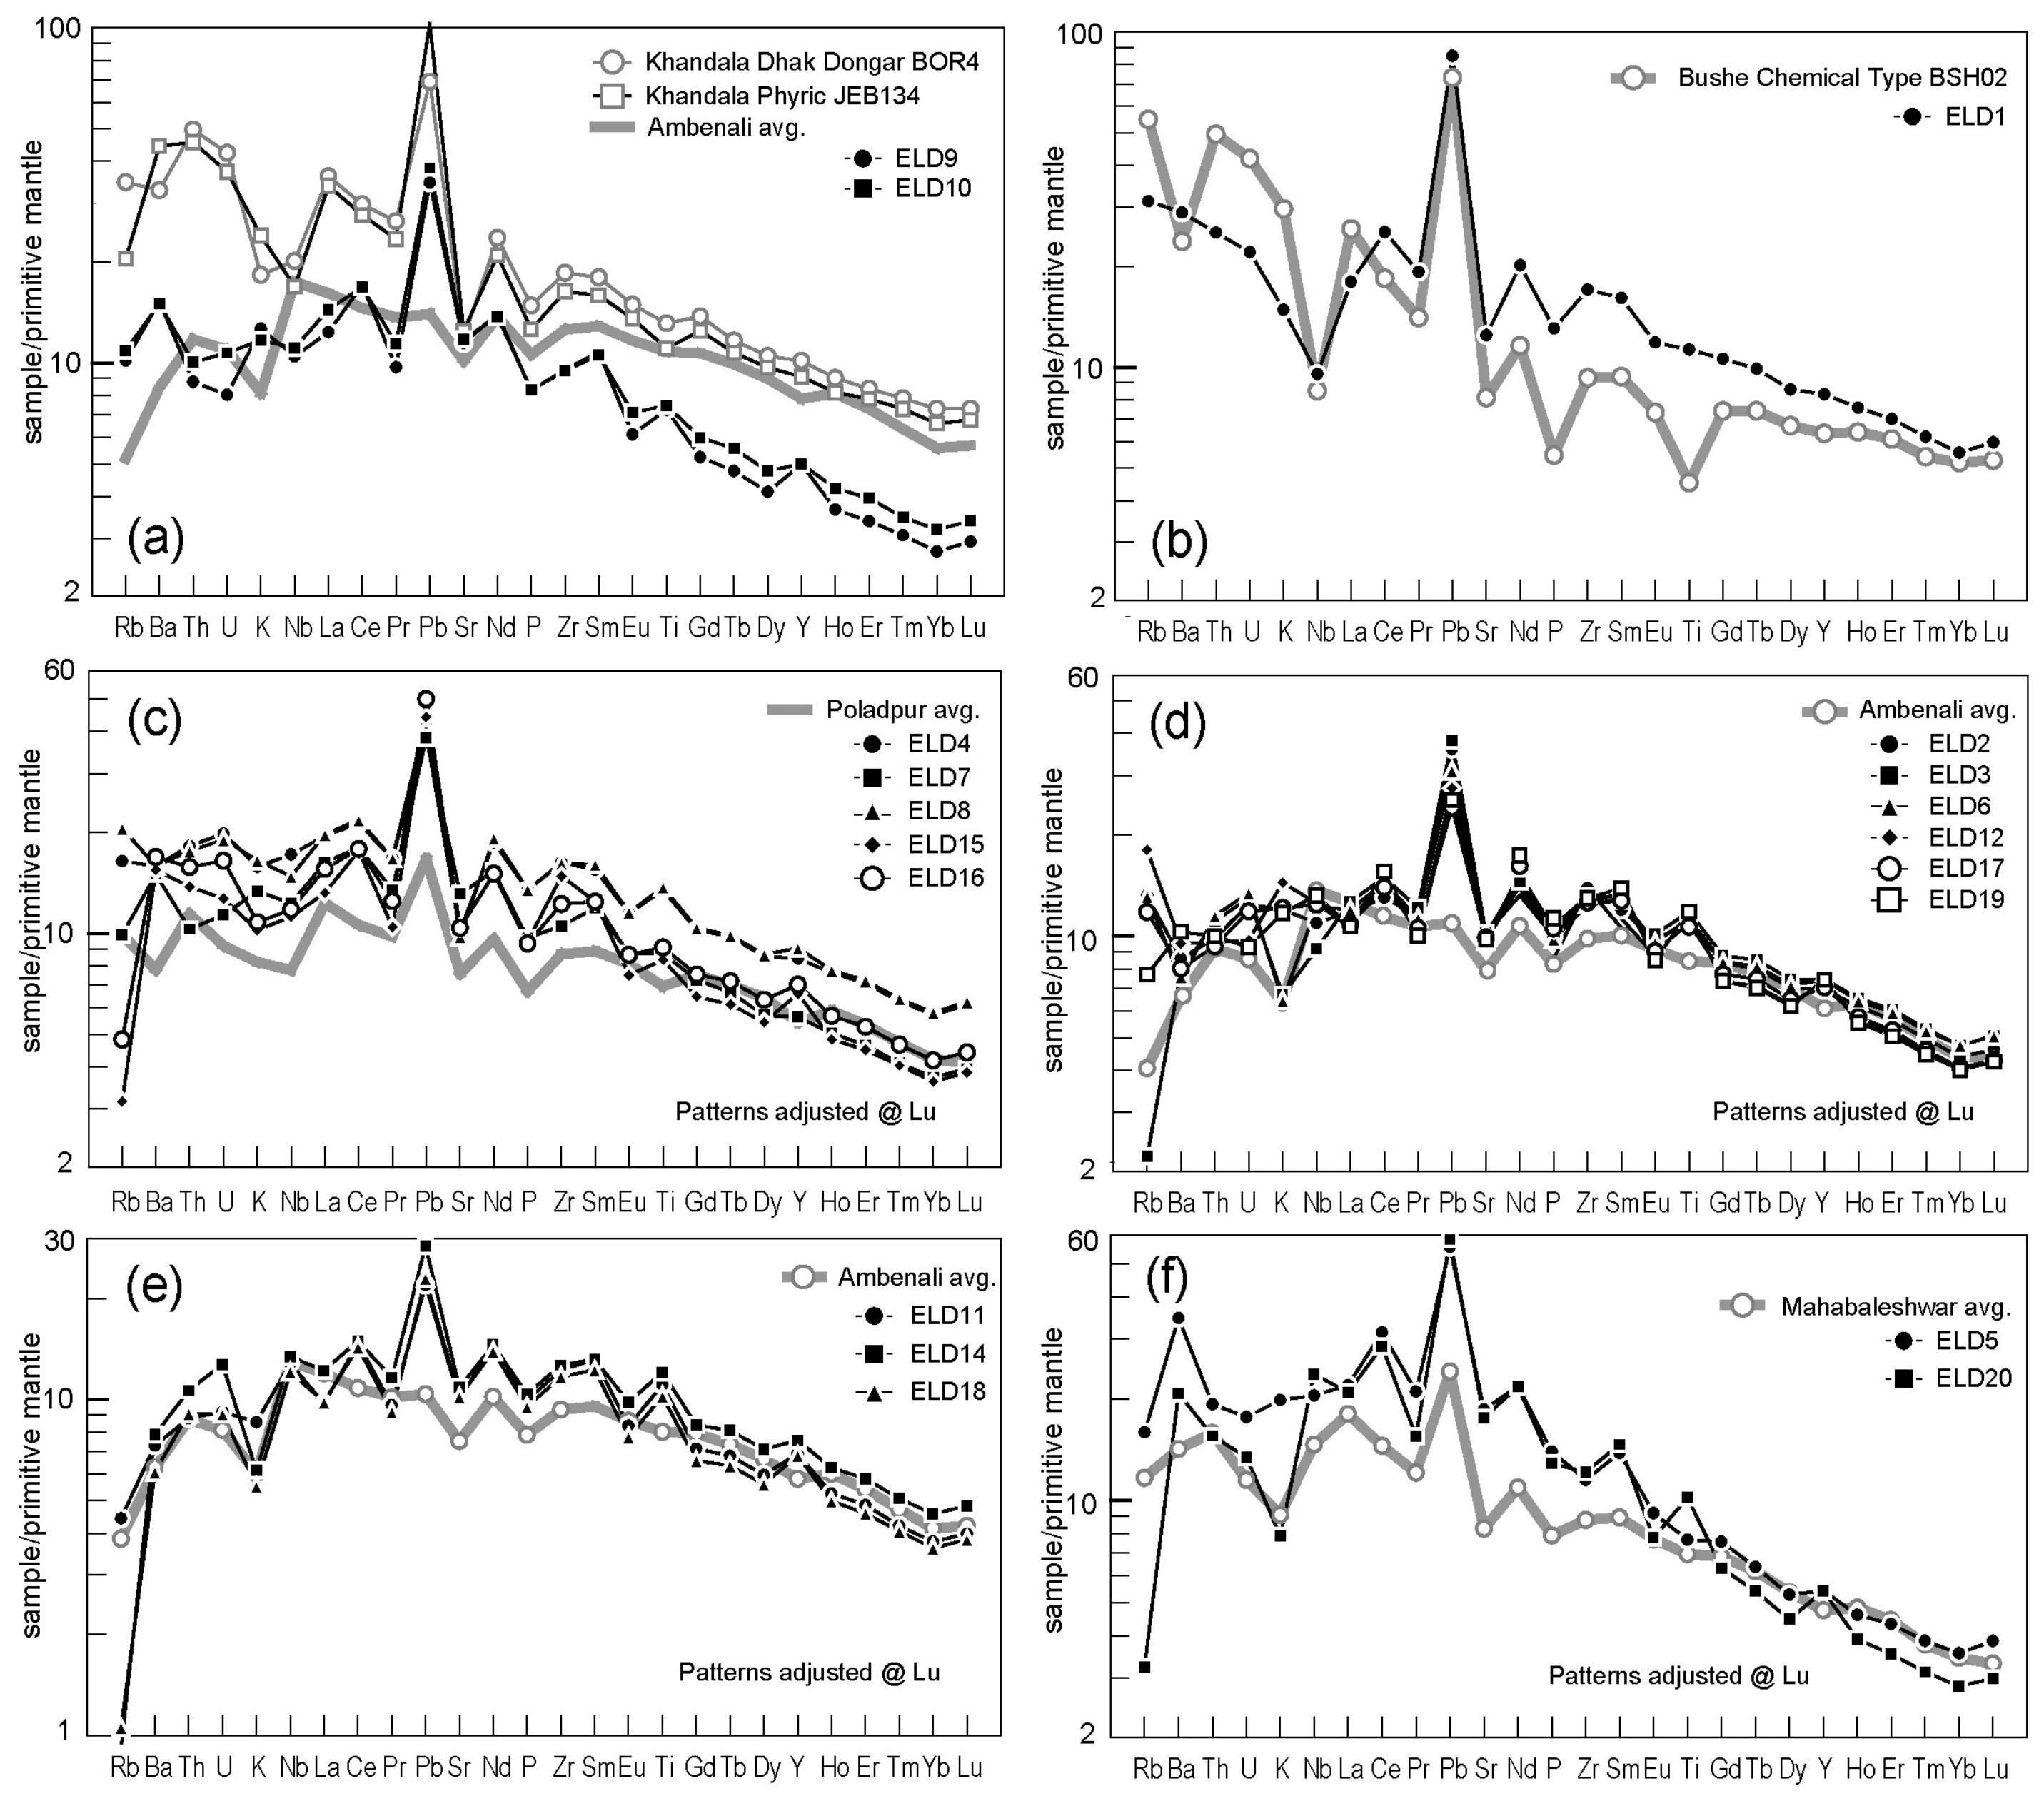
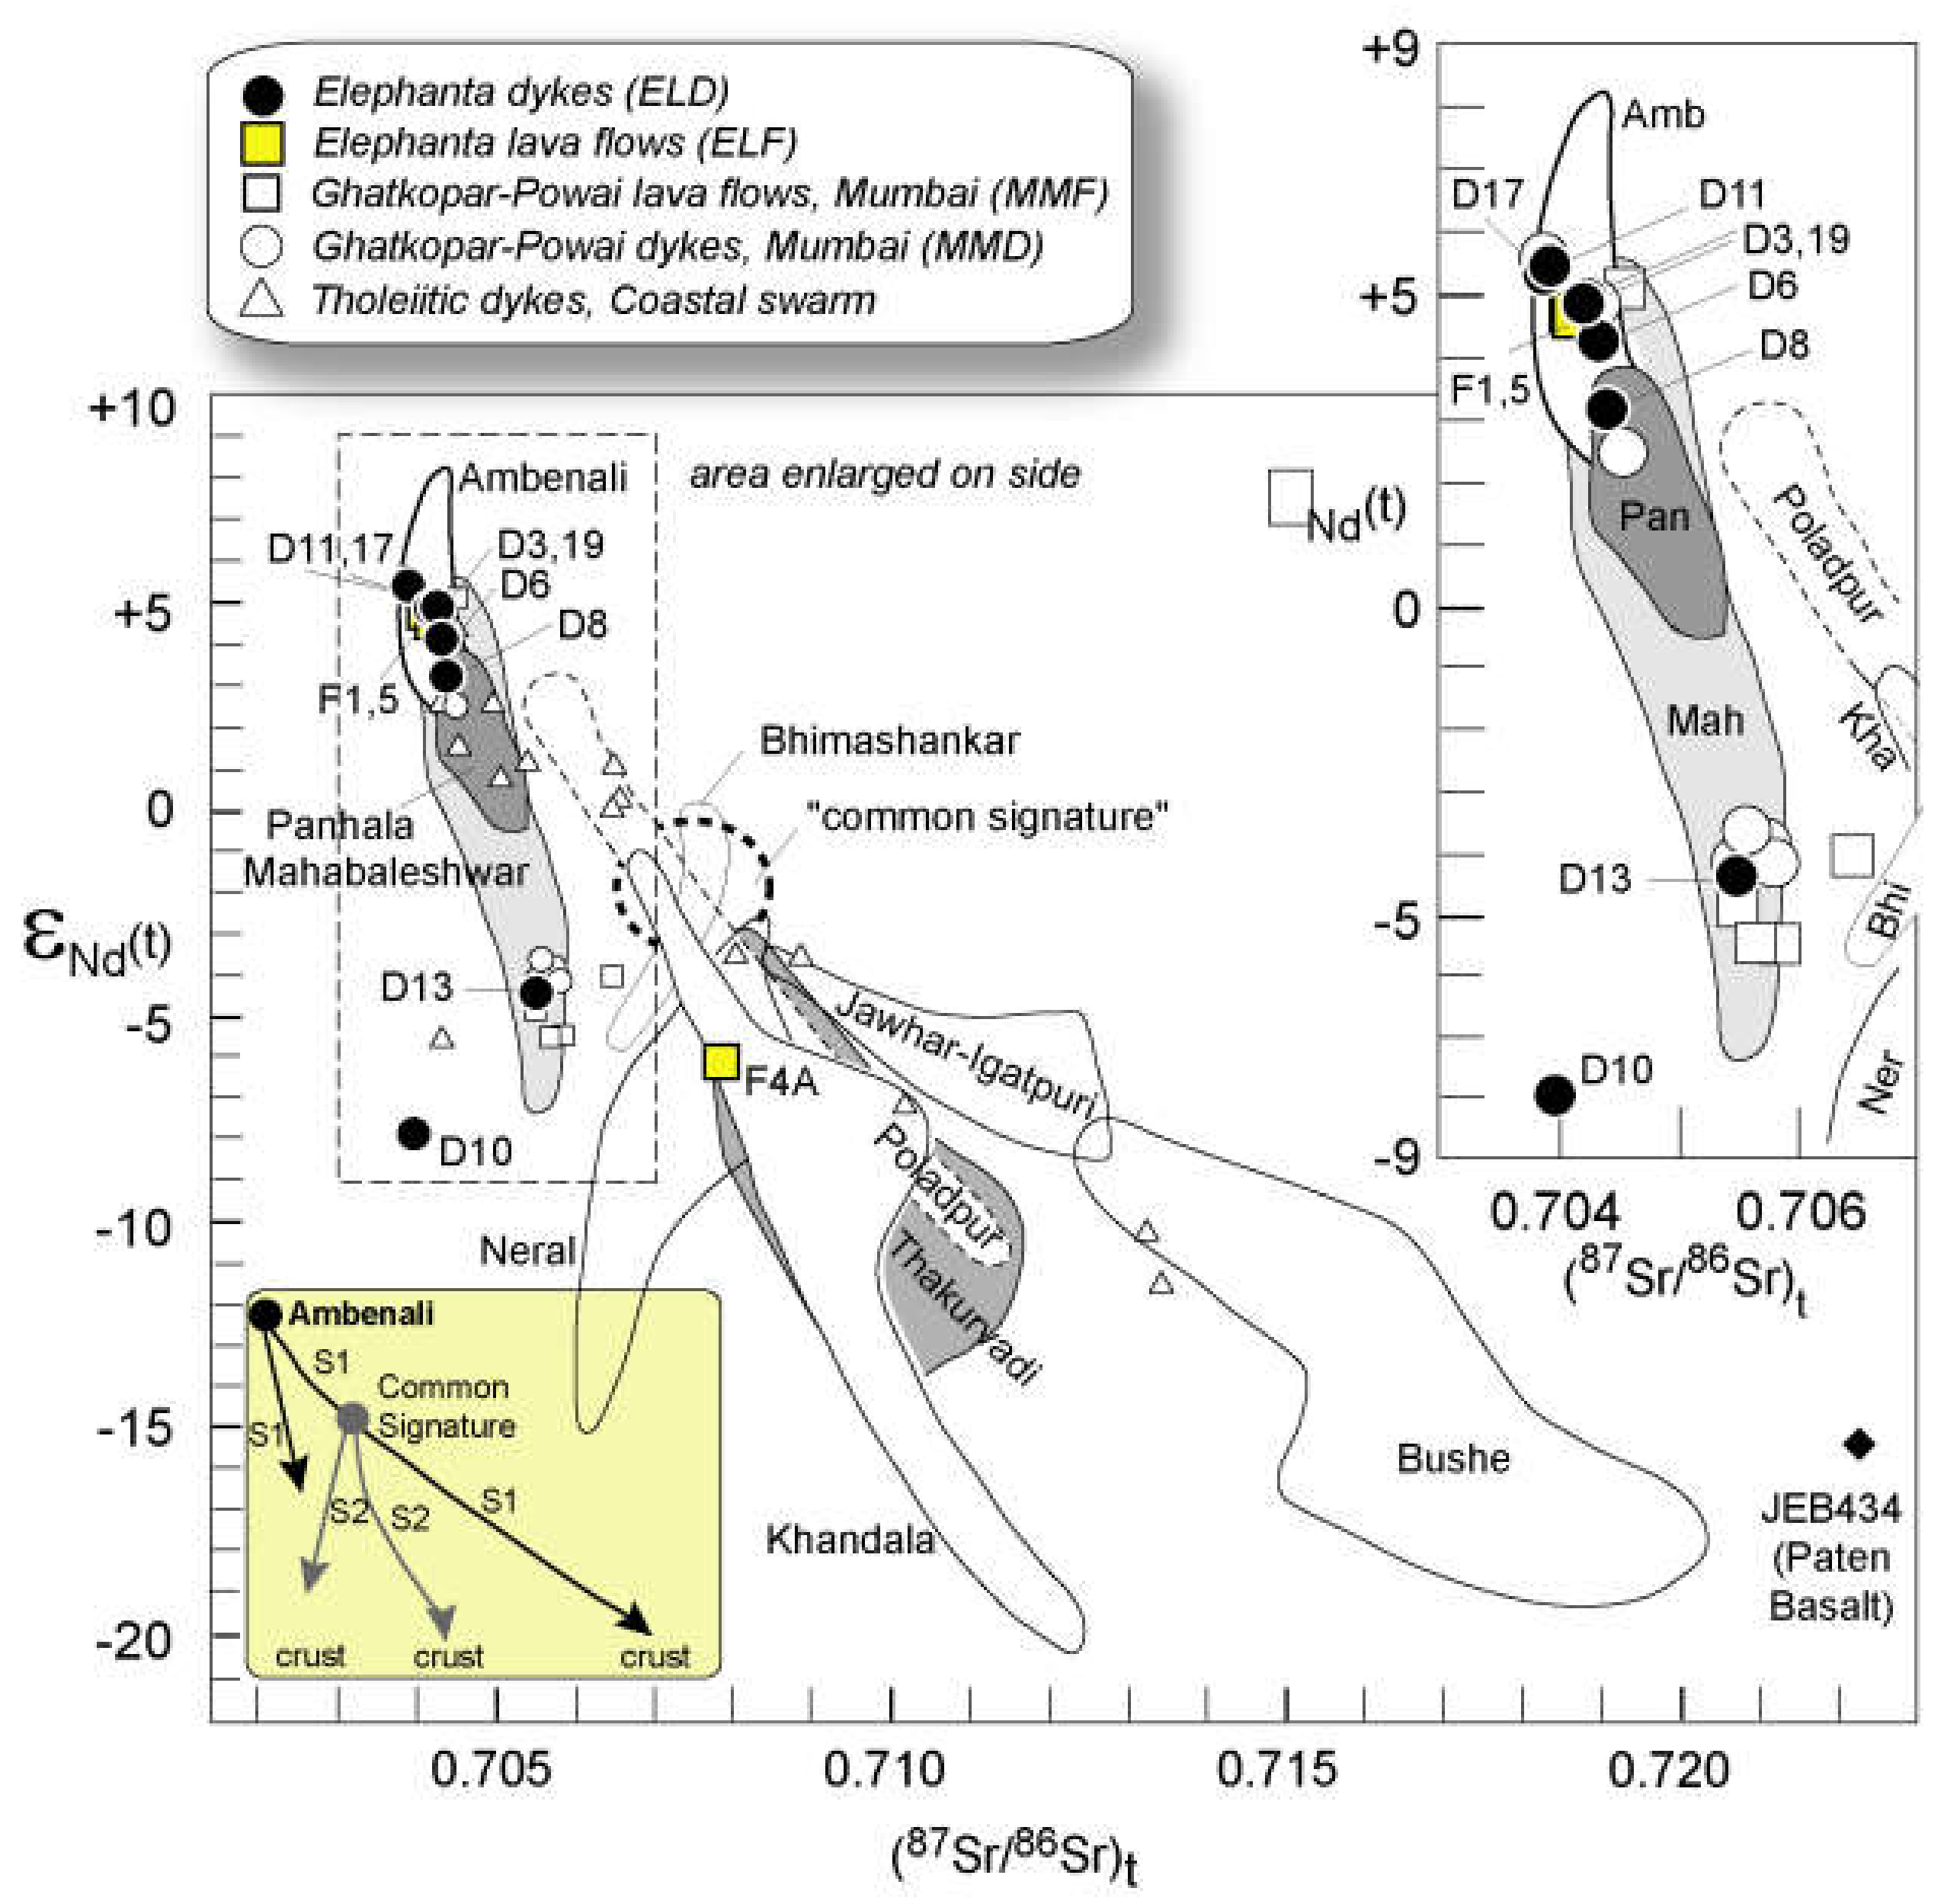
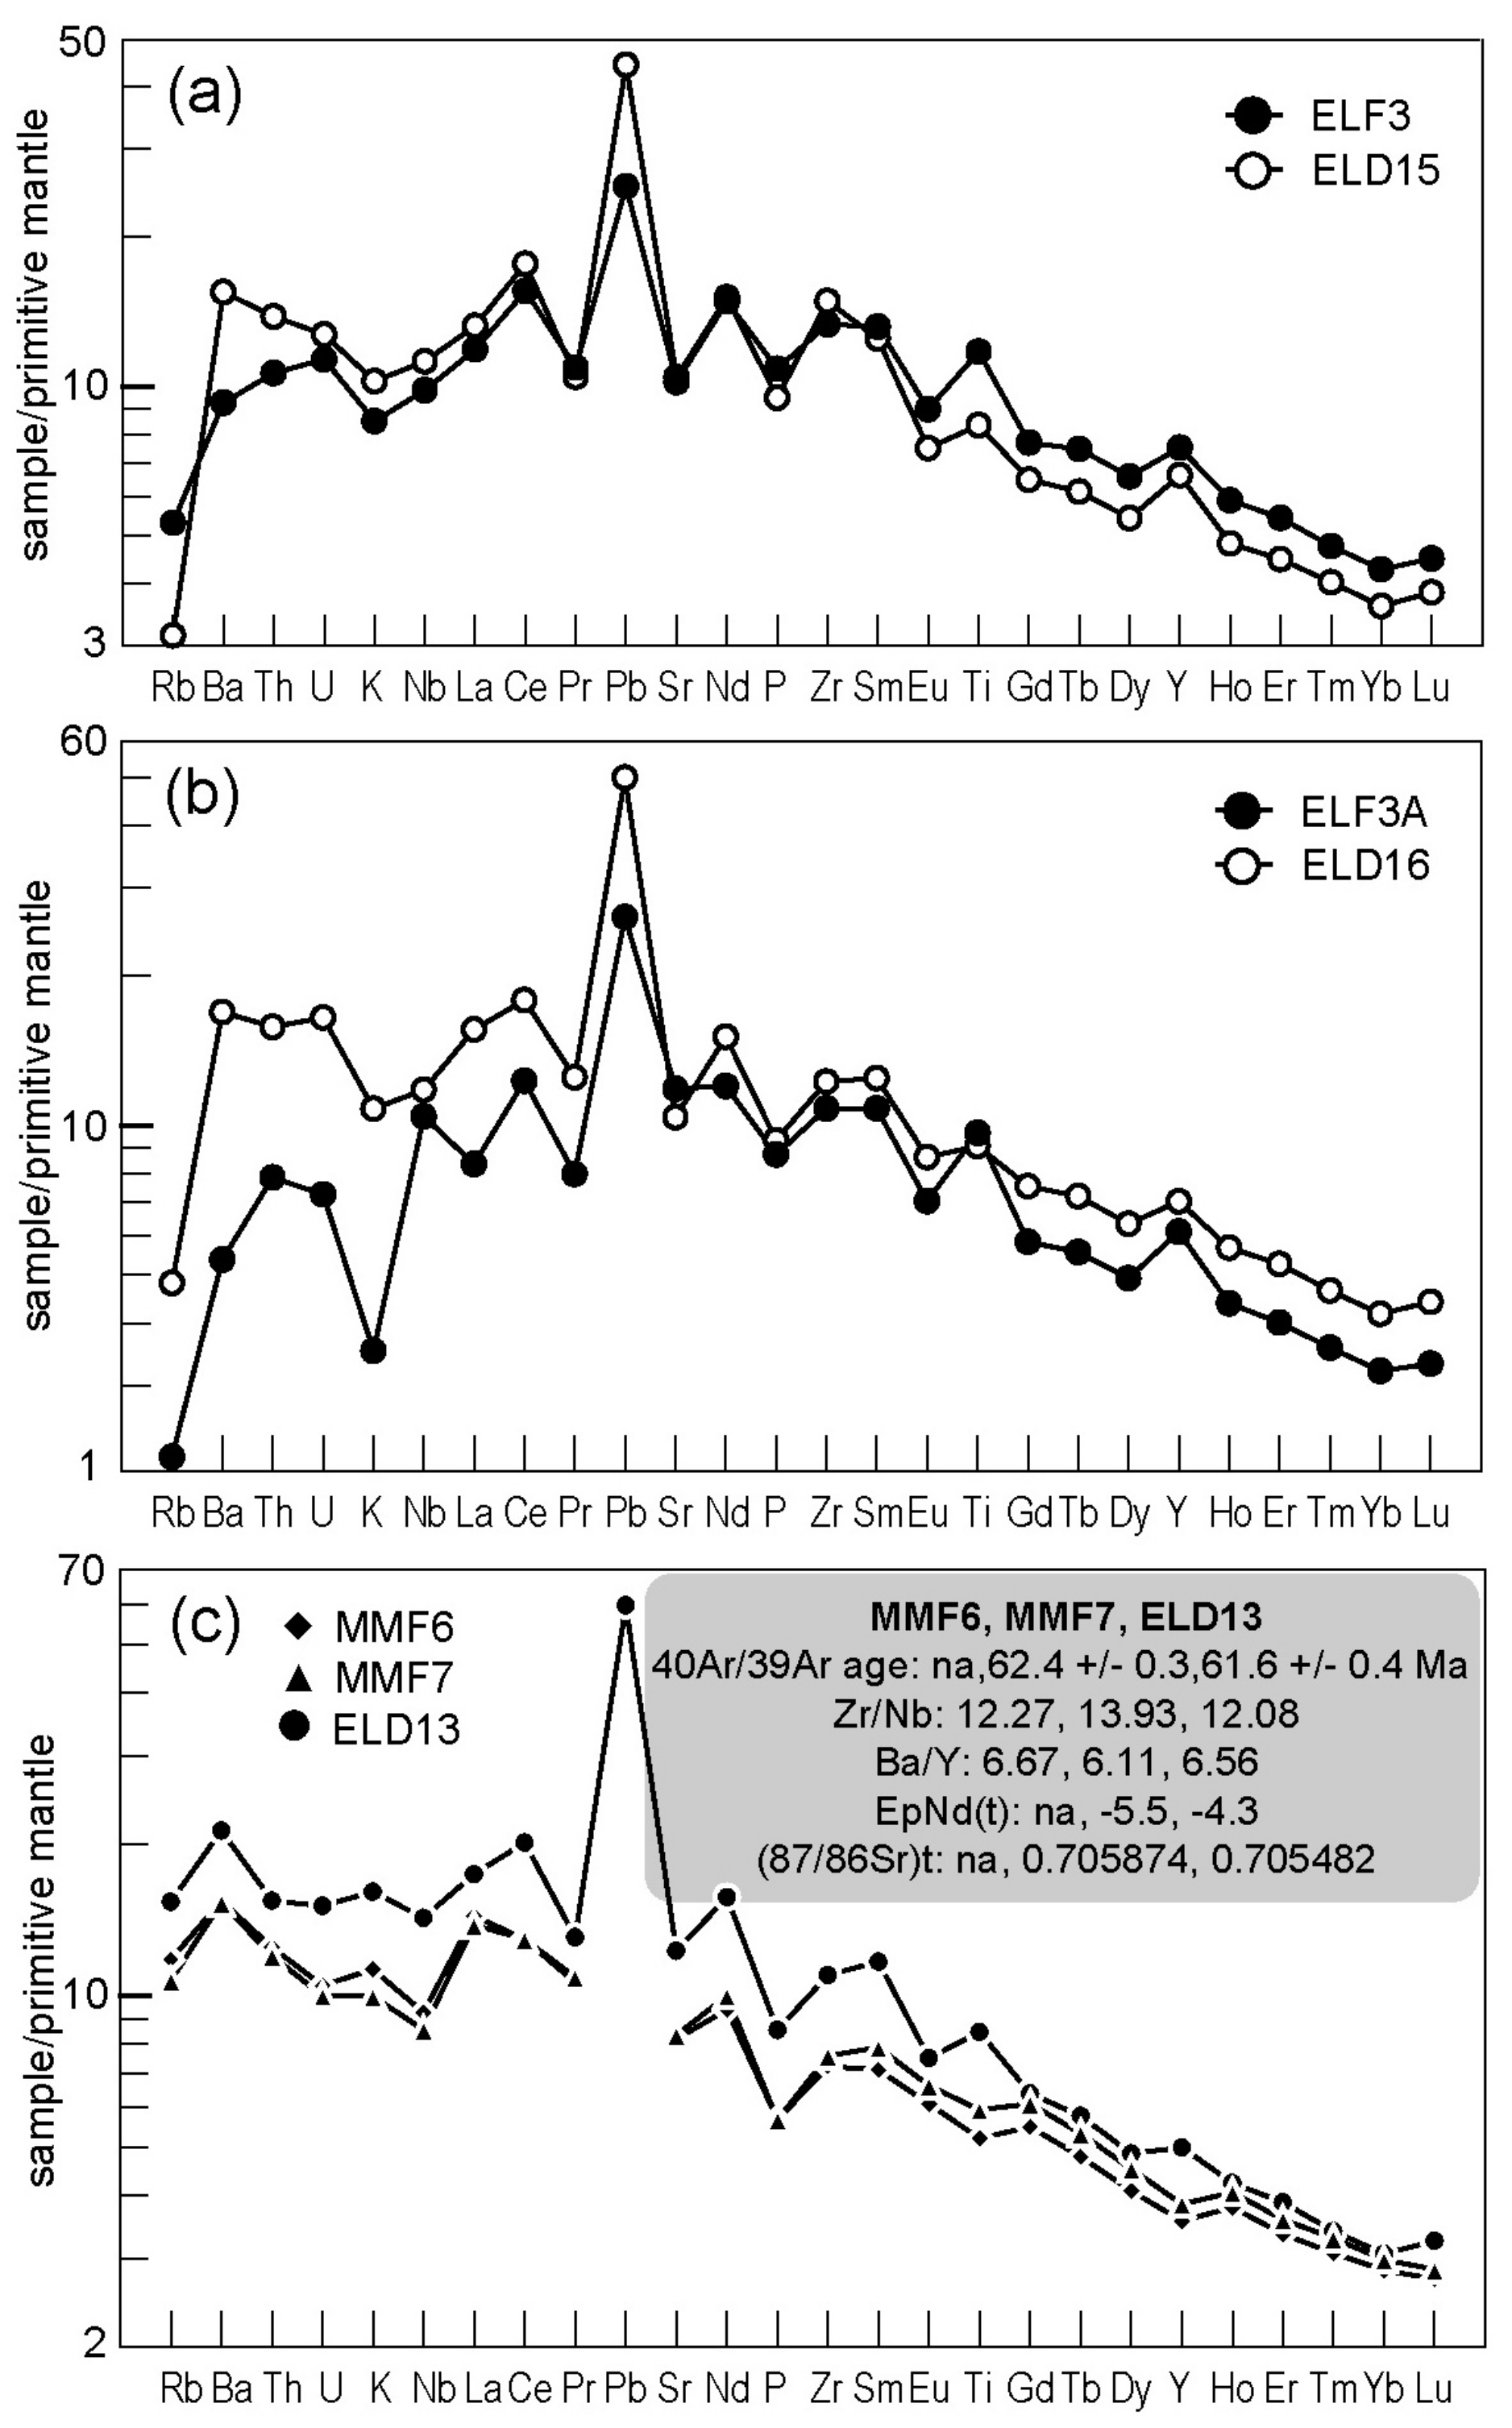
Geochemical (major and trace element) and Sr–Nd isotopic data on the Deccan tholeiitic lava flows and dykes of Elephanta Island, located in the Panvel flexure zone on the western Indian rifted margin, help to compare and correlate the sequence to the kilometers-thick, horizontal, and extensively studied tholeiitic sequence forming the WG escarpment ~60 km to the east. Both sequences are dated at 66-65 Ma (e.g., [12,46]), and geochemical–isotopic correlations suggest that the Elephanta sequence represents the western continuation of the Khandala and Ambenali formations in the WG sequence, with the intervening Bushe and Poladpur formations missing, but two flows present above the Ambenali flows that do not resemble any of the WG formations and may have been locally erupted. The geochemical–isotopic data help identify magmatic processes such as crystal fractionation and crustal contamination in the Elephanta flows and dykes. Mineral chemistry and geothermobarometry of these flows and dykes indicate low pressures of crystallization, and only small amounts of contamination, by lower continental crust, are permissible for most rocks. On the other hand, the geochemical stratigraphy helps identify a normal fault along the central part of the island with an easterly downthrow of 220 m, consistent with domino-type block faulting with easterly (landward) downthrows which is already known from the southeastern part of the island [34] and surrounding areas [33,39,88]. Considerable E–W-directed organized crustal extension is implied by the strongly N–S preferred orientation of a majority of the Elephanta dyke intrusions, some of which were probably feeders to the Ambenali Formation lavas in the WG sequence, requiring a revision in the current view [18,19] that the voluminous younger formations of the WG sequence were erupted without significant crustal extension. The data suggest instead that E–W extensional strain was already active at 66–65 Ma along this future (62.5 Ma) rifted continental margin. The Powai ankaramite flow in the 62.5 Ma Mumbai sequence, 20 km to the northwest, may have been fed by the young (~62 Ma) Elephanta ankaramite dyke which, along with 62.5 Ma, strongly N–S-oriented tholeiitic dykes [23,39] and rhyolitic lava flows in Mumbai [42], represents continental breakup between India–Laxmi Ridge and the Seychelles [23,24].

Supplementary Materials

The following are available online at https://www.mdpi.com/2076-3263/10/4/118/s1, Supplementary Table S1: Geographic coordinates of the Elephanta lava flow (ELF) and dyke (ELD) samples, Tables S2–S6: Chemical analyses (in wt.%) of olivines, pyroxenes, feldspars, oxides, and interstitial glass.

Author Contributions

Conceptualization, H.S. (Hetu Sheth), H.S. (Hrishikesh Samant); Methodology, H.S. (Hetu Sheth), C.C., G.W.J., W.W., and H.S. (Hrishikesh Samant); Formal analysis, V.P., and H.S. (Hetu Sheth); Investigation, C.C., G.W.J., W.W., and C.K.; Resources, C.C., G.W.J., and C.K.; Writing—original draft preparation, V.P.; Writing—review and editing, H.S. (Hetu Sheth), B.S., C.C., and C.K.; Visualization, H.S. (Hetu Sheth); Supervision, H.S. (Hetu Sheth) and B.S.; Funding acquisition, C.C., G.W.J., and C.K. All authors have read and agreed to the published version of the manuscript.

Funding

Funds for the SEM-EDS and whole-rock analyses were provided by the Ricerca di Ateneo (DR_3450_2016 to C. Cucciniello) and MIUR 2017 (grant 20178LPCPW_004 to C. Cucciniello).

Acknowledgments

Many field trips to Elephanta Island have been self-financed by the authors. We thank Joseph D’Souza, Keegan Carmo Lobo, Kyle D’Souza, Arnav Samant, Ishita Pal, Anmol Naik, Janisar Sheikh, and Shawn D’Souza for field assistance on various trips. V. Patel thanks the University Grants Commission (UGC), Govt. of India, for an NET Junior Research Fellowship, and the Additional Director General & HoD, Geological Survey of India (Central Region, Nagpur) for permission to continue his PhD research. Petrographic work and major element and LOI analyses were supported by the Department of Earth Sciences, IIT Bombay. ICP-AES major oxide data were provided by the Sophisticated Analytical Instrumentation Facility (SAIF), IIT Bombay; the help of Ms. Vinita Shetty in obtaining these data is appreciated. Dr. Trupti Gurav is thanked for their help with sample preparation and ICPMS analyses. C. Cucciniello thanks Sergio Bravi for the preparation of thin sections and Roberto de’ Gennaro for assistance in the SEM-EDS laboratory. The manuscript was improved by the journal reviews of Andrea Marzoli and an anonymous referee and comments from the guest editor Christian Schiffer. Constant support provided by Managing Editor Lionel Zheng during the manuscript production stage is appreciated.

Conflicts of Interest

The authors declare no conflicts of interest. The funders had no role in the design of the study; in the collection, analyses, or interpretation of data; in the writing of the manuscript, or in the decision to publish the results.

References

  1. Menzies, M.A.; Klemperer, S.L.; Ebinger, C.J.; Baker, J. Characteristics of volcanic rifted margins. In Volcanic Rifted Margins; Menzies, M.A., Klemperer, S.L., Ebinger, C.J., Baker, J., Eds.; Geological Society of America: Boulder, CO, USA, 2002; Volume 362, pp. 1–14. [Google Scholar]
  2. Geoffroy, L. Volcanic passive margins. Comp. Rend. Geosci. 2005, 337, 1395–1408. [Google Scholar] [CrossRef]
  3. Macdougall, J.D. (Ed.) Continental Flood Basalts; Kluwer Academic Publishers: Dordrecht, The Netherlands, 1988; 341p. [Google Scholar]
  4. Mahoney, J.J.; Coffin, M.F. (Eds.) Large Igneous Provinces: Continental, Oceanic, and Planetary Flood Volcanism; American Geophysical Union: Washington, DC, USA, 1997; 438p. [Google Scholar]
  5. Sheth, H.C. A reappraisal of the coastal Panvel flexure, Deccan Traps, as a listric-fault-controlled reverse drag structure. Tectonophysics 1998, 294, 143–149. [Google Scholar] [CrossRef]
  6. Klausen, M.B. The Lebombo monocline and associated feeder dyke swarm: Diagnostic of a successful and highly volcanic rifted margin? Tectonophysics 2009, 468, 42–62. [Google Scholar] [CrossRef]
  7. Klausen, M.B.; Larsen, H.C. East Greenland coast-parallel dyke swarm and its role in continental breakup. In Volcanic Rifted Margins; Menzies, M.A., Klemperer, S.L., Ebinger, C.J., Baker, J., Eds.; Geological Society of America: Boulder, CO, USA, 2002; Volume 362, pp. 137–162. [Google Scholar]
  8. Brooks, C.K. The East Greenland rifted volcanic margin. Geol. Surv. Den. Greenl. Bull. 2011, 24, 96. [Google Scholar]
  9. Pedersen, A.K.; Larsen, L.M.; Pedersen, G.K. Lithostratigraphy, Geology and geochemistry of the volcanic rocks of the Vaigat Formation on Disko and Nuussuaq, Palaeocene of West Greenland. Geol. Surv. Den. Greenl. Bull. 2017, 39, 248. [Google Scholar]
  10. Pedersen, A.K.; Larsen, L.M.; Pedersen, G.K. Lithostratigraphy, geology and geochemistry of the volcanic rocks of the Maligât Formation and associated intrusions on Disko and Nuussuaq, Palaeocene of West Greenland. Geol. Surv. Den. Greenl. Bull. 2018, 40, 239. [Google Scholar]
  11. Baksi, A.K. The Deccan Trap—Cretaceous-Palaeogene boundary connection; new 40Ar/39Ar ages and critical assessment of existing argon data pertinent to this hypothesis. J. Asian Earth Sci. 2014, 84, 9–23. [Google Scholar] [CrossRef]
  12. Renne, P.R.; Sprain, C.J.; Richards, M.A.; Self, S.; Vanderkluysen, L.; Pande, K. State shift in Deccan volcanism at the Cretaceous/Palaeogene boundary, possibly induced by impact. Science 2015, 350, 76–78. [Google Scholar] [CrossRef] [Green Version]
  13. Najafi, S.J.; Cox, K.G.; Sukheswala, R.N. Geology and geochemistry of the basalt flows (Deccan Traps) of the Mahad-Mahabaleshwar section, India. In Deccan Volcanism; Subbarao, K.V., Sukheswala, R.N., Eds.; Memoir Geological Society of India: Bangalore, India, 1981; Volume 3, pp. 300–315. [Google Scholar]
  14. Beane, J.E.; Turner, C.A.; Hooper, P.R.; Subbarao, K.V.; Walsh, J.N. Stratigraphy, composition and form of the Deccan basalts, Western Ghats, India. Bull. Volcanol. 1986, 48, 61–83. [Google Scholar] [CrossRef]
  15. Devey, C.W.; Lightfoot, P.C. Volcanological and tectonic control of stratigraphy and structure in the western Deccan Traps. Bull. Volcanol. 1986, 48, 195–207. [Google Scholar] [CrossRef]
  16. Deshmukh, S.S.; Sehgal, M.N. Mafic dyke swarms in Deccan volcanic province of Madhya Pradesh and Maharashtra. In Deccan Flood Basalts; Subbarao, K.V., Ed.; Memoir Geological Society of India: Bangalore, India, 1988; Volume 10, pp. 323–340. [Google Scholar]
  17. Bondre, N.R.; Hart, W.K.; Sheth, H.C. Geology and geochemistry of the Sangamner mafic dyke swarm, western Deccan volcanic province, India: Implications for regional stratigraphy. J. Geol. 2006, 114, 155–170. [Google Scholar] [CrossRef] [Green Version]
  18. Hooper, P.; Widdowson, M.; Kelley, S. Tectonic setting and timing of the final Deccan flood basalt eruptions. Geology 2010, 38, 839–842. [Google Scholar] [CrossRef]
  19. Vanderkluysen, L.; Mahoney, J.J.; Hooper, P.R.; Sheth, H.C.; Ray, R. The feeder system of the Deccan Traps India: Insights from dyke geochemistry. J. Petrol. 2011, 52, 315–343. [Google Scholar] [CrossRef] [Green Version]
  20. Peng, Z.X.; Mahoney, J.J.; Hooper, P.R.; Macdougall, J.D.; Krishnamurthy, P. Basalts of the northeastern Deccan Traps, India: Isotopic and elemental geochemistry and relation to southwestern Deccan stratigraphy. J. Geophys. Res. 1998, 103, 29843–29865. [Google Scholar] [CrossRef]
  21. Peng, Z.X.; Mahoney, J.J.; Hooper, P.R.; Vanderkluysen, L. Sr, Nd and Pb isotopic and chemical compositions of central Deccan Traps lavas and their relation to southwestern Deccan stratigraphy. Flood Basalts of Asia; Sheth, H.C., Vanderkluysen, L., Eds. J. Asian Earth Sci. 2014, 84, 83–94. [Google Scholar] [CrossRef]
  22. Mahoney, J.J.; Sheth, H.C.; Chandrasekharam, D.; Peng, Z.X. Geochemistry of flood basalts of the Toranmal section, northern Deccan Traps, India: Implications for regional Deccan stratigraphy. J. Petrol. 2000, 41, 1099–1120. [Google Scholar] [CrossRef]
  23. Pande, K.; Yatheesh, V.; Sheth, H. 40Ar/39Ar dating of the Mumbai tholeiites and Panvel flexure: Intense 62.5 Ma onshore-offshore Deccan magmatism during India-Laxmi Ridge-Seychelles breakup. Geophys. J. Int. 2017, 210, 1160–1170. [Google Scholar] [CrossRef]
  24. Yatheesh, Y. Structure and tectonics of the continental margins of India and the adjacent deep ocean basins: Current status of knowledge and some unresolved problems. Episodes 2020, 43, 586–608. [Google Scholar] [CrossRef] [Green Version]
  25. Ganerød, M.; Torsvik, T.H.; van Hinsbergen, D.J.J.; Gaina, C.; Corfu, F.; Werner, S.; Owen-Smith, T.M.; Ashwal, L.D.; Webb, S.J.; Hendriks, B.W.H. Palaeoposition of the Seychelles microcontinent in relation to the Deccan Traps and the plume generation zone in Late Cretaceous-Early Palaeogene time. In The Formation and Evolution of Africa: A Synopsis of 3.8 Ga of Earth History; Van Hinsbergen, D.J.J., Buiter, S.J.H., Torsvik, T.H., Gaina, C., Webb, S.J., Eds.; Geological Society, London, Special Publications: London, UK, 2011; Volume 357, pp. 229–252. [Google Scholar]
  26. Subbarao, K.V.; Hooper, P.R. Reconnaissance map of the Deccan Basalt Group in the Western Ghats, India. In Deccan Flood Basalts; Subbarao, K.V., Ed.; Memoir Geological Society of India: Bangalore, India, 1988; Volume 10, (enclosure). [Google Scholar]
  27. Lightfoot, P.C.; Hawkesworth, C.J. Origin of Deccan Trap lavas: Evidence from combined trace element and Sr-, Nd- and Pb-isotope studies. Earth Planet. Sci. Lett. 1988, 91, 89–104. [Google Scholar] [CrossRef]
  28. Lightfoot, P.C.; Hawkesworth, C.J.; Devey, C.W.; Rogers, N.W.; van Calsteren, P.W.C. Source and differentiation of Deccan Trap lavas: Implications of geochemical and mineral chemical variations. J. Petrol. 1990, 31, 1165–1200. [Google Scholar] [CrossRef]
  29. Peng, Z.X.; Mahoney, J.; Hooper, P.; Harris, C.; Beane, J. A role for lower continental crust in flood basalt genesis? Isotopic and incompatible element study of the lower six formations of the western Deccan Traps. Geochim. Cosmochim. Acta 1994, 58, 267–288. [Google Scholar] [CrossRef]
  30. Jay, A.E.; MacNiocaill, C.; Widdowson, M.; Self, S.; Turner, W. New palaeomagnetic data from the Mahabaleshwar plateau, Deccan flood basalt province, India implications for the volcanostratigraphic architecture of continental flood basalt provinces. J. Geol. Soc. Lond. 2009, 166, 13–24. [Google Scholar] [CrossRef]
  31. Sheth, H.; Vanderkluysen, L.; Demonterova, E.I.; Ivanov, A.V.; Savatenkov, V.M. Geochemistry and 40Ar/39Ar geochronology of the Nandurbar-Dhule mafic dyke swarm: Dyke-sill-flow correlations and stratigraphic development across the Deccan flood basalt province. Geol. J. 2019, 54, 157–176. [Google Scholar] [CrossRef] [Green Version]
  32. Auden, J.B. Dykes in western India—A discussion of their relationships with the Deccan Traps. Trans. Nat. Acad. Sci. Ind. 1949, 3, 123–157. [Google Scholar]
  33. Dessai, A.G.; Bertrand, H. The “Panvel Flexure” along the western Indian continental margin: An extensional fault structure related to Deccan magmatism. Tectonophysics 1995, 241, 165–178. [Google Scholar] [CrossRef]
  34. Samant, H.; Pundalik, A.; D’Souza, J.; Sheth, H.; Carmo Lobo, K.; D’Souza, K.; Patel, V. Geology of the Elephanta Island fault zone, western Indian rifted margin, and its significance for understanding the Panvel flexure. J. Earth Syst. Sci. 2017, 126, 9. [Google Scholar] [CrossRef] [Green Version]
  35. Sukheswala, R.N.; Poldervaart, A. Deccan basalts of the Bombay area, India. Geol. Soc. Am. Bull. 1958, 69, 1475–1494. [Google Scholar] [CrossRef]
  36. Sukheswala, R.N. Gradation of tholeiitic Deccan basalt into spilite, Bombay, India. In Spilites and Spilitic Rocks; Amstutz, G.C., Ed.; Springer: Berlin/Heidelberg, Germany, 1974; pp. 229–250. [Google Scholar]
  37. Sethna, S.F.; Battiwala, H.K. Chemical classification of the intermediate and acid rocks (Deccan Trap) of Salsette Island, Bombay. J. Geol. Soc. Ind. 1977, 18, 323–330. [Google Scholar]
  38. Godbole, S.M.; Rana, R.S.; Natu, S.R. Lava stratigraphy of Deccan basalts of western Maharashtra. In Deccan Basalts; Deshmukh, S.S., Nair, K.K.K., Eds.; Gondwana Geological Society: Nagpur, India, 1996; Volume 2, pp. 125–134. [Google Scholar]
  39. Sheth, H.C.; Zellmer, G.F.; Demonterova, E.I.; Ivanov, A.V.; Kumar, R.; Patel, R.K. The Deccan tholeiite lavas and dykes of Ghatkopar-Powai area, Mumbai, Panvel flexure zone: Geochemistry, stratigraphic status, and tectonic significance. In Flood Basalts of Asia; Sheth, H.C., Vanderkluysen, L., Eds. J. Asian Earth Sci. 2014, 84, 69–82. [Google Scholar] [CrossRef]
  40. Singh, S.D. Petrography and clay mineralogy of intertrappean beds of Mumbai, India. J. Geol. Soc. Ind. 2000, 55, 275–288. [Google Scholar]
  41. Cripps, J.A.; Widdowson, M.; Spicer, R.A.; Jolley, D.W. Coastal ecosystem responses to late stage Deccan Trap volcanism: The post K-T boundary (Danian) palynofacies of Mumbai (Bombay), west India. Palaeogeogr. Palaeoclimatol. Palaeoecol. 2005, 216, 303–332. [Google Scholar] [CrossRef]
  42. Sheth, H.; Pande, K. Geological and 40Ar/39Ar age constraints on late-stage Deccan rhyolitic volcanism, inter-volcanic sedimentation, and the Panvel flexure from the Dongri area, Mumbai. J. Asian Earth Sci. 2014, 84, 167–175. [Google Scholar] [CrossRef]
  43. Sethna, S.F. Geology of Mumbai and surrounding areas and its position in the Deccan volcanic stratigraphy, India. J. Geol. Soc. Ind. 1999, 53, 359–365. [Google Scholar]
  44. Sheth, H.; Samant, H.; Patel, V.; D’Souza, J. The volcanic geoheritage of the Elephanta Caves, Deccan Traps, western India. Geoheritage 2017, 9, 359–372. [Google Scholar] [CrossRef]
  45. Sheth, H.; Patel, V.; Samant, H. Control of early-formed vesicle cylinders on upper crustal prismatic jointing in compound pāhoehoe lavas of Elephanta Island, western Deccan Traps, India. Bull. Volcanol. 2017, 79, 63. [Google Scholar] [CrossRef]
  46. Samant, H.; Patel, V.; Pande, K.; Sheth, H.; Jagadeesan, K.C. 40Ar/39Ar dating of tholeiitic flows and dykes of Elephanta Island, Panvel flexure zone, western Deccan Traps: A five-million-year record of magmatism preceding India-Laxmi Ridge-Seychelles breakup. J. Volcanol. Geotherm. Res. 2019, 379, 12–22. [Google Scholar] [CrossRef]
  47. Pouchou, J.L.; Pichoir, F. A simplified version of the “PAP” model for matrix corrections in EPMA. In Mircobeam Analysis; Newbury, D.E., Ed.; San Francisco Press: San Francisco, CA, USA, 1988; pp. 315–318. [Google Scholar]
  48. Le Bas, M.J.; Le Maitre, R.W.; Streckeisen, A.; Zanettin, P. A chemical classification of volcanic rocks based on the total alkali-silica diagram. J. Petrol. 1986, 27, 745–750. [Google Scholar] [CrossRef]
  49. Verma, S.P.; Torres-Alvarado, I.S.; Sotelo-Rodriguez, Z.T. SINCLAS: Standard igneous norm and volcanic rock classification system. Comput. Geosci. 2002, 28, 711–715. [Google Scholar] [CrossRef]
  50. Wilson, S.A. Data Compilation for USGS Reference Material W-2a, Diabase; U.S. Geological Survey Bulletin 1623; U.S. Geological Survey: Reston, VA, USA, 2000. [Google Scholar]
  51. Roeder, P.L.; Emslie, R.F. Olivine-liquid equilibrium. Contrib. Mineral. Petrol. 1970, 29, 275–289. [Google Scholar] [CrossRef]
  52. Putirka, K.D. Thermometers and barometers for volcanic systems. Rev. Mineral. Petrol. 2008, 69, 61–120. [Google Scholar] [CrossRef]
  53. Melluso, L.; Sethna, S.F. Mineral compositions in the Deccan igneous rocks of India: An overview. In Topics in Igneous Petrology; Ray, J., Sen., G., Ghosh, B., Eds.; Springer: Berlin/Heidelberg, Germany, 2011; pp. 135–160. [Google Scholar]
  54. Sheth, H.C.; Zellmer, G.F.; Kshirsagar, P.V.; Cucciniello, C. Geochemistry of the Palitana flood basalt sequence and the Eastern Saurashtra dykes, Deccan Traps: Clues to petrogenesis, dyke-flow relationships, and regional lava stratigraphy. Bull. Volcanol. 2013, 75, 701. [Google Scholar] [CrossRef]
  55. Cucciniello, C.; Demonterova, E.I.; Sheth, H.; Pande, K.; Vijayan, A. 40Ar/39Ar geochronology and geochemistry of the Central Saurashtra mafic dyke swarm: Insights into magmatic evolution, magma transport, and dyke-flow relationships in the northwestern Deccan Traps. Bull. Volcanol. 2015, 77, 45. [Google Scholar] [CrossRef]
  56. Cucciniello, C.; Choudhary, A.K.; Zanetti, A.; Sheth, H.C.; Vichare, S.; Pereira, R. Mineralogy, geochemistry and petrogenesis of the Khopoli mafic intrusion, Deccan Traps, India. Mineral. Petrol. 2014, 108, 333–351. [Google Scholar] [CrossRef]
  57. Lindsley, D.H. Pyroxene thermometry. Am. Mineral. 1983, 68, 477–493. [Google Scholar]
  58. Ishii, T. The relations between temperature and composition of pigeonite in some lavas and their application to geothermometry. Mineral. J. 1975, 8, 48–57. [Google Scholar] [CrossRef] [Green Version]
  59. Nimis, P. Clinopyroxene geobarometry of magmatic rocks. Part 2. Structural geobarometers for basic to acid, tholeiitic and mildly alkaline magmatic systems. Contrib. Mineral. Petrol. 1999, 135, 62–74. [Google Scholar] [CrossRef]
  60. Lepage, L.D. ILMAT: An Excel worksheet for ilmenite–magnetite geothermometry and geobarometry. Comput. Geosci. 2003, 29, 673–678. [Google Scholar] [CrossRef]
  61. Middlemost, E.A.K. Iron oxidation ratios, norms and the classification of volcanic rocks. Chem. Geol. 1989, 77, 19–26. [Google Scholar] [CrossRef]
  62. Beane, J.E. Flow Stratigraphy, Chemical Variation and Petrogenesis of Deccan Flood Basalts from the Western Ghats, India. Ph.D. Thesis, Washington State University, Washington, DC, USA, 1988. [Google Scholar]
  63. Walker, G.P.L. Compound and simple lava flows and flood basalts. Bull. Volcanol. 1971, 35, 579–590. [Google Scholar] [CrossRef]
  64. Duraiswami, R.A.; Bondre, N.R.; Managave, S. Morphology of rubbly pāhoehoe (simple) flows from the Deccan volcanic province: Implications for style of emplacement. J. Volcanol. Geotherm. Res. 2008, 177, 822–836. [Google Scholar] [CrossRef]
  65. Bondre, N.R.; Duraiswami, R.A.; Dole, G. Morphology and emplacement of flows from the Deccan volcanic province, India. Bull. Volcanol. 2004, 66, 29–45. [Google Scholar] [CrossRef]
  66. Sheth, H. A Photographic Atlas of Flood Basalt Volcanism; Springer: New York, NY, USA, 2018; pp. 363. [Google Scholar]
  67. Cox, K.G.; Hawkesworth, C.J. Geochemical stratigraphy of the Deccan Traps at Mahabaleshwar, Western Ghats, India, with implications for open system magmatic processes. J. Petrol. 1985, 26, 355–377. [Google Scholar] [CrossRef]
  68. Beane, J.E.; Hooper, P.R. A note on the picrite basalts of the Western Ghats, Deccan Traps, India. Geol. Soc. Ind. Mem. 1988, 10, 117–133. [Google Scholar]
  69. Hooper, P.R.; Subbarao, K.V.; Beane, J.E. The Giant Plagioclase Basalts (GPBs) of the Western Ghats, Deccan Traps. Geol. Soc. Ind. Mem. 1988, 10, 135–144. [Google Scholar]
  70. Mitchell, C.; Widdowson, M. A geological map of the southern Deccan Traps, India and its structural implications. J. Geol. Soc. Lond. 1991, 148, 495–505. [Google Scholar] [CrossRef]
  71. Cox, K.G.; Hawkesworth, C.J. Relative contributions of crust and mantle to flood basalt magmatism, Mahabaleshwar area, Deccan Traps. Phil. Trans. Roy. Soc. Lond. 1984, 310, 627–641. [Google Scholar]
  72. Devey, C.W.; Cox, K.G. Relationships between crustal contamination and crystallization in continental flood basalt magmas with special reference to the Deccan Traps of the Western Ghats, India. Earth Planet. Sci. Lett. 1987, 84, 59–68. [Google Scholar] [CrossRef]
  73. Jay, A.E.; Widdowson, M. Stratigraphy, structure and volcanology of the SE Deccan continental flood basalt province: Implications for eruptive extent and volumes. J. Geol. Soc. Lond. 2008, 165, 177–188. [Google Scholar] [CrossRef]
  74. Kale, V.S.; Dole, G.; Shandilya, P.; Pande, K. Stratigraphy and correlations in the Deccan volcanic province, India: Quo vadis? Geol. Soc. Am. Bull. 2020, 132, 588–607. [Google Scholar] [CrossRef]
  75. Sun, S.-S.; McDonough, W.F. Chemical and isotopic systematics of oceanic basalts: implications for mantle composition and processes. Geol. Soc. London Spéc. Publ. 1989, 42, 313–345. [Google Scholar] [CrossRef]
  76. Faure, G. Principles of Isotope Geology, 2nd ed.; Jhon Wiley and Sons: Hoboken, NJ, USA, 1986; 608p. [Google Scholar]
  77. DePaolo, D.J. Neodymium Isotope Geochemistry: An Introduction; Springer: Berlin/Heidelberg, Germany, 1987; 198p. [Google Scholar]
  78. Mahoney, J.J.; Macdougall, J.D.; Lugmair, G.W.; Murali, A.V.; Sankar Das, M.; Gopalan, K. Origin of the Deccan Trap flows at Mahabaleshwar inferred from Nd and Sr isotopic and chemical evidence. Earth Planet. Sci. Lett. 1982, 60, 47–60. [Google Scholar] [CrossRef]
  79. Stormer, J.C., Jr.; Nicholls, J. XLFRAC: A program for interactive testing of magmatic differentiation models. Comput. Geosci. 1978, 4, 143–159. [Google Scholar] [CrossRef]
  80. Macdougall, J.D. Isotopic composition of Deccan and ocean ridge basalts: Implications for their mantle sources. J. Geol. Soc. Ind. 1986, 27, 38–46. [Google Scholar]
  81. Bhattacharya, S.K.; Ma, G.S.K.; Matsuhisa, Y. Oxygen isotope evidence for crustal contamination in Deccan basalts. Chem. Erde 2013, 73, 105–112. [Google Scholar] [CrossRef]
  82. Rudnick, R.L.; Fountain, D.M. Nature and composition of the continental crust: A lower crustal perspective. Rev. Geophys. 1995, 33, 267–309. [Google Scholar] [CrossRef] [Green Version]
  83. Subbarao, K.V.; Chandrasekharam, D.; Navaneethakrishnan, P.; Hooper, P.R. Stratigraphy and structure of parts of the central Deccan basalt province: Eruptive models. In Volcanism; Subbarao, K.V., Ed.; Wiley Eastern, Ltd.: New Delhi, India, 1994; pp. 321–332. [Google Scholar]
  84. Duraiswami, R.A.; Gadpallu, P.; Shaikh, T.N.; Cardin, N. Pāhoehoe-aa transitions in the lava flow fields of the western Deccan Traps, India—Implications for emplacement dynamics, flood basalt architecture and volcanic stratigraphy. J. Asian Earth Sci. 2014, 84, 146–166. [Google Scholar] [CrossRef]
  85. Sen, B. Lava flow transition in pâhoehoe-dominated lower pile of Deccan Traps from Manmad-Chandwad area, western Maharashtra. J. Geol. Soc. Ind. 2017, 89, 281–290. [Google Scholar] [CrossRef]
  86. Subramanyan, V. Geomorphology of the Deccan volcanic province. Geol. Soc. Ind. Mem. 1988, 3, 101–116. [Google Scholar]
  87. Samant, H. A Geomorphic Analysis of the Mumbai-Mumbra Region, and Its Applications Using a Geographic Information System. Ph.D. Thesis, Indian Institute of Technology Bombay, Mumbai, India, 1997; 233p. [Google Scholar]
  88. Ghodke, S.S. Geology of the Area around Panvel, Kolaba Dist. Maharashtra. Ph.D. Thesis, University of Pune, Maharashtra, India, 1978. [Google Scholar]
  89. Nielsen, T.F.D.; Brooks, C.K.; The, E. Greenland rifted continental margin: An examination of the coastal flexure. J. Geol. Soc. Lond. 1981, 138, 559–568. [Google Scholar] [CrossRef]
  90. Viswanathan, S.; Chandrasekharam, D. Dykes related to Deccan Trap volcanism. Geol. Surv. Ind. Spec. Publ. 1976, 14, 97–107. [Google Scholar]
  91. Dessai, A.G.; Viegas, A.A. Multigeneration mafic dyke swarm related to Deccan magmatism, south of Bombay: Implications on the evolution of the western continental margin. Geol. Soc. Ind. Mem. 1995, 33, 435–451. [Google Scholar]
  92. Powar, K.B.; Vadetwar, S.B. Mineralogy and geochemistry of basic dykes and associated plugs of the Revas-Murud sector, Konkan coastal belt, Maharashtra. Geol. Soc. Ind. Mem. 1995, 33, 339–363. [Google Scholar]
  93. Gadgil, R.; Viegas, A.; Iyer, S.D. Structure and emplacement of the Coastal Deccan tholeiitic dyke swarm in Goa, on the western Indian rifted margin. Bull. Volcanol. 2019, 81, 35. [Google Scholar] [CrossRef]
  94. Gudmundsson, A.; Marinoni, L.B. Geometry, emplacement, and arrest of dykes. Annal. Tecto. 2002, 13, 71–92. [Google Scholar]
  95. Mahoney, J.J. Deccan Traps. In Continental Flood Basalts; Macdougall, J.D., Ed.; Kluwer Academic Publishers: Dordrecht, The Netherlands, 1988; pp. 151–194. [Google Scholar]
  96. Self, S.; Widdowson, M.; Thordarson, T.; Jay, A.E. Volatile fluxes during flood basalt eruptions and potential effects on global environment: A Deccan perspective. Earth Planet. Sci. Lett. 2006, 248, 518–532. [Google Scholar] [CrossRef]
Figure 1. Maps of the Deccan Traps (a), a large part of the Konkan Plain in the Western Deccan Traps (b), and the Mumbai City and Elephanta areas of the Konkan Plain (c), each with important features and localities mentioned in the text marked. In (a), the dashed blue line is the Western Ghats escarpment (WGE), NTDS is the Narmada-Tapi dyke swarm, CDS the Coastal dyke swarm, and NPDS the Nasik-Pune dyke swarm ([8] and references therein). (b) shows the map and west–east cross-section (drawn just south of Alibag) of the stratigraphic subgroups of the Western Ghats sequence (based on [18]).
Geosciences 10 00118 g001
Figure 2. (a) Map of Elephanta Island with the main geographical, geological, and man-made features shown. The planform of the two hills on the island is shown approximately by concentric light grey lines. Dykes have their strike plotted accurately, but the length and thickness are not to scale. All sample locations are also shown; numbers with the prefixes F and D indicate flow and dyke samples, respectively. The common prefix “EL” (for Elephanta, used in this study) is removed from all sample numbers to avoid cluttering. Available 40Ar/39Ar ages for the samples [46] are also indicated. The lower right corner of the map shows a rose diagram of the strikes of the 20 tabular intrusions (19 dykes and one inclined sheet) observed and sampled. The Elephanta Fault Zone in the southeastern part of the island is from [34], and the Central Elephanta Fault running across the central valley is identified based on the geochemical stratigraphy in the present study. (b) Interpretative composite cross-section of Elephanta Island in a WNW–ESE direction (thus roughly perpendicular to the strike of the dipping sequence). The section, with an actual topographic profile (heavy line) and without vertical exaggeration, shows the stratigraphic relationships between the various sampled units as well as the physical characters of the lava flows. The dykes are not shown for clarity.
Geosciences 10 00118 g002
Figure 3. Photomicrographs of Elephanta flow (ELF) and dyke (ELD) samples, all taken between crossed nicols: Flows ELF1 (a), ELF4 (b), ELF4A (c), and dykes ELD1 (d, e), ELD4 (f), ELD5 (g, h), ELD6 (i), picrite ELD10 (j), ankaramite ELD13 (k), and ELD19 (l). Abbreviations used are: Ol (olivine), Cpx (clinopyroxene), Pl (plagioclase), Ox (Fe–Ti oxide).
Geosciences 10 00118 g003
Figure 4. Back-scattered electron (BSE) images of selected Elephanta lava flows (ELF) and dykes (ELD). (a) Basalt ELF1, with clinopyroxene and plagioclase microphenocrysts in a groundmass of clinopyroxene, plagioclase, and opaque oxides (mainly magnetite). (b) Basalt ELF4A, with olivine and plagioclase phenocrysts set in a groundmass with olivine, plagioclase, clinopyroxene, and opaque oxides. Olivines are zoned (light grey zones are Fe-rich). (c) Basalt ELD1 with plagioclase and clinopyroxene phenocrysts set in a groundmass of clinopyroxene, plagioclase, magnetite, quartz, and glass. (d) Picrite ELD10 with olivine phenocrysts set in an intergranular-textured groundmass with olivine, plagioclase, clinopyroxene, and opaque oxides. Olivines are zoned (light grey zones are Fe-rich) and contain small spinel inclusions. Abbreviations: ol, olivine; pl, plagioclase; cpx, clinopyroxene; mgt, magnetite.
Geosciences 10 00118 g004
Figure 5. (a) Olivine phenocryst and groundmass composition (Fo%) vs. whole-rock Mg Number (Mg#) for Elephanta lava flows and dykes. The equilibrium field, bounded by the three curves, represents the Mg/Fe partition coefficient between olivine and liquid (Kd = 0.30 ± 0.03; [51]). (b) Pyroxene compositions projected in the Ca–Mg–Fe diagram. Additionally shown for comparison is the compositional field for pyroxenes of all other Deccan tholeiitic and alkaline rocks ([53,54,55,56] and references therein).
Geosciences 10 00118 g005aGeosciences 10 00118 g005b
Figure 6. (a) Composition of plagioclase in the Elephanta lava flows and dykes. (b) Chemical variation in chromium-bearing spinels in the Elephanta dykes. The fields for spinels of all Deccan Traps rocks are also shown (data sources as in Figure 5). (c) Fe–Ti–Mn–Mg (atomic) diagram for the oxide minerals in the Elephanta lava flows and dykes.
Geosciences 10 00118 g006aGeosciences 10 00118 g006b
Figure 7. Plot of Ti/Y vs. Zr/Nb for the Lonavala and Wai Subgroup lavas of the WG sequence (data of [62]), with data for the Elephanta flows and dykes. The Lonavala Subgroup data are plotted for the Khandala and Bushe formations separately (see text).
Geosciences 10 00118 g007
Figure 8. Binary plots of (a) Nb/Zr vs. Ba/Y, (b) Sr vs. Nb/Zr, and (c) TiO2 (wt.%) vs. Zr/Y, for various WG stratigraphic formations. Data for Elephanta lava flows and dykes are also plotted. Data sources are [14,62].
Geosciences 10 00118 g008
Figure 9. Values of the first two canonical discriminant functions for the Elephanta lava flow and dyke samples, with fields and centroids of their closest WG stratigraphic formations. Formation centroids (open diamonds) have the following function scores: Khandala (K), −1.193, 1.846; Bushe (B), −2.016, −1.162; Poladpur (P), 0.120, −0.691; Ambenali (A), 1.014, −1.127; Mahabaleshwar (M), 2.745, −0.123.
Geosciences 10 00118 g009
Figure 10. (ad) Comparison of primitive mantle-normalized multielement patterns of the Elephanta lava flows with those of selected WG lavas, members, or formation averages (main data sources are [19,29,62]. The normalizing values are from [75]. In several panels, the patterns are arranged to overlap at their normalized Lu; this helps easy visual comparison and also minimizes the differences related to different degrees of crystal fractionation.
Geosciences 10 00118 g010
Figure 11. (af) Comparison of primitive mantle-normalized multielement patterns of the Elephanta dykes with those of selected WG lavas, members, or formation averages (main data sources are [19,29,62]. The normalizing values are from [75]. In several panels, the patterns are arranged to overlap at their normalized Lu.
Geosciences 10 00118 g011
Figure 12. Sr–Nd isotopic plot for the Elephanta flows and dykes, with sample numbers indicated (without the prefixes to avoid cluttering). Data are shown for the WG stratigraphic formations and the Coastal swarm dykes [19] as well as the Ghatkopar-Powai (Mumbai) tholeiitic flows and dykes [39]. All data are initial values for 65 Ma. The “common signature” field [61] is shown with the heavy dashed line. Light yellow box placed in the lower left part of the main plot schematically shows the two-stage mixing postulated for the WG magmas. S1 shows the Stage 1 mixing (black color) between Ambenali magmas and different types of continental crust, producing the Ambenali–Poladpur–Bushe and Ambenali–Mahabaleshwar arrays [78]. The common signature was itself a product of this Stage 1 mixing, and was then a mixing end member in Stage 2 mixing (dark grey color) with crust, which the isotopic data require to be of at least three distinct types [29].
Geosciences 10 00118 g012
Figure 13. Normalized multielement pattern for a simple binary mixture of Ambenali magma and Archaean felsic crust [82] in an 85:15 proportion, compared to the patterns for the Khandala-like Elephanta flows ELF4 and ELF4A. The patterns are so placed as to overlap at their normalized Lu.
Geosciences 10 00118 g013
Figure 14. Comparison of primitive mantle-normalized multielement patterns of Elephanta dykes and Elephanta and Mumbai flows. (a) Elephanta flow ELF3 and dyke ELD15. (b) Elephanta flow ELF3A and dyke ELD16. (c) Mumbai ankaramite flow (samples MMF6, 7; [39]) and Elephanta ankaramite dyke ELD13 (data of this study). Panel (c) also provides an easy comparison between the critical geochemical–isotopic data for the three samples, listed in the order MMF6–MMF7–ELD13. “na” means not analyzed. The Pb values for MMF6-7 are not plotted because of probable contamination issues [39].
Geosciences 10 00118 g014
Figure 15. Structural cross-section of Elephanta Island, perpendicular to the strike of the dipping lava flows, resulting from the understanding of geochemical stratigraphy achieved in this paper. The horizontal and vertical scales are identical. The amount of eastward dip of the Central Elephanta Fault is unknown, but the fault is assumed to be subparallel to the Elephanta Fault Zone [34].
Geosciences 10 00118 g015
Table 1. Geochemical stratigraphy of the Western Ghats region, Deccan Traps
GroupSubgroupFormationPolarity(87Sr/86Sr)tεNd (t)(143Nd/144Nd)t206Pb/204Pb
Deccan BasaltWaiDesur* (~100 m)N0.7072–0.7080–5.9 to −10.40.512251–0.512020na
Panhala (>175 m)N0.7046–0.7055+3.8 to −0.50.512748–0.512527na
Mahabaleshwar (280 m)N0.7040–0.7055+5.6 to −7.40.512840–0.51217416.65–18.18
Ambenali (500 m)R0.7038–0.7044+8.3 to +2.50.512978–0.51268117.53–18.48
Poladpur (375 m)R0.7053–0.7110+3.3 to −11.00.512722–0.51198917.40–19.32
LonavalaBushe (325 m)R0.7078–0.7200–7.5 to −19.40.512169–0.51155918.33–22.85
Khandala (140 m)R0.7071–0.7124–1.0 to −20.40.512502–0.51150716.69–19.26
KalsubaiBhimashankar (140 m)R0.7067–0.7077+0.2 to −5.90.512563–0.51225119.60–20.92
Thakurvadi** (650 m)R0.7067–0.7224–2.9 to −14.00.512404–0.51183517.28–20.28
Neral (100 m)R0.7062–0.7104–2.5 to −15.00.512425–0.51178416.68–19.95
Jawhar-Igatpuri (>700 m)R0.7085–0.7128–3.2 to −8.50.512389–0.51211719.12–22.52
Notes: *The Desur is considered by some workers as a “Unit” of the Panhala Formation. **The Sr-isotopic range for most of the Thakurvadi Formation lavas is 0.7067–0.7112, but a single flow in the formation (Paten Basalt) has anomalous, broadly Bushe-like values of (87Sr/86Sr)t = 0.7224 and εNd(t) = −15.4. Formation names and thicknesses and isotopic ranges are based on [26] and references therein, [27,28,29], and include the new lava flow analyses in [19]. N = normal magnetic polarity, R = reverse magnetic polarity. Note that the R-N polarity transition (29R to 29N) occurs not at the Ambenali-Mahabaleshwar contact but a little above it [30]. All Sr and Nd isotopic ratios are initial ratios age-corrected to 65 million years. Pb isotopic ratios are present-day values. na = not analyzed. 40Ar/39Ar and U-Pb zircon ages available for several of these stratigraphic units are given in [31].
Table 2. Major oxide compositions and loss on ignition (LOI) values (in wt.%) of the Elephanta Island flows (ELF) and dykes (ELD).
SampleELF 1ELF1AELF 2ELF 3ELF3AELF 4ELF4AELF4BELF5ELF6ELF7ELD 1ELD2ELD 3ELD 4ELD5ELD 6
Comp.B,saB,saB,saB,saB,saB,saB,saB,saB,saB,saB,saB,saB,saB,saB,saB,saB,sa
SiO248.6847.8047.1546.1444.9546.8246.1847.9946.4444.1045.0550.1646.5046.4149.3846.2846.62
TiO22.152.252.142.481.981.811.791.502.132.131.422.412.322.532.891.592.39
Al2O313.9214.4213.9013.7216.4214.6514.0913.7713.6513.5114.0513.6513.8513.8012.5713.7313.50
Fe2O3(T)14.8112.5714.5516.0613.1414.2314.3613.1414.5114.4313.3715.1013.7716.6016.7412.6116.26
MnO0.200.190.190.240.180.190.190.170.200.200.180.210.190.220.230.180.23
MgO6.967.077.116.685.396.948.368.957.207.129.775.297.226.755.588.116.88
CaO11.4210.211.5110.9711.7510.359.919.4211.3110.829.439.2911.3010.509.5410.7310.67
Na2O2.312.722.162.241.702.292.352.412.202.292.352.962.412.932.552.502.36
K2O0.210.760.170.250.100.560.600.310.180.140.240.440.350.200.470.570.19
P2O50.210.220.190.230.180.190.190.150.190.200.150.280.210.230.290.290.21
LOI0.950.651.851.154.622.731.072.711.643.353.600.470.820.900.653.001.08
Total101.8298.85100.92100.16100.41100.7699.09100.5299.6598.2999.61100.2698.94101.07100.8999.59100.39
Mg#52.356.853.349.348.953.357.661.453.753.663.145.055.148.743.860.149.7
SampleELD 7ELD 8ELD 9ELD10ELD11ELD12ELD13ELD14ELD15ELD16ELD17ELD18ELD19ELD20W-2aW-2a
Comp.B,saB,saPICPICB,saB,saB,saB,saB,saB,saB,saB,saB,saB,alRef.Meas.
SiO250.0849.0748.8448.3746.2147.8848.4146.3048.6248.2748.1346.0046.2843.1452.6853.17
TiO21.882.941.571.612.322.501.782.541.761.942.342.142.472.061.061.11
Al2O313.5312.8711.9512.1513.6413.5410.3313.5913.8814.1913.5913.5713.1612.6915.4515.25
Fe2O3(T)12.8516.4413.5713.4714.0216.4613.3015.9712.1712.8814.0214.4216.1813.1910.8311.36
MnO0.180.220.190.190.210.220.170.220.180.190.190.210.210.260.170.17
MgO8.175.7912.5712.407.336.2210.706.267.737.857.277.246.178.796.376.8
CaO10.659.239.549.7011.2310.4510.7010.7710.9011.0911.3111.3610.0811.3010.8610.94
Na2O2.582.722.192.272.562.592.052.522.592.722.502.352.692.132.202.23
K2O0.400.490.380.350.250.430.470.180.300.320.360.160.340.220.630.63
P2O50.210.290.180.180.210.220.180.220.200.200.210.200.220.260.140.13
LOI1.181.220.660.400.440.462.051.341.401.250.901.351.574.43
Total101.71101.28101.64101.0998.42100.97100.1499.9199.73100.9100.8299.0099.3798.47100.39101.79
Mg#59.845.168.468.355.046.965.347.859.858.854.854.047.160.9
Notes: ELF samples are lava flows and ELD samples are dykes of Elephanta Island. B,sa = subalkalic basalt; PIC = picrite; B,al = alkalic basalt. The rock names are based on major oxide data recalculated to 100% on an anhydrous basis using the TAS diagram [48] with the SINCLAS program [49]. ELD9 and ELD10 are picrites petrographically and by the TAS diagram, and ELD13, petrographically an ankaramite, is a subalkalic basalt by the TAS diagram. Note that ELD20 is (the only) alkalic basalt, with a little (0.07 wt.%) normative nepheline. Mg# = 100 Mg2+/(Mg2+ + Fe2+), atomic, assuming 85% of the total Fe to be in the Fe2+ form. Reference values and measured values on the USGS standard W-2a [50] provide an idea about analytical accuracy.
Table 3. Trace element compositions (in ppm) of the Elephanta Island flows (ELF) and dykes (ELD).
A 
A 
SampleELF 1ELF1AELF 2ELF 3ELF3AELF 4ELF4AELF4BELF5ELF6ELF7ELD 1ELD2ELD 3ELD 4ELD5ELD 6
NameB,saB,saB,saB,saB,saB,saB,saB,saB,saB,saB,saB,saB,saB,saB,saB,saB,sa
Sc 36.835.738.537.130.631.931.328.637.037.228.333.838.038.437.930.238.1
Cr 637464375334123375466387435295222673600207344735162
Co44.835.743.646.537.253.552.152.643.943.453.441.542.349.946.552.150.0
Ni11412110995.668.820319222610896.924269.813683.270.6271103
Cu 25319821522319612517310921120712622822122727498.1236
Rb1.5623.13.063.370.6812.414.02.500.880.441.9219.98.381.4110.410.18.34
Sr 210212220215250240240234210209222263214215215392205
Y 31.034.430.134.227.828.327.323.028.830.222.737.831.633.938.324.733.7
Zr 136172127149121134132123125124101191176147182129139
Nb9.29.18.67.07.46.66.55.58.79.15.26.87.86.512.314.68.7
Ba 60.814044.464.737.516017712157.848.810620260.055.011124251.8
La7.7211.97.258.145.7310.210.28.116.877.367.6712.38.128.7013.415.18.24
Ce26.036.724.527.621.831.732.326.924.926.025.544.923.126.537.855.825.6
Pr2.873.752.713.012.203.153.142.522.602.722.355.313.163.354.625.793.12
Nd18.822.818.020.016.219.920.117.118.218.816.027.317.919.625.329.519.1
Sm5.446.105.235.844.805.245.304.485.305.504.257.145.325.816.886.145.68
Eu1.431.531.371.511.181.301.291.071.321.371.031.991.641.701.931.541.61
Gd4.344.804.154.593.473.893.903.153.954.123.026.314.975.216.104.514.99
Tb0.750.820.730.810.600.660.660.530.700.720.511.070.860.921.060.690.88
Dy4.514.944.364.853.633.933.943.204.184.303.026.325.185.496.293.895.28
Ho0.890.980.860.970.720.770.780.630.820.850.601.241.021.071.250.761.05
Er2.392.632.312.611.922.102.111.732.212.271.623.362.712.903.412.082.86
Tm0.320.360.310.350.260.290.290.240.300.310.220.460.370.390.460.290.39
Yb1.942.191.872.111.581.731.721.421.811.851.352.742.162.332.811.752.34
Lu0.300.340.290.330.250.270.270.220.280.290.210.440.340.380.450.290.37
Pb3.294.081.891.791.863.713.553.181.771.543.236.032.552.712.793.992.20
Th0.861.840.800.900.671.001.000.810.770.800.752.140.840.941.551.640.98
U0.210.430.190.240.150.200.200.150.190.190.150.460.260.270.420.370.28
B 
B 
SampleELD 7ELD 8ELD 9ELD10ELD11ELD12ELD13ELD14ELD15ELD16ELD17ELD18ELD19ELD20W-2a W-2a
NameB,saB,saPICPICB,saB,saB,saB,saB,saB,saB,saB,saB,saB,alRef.Meas.
Sc 34.140.131.531.439.137.836.038.435.637.539.138.237.435.33636.6
Cr 94124114441426527409121261.03503553692671137439287.7
Co50.347.757.858.042.245.854.547.439.140.742.143.945.246.04343.2
Ni29072.343239313584.325879.213413913010479.21757069.1
Cu 14527313313623725311322818121922818924896.2110107
Rb6.2913.16.466.932.8111.59.760.582.003.067.490.674.882.052121.3
Sr 277207242248211213259229220219209215207371190196
Y 25.641.122.722.731.433.522.734.430.132.032.131.033.824.72323.4
Zr 11818110710613714112314216613714113114513610099.3
Nb8.810.67.57.99.28.910.29.68.08.48.98.69.416.97.97.0
Ba 1051111071055166.514954.910811856.142.672.0145170174
La11.213.58.509.946.697.2812.08.399.0710.77.476.757.3414.31010.4
Ce32.038.730.329.926.226.635.826.631.231.724.825.427.650.82323.8
Pr3.724.622.683.152.662.793.613.202.883.442.922.542.774.27-2.98
Nd20.826.019.018.719.920.121.319.720.420.418.818.920.729.41313.6
Sm5.297.134.784.695.855.965.195.865.535.525.655.446.166.503.303.55
Eu1.461.941.031.201.401.441.261.651.261.451.511.301.431.301.01.06
Gd4.336.183.123.574.254.383.805.013.864.494.603.914.383.77-3.60
Tb0.721.070.510.600.740.770.620.870.660.780.810.690.760.580.630.63
Dy4.206.383.043.514.394.613.575.244.004.674.784.134.583.293.63.88
Ho0.821.270.600.690.860.920.691.030.790.930.940.820.910.640.760.80
Er2.233.471.621.902.332.471.862.792.152.522.522.202.421.702.52.26
Tm0.300.470.230.260.310.330.250.380.300.340.340.300.330.230.380.32
Yb1.832.861.351.571.861.991.512.251.782.062.011.781.981.402.12.02
Lu0.290.460.220.250.290.320.240.360.280.330.320.280.310.220.330.33
Pb2.723.132.452.711.561.954.252.043.143.551.711.631.804.209.39.60
Th0.881.500.750.850.750.821.310.911.171.340.790.770.851.322.42.16
U0.240.400.170.230.190.200.320.270.270.350.250.190.200.280.530.53
Table 4. Strontium and neodymium isotopic data for Elephanta Island flows (ELF) and dykes (ELD), along with their published 40Ar/39Ar ages.
SampleELF1ELF4AELF5ELD3ELD6ELD8ELD10ELD11ELD13ELD17ELD19
Rb ppm1.2511.340.791.237.0611.125.673.069.356.254.08
Sr ppm195224196198191200241198248203201
Rb/Sr0.0060.0510.0040.0060.0370.0560.0240.0150.0380.0310.020
87Rb/86Sr0.0180.1460.0120.0180.1070.1610.0680.0450.1090.0890.059
(87Sr/86Sr)p0.7041190.7079720.7041200.7042270.7044470.7045390.7040220.7039750.7055830.7039930.704278
± 2σ0.0000050.0000050.0000050.0000050.0000050.0000040.0000040.0000050.0000040.0000040.000005
(87Sr/86Sr)t0.7041020.7078370.7041090.7042100.7043480.7043910.7039590.7039340.7054820.7039110.704223
Sm ppm4.544.304.345.034.856.243.984.714.254.804.97
Nd ppm15.8816.6515.0817.3716.6523.3616.2216.1917.7616.4917.35
Sm/Nd0.2860.2580.2880.2900.2910.2670.2450.2910.2390.2910.286
147Sm/144Nd0.1730.1560.1740.1750.1760.1610.1480.1760.1450.1760.173
(143Nd/144Nd)p0.5128730.5123030.5128670.5128780.5128420.5127890.5122140.5129040.5123940.5129020.512878
± 2σ0.0000030.0000030.0000040.0000030.0000030.0000040.0000040.0000040.0000030.0000030.000003
(143Nd/144Nd)t0.5127990.5122370.5127930.5128030.5127670.5127200.5121510.5128290.5123320.5128270.512804
εNd+4.6–6.5+4.5+4.7+4.0+2.9–8.3+5.2–4.8+5.1+4.7
εNdt+4.8–6.2+4.7+4.9+4.2+3.2–7.9+5.4–4.3+5.3+4.9
40Ar/39Ar age66.6 ± 1.166.1 ± 0.6 65.6 ± 0.965.3 ± 0.5 65.2 ± 0.4 61.6 ± 0.4 65.6 ± 0.5
Notes: La Jolla Nd yielded a value of 143Nd/144Nd = 0.511843 ± 0.000003 (2σ) (n = 5)□, and NBS987 yielded a value of 87Sr/86Sr = 0.710250 ± 0.000004 (2σ)□ (n = 6). Isotopic ratios with subscript “p” indicate present-day (measured) values, and those with subscript “t” indicate age-corrected initial values for 65 Ma. The seven reported 40Ar/39Ar ages are plateau ages with 2σ uncertainties, and an eighth sample, dyke ELD1 not analyzed for Sr-Nd isotopes, has an age of 65.7 ± 0.5 Ma [46].
Table 5. Geochemical data used to distinguish the middle and younger stratigraphic units, Western Ghats sequence.
FormationSr (ppm)Ba (ppm)Ba/Y(87Sr/86Sr)tZr/NbTiO2 (wt.%)
Desur Unit (Panhala)>230>150-0.707–0.708<12.5low (<2.25)
Panhala<200<90-0.704–0.705>13low (<2.2)
Mahabaleshwar>250>100>4>0.705<10.5>2.0
Kolhapur Unit >200--0.704–0.705<13.0high (>2.25)
Ambenali200–250<100<3.5<0.70510.5–15<2.7
Poladpur->100>3.50.705–0.71315-20-
Bushe->100->0.713>20very low (<1.5)
Khandala---0.7071–0.712412.9–18.71.0–3.1
Notes: Based on [14,15,28,29,69,73]. The Kolhapur Unit directly overlies the Ambenali Fm. in the southermost Deccan Traps and comprises highly fractionated flows with distinct geochemical features from the Mahabaleshwar Fm. as shown. The Desur lavas are considered a Unit of the Panhala Fm. by some workers; they overlie and are more radiogenic than the Panhala flows in the southernmost Deccan Traps, but have trace element abundances similar to the Mahabaleshwar Fm. (e.g., [28]). Dashes mean that the particular criterion is not defined for that particular formation or unit, or if defined, is not distinctive.
Table 6. Discriminant function analysis results for the Elephanta Island flows (ELF) and dykes (ELD).
Flow SampleBest MatchpM Dist.Fn. 1Fn. 2Dyke SampleBest MatchpM Dist.Fn. 1Fn. 2
ELF1Pol0.9631.940–0.179–0.455ELD1Kha?0.00033.26–3.2653.704
ELF1AKha0.07512.89–1.4652.194ELD2Kha?0.00037.88–0.2802.435
ELF2Pol0.9402.3190.213–0.865ELD3Pol0.04614.32–1.2770.173
ELF3Pol0.07712.80–1.3600.285ELD4Kha0.2399.187–0.3891.075
ELF3ABhim0.3088.292–0.789–1.486ELD5Ner?0.00028.112.5602.260
ELF4Kha0.12411.36–1.7051.883ELD6Pol0.7304.420–0.508–0.665
ELF4AKha0.17810.19–1.9521.991ELD7Thak0.01317.841.1051.134
ELF4BKha?0.00222.68–1.4571.660ELD8Kha0.01816.97–1.1551.113
ELF5Pol0.9960.902–0.054–0.818ELD9Thak?0.00049.960.9011.960
ELF6Pol0.9960.904–0.036–1.323ELD10Thak?0.00037.130.9441.496
ELF7Bush0.01417.54–1.5350.311ELD11Pol0.5955.5310.304–0.246
ELD12Pol0.8353.500–0.602–0.531
ELD13Ner0.11811.521.4131.865
ELD14Pol0.8043.786–0.118–0.804
ELD15Kha0.00321.94–0.8442.381
ELD16Kha0.4776.550–0.8770.538
ELD17Pol0.4336.9610.020–0.023
ELD18Pol0.9282.4840.009–0.834
ELD19Pol0.8733.123–0.664–0.442
ELD20Mah0.06113.504.4350.649
Notes: Formation matches with corresponding probabilities (p) of 0.002 or lower are shown by question marks. M dist is Mahalanobis distance of the sample from the centroid of the closest-match formation. Note how p decreases as Mahalanobis distance increases. The names of Western Ghats stratigraphic formations are abbreviated as follows: Thak (Thakurvadi), Bhim (Bhimashankar), Kha (Khandala), Bush (Bushe), Pol (Poladpur), Mah (Mahabaleshwar). The standardized canonical discriminant function coefficients are: Function 1 = –0.621Ba + 1.106Nb + 0.249Ni + 0.354Sc + 0.499Sr – 0.607Y + 0.089Zr. Function 2 = 0.647Ba – 0.618Nb + 0.387Ni + 0.170Sc + 0.133Sr – 0.640Y + 1.621Zr. Note that the values of the elements in these function coefficients are Z score values.
Table 7. Fractional crystallization calculation for dyke ELD1 using the XLFRAC program.
From ELD1To ELD1 GlasscpxplmgtpigRemoved Solid %
BasaltRhyolite −87.6Res2
SiO2 wt.%51.0478.0751.1254.62 49.47 0.057
TiO22.450.910.11 25.060.33 0.016
Al2O313.8913.011.8327.212.121.03 0.001
FeOt13.831.449.431.1667.3528.16 0.115
MnO0.210.000.11 0.390.76 0.001
MgO5.380.0017.93 0.3813.80 0.121
CaO9.450.5818.2010.49 5.19 0.321
Na2O3.013.320.355.47 0.18 0.031
K2O0.452.64 0.33 0.000
P2O50.280.03 0.079
Total100.00100.00 ∑Res20.741
% in solid fractionated 21.948.610.918.6
Notes: cpx, clinopyroxene; pl, plagioclase; mgt, magnetite, pig, pigeonite. ∑Res2 is the sum of the squares of the residuals.

