Article

Naturally Occurring Potentially Harmful Elements in Groundwater in Makueni County, South-Eastern Kenya: Effects on Drinking Water Quality and Agriculture

1
Department of Geology, University of Johannesburg, Johannesburg 2006, South Africa
2
British Geological Survey, Nottingham NG12 5GG, UK
3
Department of Geoscience, Federation University, Ballarat 3353, Australia
4
Department of Environmental Science and Land Resources Management, South Eastern Kenya University, Kitui P.O. Box 170-90200, Kenya
*
Author to whom correspondence should be addressed.
Geosciences 2020, 10(2), 62; https://doi.org/10.3390/geosciences10020062
Submission received: 7 November 2019 / Revised: 10 January 2020 / Accepted: 11 January 2020 / Published: 6 February 2020
(This article belongs to the Special Issue Perspectives on Environment and Human Health)

Abstract

:
Makueni County is located in the semi-arid south-eastern Kenya region characterized by unreliable rainfall and limited surface water resources. This necessitates a high reliance on groundwater for domestic and agricultural use. In this paper, we report on the physico-chemical characteristics of 20 drinking water sources (boreholes, shallow wells, streams, and tap water) collected during the dry season (November 2018), the geochemical processes controlling their composition, and their suitability for drinking water and irrigation. Of all the physico-chemical parameters analysed, the concentrations of total dissolved solids, hardness, electrical conductivity, magnesium, calcium, chloride, and fluoride exceeded the permissible drinking water limits set by both the World Health Organization (WHO) and Kenya Bureau of Standards (KEBS) in up to 55% of the samples. The dominant ions reflect the high salinity in the water that ranged from very high to extreme in up to 50% of samples. The northern region shows the highest concentrations of the dominant parameters. The water type is predominantly Ca-Mg-HCO3 with a trend to Ca-Mg-Cl-SO4. Rock weathering and evaporation are suggested to be the primary controls of groundwater geochemical characteristics. High salinity and fluoride, which are associated with reported undesirable taste and gastrointestinal upsets, as well as cases of dental fluorosis are some of the effects of consuming groundwater in the region. These two parameters can be attributed to the weathering of biotite gneisses, granitoid gneisses, migmatites, and basaltic rocks that occur in the area. The high salinity and alkalinity of most of the samples analysed, renders the water unsuitable for irrigation in the study area.

1. Introduction

Provision of clean water (SDG 6), achieving good health (SDG 3), and eradication of poverty (SDG 1) and hunger (SDG 2) are among the United Nations (UN) sustainable development goals [1] and all of these goals link directly to the availability of reliable and appropriate quality drinking water. Access to safe clean drinking water in sub-Saharan Africa is still low (23.7%) compared to the global figure of 71%, where huge disparities of up to 39% occur between the access to clean water for urban and rural populations [1]. Measures in place to improve water quality include increased provision of piped water, borehole drilling, and protecting springs and dug wells [1,2]. These steps, however, do not address the ongoing issue of poor groundwater quality that is characterized by elevated levels of naturally occurring potentially harmful elements.
In arid regions across the world, groundwater resources are highly relied upon, for the provision of drinking, agricultural, and industrial water [3]. Natural processes such as volcanism and the high dissolution of harmful elements from both natural and anthropogenic processes including overexploitation, mining and agricultural activities, industrial impacts, and the addition of animal and human waste, can render this important drinking water resource unhealthy or unsafe [3,4]. Poor groundwater quality threatens millions of people’s health and agricultural production and quality in most arid areas [5] and in many instances, the main geochemical processes controlling the release and concentration of potentially harmful elements are not well understood. The release and concentration of elements in groundwater depends upon diverse factors including aquifer and local lithology, water–rock interactions, recharge rate, as well as human activities such as mining and agriculture [6]. Accumulation of these contaminants beyond that recommended for drinking water and agriculture safety results in a variety of health complications and directly affects life expectancy and community health [1].
Makueni County is located in the arid and semi-arid land (ASAL) regions of Kenya that receives low and unreliable rainfall leading to high dependence on groundwater for domestic, agricultural, and pastoral supply [7,8]. In addition, about 64% of the population use unimproved water sources that include dams, streams/rivers, and unprotected springs and wells [9]. The availability of reliable surface water is one of the biggest challenges in the county and the local government has addressed this shortfall by drilling boreholes and shallow wells for potable water and has constructed sand and earth dams for agricultural and pastoral purposes [2,8]. Although these solutions have been beneficial in many ways, the presence of potentially harmful elements are reported in groundwater in the south-east Kenya region where Makueni county is located [8,10] and these elements are associated with adverse health impacts in many parts of the world [5,11,12]. These potentially harmful elements/parameters that include elevated fluoride (F), iron (Fe), and high salinity have been linked to the dissolution of metamorphic and volcanic rocks in the region which are enriched in these elements [8,10,13,14,15]. In addition to their impact on drinking water quality, these elements can also affect the quality of irrigation water and can reduce agricultural output and quality of the agricultural products. Makueni County is a rapidly growing county in Kenya and there is a need to understand the groundwater quality as reliance for drinking and agriculture purposes is high.
This paper presents part of the results of a larger study in the Makueni County. It addresses the major geochemical processes controlling the quality of water used for domestic and agricultural purposes in the central and southern parts of Makueni County. Although the presence of potentially harmful elements such as F has been previously reported [10], data was limited to boreholes in the central and northern parts of the county and little is known about the southern parts. In order to more completely characterise the water resource of the region, additional water sources including boreholes, shallow wells, streams, and tap water used by the local population were analysed. For the first time, a full major and trace element analysis was conducted in the area. Despite the water being used for small scale agriculture in the county, there are no documented studies that have analysed the suitability of the various water sources for agriculture based on their physico-chemical parameters; and we address this aspect as it is a significant vector to bring potentially harmful elements into the human food chain. We have incorporated the analysis into a geographic information system (GIS) to show the spatial distribution of the various physico-chemical parameters, which delineates the various water quality zones for both domestic and agricultural purposes. The significance of this work is in the spatial delineation of zones of poor water quality and the link between geological materials and water chemistry is investigated. Such baseline studies are required to make meaningful water management decisions for the region especially since there is a high reliance on groundwater sources for domestic and agricultural purposes.

2. Materials and Methods

2.1. Study Area

2.1.1. Location, Population, and Water Supply

Makueni County is located in south-eastern Kenya and borders Machakos County to the north, Kitui County to the east, Taita-Taveta County to the south, and Kajiado County to the west (Figure 1). The administrative centre is in Wote, the largest urban centre, and Kibwezi and Makindu are smaller, but important rural towns. Makueni County has a population of approximately 884,527 with an annual growth rate of 2.8% [9,16] and the local population live in a predominantly rural setting except in Wote, Kibwezi, and Makindu urban centres. Small-scale agriculture is the most common economic activity in the county. Common food crops grown in the area include maize (Zea mays), beans (Phaseolus vulgaris), cowpeas (Vigna unguiculata), watermelons (Citrullus lanatus), and mangoes (Mangifera indica).
About 36% of the population in the county have access to improved water sources that include protected springs and wells, boreholes, and piped water, while the rest rely on dams, rivers and streams, unprotected wells, and water vendors [16]. To address the water shortfall, the county government and other local non-government organizations (NGOs) have provided alternative water sources including drilling and provision of community boreholes and shallow wells, construction of sand dams, and establishment of irrigation schemes along permanent rivers [2,18]. Most of the population in Makindu and Kibwezi towns have access to piped water, which is sourced from the Umami spring and provided by the Tanathi Water Services Board, a government organisation. The other areas are more remote and rely on groundwater sources.

2.1.2. Physiography and Climate

Most parts of the region are flat with a small hilly region around Mbui-Nzau where the elevation rises from 1000 m in the flatlands to 1200 m. Generally, the county experiences two rainy seasons, with long heavy rains experienced in March–April and a shorter season with light rains, in November–December [19] although climate change has impacted on the regularity of these patterns. Hilly areas are wetter with an annual rainfall range of 800–1200 mm while the low-lying areas receive a slightly lower range of 150–650 mm annually [19]. Conversely, temperatures are slightly lower in the hilly regions with a range of 20–24 °C while the low-lying regions are hotter at 35 °C and higher [19].

2.2. Geology and Hydrogeology

The geology of Makueni County is predominantly Precambrian metamorphic rocks of the Mozambique mobile belt (MMB) that are overlain, in much of the western area, by younger Pleistocene–Recent volcanic rocks [7,13,20]. Biotite gneisses and granitoid gneisses are the dominant lithologies covering most of the northern, eastern, and southern areas [20] as shown in Figure 1. These rocks are rich in biotite, muscovite, plagioclase, microcline, hornblende, sillimanite, graphite with accessory minerals including magnetite and apatite [20]. Some of these minerals (biotite, muscovite, apatite, and magnetite) host considerable concentrations of potentially harmful components such as F [13]. Distinctive outcrops of granitoid gneisses form hilly landscapes, as seen in the Mbui-Nzau area, due to their high resistance to weathering while the less resistance biotite gneisses form most of the gentle plains and low-lying regions [7,20]. Basalt flows and volcanic cones cover areas such as Chyulu hills south of the study area, while unconsolidated bombs and clast are mainly found in the western parts of Makindu and Kibwezi [7,13]. Minerals associated with these volcanic rocks include olivine, pyroxene, feldspars with accessory labradorite, augite, magnetite, and volcanic glass [13]. Recent soils and alluvium of varying depths overly the rocks in the area except in the hilly Mbui-Nzau area.
Aquifers in the area are mainly associated with paleo-weathered horizons, contact zones, and joints in metamorphic and volcanic rocks [7,8]. Groundwater in some of the metamorphic aquifers is associated with high salinity and to some extent F contamination [21]. Contact zones between metamorphic and volcanic rocks in the area give rise to Simba, Kiboko, Makindu, and Umami Springs, some of which supply domestic piped water in Makindu and Kibwezi areas. In addition to groundwater, several shallow and unconfined sand and alluvium dams are used for agricultural purposes and sometimes for potable water [21]. The major surface water source in the county, the River Athi, is perennial and passes in the north-west to the south-east part where agriculture is mainly practised along its course. Heavy metal and pesticide residue pollutants along the River Athi linked to agriculture, industrial activities, and urbanisation has been reported [22] especially in urban areas such as Nairobi.

2.3. Sampling and Analysis

The water samples were collected in the central and southern parts of the county in the area around Makindu and Kibwezi as highlighted in Figure 1. The sampling area was approximately 2500 km2. Twenty water samples including 13 boreholes, four shallow hand-pumped wells, two springs, and one tap water sample were collected in December 2018. Apart from the Umami spring, all water sources were directly used for domestic and agricultural purposes. The spring sample was collected before the water passes through a filtration system prior to piping for further use. The water sampling points were distributed across the area mostly in locations in proximity to villages and/or schools, where the local community have direct access. The distribution of settlement in the area is uneven and since the water sources were located close to settlements, the sampling coverage followed the same pattern. The western part is a protected area and therefore could not be sampled, while water sources in the southern region are mainly shallow wells, which were dry during the sampling period (December). For purging purposes, the water taps associated with the springs and domestic supply were left to run for approximately 3 min to remove stagnant water in the pipe system. Most of the boreholes in the region are community owned and drilling details were not available.
Sampling and handling followed the procedures outlined by the United States Environmental Protection Agency (US EPA) [23]. Each sample was collected in 1 L polyethylene bottles in duplicate, with one destined for the major elements and physical parameters analysis and the other was acidified with NHO3 for trace element analysis. Sample bottles were rinsed twice with the sample water before filling and were then tightly closed, labelled, and stored in a cooler box with ice. The samples for trace element analysis were filtered in the field using syringes with 0.45 µm pore size filters, while those for major elements and physical parameters were not filtered to enable colour and turbidity testing in the lab. The samples were then transported to the ISO certified Kenya Water Resources Management (WARMA) central testing laboratory in Nairobi within 24 h for physical parameter and major element analysis. Samples for trace element analysis were acidified with concentrated (1 M) NHO3 to attain a pH of less than 2 and stored at 4 °C until transported to the University of Johannesburg for analysis. Samples for major elements and physical parameters were immediately analysed upon arrival at the laboratory.
Total hardness (TH) was determined by volumetric titration using disodium ethylene-diamine-tetra-acetic acid (ETDA). Colour, turbidity, pH, electrical conductivity (EC), and total dissolved solids (TDS) were measured using standard meters. Alkalinity was determined by titration method using 0.02 H2SO4 [24]. Chloride (Cl) was determined by volumetric titration using AgNO3 and K2CrO4, sulphate (SO42−) by turbidimetric method, nitrate (NO3) by ion electrode while nitrite (NO2) and F were determined using photometric methods. Bicarbonate (HCO3) was calculated from alkalinity using APHA method 2330B [24]. Salinity was calculated from EC using the relationship; 1 dS/m (EC) = 700 mg/L (salinity) [25]. Sodium (Na) and potassium (K) were determined by flame photometry, while calcium (Ca), magnesium (Mg), iron (Fe), and manganese (Mn) by volumetric titration. Thirteen potential harmful trace elements (PHTE) including chromium (Cr), cobalt (Co), nickel (Ni), copper (Cu), zinc (Zn), arsenic (As), cadmium (Cd), lead (Pb), and selenium (Se) were analysed at the University of Johannesburg Faculty of Science Spectrum Laboratory using the inductively induced coupled plasma-mass spectrometry (ICP-MS) following the US-EPA method 200.8 [26]. Calibration standards used were analytical grade and were run before and after every sample batch for instrumental drift correction. A standard reference material SRM 1640a was used for validating the accuracy of the method. The standard reference material (SRM 1640a) consists of acidified spring water comprising of mass fractions and concentrations of 29 elements. Ion balance error was calculated, and the average value was 2.68%.

2.4. Data Analysis

Drinking Water Quality: The geochemical results of the analysed water samples were compared to the recommended guidelines set by the WHO [27] and the Kenya Bureau of Standards (KS 459-1:2007) KEBS [28] for drinking water.
Spatial Analysis: The study area base map was adopted from Ng’ang’a [17] and digitized using ArcGIS 10.5 software, while sample location (latitudes, longitudes, and elevation) data were recorded in the field using a Garmin (eTrex 10) GPS and later imported into the GIS software. The geostatistical spatial interpolation, inverse distance weighted method, was used to generate spatial maps showing the concentrations of physico-chemical parameters in groundwater according to the recommended limits for drinking water.
Hydro-Chemical Facies and Characteristics: The Piper [29] trilinear diagram was used to classify groundwater according to its ionic concentration and determine the hydro-chemical facies. The GW_Chart software was used to generate the Piper plot. The major geochemical processes governing groundwater geochemistry were assessed using Gibbs [30] diagrams. To determine the source of major elements in groundwater in the area, cross-plots, which determine the strength of correlation (r2) between TDS and the major ions [31] were used.
Statistical Analysis: Several statistical tests were used to determine the correlation between the physico-chemical parameters in the analysed water. A normality assumption test was first conducted using the Shapiro–Wilk test [32] in order to determine the type of correlation analysis to be used. Normally distributed data is usually analysed using Pearson’s correlation analysis, while data with non-normal distribution is analysed using Spearman’s correlation [32]. Principal component analysis (PCA) and Spearman’s ranked order correlation were used to group parameters with similar behaviour in the water samples and determine how they correlate with each other. The PCA analysis was used to reduce variables in the dataset and highlight the variables that best explain the variance [33]. Factor score analysis was then used to group the variables (physico-chemical parameters) observed in PCA with similar characteristics [33]. Spearman’s correlation was used to determine the strength and direction of correlation among variables. Microsoft Excel 365 and IBM SPSS statistics 25 were used for statistical analysis while CorelDRAW X7 was used for graphical processing.
Groundwater Quality for Irrigation Purposes: Sodium absorption ratio (SAR), sodium percentage (Na%), magnesium hazard (MH), and EC were used to estimate the potential hazard of sodicity and alkalinity in the water and indicate the suitability of the water sources for irrigation [5]. The SAR was calculated using Equation (1) [34], the %Na was calculated using Equation (2) [35], and MH using Equation (3) [36]:
SAR = ( Na + )   ( Ca 2 + + Mg 2 + ) / 2
% Na = Na 2 + Ca 2 + + Mg 2 + + Na 2 + + K + × 100
MH = Mg 2 + Ca 2 +   + Mg 2 + ×   100

3. Results

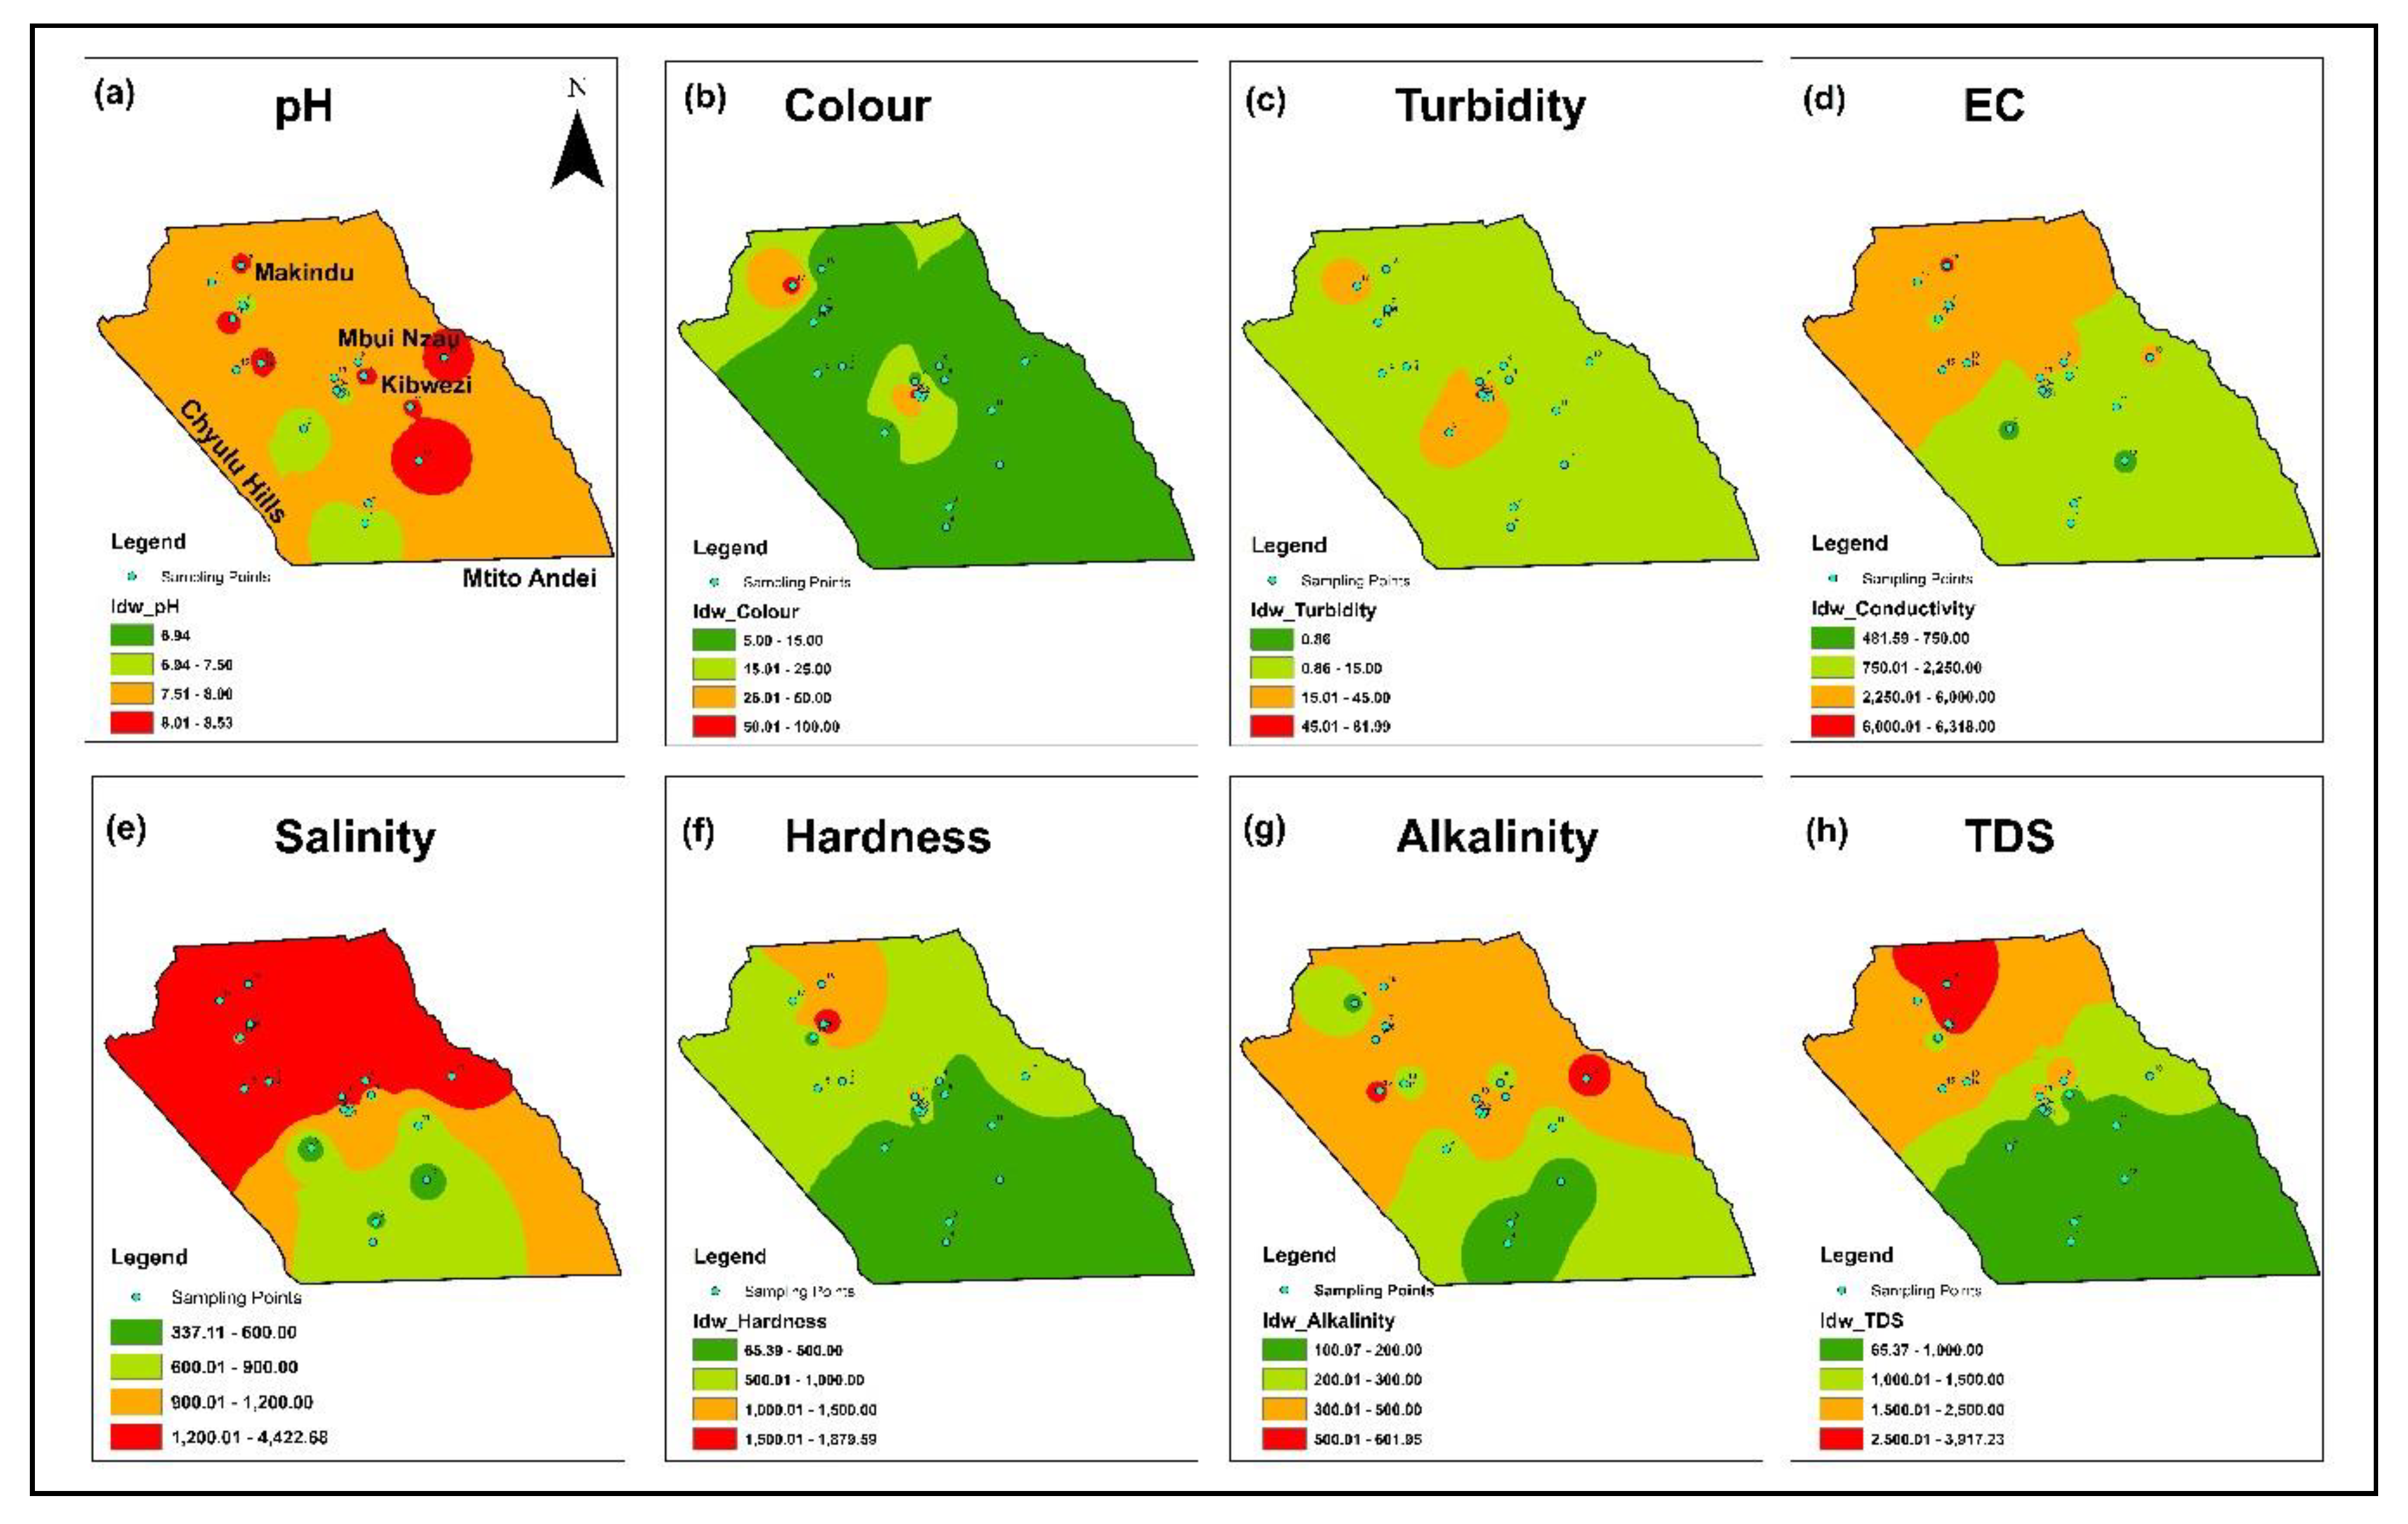
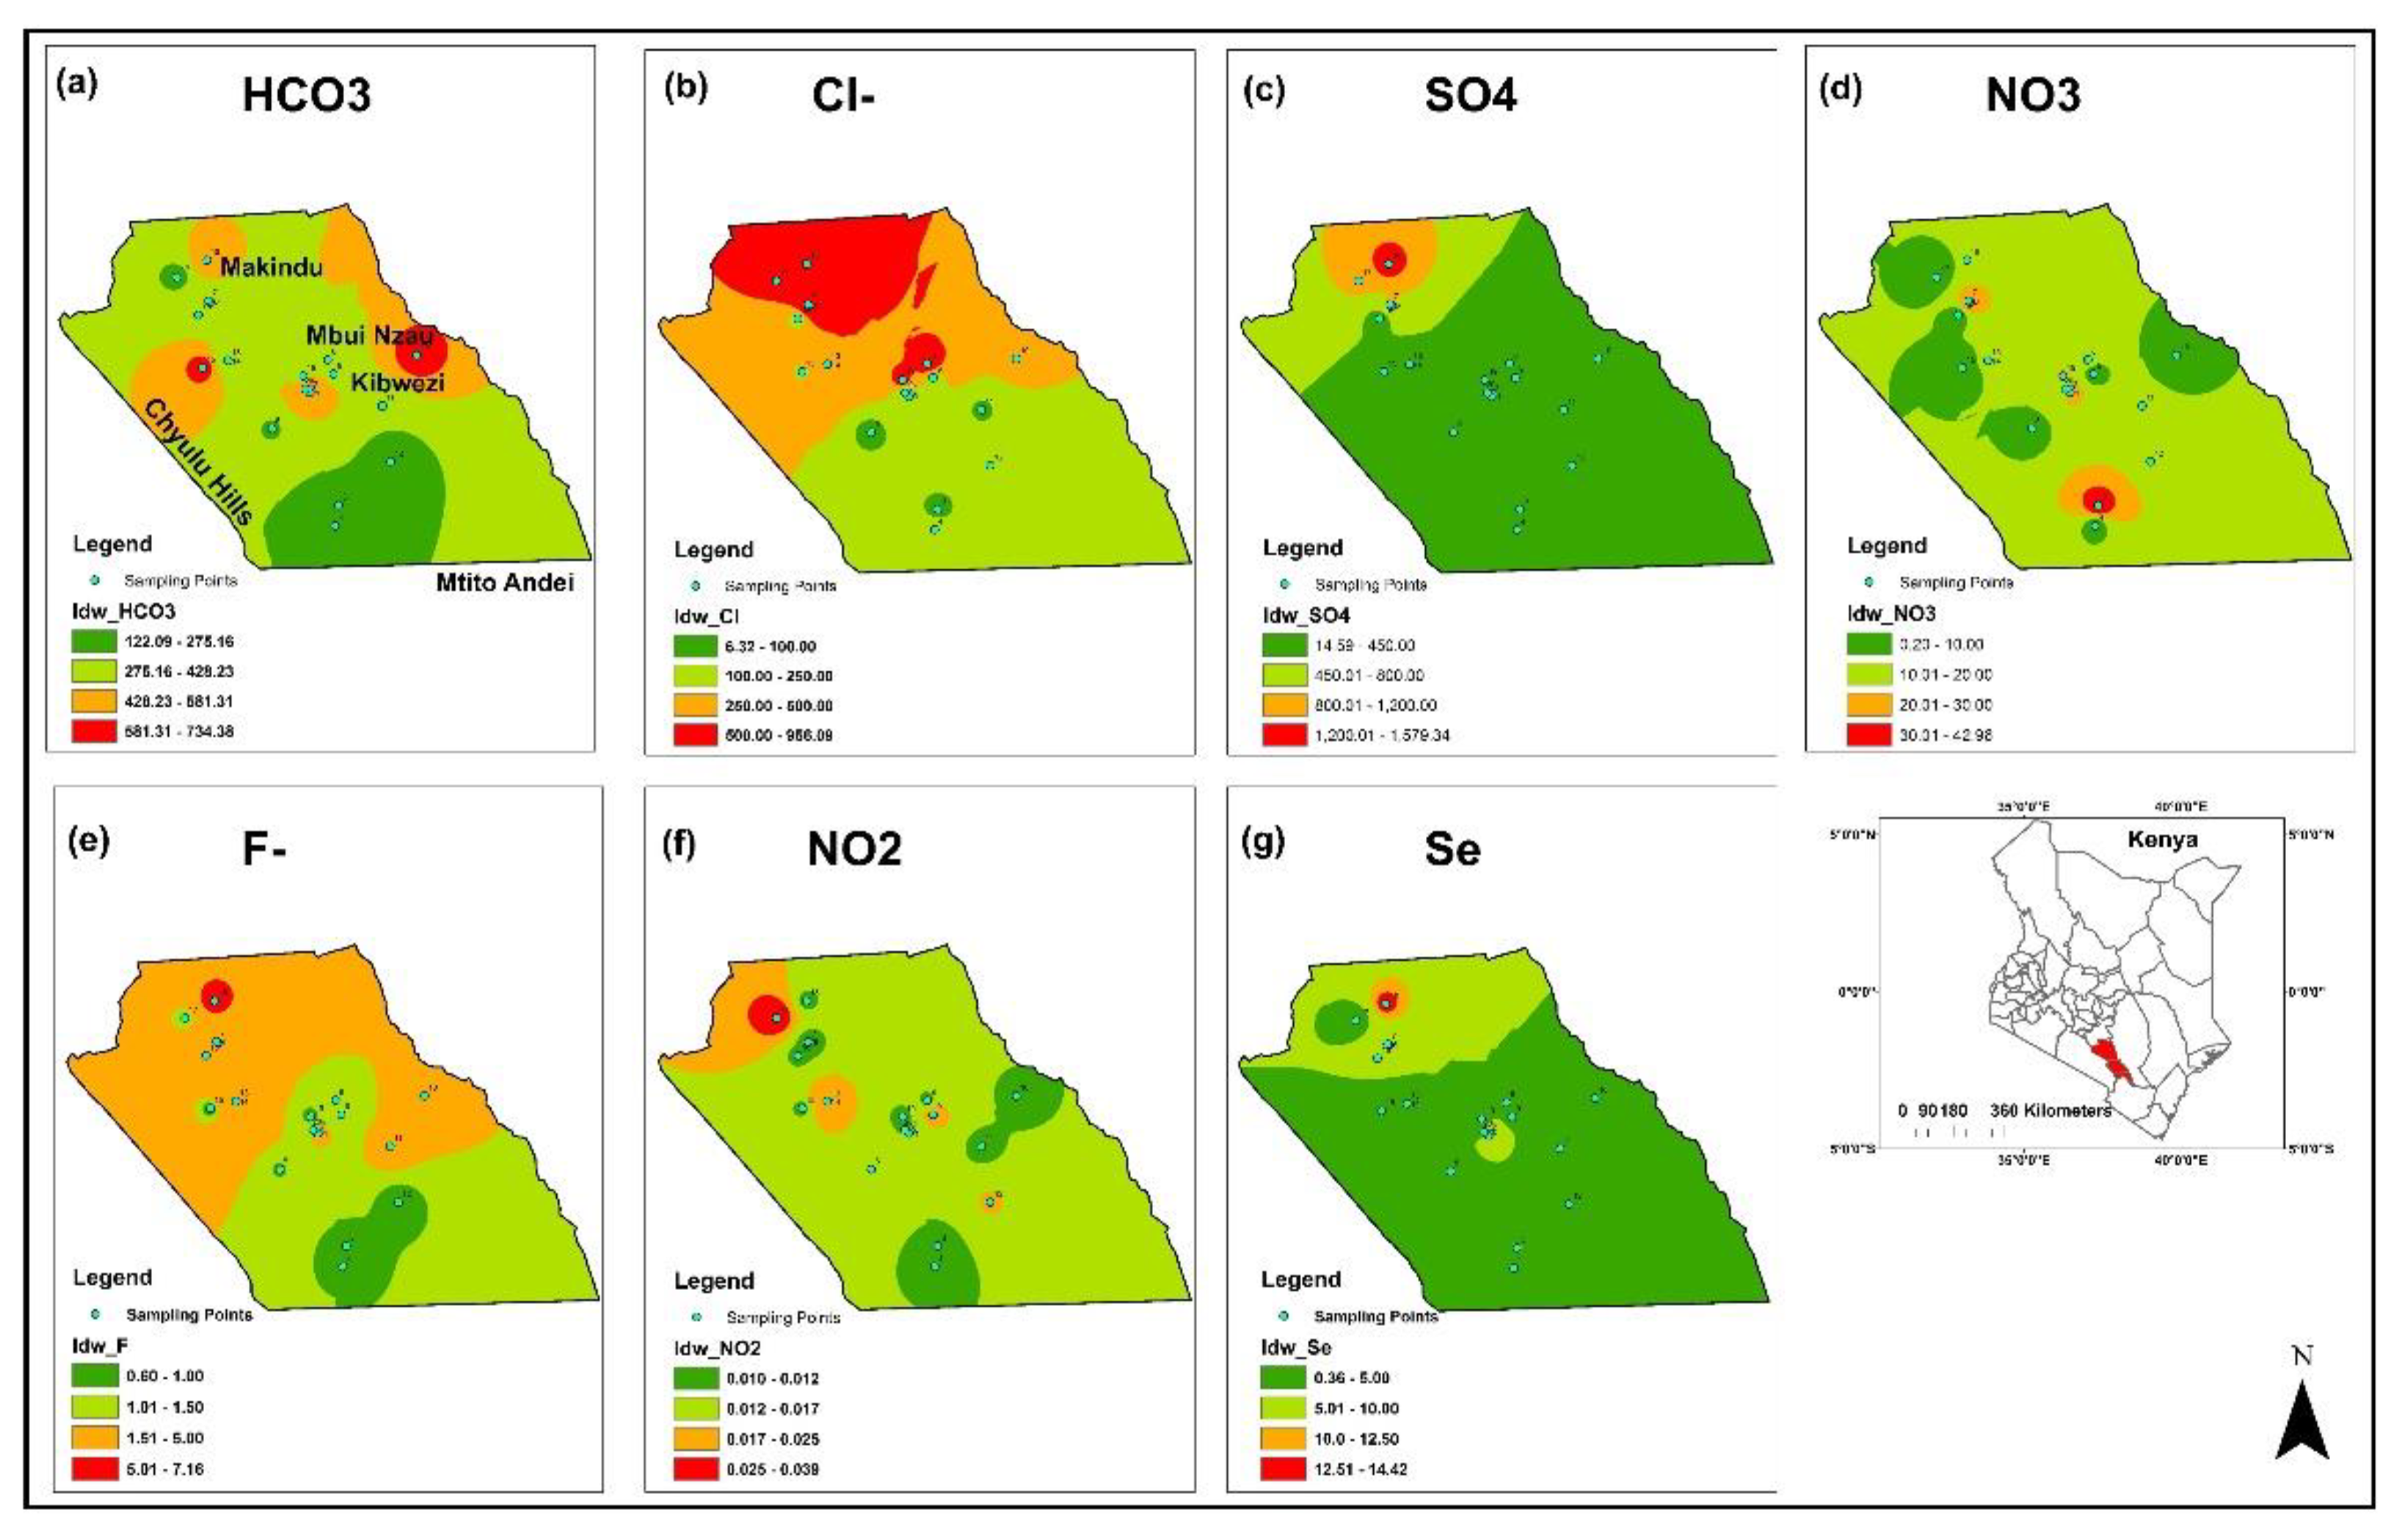
3.1. Physico-Chemical Characteristics of the Water and Spatial Distribution

Descriptive statistics of the physico-chemical parameters of the analysed water samples were compared to the drinking water recommended standards set by WHO [27] and KEBS [28] and are presented in Table 1. The recommended limits of HCO3, salinity, and free CO2 are not determined by the WHO and KEBS, while KEBS does not have standards for conductivity, alkalinity, K, Co, and Ni. Spatial distribution maps of the individual parameters were also generated showing areas with values below and above the recommended limits set for drinking water (Figure 2, Figure 3 and Figure 4).
The parameters analysed include:
pH: The water samples were slightly alkaline with a pH range of 6.94 to 8.53, mean of 7.78, and a standard deviation of 0.46 (Table 1). One sample located in the southern region had slightly higher pH (8.53) than the recommended limit set by both the WHO and KEBS while the rest were within the recommended range of 6.5 to 8.5. The spatial distribution map of pH shows the entire region having permissible drinking water pH except for the southern area where the higher pH value was recorded (Figure 2a).
Water Colour and Turbidity: Colour ranged from 5 to 100 mgPt/L with a mean of 13 mgPt/L and standard deviation of 23, where 10% (n = 2) of the samples exceeded both the WHO and KEBS recommended values. The spatial distribution map (Figure 2b) shows that most areas record drinking water within the recommended colour values besides two water sources in the central and north-west parts. Turbidity varied from 0.85 to 84 N.T.U with a mean of 9.04 N.T.U and a standard deviation of 18 with 25% (n = 5) of sample exceeding the WHO and KEBS recommended value. A similar trend between the turbidity (Figure 2c) and water colour spatial distribution maps is observed.
Electrical Conductivity and Salinity: Conductivity ranged from 480 to 6320 μS/cm with a mean of 2321 μS/cm and standard deviation of 1618, where 35% (n = 7) of the samples exceeded the WHO limit. The spatial distribution map of EC shows water sources within the permissible drinking water values in the southern region while the northern region registers higher values (Figure 2d). Conductivity is a measure of the water’s ability to conduct electrical current due to dissolved salts and therefore a good indicator of salinity [5]. Salinity concentrations ranged from 336 to 4424 mg/L with an average of 1624 mg/L (Table 1). The spatial distribution map (Figure 2e) shows most parts of the south region with good to fair salinity values while the northern region has unacceptably high values, according to the classification by Handa [37].
Water Hardness and Alkalinity: Hardness ranged from 64 to 1880 mg/L (mgCaCO3/L) with a mean of 651 mg/L and standard deviation of 547, where 50% (n = 10) and 60% (n = 12) of the samples exceeded the WHO and KEBS recommended limits of 500 and 300 mg/L, respectively. The spatial distribution map shows that water sources in the southern region fall within the recommended limit while those in the northern region exceed the limits (Figure 2f). Alkalinity ranged from 100 to 602 mg/L (mgCaCO3/L) with a mean value of 310 mg/L and standard deviation of 144, where 20% (n = 4) of the samples exceeded the WHO recommended limit. In addition to small areas in the eastern and western regions, the spatial distribution map shows that most of the water sources are within acceptable limits of alkalinity (Figure 2g).
TDS: Values ranged from 64 to 3918 mg/L with a mean of 1412 mg/L and standard deviation of 1034, where 35% (n = 7) and 55% (n = 11) samples exceeded the WHO and KEBS maximum recommended limits of 1500 and 1000 mg/L, respectively. The spatial distribution map shows drinking water sources in the southern region with values below the recommended limits while the central and northern regions with values above the recommended limits (Figure 2h).
Major Cations: The concentrations of major cations based on relative proportions increased in the order: Na > Ca > Mg > K > Mn > Fe. Sodium concentrations ranged from 20 to 980 mg/L with a mean of 221 mg/L and standard deviation of 222, where 25% (n = 5) of the samples exceeded both the WHO and KEBS recommended values. Water sources in the southern region are within the recommended values, while the northern region has concentrations exceeding the limits (Figure 3a). The concentrations of Ca ranged from 8 to 432 mg/L with a mean of 136 mg/L and standard deviation of 138, where 40% (n = 8) and 25% (n = 5) of the samples exceeded the recommended limits by WHO and KEBS of 100 and 150 mg/L, respectively. Water sources exceeding the limits are in the central and northern region (Figure 3b).
Magnesium values ranged from 7.77 to 199 mg/L with a mean of 75 mg/L and standard deviation of 75, where 30% (n = 6) of the samples exceeded both the WHO and KEBS recommended limits. Water sources exceeding the limits are observed in the northern region and a small area in the east (Figure 3c). Potassium ranged from 1.7 to 65 mg/L, with a mean of 20 mg/L and standard deviation of 14, with one sample (5%) located in the eastern region exceeded the WHO recommended limit (Figure 3d). Manganese ranged from 0.01 to 0.18 mg/L with a mean value of 0.04 mg/L and standard deviation of 0.06, where 15% (n = 3) of the samples exceeded the WHO recommended limit but none was above the KEBS’s limit. Water sources with Mn concentrations exceeding the WHO limits were located in the eastern, western, and southwestern parts (Figure 3e). In the case of Fe, its concentrations ranged from 0.03 to 1.27 mg/L with a mean value of 0.17 mg/L and standard deviation of 0.28, where 10% (n = 2) of samples exceeded the WHO and KEBS recommended limits. Most water sources show Fe values within the recommended limits in drinking water except one borehole in the north-western part and a tap water in the central part (Figure 3f) which show slightly higher values.
Anions: The concentrations of anions based on relative proportions increased in the order: HCO3 > Cl > SO42− > NO3 > F > NO2 (Table 1). Bicarbonate was the most dominant ranging from 122 to 734 mg/L, with a mean of 378 mg/L and standard deviation of 175. The recommended limits for HCO3 are not reported. The spatial distribution of HCO3 in the area shows most water sources with concentrations less than 430 mg/L although this is spatially variable (Figure 4a). Chloride values ranged from 6 to 960 mg/L with a mean of 347 mg/L and standard deviation of 320, where 45% (n = 9) of the samples exceeded the recommended limits by both the WHO and KEBS. Water sources in the northern region show values above the recommended Cl limits (Figure 4b). The values of SO42− ranged from 14 to 1580 mg/L with a mean of 296 mg/L and standard deviation of 404, where 20% (n = 4) of the sample exceeded both the WHO and KEBS recommended limits. Most of the water sources in the area are within the recommended limits except in the extreme northern region where elevated values are observed (Figure 4c).
Nitrate had a range of 0.2 to 43 mg/L with a mean of 13 mg/L and standard deviation of 12, with 50% (n = 10) of the samples exceeding the WHO recommended limit. Water sources exceeding the recommended limits were found in the northern, central, and southern region (Figure 4d). The concentrations of F ranged from 0.6 to 7.17 mg/L with a mean of 1.86 mg/L and standard deviation of 1.59, where 50% (n = 10) of the samples exceeded the WHO and KEBS recommended limits. Water sources in the southern region are within the recommended F values while sources in the northern region exceeded the limits (Figure 4e). Nitrite results ranged from 0.01 to 0.04 mg/L with the mean and standard deviation values of 0.01. These values were all below the recommended guidelines by WHO but above those of KEBS, where the elevated values are observed in the north-western region (Figure 4f).
Potentially Harmful Trace Elements (PHTE): The concentrations of selected PHTE based on relative proportions increased in the order: Zn > Se > Cu > Ni > As > Cr > Co > Cd > Pb. In addition to Se, the concentrations of all PHTE analysed were below the WHO and KEBS recommended limit for drinking water (Table 1). Selenium values ranged from 0.36 to 14 μg/L with a mean of 4.41 μg/L and standard deviation of 3.88, with 10% (n = 2) of the water sources exceeding the WHO and KEBS recommended limits. Elevated Se values are observed in the extreme northern part (Figure 4g).

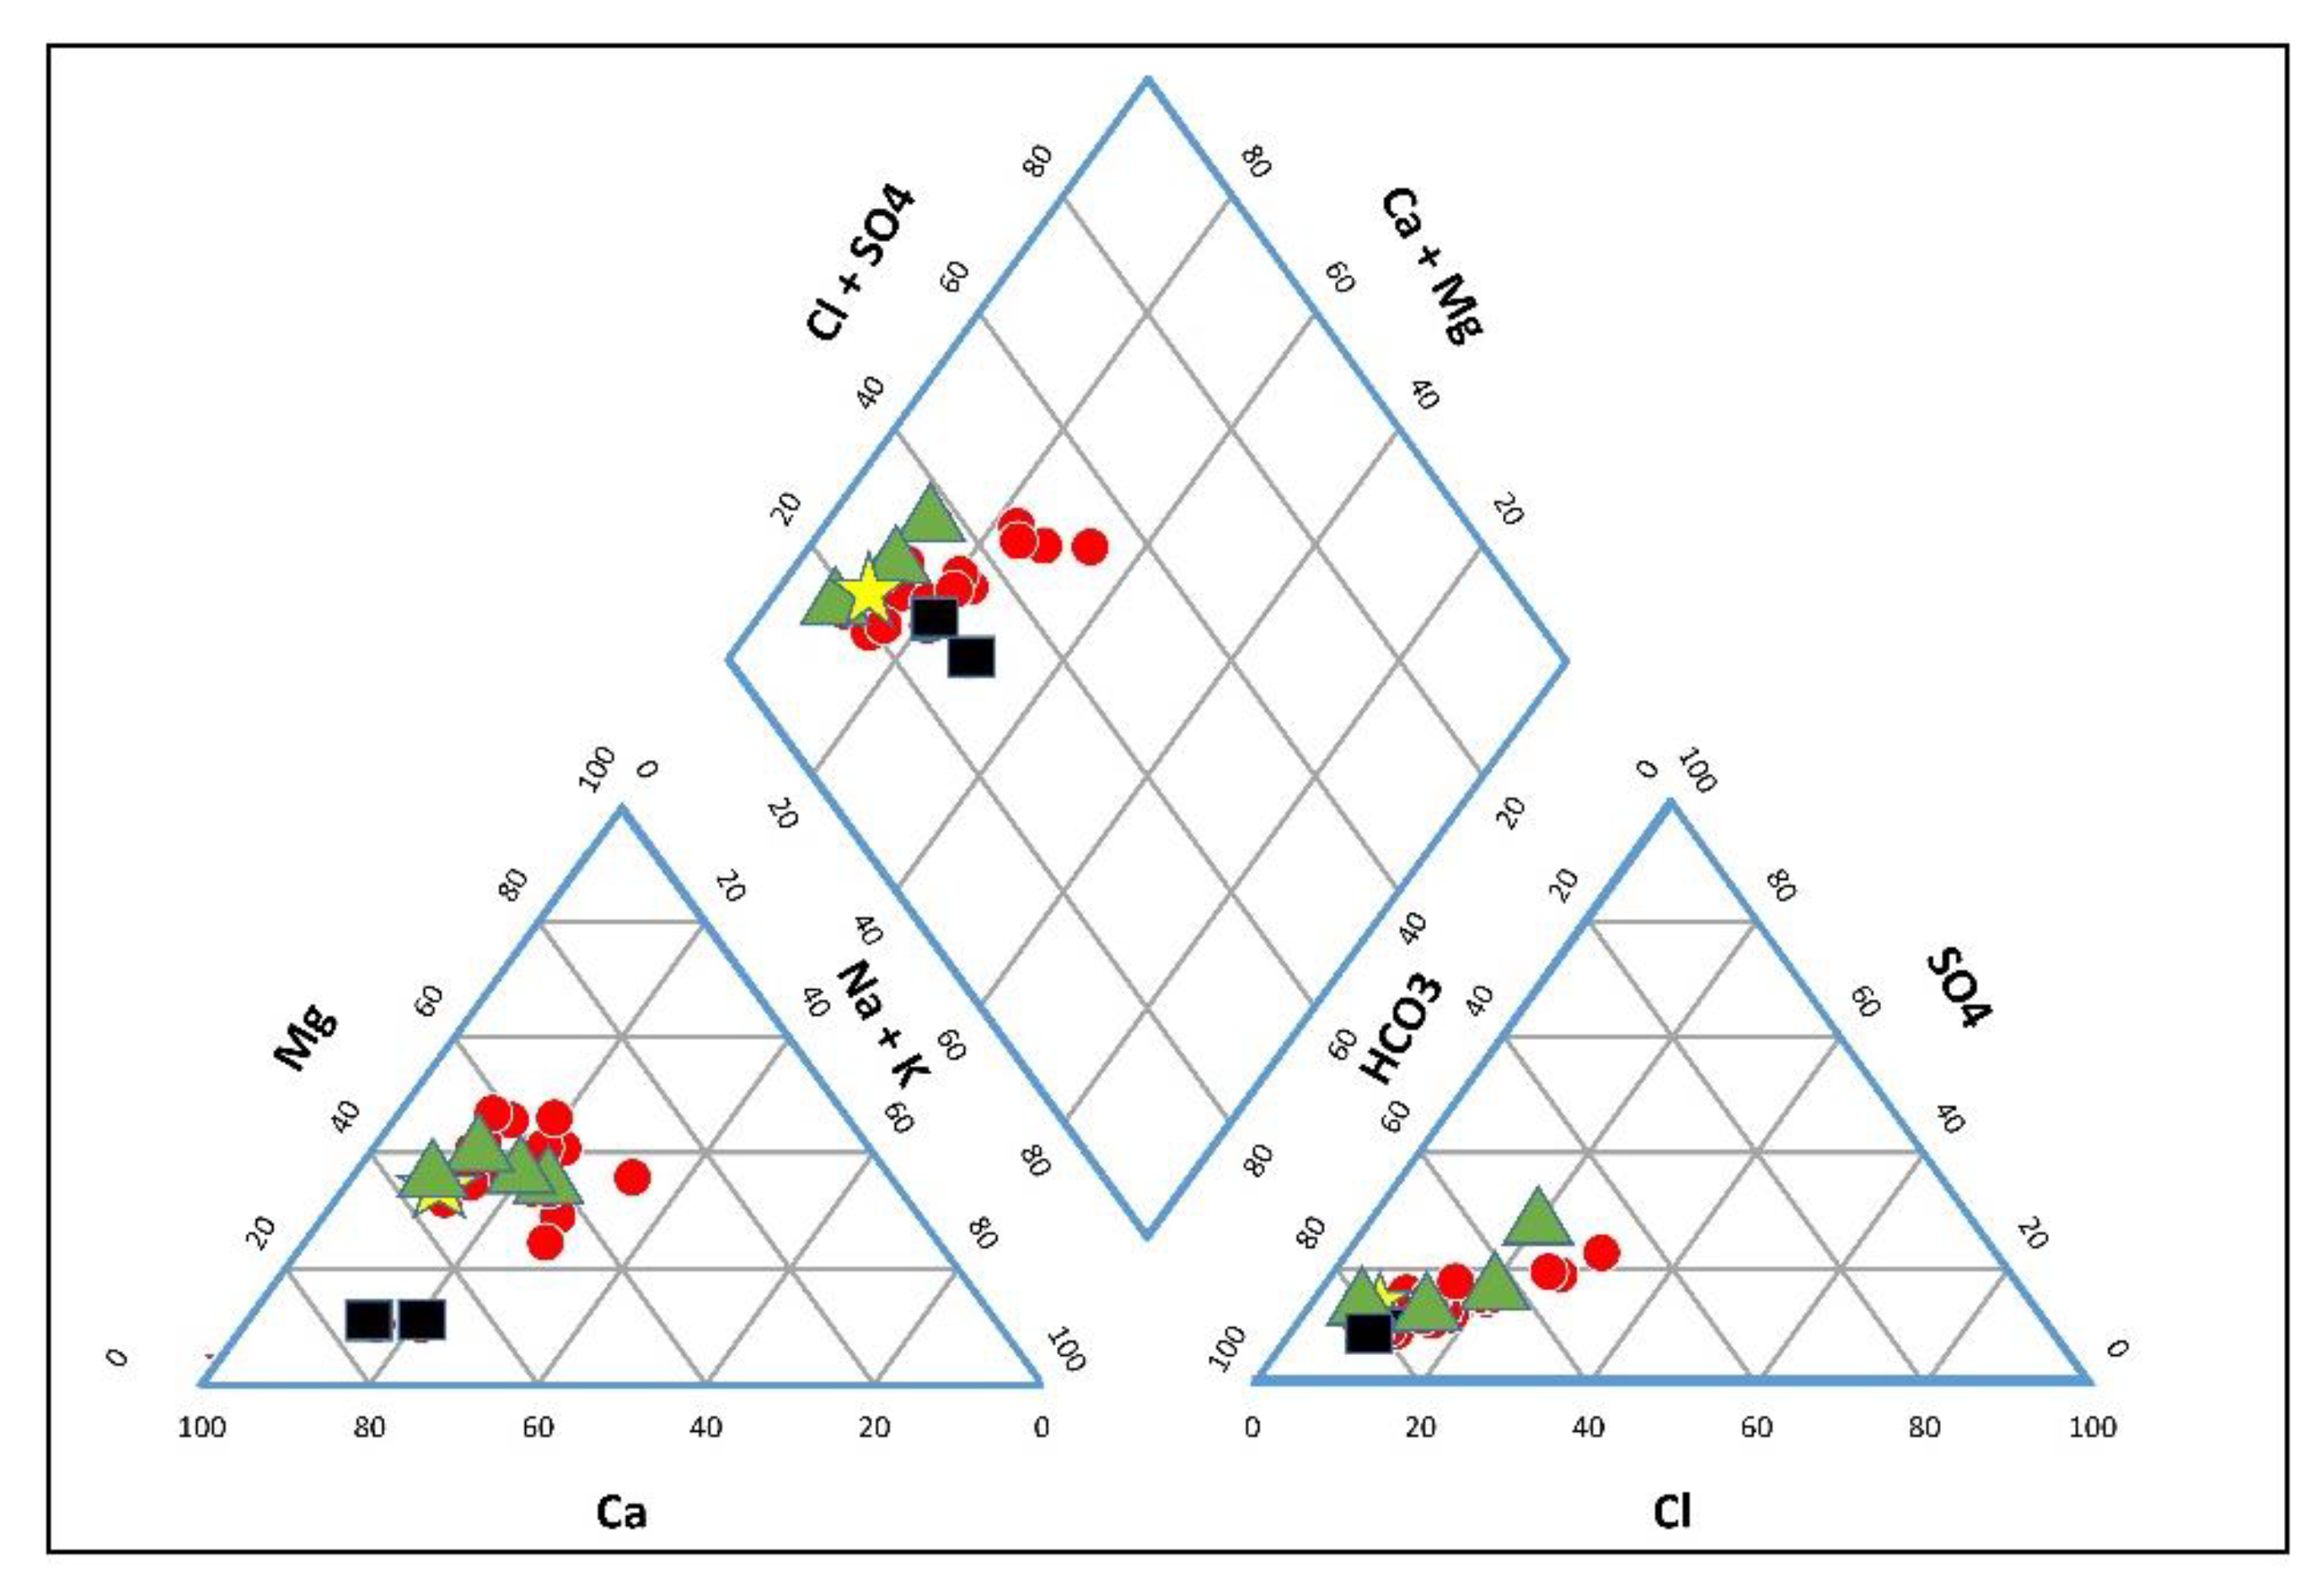
3.2. Hydro-Chemical Characteristics

The major ionic concentrations of groundwater, shallow wells, spring, and tap in the area were plotted on the Piper’s diagram and the results are shown in Figure 5. From the plot, alkaline earth constituents (Ca + Mg) exceed the alkalis (Na + K) in all the samples, while weak acids (HCO3) exceed the strong acids (SO42− + Cl). The groundwater in the area is predominantly Ca-Mg-HCO3 water type with a small number of samples falling slightly in the Ca-Mg-Cl-SO4 type. The slight Ca-Mg-Cl-SO4 water type is observed in one shallow well and three boreholes.

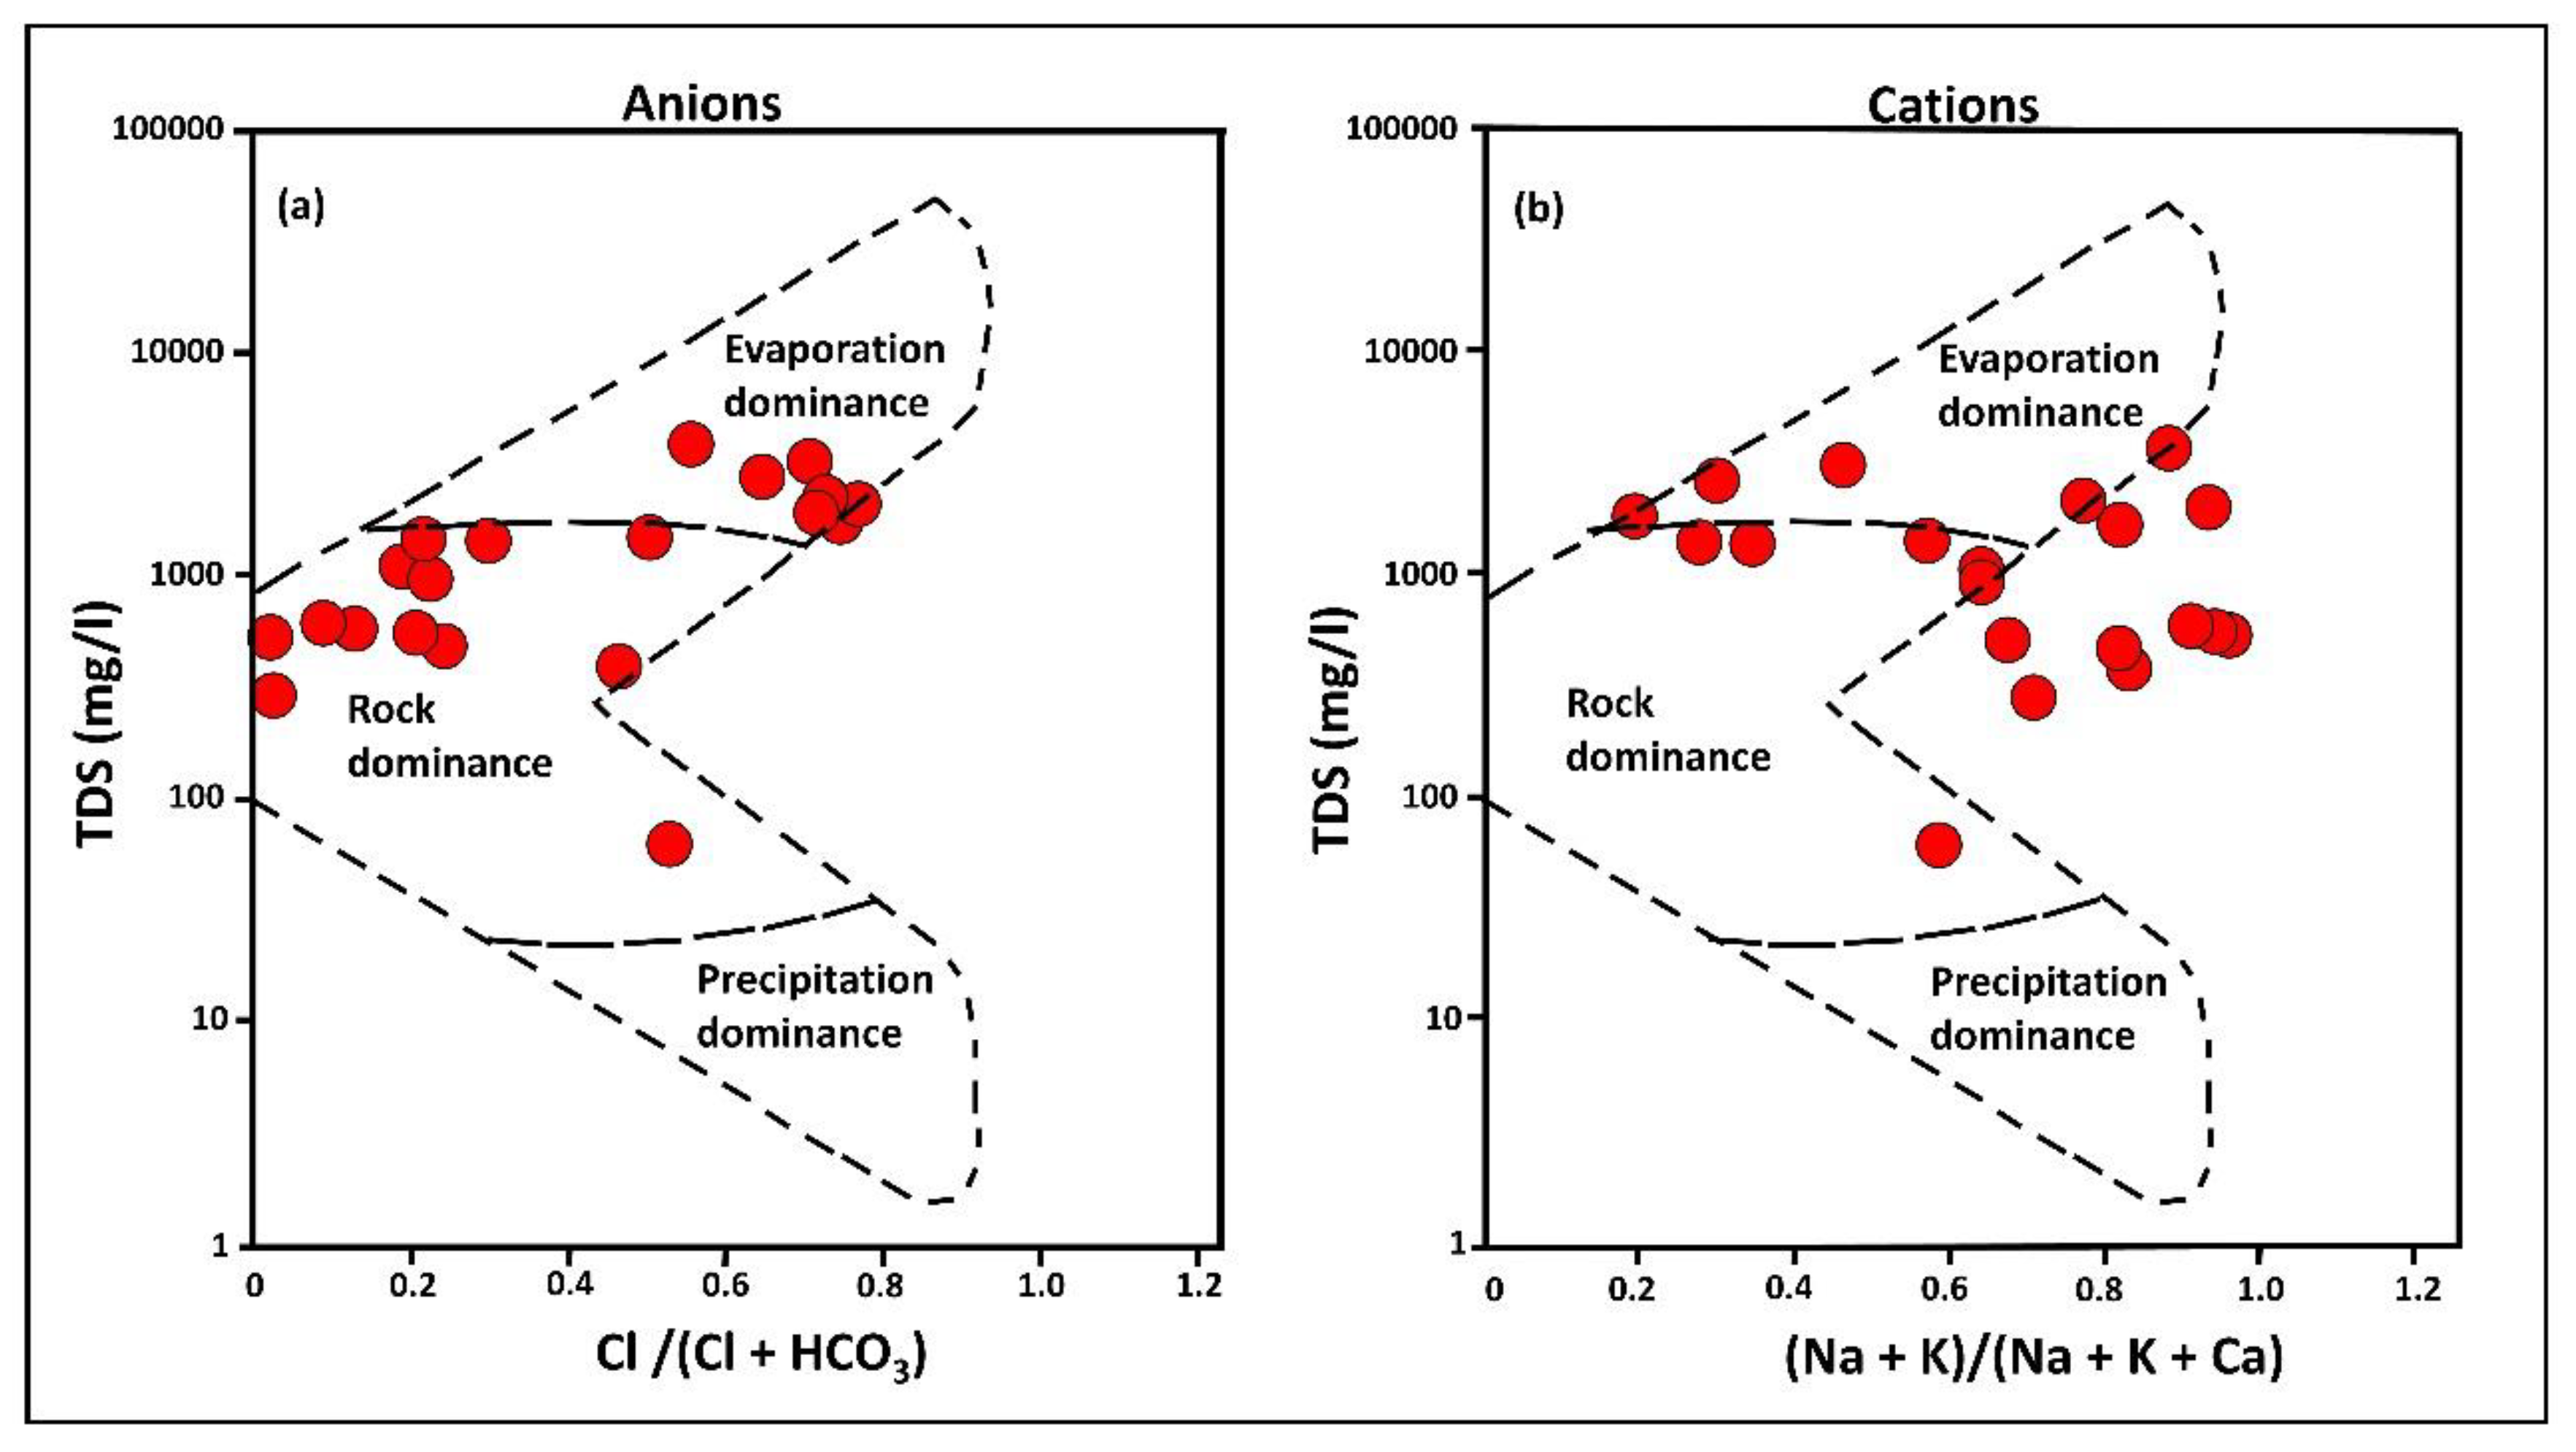
3.3. Geochemical Processes Controlling Groundwater Quality

A Gibbs [30] plot was used to investigate the major mechanisms governing groundwater chemistry, as well as the sources of chemical parameters observed in the water. The diagram shows three distinctive mechanisms (rock, evaporation, and precipitation dominance) that control groundwater chemistry in most natural waters [30]. In the Makueni County, most (n = 13) samples, plot in the rock dominance zone with a slight inclination towards evaporation dominance in both cations and anions diagrams as shown in Figure 6.
Cross plots were then used to further determine the possible sources of ions in groundwater in the area by plotting the correlation of major ions (Ca, Mg, Na, Cl, and SO42−) against TDS as shown in Figure 7. There was a significant weak positive correlation (r2 = 0.43, p < 0.01) between Ca and TDS, while Mg, Na, Cl, and SO42− show a significant moderate to strong positive correlation (with r2 values between 0.54 and 0.81 and p < 0.01) with TDS.

3.4. Normality of Data, Principal Component, and Spearman’s Correlation Analysis

3.4.1. Normality of Data

The results of the normality test (Table 2) show seven parameters (pH, Mg, alkalinity, free CO2, TDS, HCO3, and Co) with p values > 0.05, while the other 22 parameters had p-values < 0.05. This shows that most of the data have a non-normal distribution, therefore, Spearman’s correlation analysis may be used to determine the correlation of the data [32]. The water data was then analysed using PCA and Spearman’s ranked order correlation to determine the dominant parameters in groundwater and the strength of their correlations.

3.4.2. Principal Component Analysis

The 29 physico-chemical parameters (components) were reduced into three principal components (PC1 to PC3) with Eigenvalues >1 and a cumulative variance of 54.37%, accounting for more than half of the total variance. Therefore, these three components are substantial and can be used to investigate the study samples association [33]. The loading matrix in Table 3 shows that PC1 accounted for 28.02% of the total variance and is dominated by TDS, conductivity, Mg, SO42−, total hardness, Cl, Na, and Ca with factor loading values (in bold) greater than 0.60. The second component (PC2) accounted for 14.95% of the variance and was dominated by Mn, Pb, Zn, alkalinity, HCO3, and free CO2 which have factor loadings (in bold) greater than 0.68. PC1 and PC2 indicate the major physico-chemical variables which influence the geochemical processes occurring in the area. The third component (PC3) accounted for 11.4% of the variance and was dominated by Fe, colour and turbidity with factor loadings greater than 0.87.
A bi-plot showing factor loading values of the physico-chemical parameters in PC1 (horizontal axis) and PC2 (vertical axis) is shown in Figure 8. From the plot, the first and second quadrants show the dominant parameters observed in PC1 while the third and fourth quadrants show the dominant parameters in PC2. The clusters formed by the parameters also indicate their strength of correlations. For example, the dominant parameters, Ca, Mg, Cl, SO42− are observed in a close cluster in the far-right end of Figure 8 together with the physical parameters they influence (water hardness, conductivity, and TDS). Similarly, water colour, Fe, and turbidity, which highly influence each other, appear in the same cluster in the left side of the plot.

3.4.3. Spearman’s Correlation

The Spearman’s correlation matrix for the dominant parameters in PC1, PC2, and PC3 is shown in Table 4. The results show a strong to very strong positive monotonic correlation (r = 0.67–0.95, p = 0.01) between the dominant variables in PC1. There was a weak to strong positive correlation (r = 0.16–0.51, p = 0.05) among the dominant parameters in PC2 and PC3 (r = 0.16–0.69, p = 0.01). It is worth noting that, most of the PC1 variables had a medium to weak negative correlation (r = < –0.44, p = 0.05) with variables in PC3, which was similarly observed in the bi-plots in Figure 8.

3.5. Evaluation of Groundwater for Agriculture

Due to the unreliable rainfall in the semi-arid Makueni County, groundwater and rivers are highly relied upon for agriculture [7,8], which warrants an assessment of the suitability of the ground and surface water for agricultural purposes. Accumulation of salts in farm soils from irrigation water may change the soil structure and thus affecting its quality for irrigation purposes [5,38]. Metrics including sodium absorption ratio (SAR) [34], percentage sodium (Na%) [35], magnesium hazard (MH), and electrical conductivity (EC) are used to evaluate the suitability of the water sources for irrigation [5,39].
Sodium Absorption Ration (SAR): SAR is used to estimate the Na hazard (sodicity) in soil with comparison to Mg and Ca concentrations [5,39,40]. The SAR values ranged from 3.15 to 80.5 with a mean of 27.1. The SAR values < 10 are considered excellent, 11–18 good, 19–26 doubtful, and > 26 unsuitable for agriculture [34]. Using this classification, 50% (n = 10) of the water samples were in the good to excellent category while the other half were doubtful to unsuitable (Table 5).
Sodium Percentage (Na%): The percentage ratio of Na (Na%) with other major cations in water is used to determine its hazard in irrigation water [5]. The Na % values can be categorised as excellent (<20%), good (20%–40%), permissible (40%–60%), doubtful (60%–80%) and unsuitable (>80%) [35]. The Na% in the water samples ranged from 9.38% to 88% with a mean of 48. Table 5 shows that 40% (n = 8) of the samples had good to excellent Na%, 20% (n = 4) had permissible values, while 40% (n = 8) were doubtful to unsuitable for irrigation.
Magnesium Hazard (MH): MH is used to indicate the potential effect of Mg on irrigation water, and values below 50 meq/L indicate that the water is safe for irrigation use while values above 50 meq/L indicate the unsuitability of the water [36,41]. The MH in the water samples ranged from 26.52 to 81.49 meq/L with a mean of 52.92. Only 40% (n = 8) of the water samples had MH values below 50 meq/L, and therefore had safe levels of Mg for irrigation water.
Electrical Conductivity (EC): EC indicates the amount of dissolved salts in water, where high levels can induce salinity hazard in irrigation water based on the salts present [5,39]. The EC values for irrigation water were categorized by Wilcox (1995) as follows; low (<250 µS/cm), medium (250–750 µS/cm), high (750–2250 µS/cm), and very high (>2250 µS/cm). The EC in the current study water samples ranged from 480 to 6320 µS/cm with a mean of 2321 µS/cm (Table 3). As shown in Table 5, 50% (n = 10) of the samples had medium to high EC while 50% had very high values.
The EC values were then plotted against Na% values on the Wilcox classification scheme diagram [35] to determine the suitability of the water in the area for agriculture (Figure 9a). The results show that 15% (n = 3) of the samples categorise under excellent to good, 15% (n = 3) under good to permissible, 15% (n = 3) under permissible to doubtful, 20% (n = 5) under doubtful to unsuitable, and 30% (n = 6) under unsuitable quality for agriculture.
The US salinity laboratory staff [34] diagram was further used to plot SAR against EC to show the ratio of Na to salinity hazard for irrigation water quality assessment (Figure 9b). The diagram categorises Na hazard (SAR) and salinity hazard (EC) into different categories as follows; low (C1), medium (C2), high (C3), very high (C4), and (C5) very very high salinity hazard, and low (S1), medium (S2), high (S3), and very high (S4) Na hazard [5,34]. Water with SAR and EC values within C1 and C2, as well as S1 and S2 levels, are suitable for irrigation, whereas, those under C3, C4, S3, and S4 require treatment prior to being used for irrigation [5,34]. The results of the water analysis for irrigation suitability show that only 10% (n = 2) of the samples have low to medium salinity hazard while 30% (n = 6) had low to medium Na hazard (Figure 9b).

4. Discussion

The physico-chemical characteristics of the analysed water sources observed are controlled by the local geology of Makueni County. Among the dominant cations, the high concentrations of Na, Ca, Mg, K, and Fe observed in the water could be attributed to the weathering of rocks such as biotite-gneisses, migmatites, granitoid gneisses, and basaltic rocks, which are rich in feldspars, biotite, muscovite, hornblende, and pyroxenes [13]. For anions, high Cl and SO42− in the water may be derived from weathering of biotite and apatite in gneisses and schists in the area [7,13]. High F may be associated with the dissolution of fluorapatite, hornblende, and biotite, which are common in biotite-gneisses and basalts in the area [7,13]. Volcanic rocks in Makueni County are analogous to those of the Rift Valley, which is a known high fluoride belt [42]. The source of NO3 and NO2 in groundwater is usually attributed to anthropogenic activities such as agriculture, the introduction of domestic waste such as animal manure and contributions from septic systems [43]. The elevated NO3 levels in Makueni County may be associated with farming especially of nitrogen-fixing crops such as beans (Phaseolus vulgaris), green grams (Vigna radiata), and pigeon peas (Cajanus cajan), which are commonly grown in the area [44].
A spatial correlation between the dominantly granitoid gneisses in the southern region, which are more resistant to weathering than other rock types (such as biotite gneisses, migmatites, and basalts) in the area, and the low concentrations of most of the parameters is observed. Similarly, the high concentrations of parameters in the northern region, spatially correlate to the less resistant biotite gneisses and basalts. This could be because, there is high weathering of less resistant rocks in the northern region, releasing more cations and anions in groundwater, compared to more resistant ones in the southern region. Therefore, the high rate of weathering releases more elements in groundwater in the northern region leading to their high concentrations in the region.
The hydro-chemical facies of an area is controlled by the chemical constituents that build up in groundwater as it percolates through soil and rock fractures [3]. The dominant groundwater type (Ca-Mg-HCO3) and slightly Ca-Mg-Cl-SO4 type in the area reflects the dominant cations and ions in groundwater. Intense weathering and dissolution of silicate rocks, reported in the area [13], is known to produce Ca, Mg, and HCO3 rich groundwater [3] as observed in the current study. A slight Cl and SO42− rich groundwater type observed can be attributed to the high evaporation caused by the arid and semi-arid climate experienced in the area. This was observed in the Gibbs plot and the statistical analyses employed. Our results show that rock dominance (weathering) and slight evaporation dominance (evaporative enrichment) are the major mechanisms controlling groundwater chemistry in the area. Evaporative enrichment occurs when the evaporation rate exceeds the recharge (such as precipitation) rate leading to more water loss [39]. The statistical analyses, similarly, show TDS, conductivity, Mg, SO42−, total hardness, Cl, Na, and Ca as the dominant parameters in groundwater in the area. The strong positive correlation observed between most of the dominant parameters suggests that their concentration in groundwater is influenced by similar processes. A weak to strong correlation between some parameters suggests that there is more than one process influencing their concentration in groundwater.
Most of the water sources analysed in Makueni County are used for domestic purposes, which include drinking and cooking. It is therefore important to consider the potential health implications of the physico-chemical constituents of the water. When compared to the WHO and KEBS recommended standards in drinking water, the concentrations of dominant ions (EC, Mg, Ca, and Cl), which influence salinity, as well as F exceeded the limits in up to 55% of the samples (Table 1). These parameters have known health implications and their high occurrence in a significant number of the water sources warrants the need to determine their potential health implications due to drinking water in Makueni County.
The concentrations of EC below 750 to 2250 μS/cm are considered excellent to permissible, while values between 2251 to above 6000 μS/cm are very high to extremely high [37]. Using this classification [37], 50% (n = 10) of the water sources had good to permissible EC values, while 50% had very high to extremely high EC. From the salinity results, 40% (n = 8) of the water sources had good to fair values while 60% (n = 12) had poor to unacceptable salinity values, based on the classification by the Australian National Health and Medical Research Council [45]. Water sources with high salinity values and with possible health implications are observed in the northern region. High salinity is mainly associated with an undesirable taste in drinking water. Consumption of high saline water over a prolonged period has also been shown to induce several health complications including high blood pressure, skin diseases, diarrhoea, miscarriage, and eclampsia in pregnant women [12,46,47]. Evidence of high salinity was observed in the area during sampling, where, some of the local population we interacted with reported salty water as a common drinking water quality issue. Cases of abandonment of boreholes with very high salinity were also reported. High salinity is also reported in the northern parts of Makueni County, as well as the adjacent Kitui County [15,21]. In terms of health effects, the local population associated gastrointestinal complication with consumption of the high salty water, especially to first-time consumers.
Water sources with higher F levels than the recommended limit are observed in nine (56.25%) boreholes and both shallow wells (100%), while the surface water sources (the springs and the tap) were within safe limits. These elevated F levels with potential negative health implications were located in the northern region (Figure 4e). Fluoride concentrations were correlated with the dominant parameters (PC1, PC2, and PC3) in the Spearman’s matrix to determine probable factors influencing its release in groundwater. The results in Table 4 show a positive medium correlation (r = 0.41–0.48, p = 0.05) between F and SO42−, Na, alkalinity, and HCO3 which are among the dominant parameters in the analysed water samples. This indicates that F release in groundwater in the area is also influenced by similar processes to the dominant parameters. Therefore, rock weathering, evaporation, and ion exchange are the main processes that influence the release of F. Consumption of high amounts of F (>1.5 mg/L) can be detrimental as it can result in several degrees of dental and skeletal fluorosis depending on the dosage and duration of consumption [48,49]. Signs of dental fluorosis were observed in some members of the local population during sampling indicating that the area has a fluorosis issue. Cases of dental fluorosis have also been reported in the central part of Makueni County [10], as well as the neighbouring Machakos County [50].
The evaluation of the suitability of water sources for agriculture shows that up to 60% of the water sources in the area have high Na, Mg, and EC values which can potentially induce salinity, Na, and Mg hazards if used for a long time as the only source. The high salinity and Na hazard can be associated with soil permeability problems [5,39]. This effect makes it difficult to plough, as well as presenting issues for the emergence of seedlings and causes stunted growth [39]. This suggests that most of the water sources in Makueni County would require treatment to be effectively used for irrigation. The use of groundwater in addition to rain and surface water for irrigation should be considered to minimise the potential of salinity and sodium hazard to food crops production.

5. Conclusions and Recommendations

The analysis of physico-chemical parameters of 20 drinking water sources in the central and southern regions of Makueni County showed a wide variation in elements concentration. Several parameters exceeded the recommended limits set by the WHO and Kenya (KEBS) for drinking water and irrigation suitability. Notably, salinity in up to 55% of the analysed water sources ranged from very high to extreme due to high concentrations of parameters such as TDS, hardness, EC, Ca, and Cl. Similarly, F values exceeded the recommended limits in 50% of the water sources. The highest concentrations of most of these potentially harmful parameters are observed in the northern region of the study area. This spatial pattern might be attributed to the presence of less resistant rocks in the northern region than the southern region. From the geochemical and statistical results, it can be inferred that the area has a predominant Ca-Mg-HCO3 with a trend to Ca-Mg-Cl-SO4 water types, where rock weathering and evaporation highly influence groundwater chemistry. Ion exchange is also likely to contribute to the enrichment of the dominant ions in groundwater.
High salinity and F can potentially be deleterious to the health of the local population when using the water for drinking and cooking. Undesirable salty water and gastrointestinal complications due to high salinity and presence of dental fluorosis were reported by some of the local population during sampling. The suitability of the water for irrigation revealed high risks of salinity, Na, and Mg hazards in most of the water sources.
Based on the current findings (high salinity and F), it is recommended that necessary measures such as blending of the groundwater with surface water and defluoridation, especially in the northern region, should be considered in order to minimise their health risks. Detailed investigations on the health effects of high F and salinity in the entire Makueni County is in progress. Furthermore, the characterisation of drinking and irrigation water quality is recommended in the larger south-eastern Kenya region which has similar geology to Makueni County.
The results presented in this paper form part of a larger study in the Makueni County. Further water analysis will be carried out after a rainy season in order to determine the seasonal variation of salinity and F levels in used water sources in the area. This sampling will be focused mostly on the southern region (Figure 1), which is dominated by shallow wells. These wells were dry during the sampling of the other sources in the area, hence not included in this paper. In addition, detailed physico-chemical analysis will be undertaken on the geological formations, farm soils, and food crops consumed by the local population in order to determine their levels of salinity and concentrations of F. The health implications of these parameters on the local population and community knowledge on preventive measures, will be established through a thorough health survey.

Author Contributions

Conceptualization and methodology of the project, P.K.G., H.M., K.D., M.C., and P.G.-N. Field samples collection and analysis were performed by P.K.G. under the supervision of H.M., K.D., M.C., and P.G.-N., P.K.G. prepared the first manuscript, which was reviewed and edited by H.M., K.D., M.C., and P.G.-N., H.M. is the principal project supervisor who also provided funding. All authors have read and agreed to the published version of the manuscript.

Funding

This research was funded by the National Research Foundation (NRF) through a rated researcher grant to H. Mouri and the University of Johannesburg department of Geology Paleo-Proterozoic Mineralisation (PPM) funds.

Acknowledgments

The authors are grateful to the NRF and UJ Geology PPM for the financial support. We are also grateful to the staff at the WARMA office in Kibwezi town for their assistance in samples collection in Makueni County. The authors highly appreciate the comments and suggestions by the editor and three anonymous reviewers, which helped to improve the manuscript.

Conflicts of Interest

The authors declare no conflict of interest.

References

  1. United Nations (UN). The Sustainable Development Goals Report 2018; United Nations: New York, NY, USA, 2018. [Google Scholar]
  2. JICA Basic Design Study Report on the Project for Groundwater Development in Rural Districts (Machakos, Kitui, Makueni and Mwingi) in the Republic of Kenya. Available online: http://open_jicareport.jica.go.jp/618/618/618_407_11775582.html (accessed on 23 January 2019).
  3. Adimalla, N.; Venkatayogi, S. Mechanism of fluoride enrichment in groundwater of hard rock aquifers in Medak, Telangana State, South India. Environ. Earth Sci. 2017, 76, 45. [Google Scholar] [CrossRef]
  4. Venkatramanan, S.; Chung, S.Y.; Ramkumar, T.; Rajesh, R.; Gnanachandrasamy, G. Assessment of groundwater quality using GIS and CCME WQI techniques: A case study of Thiruthuraipoondi city in Cauvery deltaic region, Tamil Nadu, India. Desalin. Water Treat. 2016, 57, 12058–12073. [Google Scholar] [CrossRef]
  5. Adimalla, N.; Wu, J. Groundwater quality and associated health risks in a semi-arid region of south India: Implication to sustainable groundwater management. Hum. Ecol. Risk Assess. Int. J. 2019, 25, 1–26. [Google Scholar] [CrossRef]
  6. Sharaf, M.A.M.; Subyani, A.M. Assessing of groundwater contamination by toxic elements through multivariate statistics and Spatial Interpolation, Wadi Fatimah, Western Arabian Shield, Saudi Arabia. Int. J. Sci. Eng. Res. 2011, 2, 1–14. [Google Scholar]
  7. Mailu, G.M. The influence of Precambrian metamorphic rocks on groundwater in the Chyulu Area, Kenya. Appl. Hydrogeol. 1994, 2, 26–32. [Google Scholar] [CrossRef]
  8. Ng’ang’a, S.; Kibetu, P.; Thumbi, G.; Okwadha, G.; Nyadawa, M. Reduction of iron and manganese in groundwater through non-mechanical aeration and filtration method: Case study of Makueni County, Eastern Kenya. J. Int. Acad. Res. Multidiscip. 2017, 5, 25–37. [Google Scholar]
  9. Kenya National Bureau of Statistics. The 2009 Kenya Population and Housing Census; Kenya National Bureau of Statistics: Nairobi, Kenya, 2010; Volume 1.
  10. Mbithi, F.M. Assessment of the Impact of Groundwater Fluoride on Human Health in Makindu District, Makueni County, Kenya. Master’s Thesis, South Eastern Kenya University, Kitui County, Kenya, 2017. [Google Scholar]
  11. Raju, N.J. Iron contamination in groundwater: A case from Tirumala-Tirupati environs, India. Researcher 2006, 1, 28–31. [Google Scholar]
  12. Vineis, P.; Chan, Q.; Khan, A. Climate change impacts on water salinity and health. J. Epidemiol. Glob. Health 2011, 1, 5–10. [Google Scholar] [CrossRef] [Green Version]
  13. Saggerson, E.P. Geology of the Simba-Kibwezi Area: Degree Sheet 59, NE Quarter (with Coloured Geological Map); Geological Survey of Kenya: Nairobi, Kenya, 1963.
  14. Nair, K.R.; Manji, F.; Gitonga, J.N. The occurrence and distribution of fluoride in groundwaters of Kenya. East. Afr. Med. J. 1984, 61, 503–512. [Google Scholar]
  15. Mwamati, F.T.; Kitheka, J.U.; Njuru, P.G. An Assessment of the Spatial and Temporal variations of Groundwater quality in Yatta Plateau in Kitui County, Kenya. J. Environ. Earth Sci. 2017, 7, 90–104. [Google Scholar]
  16. Ngugi, E. Exploring Kenya’s Inequality: Pulling Apart or Pooling Together; Kenya National Bureau of Statistics: Nairobi, Kenya, 2013.
  17. Ng’ang’a, S.K.; Thumbi, G.M.; Nyadawa, M.O.; Okwadha, G.O.; Kibetu, P.M. Groundwater mapping of Makueni County, Eastern Kenya Using Remote Sensing and Geographical Information System (GIS) Technologies. J. Int. Acad. Res. Multidiscip. 2015, 3, 271–285. [Google Scholar]
  18. TANATHI Water Services Board. Brief Summary of TANATHI Water Services Board Recently Completed; (on-going and planned projects within Makueni); Ministry of Water and Sanitation State Department for Water: Nairobi City, Republic of Kenya, 2018.
  19. Kaggikah, D. Makueni County–017–2017. Available online: https://www.kenyacountyguide.co.ke/makueni-county-017/- (accessed on 24 April 2019).
  20. Dodson, R.G. Geology of the South-East Machakos Area: Degree Sheet 52, SE Quadrant (with Coloured Map); Geological Survey of Kenya: Nairobi, Kenya, 1953.
  21. Ng’ang’a, S.; Kibetu, P.; Thumbi, G.; Okwadha, G.; Nyadawa, M. Groundwater Quality Assessment and Water Quality Indexing: Case Study of Makueni County, Eastern Kenya. J. Int. Acad. Res. Multidiscip. 2018, 6, 77–91. [Google Scholar]
  22. Kithiia, S.M. An assessment of water quality changes within the Athi and Nairobi river basins during the last decade. IAHS Publ. 2007, 314, 205. [Google Scholar]
  23. US-EPA. Quick Guide to Drinking Water Sample Collection 2016. Available online: https://www.epa.gov/sites/production/files/2015-11/documents/drinking_water_sample_collection.pdf (accessed on 9 October 2019).
  24. Rice, E.W. Standard Methods for the Examination of Water and Wastewater, 22nd ed.; American Public Health Association, Ed.; American Public Health Association: Washington, DC, USA, 2012. [Google Scholar]
  25. Rhoades, J.D.; Kandiah, A.; Mashali, A.M. Saline waters as resources. In The Use of Saline Waters for Crop Production. FAO Irrigation and Drainage Paper 48; FAO: Rome, Italy, 1992; pp. 5–10. [Google Scholar]
  26. Creed, J.; Brockhoff, C.; Martin, T. Method 200.8: Determination of Trace Elements in Waters and Wastes by Inductively Coupled Plasma–Mass Spectrometry, EMMC Version, Revision 5.4; EPA: Cincinnati, OH, USA, 1994.
  27. WHO. Guidelines for Drinking-Water Quality: Fourth Edition Incorporating the First Addendum; WHO Guidelines Approved by the Guidelines Review Committee, World Health Organization: Geneva, Switzerland, 2017. [Google Scholar]
  28. KEBS. Drinking Water—Specification, Part 1: The Requirements for Drinking. In Water, 3rd ed.; KEBS: Nairobi, Kenya, 2007. [Google Scholar]
  29. Piper, A.M. A graphic procedure in the geochemical interpretation of water-analyses. Trans. Am. Geophys. Union 1944, 25, 914. [Google Scholar] [CrossRef]
  30. Gibbs, R.J. Mechanisms Controlling World Water Chemistry. Science 1970, 170, 1088–1090. [Google Scholar] [CrossRef]
  31. Luo, W.; Gao, X.; Zhang, X. Geochemical processes controlling the groundwater chemistry and fluoride contamination in the Yuncheng Basin, China—An area with complex hydrogeochemical conditions. PLoS ONE 2018, 13, e0199082. [Google Scholar] [CrossRef]
  32. Ghasemi, A.; Zahediasl, S. Normality Tests for Statistical Analysis: A Guide for Non-Statisticians. Int. J. Endocrinol. Metab. 2012, 10, 486–489. [Google Scholar] [CrossRef] [Green Version]
  33. Bhat, S.A.; Meraj, G.; Yaseen, S.; Pandit, A.K. Statistical Assessment of Water Quality Parameters for Pollution Source Identification in Sukhnag Stream: An Inflow Stream of Lake Wular (Ramsar Site), Kashmir Himalaya. J. Ecosyst. 2014, 2014, 1–18. [Google Scholar] [CrossRef]
  34. Richards, L. Diagnosis and improvement of saline and alkali soils. Science 1954, 120, 800. [Google Scholar] [CrossRef]
  35. Wilcox, L.V. Classification and Use of Irrigation Waters; United States Department of Agriculture: Washington, DC, USA, 1995; Volume 969.
  36. Szabolcs, I. The influence of irrigation water of high sodium carbonate content on soils. Agrokem. Talajt. 1964, 13, 237–246. [Google Scholar]
  37. Handa, B. Description and classification of media for hydro-geochemical investigations. In Proceedings of the Ground Water Studies in Arid and Semi Arid Regions, Roorkee, India, 1969; pp. 319–337. [Google Scholar]
  38. Ayers, R.S.; Westcot, D.W. Water quality evaluation. In Water Quality for Agriculture; FAO Irrigation and Drainage Paper; Food and Agriculture Organization of the United Nations: Rome, Italy, 1985. [Google Scholar]
  39. Al-Hadithi, M.S. Application of Wilcox and United State Salinity Laboratory diagrams to assess groundwater quality for irrigation purposes around Saqlawiyah area, Al-Anbar, Iraq. Iraqi Bull. Geol. Min. 2016, 12, 29–37. [Google Scholar]
  40. Shankar, K.; Aravindan, S.; Rajendran, S. Hydrochemical Profile for Assessing the Groundwater Quality of Paravanar River Sub-Basin, Cuddalore District, Tamil Nadu, India. Curr. World Environ. 2006, 1, 45–52. [Google Scholar] [CrossRef]
  41. Brindha, K.; Kavitha, R. Hydrochemical assessment of surface water and groundwater quality along Uyyakondan channel, south India. Environ. Earth Sci. 2015, 73, 5383–5393. [Google Scholar] [CrossRef]
  42. Gevera, P.; Mouri, H. Natural occurrence of potentially harmful fluoride contamination in groundwater: An example from Nakuru County, the Kenyan Rift Valley. Environ. Earth Sci. 2018, 77, 365. [Google Scholar] [CrossRef]
  43. Ward, M.; Jones, R.; Brender, J.; de Kok, T.; Weyer, P.; Nolan, B.; Villanueva, C.; van Breda, S. Drinking Water Nitrate and Human Health: An Updated Review. Int. J. Environ. Res. Public Health 2018, 15, 1557. [Google Scholar] [CrossRef] [Green Version]
  44. AGRA. Climate Change Pushing Farmers in Makueni County to Shift from Maize Farming to Growing of Pulses. Available online: https://agra.org/climate-change-pushing-farmers-in-makueni-county-to-shift-from-maize-farming-to-growing-of-pulses/ (accessed on 4 September 2019).
  45. NHMRC; NRMMR. Natural Resource Management Ministerial Council Physical and Chemical quality of drinking water. In Australian Drinking Water Guidelines 6 2011: National Water Quality Management Strategy; National Health and Medical Research Council, Commonwealth of Australia: Canberra, Australia, 2011; pp. 79–93. [Google Scholar]
  46. Khan, A.E.; Ireson, A.; Kovats, S.; Mojumder, S.K.; Khusru, A.; Rahman, A.; Vineis, P. Drinking Water Salinity and Maternal Health in Coastal Bangladesh: Implications of Climate Change. Environ. Health Perspect. 2011, 119, 1328–1332. [Google Scholar] [CrossRef]
  47. Nahian, M.A.; Ahmed, A.; Lázár, A.N.; Hutton, C.W.; Salehin, M.; Streatfield, P.K. Drinking water salinity associated health crisis in coastal Bangladesh. Elem. Sci. Anthr. 2018, 6, 2. [Google Scholar] [CrossRef]
  48. Skinner, H.C.W. Mineralogy of Bones. In Essentials of Medical Geology; Selinus, O., Ed.; Springer: Dordrecht, The Netherlands, 2013; pp. 665–687. [Google Scholar]
  49. Gevera, P.; Mouri, H.; Maronga, G. Occurrence of fluorosis in a population living in a high-fluoride groundwater area: Nakuru area in the Central Kenyan Rift Valley. Environ. Geochem. Health 2019, 41, 829–840. [Google Scholar] [CrossRef]
  50. James, R.M. Dental Fluorosis and Parental Knowledge of Risk Factors for Dental Fluorosis. Master’s Thesis, University of the Western Cape, Cape Town, South Africa, 2016. [Google Scholar]
Figure 1. Map of Makueni County showing the geology and location of the sampling area around Makindu and Kibwezi. Modified from Ng’ang’a et al. [17].
Geosciences 10 00062 g001
Figure 2. Spatial variation of pH (a), colour (b), turbidity (c), Electrical Conductivity EC (d), salinity (e), hardness (f), alkalinity (g), and Total Dissolved Solids (TDS) (h) in groundwater in Makueni County in November 2018 where, areas in red exceed the recommended limits for drinking water of these parameters.
Geosciences 10 00062 g002
Figure 3. Spatial variation of Na (a), Ca (b), Mg (c), K (d), Mn (e), and Fe (f) in groundwater in Makueni County in November 2018 where, areas in red exceed the recommended limits for drinking water of these cations.
Geosciences 10 00062 g003
Figure 4. Spatial variation of HCO3 (a), Cl (b), SO42− (c), NO3 (d), F (e), NO2 (f), and Se (g) in groundwater in Makueni County in November 2018 where, areas in red exceed the recommended limits for drinking water of these anions.
Geosciences 10 00062 g004
Figure 5. A piper trilinear diagram showing the major ionic composition of boreholes, shallow wells, springs, and tap water in the study area.
Geosciences 10 00062 g005
Figure 6. Gibbs plots showing (a) Total Dissolved Solids (TDS) vs. Cl/Cl+HCO3 and (b) TDS vs. Na+K/(Na+K+Ca) to illustrate the dominant processes governing groundwater chemistry in Makueni County.
Geosciences 10 00062 g006
Figure 7. Cross plots of the major ions vs. Total Dissolved Solids (TDS) in the water samples used to determine the sources of the ions in water in Makueni County. (a) Cs vs. TDS; (b) Mg vs. TDS; (c) Na vs. TDS; (d) Cl vs. TDS; (e) SO4 vs. TDS.
Geosciences 10 00062 g007
Figure 8. Bi-plots for PC1 and PC2 showing the strength of variables by their closeness and location in the axes.
Geosciences 10 00062 g008
Figure 9. Wilcox diagram (a) showing Sodium percentage (Na%) vs. Electrical Conductivity (EC) and United States Salinity Laboratory (USSL) diagram (b) showing salinity and alkalinity hazards in the analysed water from Makueni County.
Geosciences 10 00062 g009
Table 1. Statistical results (range, median, mean, standard deviation) of the analysed water samples from Makueni County, World Health Organization (WHO), and Kenya Bureau of Standards (KEBS) standards recommended limits and percentage of samples with parameters above these limits.
Water Quality ParametersRangeMedianMeanSDWHO (2017)% Above StandardKEBS (2007)% Above Standard
pH6.94–8.537.847.780.468.558.55
Colour (mgPt/L)5–1005132315101510
Turbidity (N.T.U)0.85–842.169.0418525525
Conductivity (μS/cm) 25 °C480–6320207723211618250035--
Hardness (mgCaCO3/L)64–18805306515475005030060
Alkalinity (mgCaCO3/L)100–60230631014450020--
Salinity336–4424145416241132----
TDS (mg/L)64–3918128814121034150023100055
Fe0.03–1.270.070.170.280.3100.310
Mn0.01–0.180.080.040.060.1150.50
Ca8–432901361381004015025
Mg7.78–1996475581003010030
Na20–9801552212222002520025
K1.7–65172014505-
Cl6–9601953473202504525045
HCO3122–734373378175----
F0.6–7.171.3651.861.591.5501.550
NO30.2–431113121050-
NO20.01–0.040.010.010.010.100.003100
SO42−14–15801062964044502040020
Free CO20–94283323----
Cr0.00–2.430.120.470.66500500
Co0.00–0.540.180.190.14 0--
Ni0.15–11.271.482.293.00700--
Cu0.74–13.221.503.043.38200001000
Zn0.31–4263.2668.081303000050000
As0.02–2.780.250.580.76100500
Se0.36–143.544.413.8810101010
Cd0.01–0.270.010.033.883050
Pb0.05–0.230.050.020.06500100
Table 2. Results of normality test of data for different water quality parameters. The variables with asterisks show normal distribution (p > 0.05).
Tests of Normality
Shapiro–Wilk
StatisticdfSig.
pH0.95200.367 *
Colour0.39200.000
Turbidity0.46200.000
Conductivity0.89200.030
Fe0.48200.000
Mn0.56200.000
Ca0.79200.001
Mg0.90200.061 *
Na0.74200.000
K0.87200.012
Total hardness0.87200.015
Total alkalinity0.94200.252 *
Cl0.86200.009
F0.69200.000
NO30.86200.009
NO20.58200.000
SO42−0.68200.000
Free CO20.94200.284 *
TDS0.91200.092 *
HCO30.94200.252 *
Cr0.71200.000
Co0.93200.162 *
Ni0.69200.000
Cu0.69200.000
Zn0.58200.000
As0.70200.000
Se0.87200.015
Cd0.55200.000
Pb0.54200.000
Table 3. Factor loadings of Principal Component Analysis (PCA) for ground and surface water in Makueni County with three factor solutions. The values in bold represent the dominant parameters (with factor loading values greater than 0.6).
PC1PC2PC3
Ca0.9550.182−0.060
Total hardness0.9520.0720.004
Cl0.823−0.069−0.122
Ni0.800−0.1120.013
Mg0.790−0.0990.096
TDS0.749−0.066−0.016
Conductivity0.735−0.022−0.027
Zn−0.1230.8850.317
Pb0.0920.883−0.040
Mn−0.0690.746−0.028
Free CO20.2530.593−0.178
Cu−0.0430.534−0.224
Turbidity0.033−0.0010.994
Colour0.0660.0010.979
Fe−0.0450.0640.976
F−0.066−0.007−0.140
Na0.144−0.112−0.047
SO42−0.465−0.0330.075
Se0.023−0.276−0.035
K0.022−0.229−0.123
Total alkalinity0.1280.2690.061
HCO30.1280.2690.061
Cr−0.0530.1620.004
Co−0.1470.1540.060
As−0.270−0.2210.242
NO20.052−0.1910.115
NO30.113−0.253−0.134
pH−0.063−0.1730.082
Cd−0.057−0.040−0.073
Eigenvalue8.1274.3343.307
Variance (%)28.02414.94511.403
Cumulative %28.02442.96954.372
Table 4. Spearman’s correlation for the dominant physicochemical parameters in the study samples.
TDSConductivityMg2+SO42−Total HardnessClNa+Ca2+Mn2+Pb2+Zn2+Total AlkalinityHCO3Free CO2Fe2+ColourTurbidityF
TDS1.000
Conductivity0.958 **1.000
Mg2+0.838 **0.866 **1.000
SO42−0.811 **0.841 **0.660 **1.000
Hardness0.801 **0.843 **0.921 **0.690 **1.000
Cl0.859 **0.922 **0.824 **0.638 **0.816 **1.000
Na+0.670 **0.626 **0.3340.563 **0.1670.543 *1.000
Ca2+0.733 **0.786 **0.840 **0.703 **0.971 **0.755 **0.0941.000
Mn2+−0.243−0.1120.029−0.0160.155−0.132−0.490 *0.2461.000
Pb2+−0.481 *−0.465 *−0.280−0.265−0.135−0.429−0.591 **−0.0290.4371.000
Zn2+−0.305−0.230−0.355−0.259−0.264−0.176−0.042−0.2110.2710.3591.000
Alkalinity0.3660.3050.3560.3600.4370.123−0.0440.4330.512 *−0.129−0.2591.000
HCO30.3660.3050.3560.3600.4370.123−0.0440.4330.512 *−0.129−0.2591.000 **1.000
Free CO20.4050.537 *0.463 *0.3340.581 **0.593 **0.0860.581 **0.390−0.3300.0740.3560.3561.000
Fe2+−0.347−0.418−0.220−0.374−0.326−0.442−0.134−0.3650.1620.4380.494 *−0.108−0.108−0.3351.000
Colour−0.280−0.343−0.084−0.284−0.202−0.432−0.297−0.222−0.0630.451 *0.265−0.256−0.256−0.462 *0.698 **1.000
Turbidity−0.071−0.1650.027−0.2240.019−0.224−0.2970.038−0.1820.238−0.033−0.105−0.105−0.2530.1630.582 **1.000
F0.2980.2630.2050.424 *0.0450.0930.412 *0.0170.008−0.388 *−0.484 *0.413 *0.413 *−0.86−0.222−0.355−0.510 *1.000
**. Correlation is significant at the 0.01 level (2-tailed) *. Correlation is significant at the 0.05 level (2-tailed).
Table 5. Categories of Sodium Absorption Ratio (SAR), Sodium percentage (Na%), Magnesium Hazard (MH) and Electrical Conductivity (EC) of ground and surface water in Makueni County for agricultural use.
RangeCategoryNumber of Samples
SAR (mg/L)
<10Excellent5
10–18Good5
18–26Doubtful3
> 26Unsuitable7
Na%
<20Excellent3
20–40Good5
40–60Permissible4
60–80Doubtful6
> 80Unsuitable2
MH (meq/L)
<50Suitable8
>50Unsuitable12
EC (µS/cm)
<250low0
250–750Medium2
750–2250High8
>2250Very high10

