Article

Assessment of Radon Concentration and Impact on Human Health in a Region Dominated by Abandoned Gold Mine Tailings Dams: A Case from the West Rand Region, South Africa

1
School of Geosciences, University of the Witwatersrand, Private Bag X3, Wits, Johannesburg 2050, South Africa
2
Department of Geology, University of Johannesburg, Johannesburg 2006, South Africa
3
Private Consultant, 60 Kambro, 82 Olifant Street, Doornkloof 0157, South Africa
4
Parc RGM, Private Bag X54598, Nina Park, Pretoria 0156, South Africa
*
Author to whom correspondence should be addressed.
Geosciences 2019, 9(11), 466; https://doi.org/10.3390/geosciences9110466
Submission received: 7 September 2019 / Revised: 24 October 2019 / Accepted: 29 October 2019 / Published: 31 October 2019
(This article belongs to the Special Issue Perspectives on Environment and Human Health)

Abstract

:
Radon gas has long been identified as a human carcinogen. The purpose of this study was to understand the occurrence of radon gas in the West Rand region, located west of the city of Johannesburg, South Africa, and to investigate its potential health effects. In this study, the sampling of rocks, tailings, and construction materials was carried out for geochemical analyses. For characterisation of radon, 60 radon monitors (RGMs) were installed in indoor and outdoor environments. The results showed that mine tailings contain high uranium levels, with a maximum of 149.76 ppm and a mean value of 48.87 ppm. The radon levels in the area ranged between 32 Bq/m3 and 1069 Bq/m3 and thus, exceed the typical outdoor radon levels of about 10 Bq/m3. Significantly high values were obtained from gold tailings dams. In indoor environments, radon concentration ranged up to a maximum of 174 Bq/m3, which is above the recommended value of 100 Bq/m3. The effective doses calculated from the obtained radon levels showed a maximum of 16 mSv/y, which is above the recommended value of 1 mSv/y proposed for public exposure. The estimated doses have an enormous potential to pose high lung cancer risks to the populations residing nearby tailings.

1. Introduction

Radon (222Rn) is a naturally occurring radioactive gas, which is inert, colourless, and odourless. It is generated primarily from radium (226Ra), which results from the radioactive decay of uranium (238U). Radon disintegrates into a series of short-lived alpha-emitting daughter radionuclides, such as 214Po and 218Po, that is considered a health hazard when inhaled or ingested [1]. It is reported as the second most significant contributor to lung cancer after smoking [2] and first in lifelong non-smokers. Radon is considered a carcinogen at all exposure levels [3]. However, the WHO set the guideline level at 100 Bq/m3 in indoor environments to protect public health [2]. Studies across the world demonstrate increased lung cancer incidence and death with prolonged exposure to radon and its progeny [4,5,6,7,8]. Radon occurrence in the environment is mainly related to the uranium and thorium bearing materials. For radon to be released into the environment, three significant processes need to take place: emanation, transportation, and exhalation [9]. Once radon is released into the atmosphere, it becomes widely dispersed. Its concentration in the atmosphere is mainly controlled by meteorological processes, such as wind speed, temperature, and atmospheric pressure [10]. The typical outdoor average radon concentration is equivalent to 10 Bq/m3 in the atmosphere [11]. However, elevated levels may occur in certain circumstances. Most of the world’s highest radon fluxes are typically associated with rocks, such as felsic igneous rocks, organic-rich clays and shales, hydrothermal ore deposits in structural disconformities, carbonatites and phosphates [12,13]. In addition, anthropogenic activities, such as mining and milling of ores, residuals from nuclear facilities, and industrial discharges, could result in substantial quantities of radon in the environment, consequently, implying a high risk to human health [12]. The Witwatersrand basin hosts uranium and gold-bearing deposits and residues, which could enhance the amount of radon-222 released into the atmosphere. Most of the residues are abandoned and disposed of in an open space, therefore, leading to the dispersal of radioactive metals through wind and water. The main concern is that the tailings are situated nearby or directly within densely populated residential areas in the Johannesburg region in general and the West Rand region in particular. Therefore, it could affect the health status of individuals residing nearby through the dust blown from these sites. On the other hand, complaints about respiratory-related diseases are commonly reported in most communities located nearby the mine wastes in the West Rand region [14,15]. However, not much effort has been dedicated toward the assessment of radon concentration and the magnitude of its risk to human health in areas where most populations reside proximal to tailings dams. There are only a few studies available, which give insight into the magnitude of radon exposure in South Africa [16,17,18,19]. In the context of gold and uranium mining in the Witwatersrand Basin, the focus of most radon-related studies was extensively on the radon exhalation rate [20,21,22,23]. Therefore, the purpose of this study was to understand the occurrence and distribution mechanism of radon gas in the West Rand region. In addition, to investigate whether the radon gas released from uranium-bearing geological formations and mining sources result in potential health effects, such as lung cancer, in the area.

1.1. Study Area

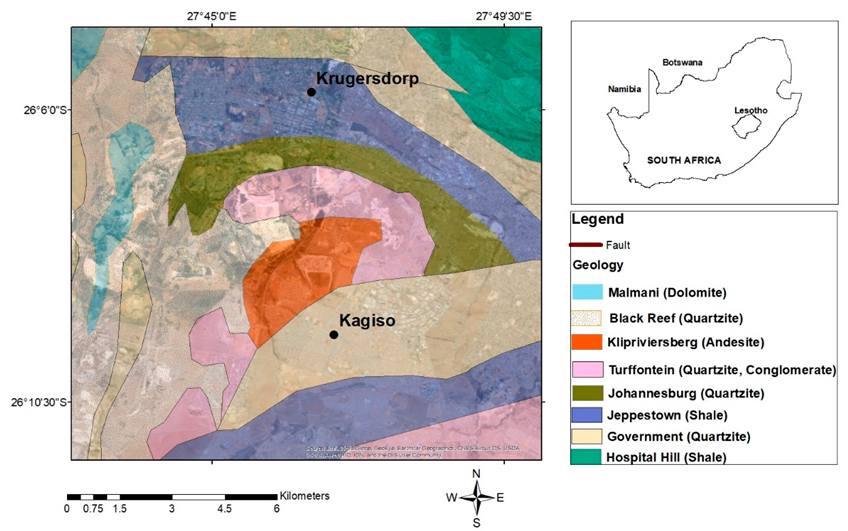
The study area forms part of the Mogale City Local Municipality (MCLM) in the West Rand district of the Gauteng Province in South Africa (Figure 1). The area is situated within the latitudes (26°05′ S and 26°10′ S) and longitudes (27°43′ E and 27°49′ E), approximately 30 km west of the city of Johannesburg. It encompasses the greater parts of Krugersdorp town and Kagiso Township. The study area covers about 130 km2 and straddles close to Roodepoort and Randfontein towns. Historically, the area is known as the city of mining in the West Rand region due to the extraction of gold and uranium for over a century. Currently, the area is dominated by abandoned gold and uranium mine tailings dams, which are mainly scattered in the central part of the study area (Figure 1). Some parts within the extent of the area are predominantly used for residential development. The residential areas are concentrated adjacent to mine residues. The Kagiso Township is a largely populated area with a total of 14.17 km2 size and a population of approximately 115,802 (with a population density of 8172 per km2).
The research area is characterised by a typical highveld climate. It experiences warm to hot summer months with mean monthly daily temperatures ranging between 18 °C and 25 °C. The area generally receives a mean annual rainfall of 701 mm. The average wind speed ranges between 0.9 to 1.6 m/s and gets to a maximum of about 3.5 m/s during the day. The wind direction varies extensively throughout the year and occurs in all directions, although, Northerly (N) winds prevail. Predominately the wind alternates in a clockwise direction between NNW and E. The predominant wind direction is the North–North Westerly (NNW). The wind is the prime parameter that controls the dispersion of radon gas away from its source area.

1.2. Geological and Hydrogeological Overview

The geology of the study area is represented by the meta-sedimentary rocks of the West Rand Group, which belongs to the Witwatersrand Supergroup (3074 and 2714 Ma) [24,25,26]. The dominant lithology includes quartzites of the Government, Johannesburg, and Turffontein Subgroups (Figure 2). Conglomerates that are highly mineralised with uranium-bearing minerals and metal sulphides are also abundant in the area. The shale units of the Jeppestown and Hospital Hill Subgroup also occupy large parts of the study area. The Ventersdorp Supergroup rocks (2.714 and 2.665 Ga) that are composed of lava flows overlay the Witwatersrand Supergroup meta-sedimentary rocks. These rocks are overlain by the Transvaal Supergroup, which includes the Black Reef Formation with remarkable content of placer gold [27], denoted by quartzitic sandstones and conglomerates [28]. The exposure of the basal unit of the Transvaal Supergroup was observed in the eastern part of the study area with the outliers of Malmani Subgroup dolomites.
The landscape is characterised by elongated ridges and plain to gently sloping areas that play an essential role in controlling the hydrogeological setting of the area. The fractures, composed of joints and faults, besides weathered zones formed during deformation serve as the most suitable hydro-structures to enhance recharge and water circulation within the extent of the study area [29,30,31]. The major water-bearing units are characterised by fractured crystalline rocks with groundwater productivity of approximately 2 L/s and dolomites with high productivity of greater than 5 L/s [30,32]. High productivity in dolomites is due to the presence of dissolution cavities, which are compartmentalised by strike–slip faults and cross-cut by dykes. The shale units in the area comprises tight fractures with extremely low productivity.

2. Materials and Methods

To determine the geochemical composition, tailings dams, rocks, and construction materials were collected, and the X-ray fluorescence (XRF) technique was employed. The analysis was conducted at the EARTH LAB, at the University of the Witwatersrand. The samples were crushed and milled to a fine powder. For quality control purposes, the crushing and milling machines were cleaned with water, acetone, and quartz crystals for preparation before every sample. The samples were then prepared into pressed pellets, whereby the fine powder was ground to a grain size of less than 75 µm and mixed with a Moviol solution binder. It was then compressed at a pressure range between 20 T and 30 T to form a homogenous sample pellet and taken for elemental chemical analysis. Standardisation was carried out using the International Reference Materials USGS series (USA) and NIM series (South Africa). Precision was determined based on counting time and was taken as 5% for elements in abundance greater than 100 ppm, and 10% for elements in abundance between 10 and 100 ppm. The instrument used was the Philips PW2404 X-ray spectrometer, and the detection limits were 0.01 ppm for all the elements measured.
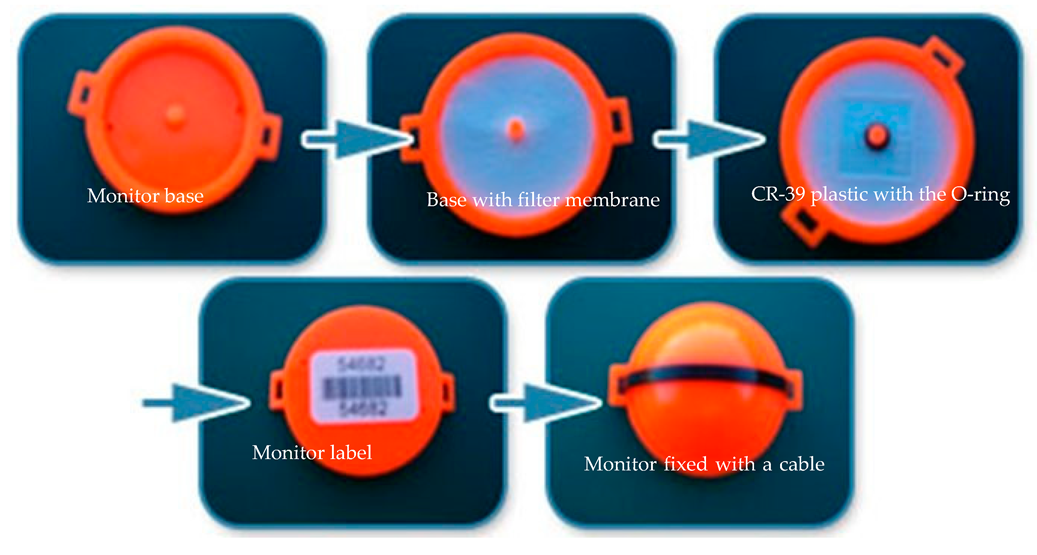
Radon measurement was performed using a solid-state nuclear track device (RGMS). The device comprised a white membrane at the base of the monitor, which is used as the filter material to allow only gases to enter the monitor. It has a 1 mm CR-39 plastic material, which is a polyallyl diglycol carbonate (PADC) known to be highly sensitive to alpha particles. Each monitor has its bar code specification (Figure 3). The device operates in such a way that radon diffuses into the device where alpha particles are generated, which strike the device, thus leaving microscopic areas of damage on the film. It is simple to utilise at a relatively low cost. In total, 60 radon gas monitors (RGMS) were installed across the Krugersdorp and surrounding areas during two different periods. The first 30 radon monitors were left in the field from late August to late November 2017, and the second field installation was conducted on 10 March 2018, and monitors were collected on 10 June 2018 for analysis. The monitors were left in the field for three months during each period. For a three-month exposure period, the monitor has a lower limit of detection of 5 Bq·m−3 with an associated error of 19%. The radon monitors were retrieved and submitted to the PARC RGM laboratory, Pretoria. The etching process of the sheets by NaOH solution enhances the visibility of alpha tracks on the film and thus makes them observable by the use of light microscopy. The tracks are then individually counted through the use of visual detection and a computer-automated system. For radon, the level of radioactivity measured represents the quantity of radioactivity in air volume for a definite period. As such, the number of tracks per unit area is proportional to radon exposure in Bq·h/m3, which gives the number of Becquerels (Bq) in a cubic metre of air (m3) for a specified period (h), in this case, hours. To change to the standard unit of Bq/m3, which gives radon concentration, the values were divided by the total number of hours placed in the field, which is equivalent to 3 months (2208 h). For quality control purposes, analyses were subjected to rigorous quality checks, including two background readings and exposure of two random samples from each sheet to a fixed radon atmosphere. The calibration factor was determined from regular monitor exposures in the radon chamber at HSE in the UK. The laboratory participates in interlaboratory comparisons, the most recent being in December 2018. These control measures serve as validation of the radon measurements performed in this study.
To assess the radiation exposure received by the public from the inhalation of radon, annual effective doses were calculated using the recommendations from the International Commission on Radiological Protection (ICRP) 115 [33]. The procedure employed is explained below:
A radon dose occurs due to the radiation from radon daughters associated with a given radon concentration. Equilibrium radon concentration EEC is defined as:
EEC = F × C
with F the equilibrium factor and C the measured radon concentration.
1 WL is defined as the alpha energy delivered to the lungs by a mixture of radon daughters in equilibrium (F = 1) with 3700 Bq·m−3 of radon.
WL = EEC/3700 = F × C/3700,
1 WL is equivalent to 2.08 × 10⁻² m J·m−3 (energy per unit lung volume).
Historically a unit of WLM was defined, 1 WLM is defined as 3.6 mJ·m−3·h of alpha energy delivered (from dose to mine workers).
Let F = 1 and C = 1 Bq·m−3. Then from (2) and (3):
1 WL is equivalent to (1/3700) × 2.08 × 10−2 = 5.62 × 10⁻⁶ m J·m−3/Bq·m−3.
This is the energy deposited from 1 Bq·m−3 of radon at F = 1.
ICRP 115 proposes a nominal risk coefficient of 5.00 × 10⁻⁴ per WLM.
Dose per WLM = Nominal risk coefficient/Risk detriment.
Therefore, an effective dose per WLM is equivalent to 8.77 mSv/WLM or 8.77 mSv /3.6 mJ·m−3·h = 2.44 mSv·h−1/mJ·m−3; From 4, this is a dose per unit radon concentration of: 2.44 mSv·h−1/mJ·m−3 × 5.62 × 10−6 mJ·m−3/Bq·m−3 = 1.37 × 10⁻⁵ mSv·h−1/Bq·m−3.
For an annual outdoor occupation time of 1760 h this is an annual dose of:
2.41 × 10⁻² mSv·y−1/Bq·m−3.
For F factor of 1. The outdoor F factor is 0.6. Therefore, the annual outdoor dose conversion factor is
1.45 × 10⁻² mSv·y−1/Bq·m−3.
The experiment measured average outdoor radon concentration, which is used directly in Equation (7) and multiplies the annual outdoor dose conversion factor. The following equation was used to calculate the annual effective dose due to outdoor radon exposure:
E = C × D
where E: Annual effective dose (mSv/y); C: Radon concentration (Bq·m−3); D: Annual outdoor dose conversion factor (1.45 × 10⁻² mSv·y−1/Bq·m−3).
To assess the human health effects attributable to radon in the area, the study relied primarily on the statistical data on lung cancer incidences and mortality. Existing information on lung cancer has been collected from the National Cancer Registry to obtain statistics on lung cancer incidences, and also from Statistics South Africa (StatsSA) to obtain statistics on deaths related to lung cancer. Thereafter, the statistics obtained were used to assess the probable risk that could be associated with radon exposure. To further compare lung cancer rates and maintain the quality of the findings, two municipalities with the highest and least population statistics in the Eastern Cape were selected as controls. The selection criterion for controls was based on the fact that the areas are located in a region with less mining activities that could be linked to radon exposure.
In this study, a combination of comparative approach for radon levels obtained at various localities, statistical, and spatial analyses were employed to determine significant controls on radon concentration and distribution. Descriptive statistical analysis, which includes the computation of minimum, median, arithmetic mean, geometric mean, range, and standard deviations were used to obtain an overview of the distribution and variability of the data set. This was also useful in determining outliers. The calculated figures obtained were then compared with the recommended limits (guideline values). Linear regression analysis and Spearman’s correlation were used to identify the relationship between uranium and radon.
Spatial analysis was also used to establish the distribution of radon and to find the correlation between radon and other parameters. ArcGIS (version 10.5) was used for this analysis. The inverse distance weighted (IDW) interpolation method was employed to show the spatial distribution of radon in the study area. This method was selected as the most appropriate as it assumes that the influence of the mapped variable decreases with distance from its point of measurement. Thus, give more weight to the sampled points.

3. Results

3.1. Uranium and Thorium Content in Rocks and Tailings

The uranium and thorium concentration in rocks and tailings from XRF analysis are presented in Table 1. Concerning uranium, concentration ranged between a detection limit, 0.01 ppm, and a maximum of 149.76 ppm with a mean value of 48.87 ppm in the tailings dams. To the greatest extent, uranium content in tailings exceeded the concentration found in rocks, which could also indicate the presence of higher concentrations when compared to a typical natural background value of about 2 ppm to 4 ppm found in the Earth’s crust [12,34]. Similarly, thorium in tailings varied from a minimum of below detection limit to 90.61 ppm, with an average 16.69 ppm. In rocks, thorium showed a maximum concentration of 4.47 ppm with an average of 1.28 ppm, which falls well within the average thorium concentration of about 10 ppm found naturally in the earth’s crust [12].

3.2. Outdoor Radon Concentration

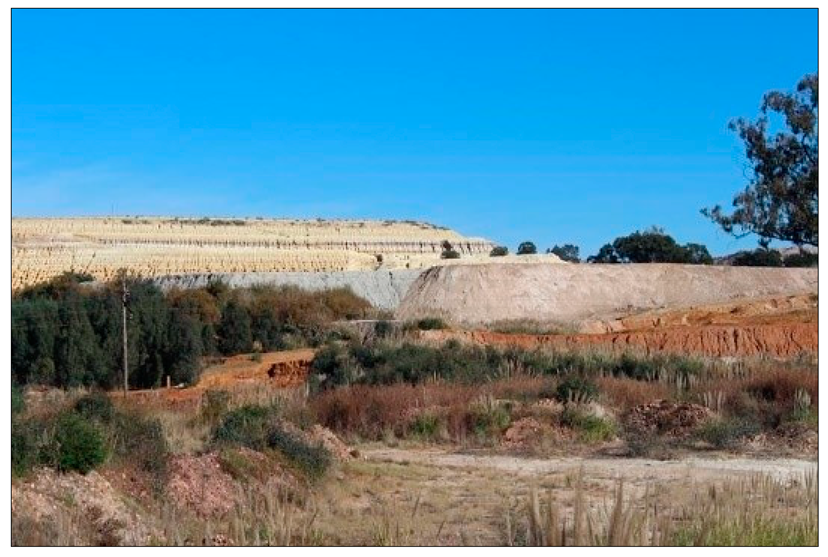
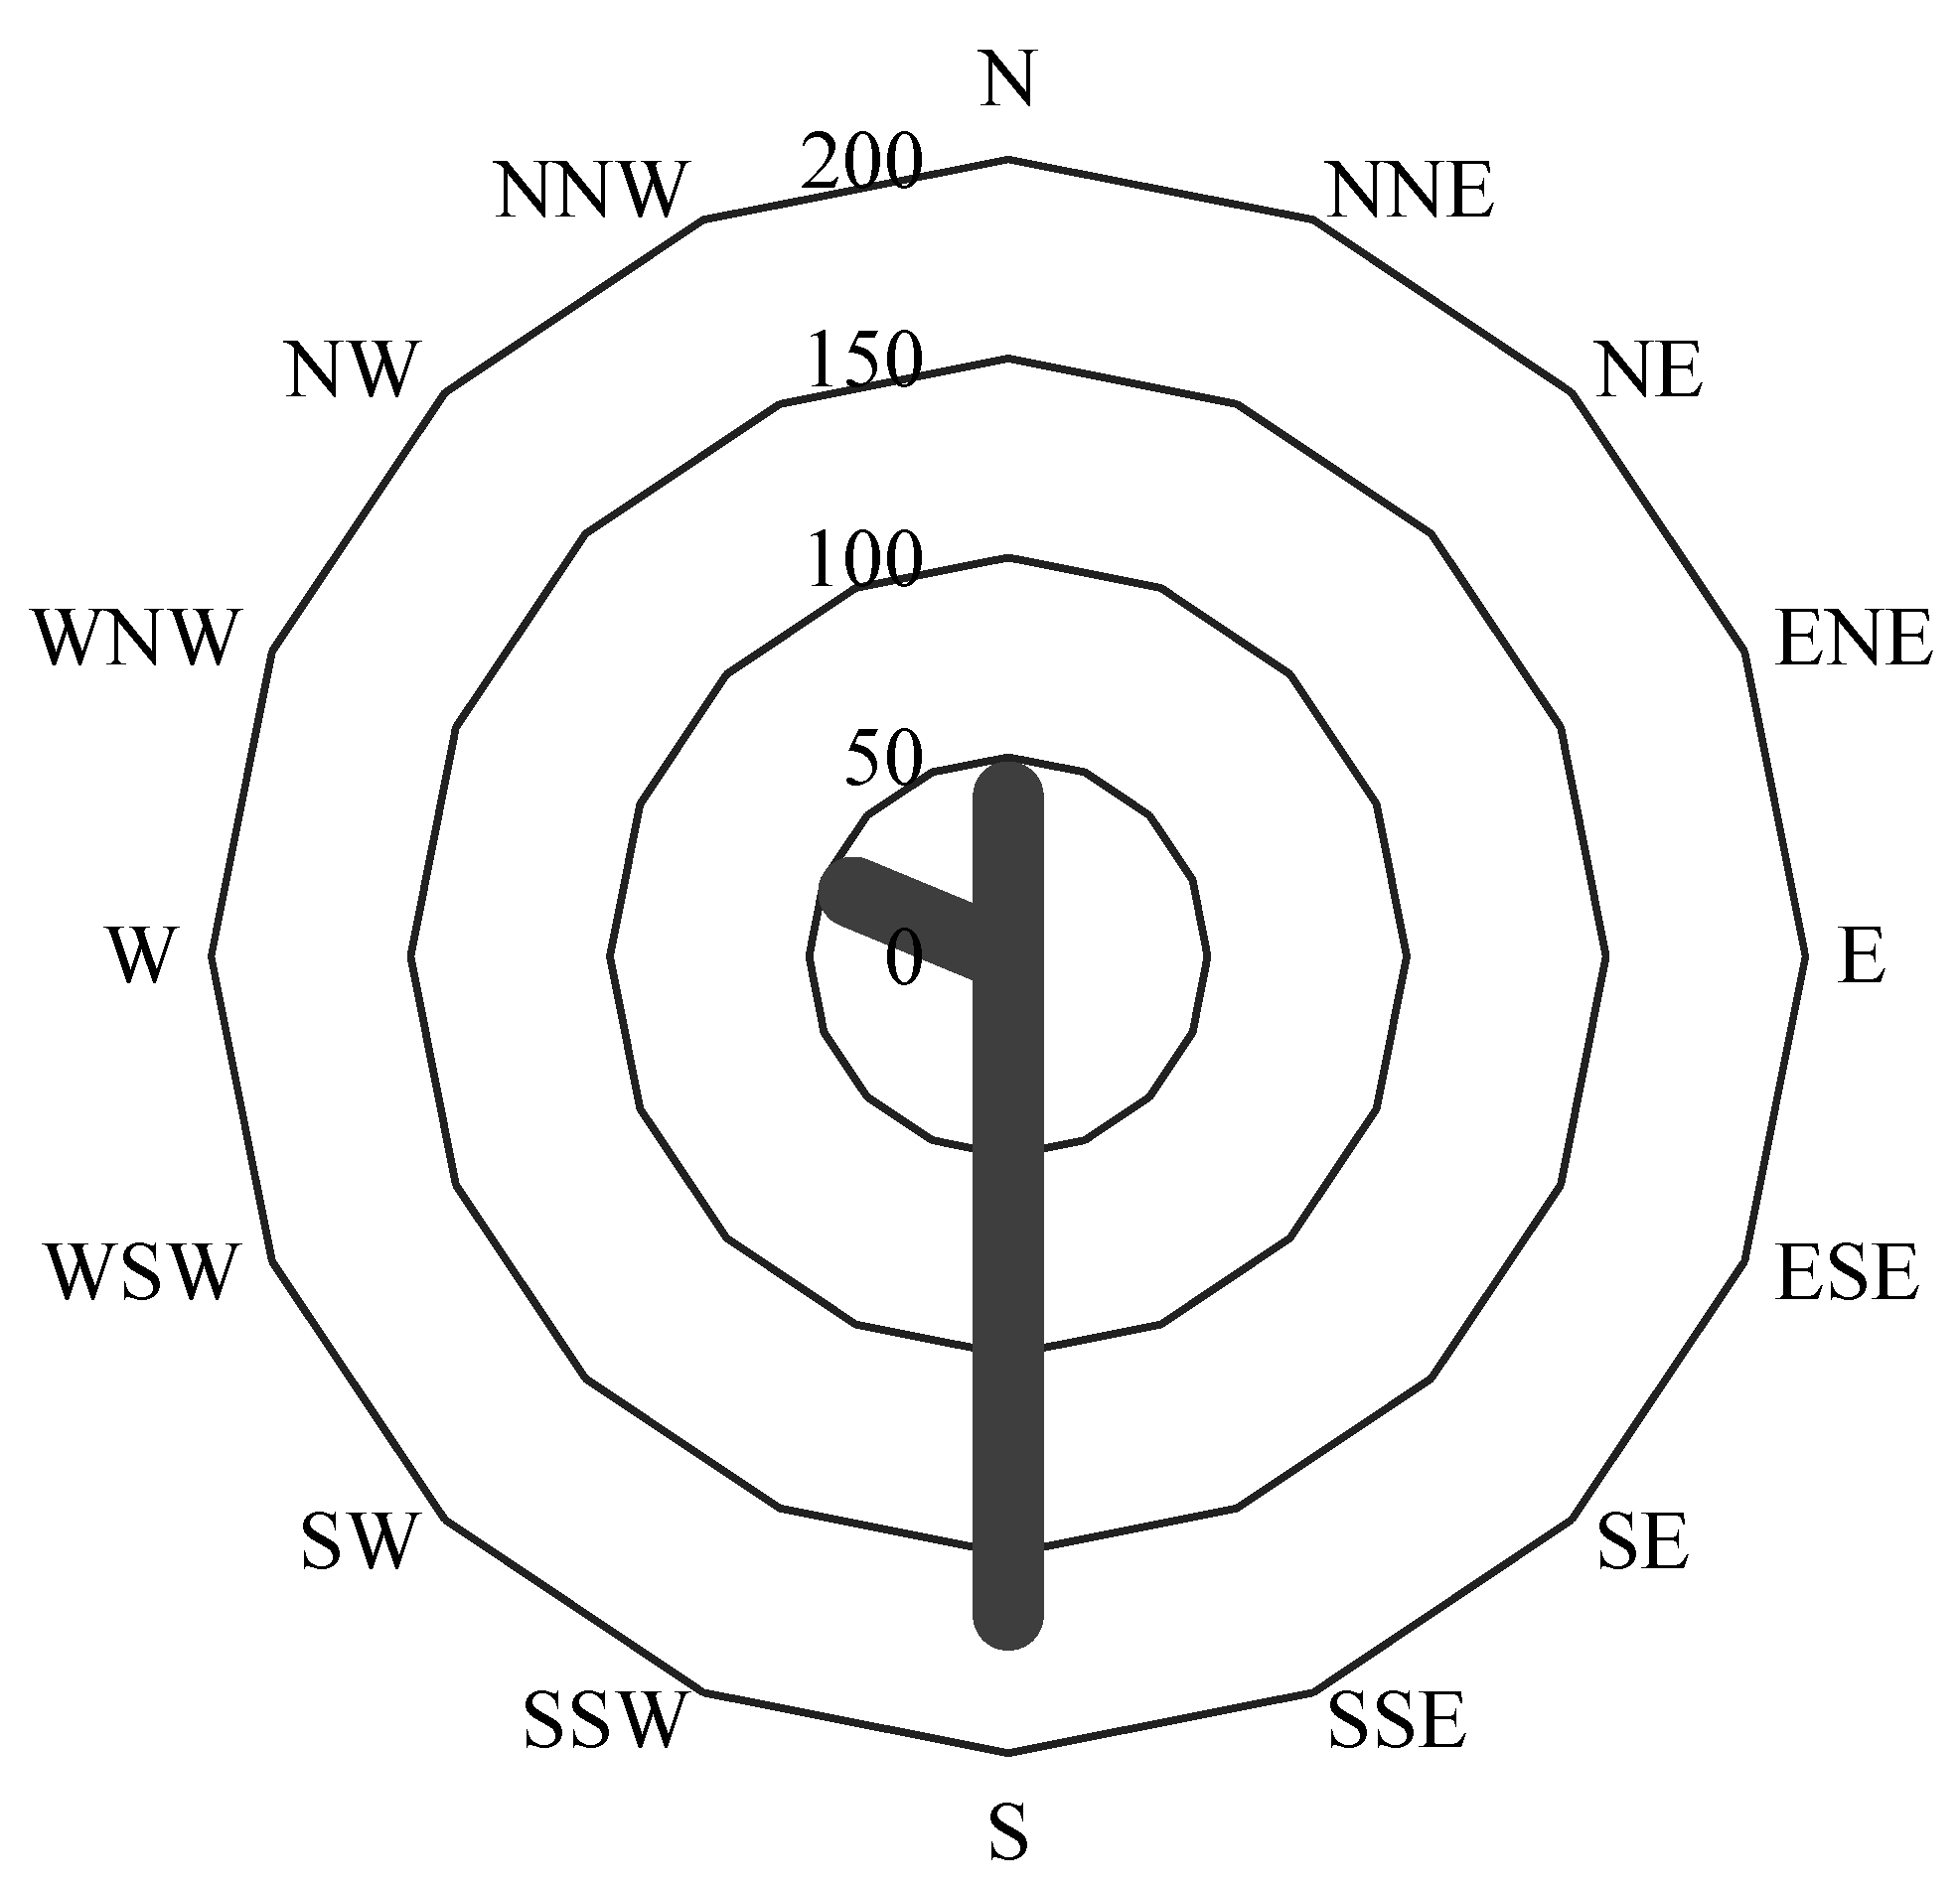
Table 2 summarises the outdoor 222Rn levels measured in the study area. The average outdoor radon levels were highly variable and ranged between 32 Bq/m3 to 1069 Bq/m3, with an average of 147 Bq/m3. Significantly high values with an average of 187 Bq/m3 and the geometric mean of 93 Bq/m3 were obtained directly from the tailings dams (Figure 4). In areas proximal to tailings, radon concentrations showed an average of 86 Bq/m3 and a geometric mean of 65 Bq/m3. The background localities showed an average of 148 Bq/m3 with a geometric mean of 77 Bq/m3 and lowest value of 40 Bq/m3; yet, one locality yielded significantly higher radon concentration of 688 Bq/m3. However, with the exclusion of the outlier measurement, the background concentration averaged at 58 Bq/m3 with a geometric mean of 53 Bq/m3 (Table 2). The lowest radon levels were found in areas outside the vicinity of mining operations and residues, averaging 34 Bq/m3. It is noted that the radon levels in the background localities were approximately two times greater than the average levels found in control measurements (Table 2). In general, there is a gradual decline in radon concentration with increasing distance from the tailings dams dominated region (Figure 5). Furthermore, in distal regions from the mine residues dominated region, particularly in the South, the highest radon levels were found with regard to other directions (Figure 6). This is the direction opposite to the prevailing dominant wind direction (N-NNW).
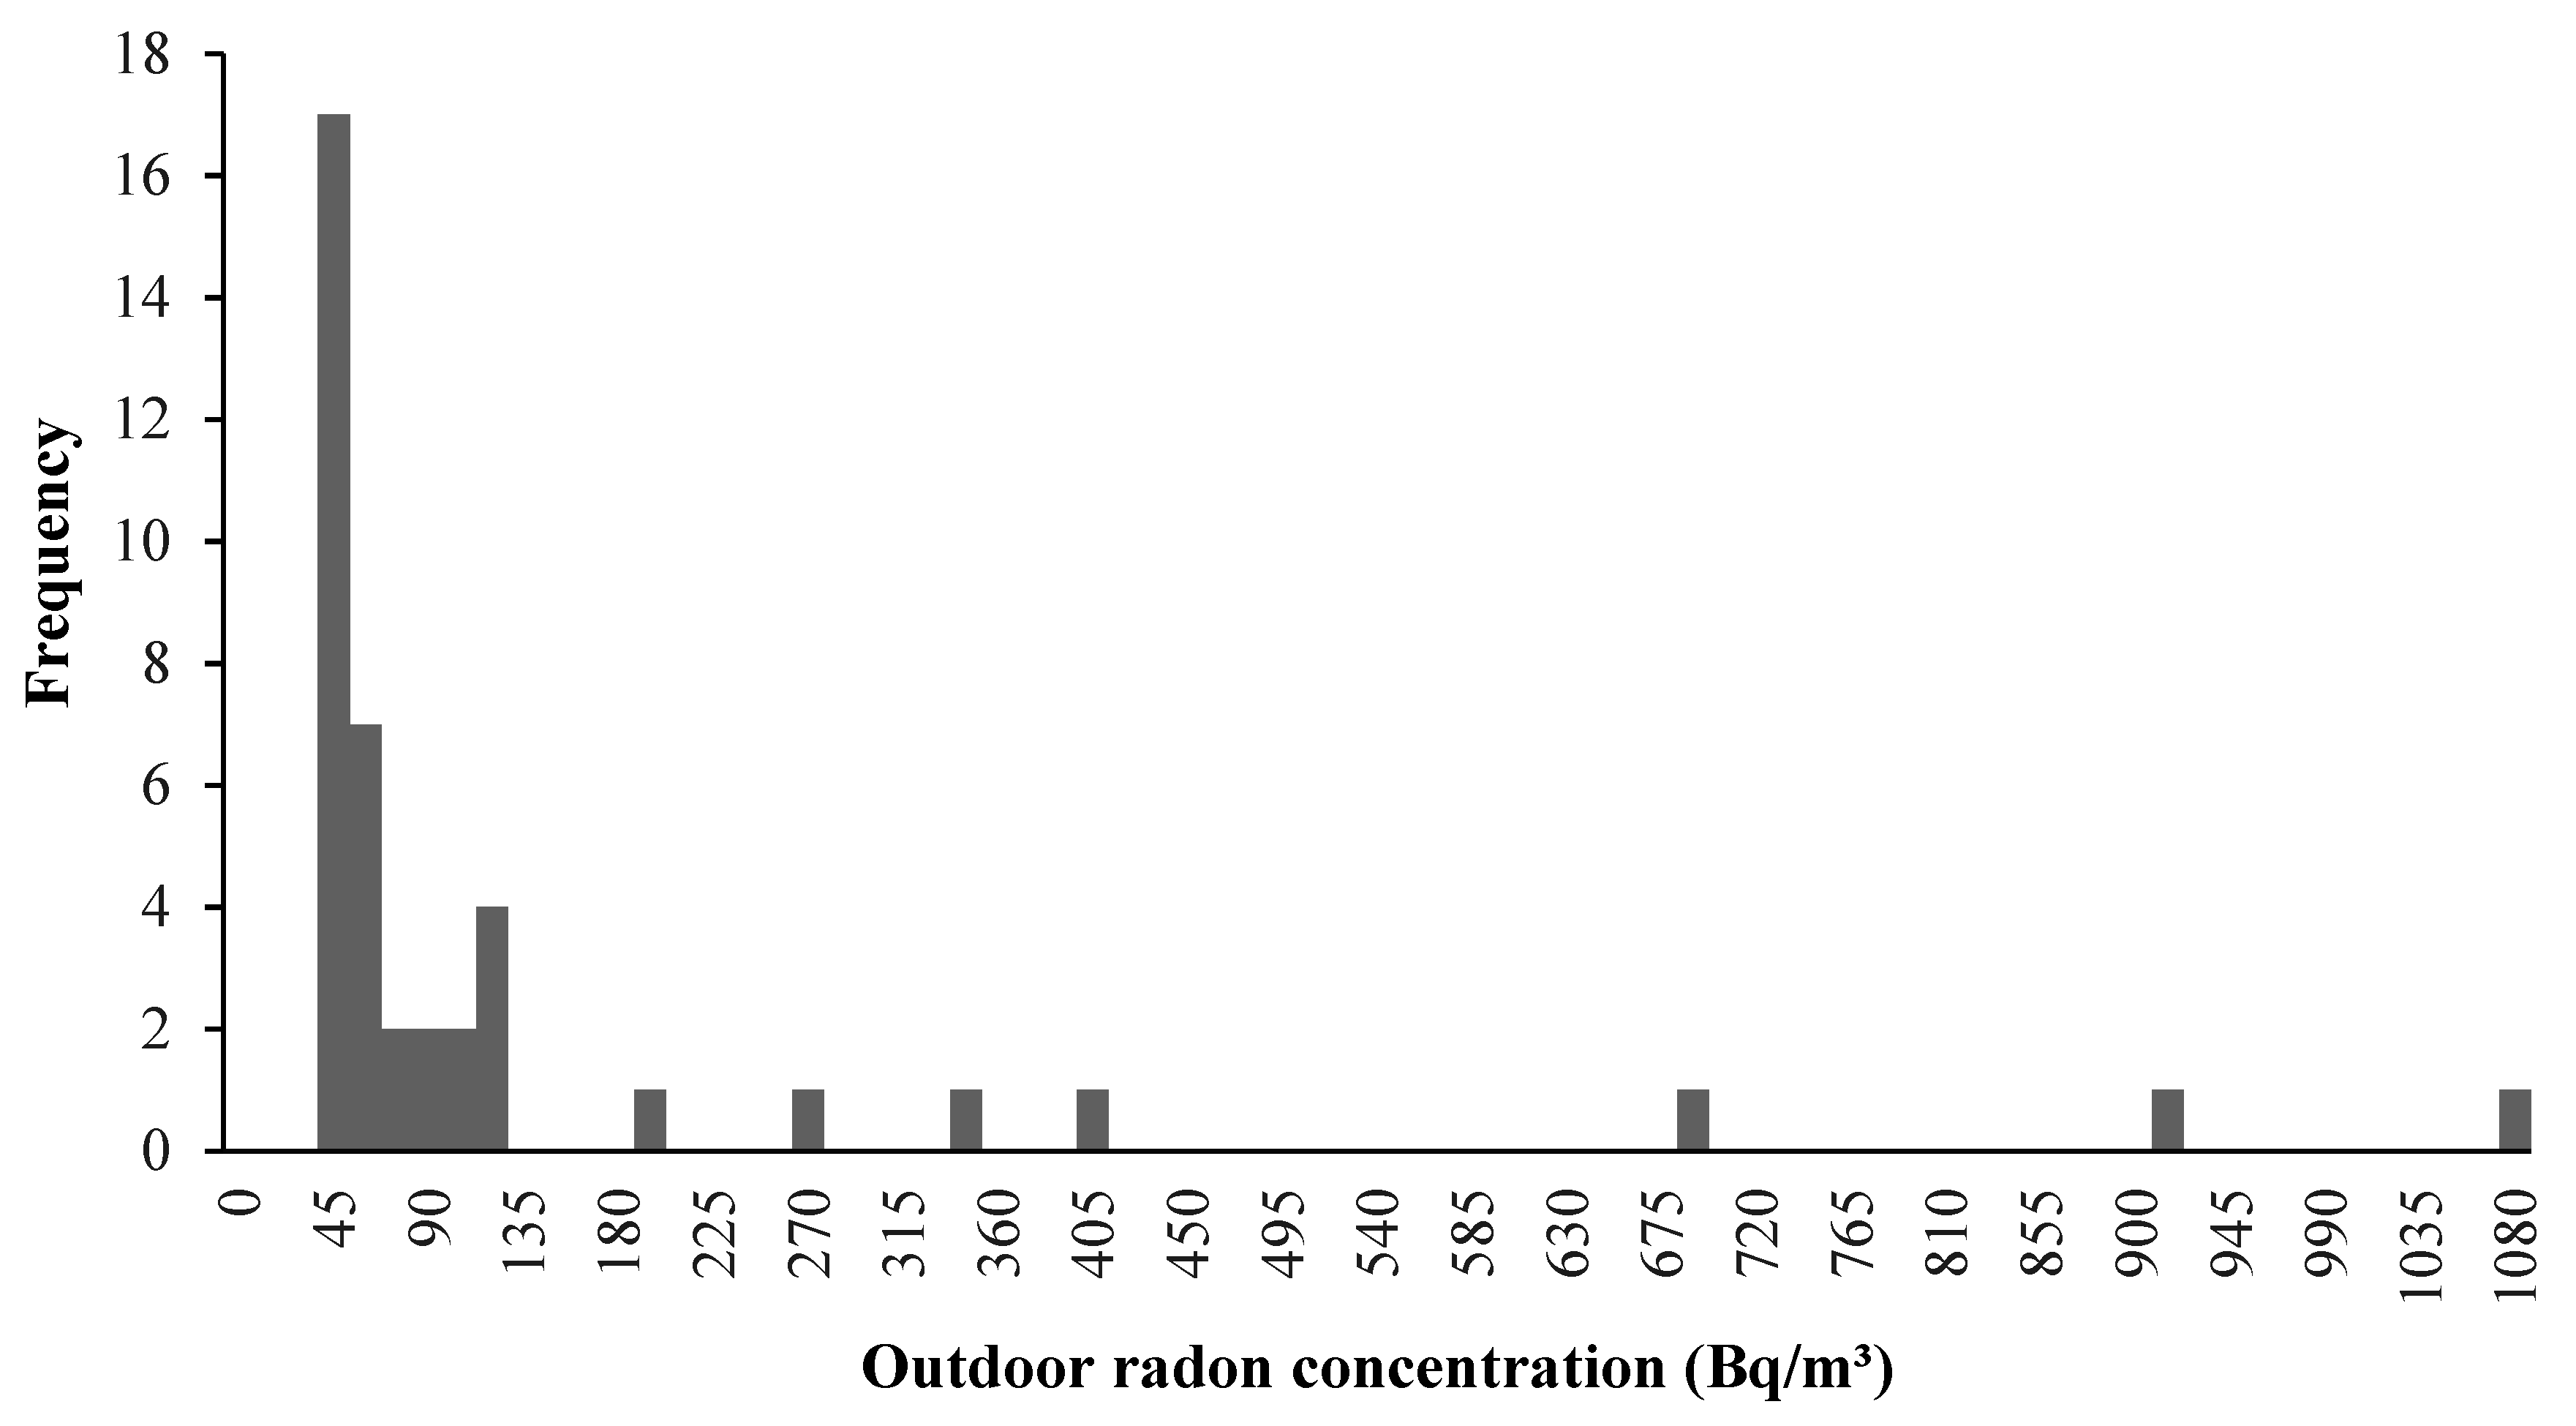
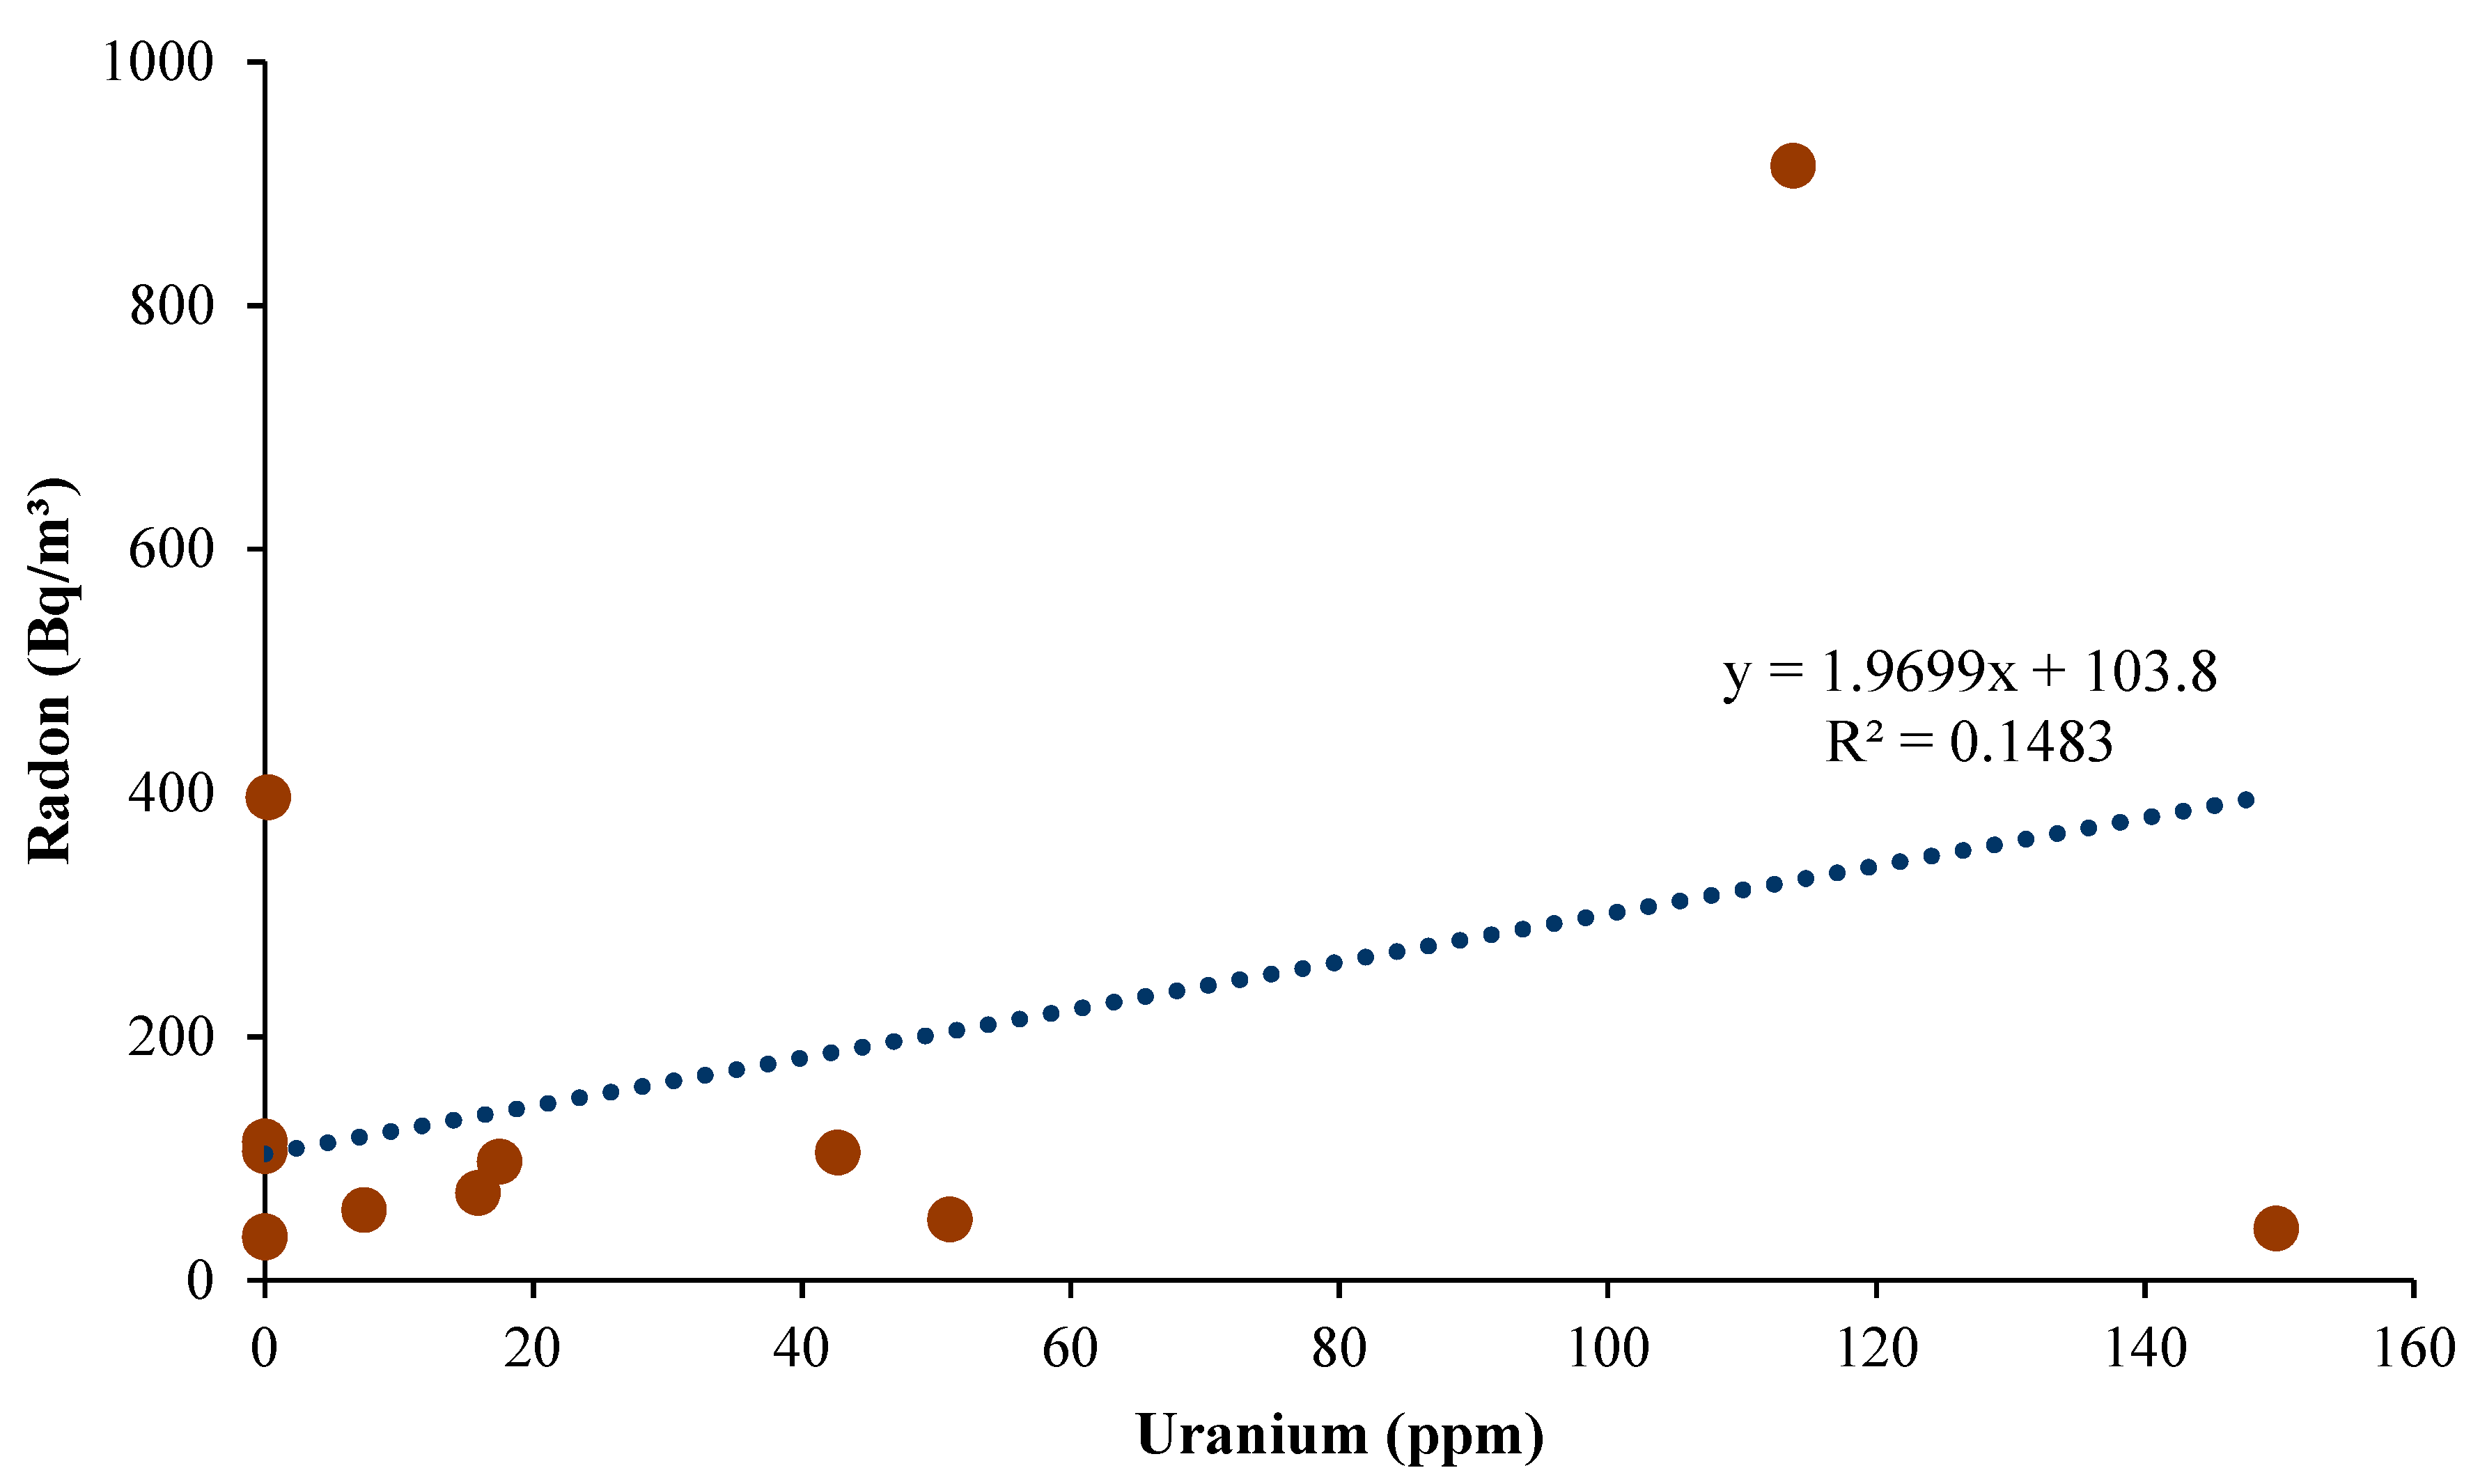
The histogram in Figure 7 shows that most of the values fall between intervals of 30 Bq/m3 to 45 Bq/m3, which mainly corresponds to the levels found in regions away from tailings. The expected typical outdoor average radon concentration is 10 Bq/m3 [11]. The overall values for the whole dataset indicated radon levels above the world mean radon concentration in outdoor environments and are also higher when compared to levels found in other studies [35,36]. The obtained radon levels that are higher than average could be enhanced by elevated uranium and associated radionuclides contained in tailings residues, whereas the wide variability observed could be explained by the diversity of mineralisation in source-terms. However, the results from linear regression analysis, as shown in Figure 8, revealed a weak positive correlation (R2 = 0.1483), which also coincides with the results obtained from Spearman Correlation analysis (rs = 0.09440). The selection criteria for the presented correlation coefficients were based on uranium and radon levels measured in the same locations. Furthermore, it is worth noting that there are few pairs of values of uranium and radon under this criterion.

3.3. Spatial Distribution of Radon

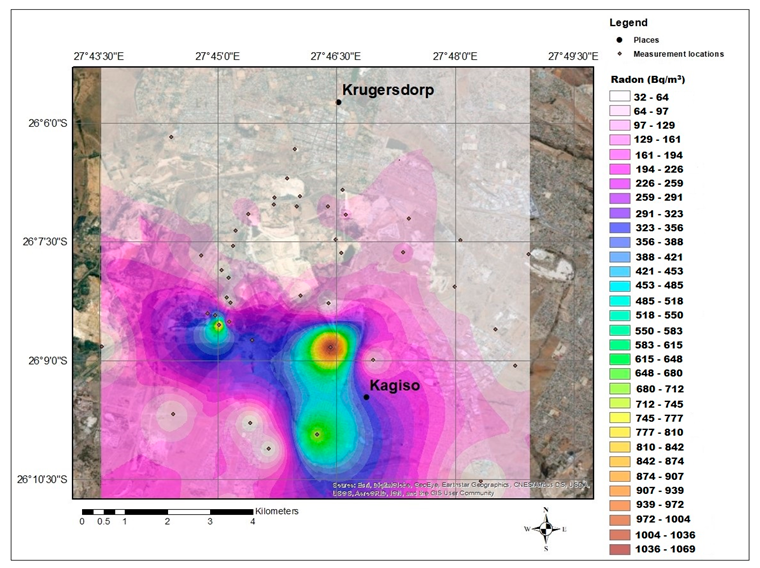
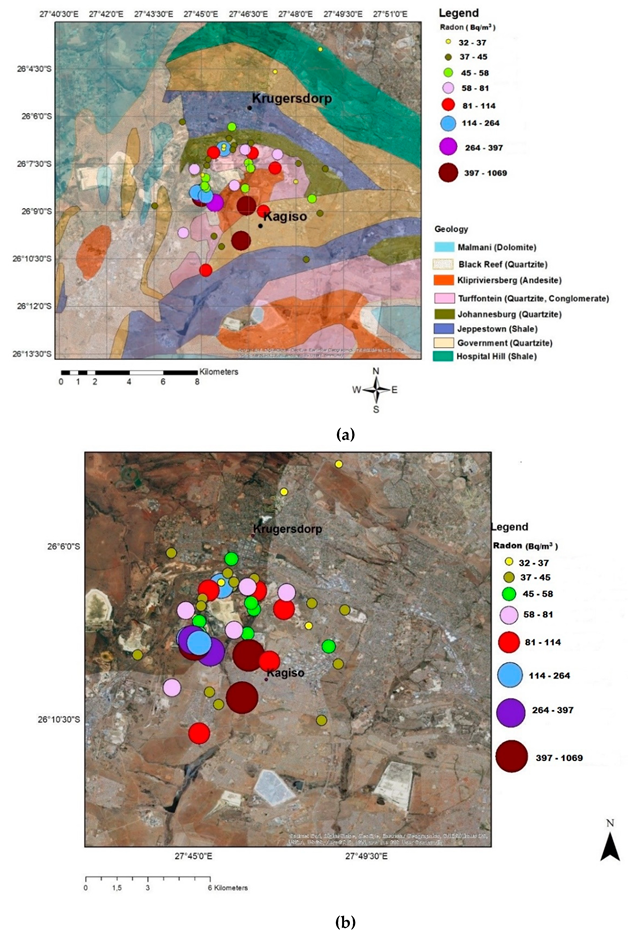
The results from spatial analysis indicated that radon concentration depicts a wide spatial variability even within relatively small areas (Figure 9). The highest radon zones are located at the central and southern parts of the study area that are largely dominated by gold mine tailings dams. These high radon areas cover the densely populated region, such as the Kagiso township, with a population of approximately 115,802. The levels spatially decrease with an increasing distance from high concentration zones, which correlates with the findings presented in Figure 5. The low radon zones are in the northern part of the study area, where the area is mostly covered by rocks. In addition, spatial analysis indicated that there are no elevated radon levels confined to any rock type (Figure 10a), but rather to the tailings dams (Figure 10b).

3.4. Indoor Radon Levels

The small-scale indoor radon results are presented in Table 3. In areas dominated by tailings dams, the levels ranged up to 174 Bq/m3, which is above the recommended value of 100 Bq/m3 [2]. Again, in the Krugersdorp area, the study documented radon levels in the range of 273 Bq/m3 [17], which also falls above the recommended values. In unexposed houses in the control areas, radon levels showed an average of 41 Bq/m3 with a maximum value of 51 Bq/m3, which is much lower when compared to the levels obtained in the mining area and falls below the recommended value of 100 Bq/m3 [2].

3.5. Effective Dose

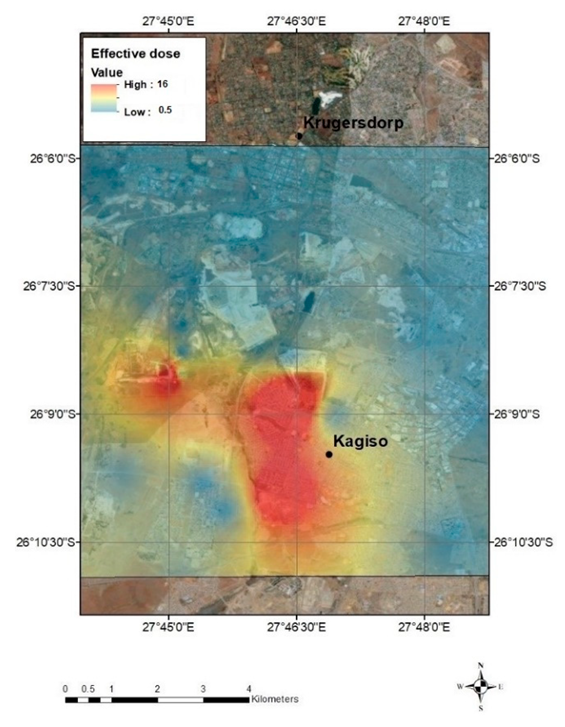
It was found that the effective dose estimated to be received by the public from outdoor exposure in different regions ranges between 0.5 mSv/y to 16 mSv/y (Figure 11). The values are highly variable such that some areas depict levels that fall within the limit of 1 mSv/y recommended for public exposure [37,38], whereas others show high effective doses exceeding the dose constraints. Exceptionally high doses coincide with areas of high radon concentration in the central and southern regions of the study area where the most densely populated residential areas are located. Therefore, these could indicate a greater probability of health problems, such as lung cancer, that is associated with substantial exposure to high radiological doses from radon.

3.6. Radon Associated Health Impacts

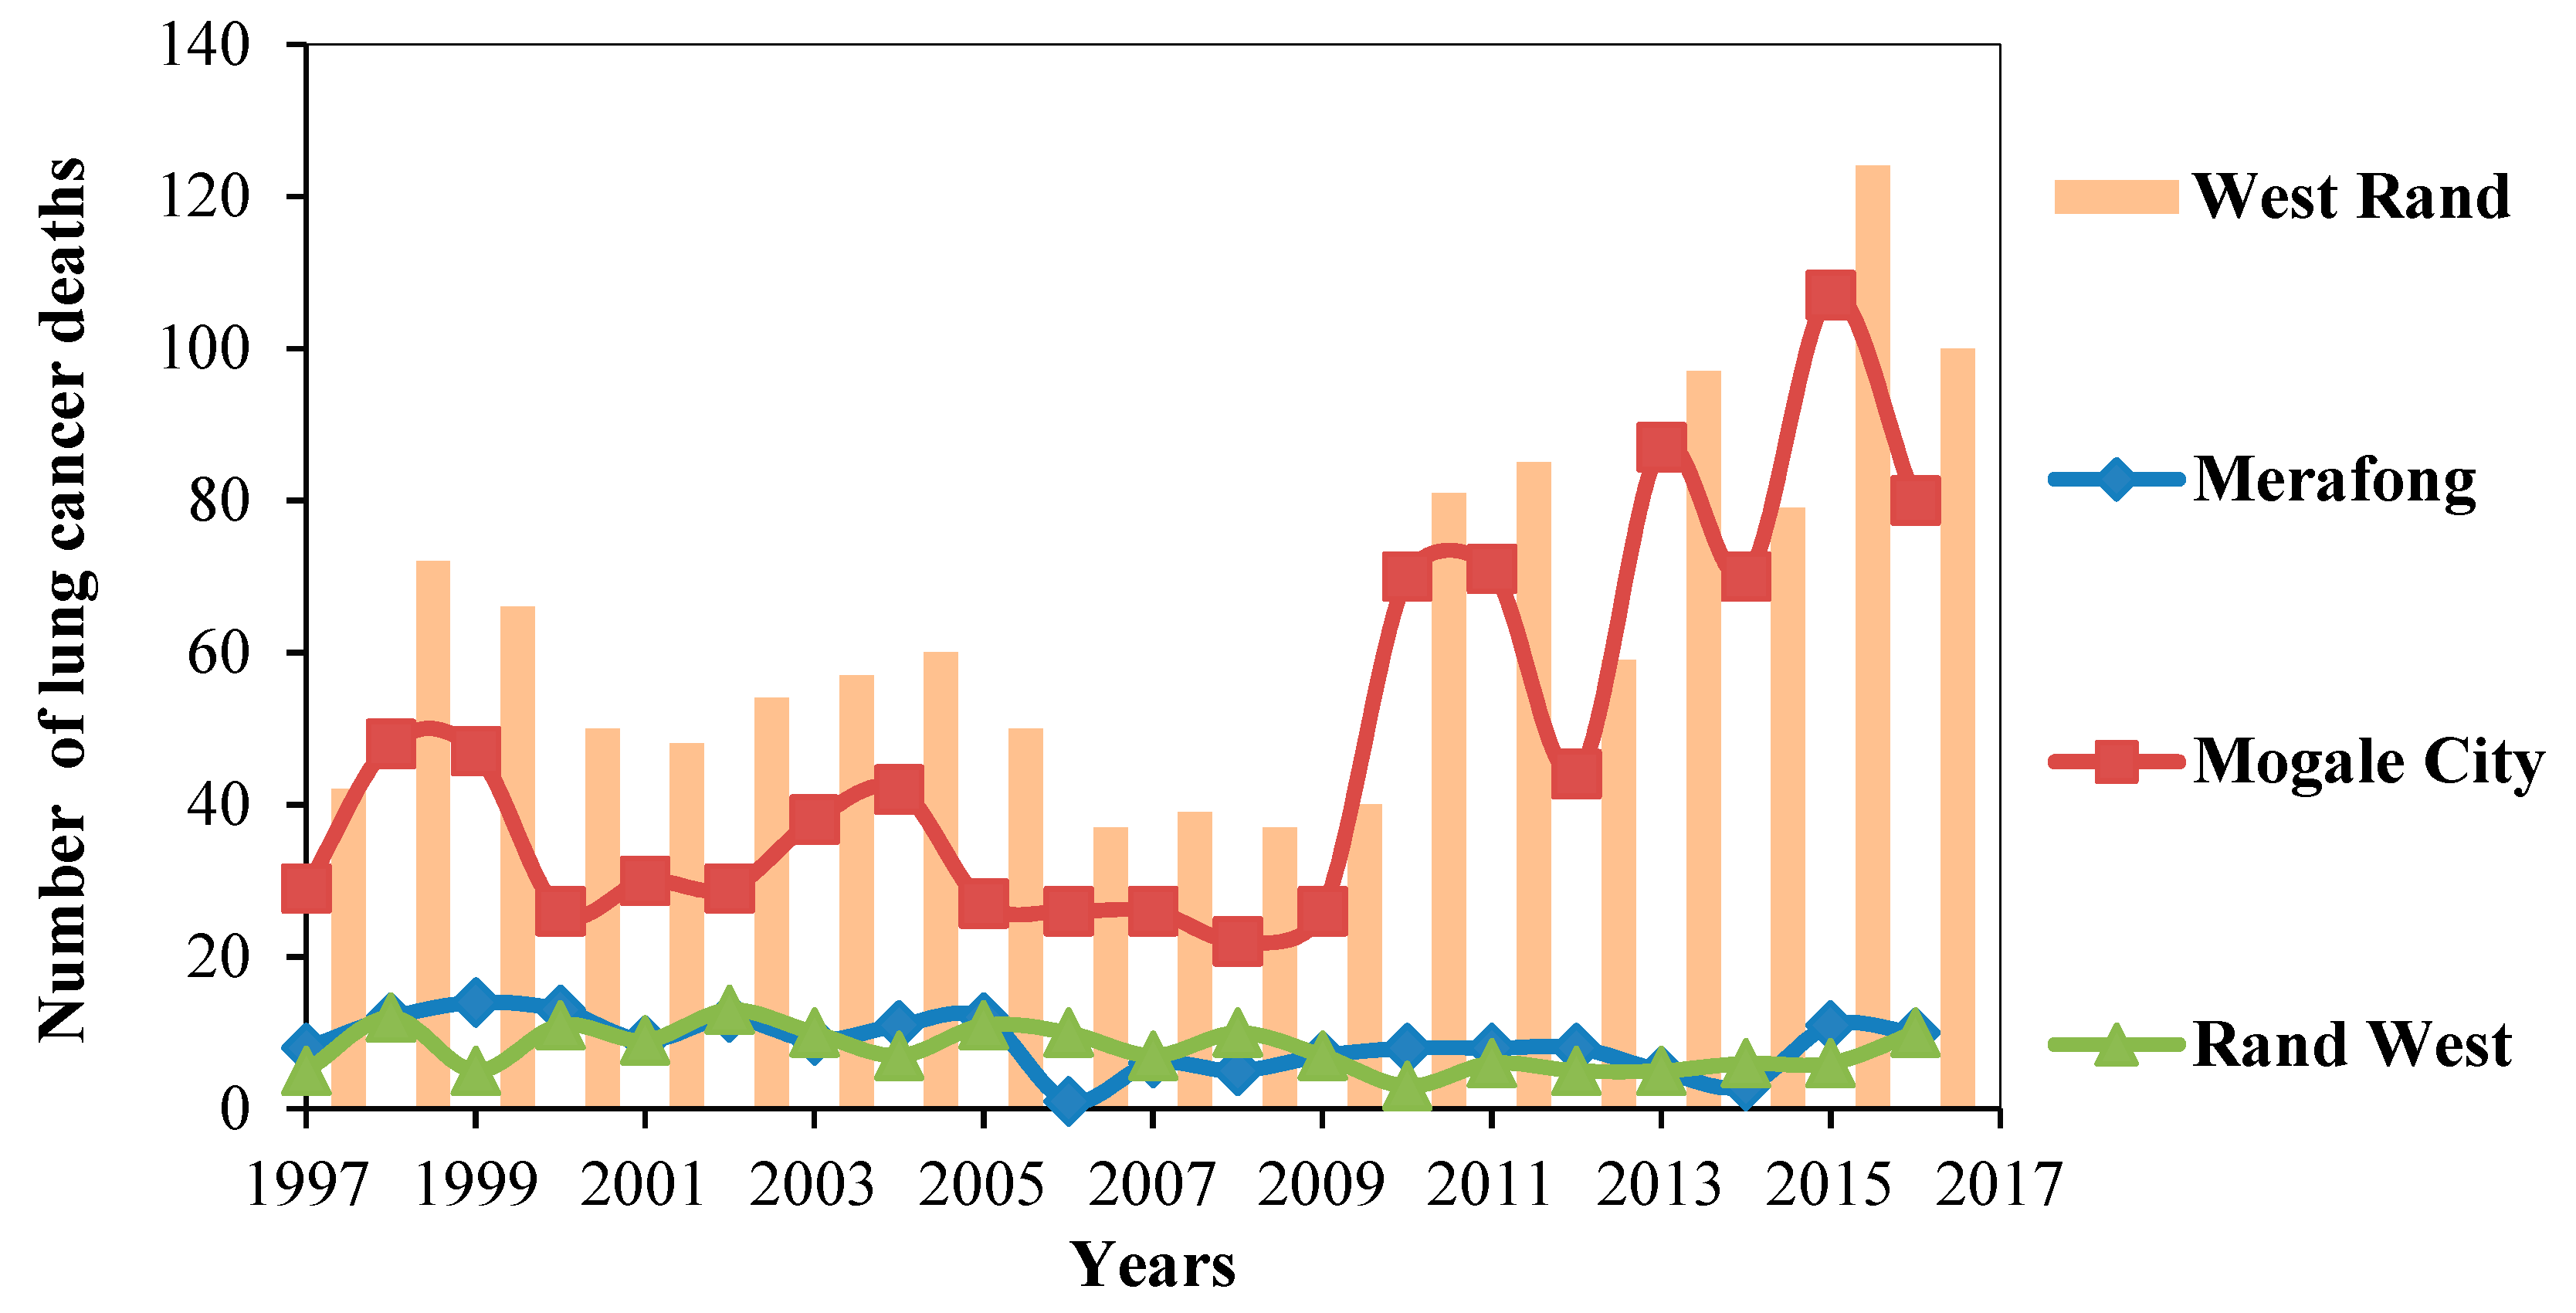
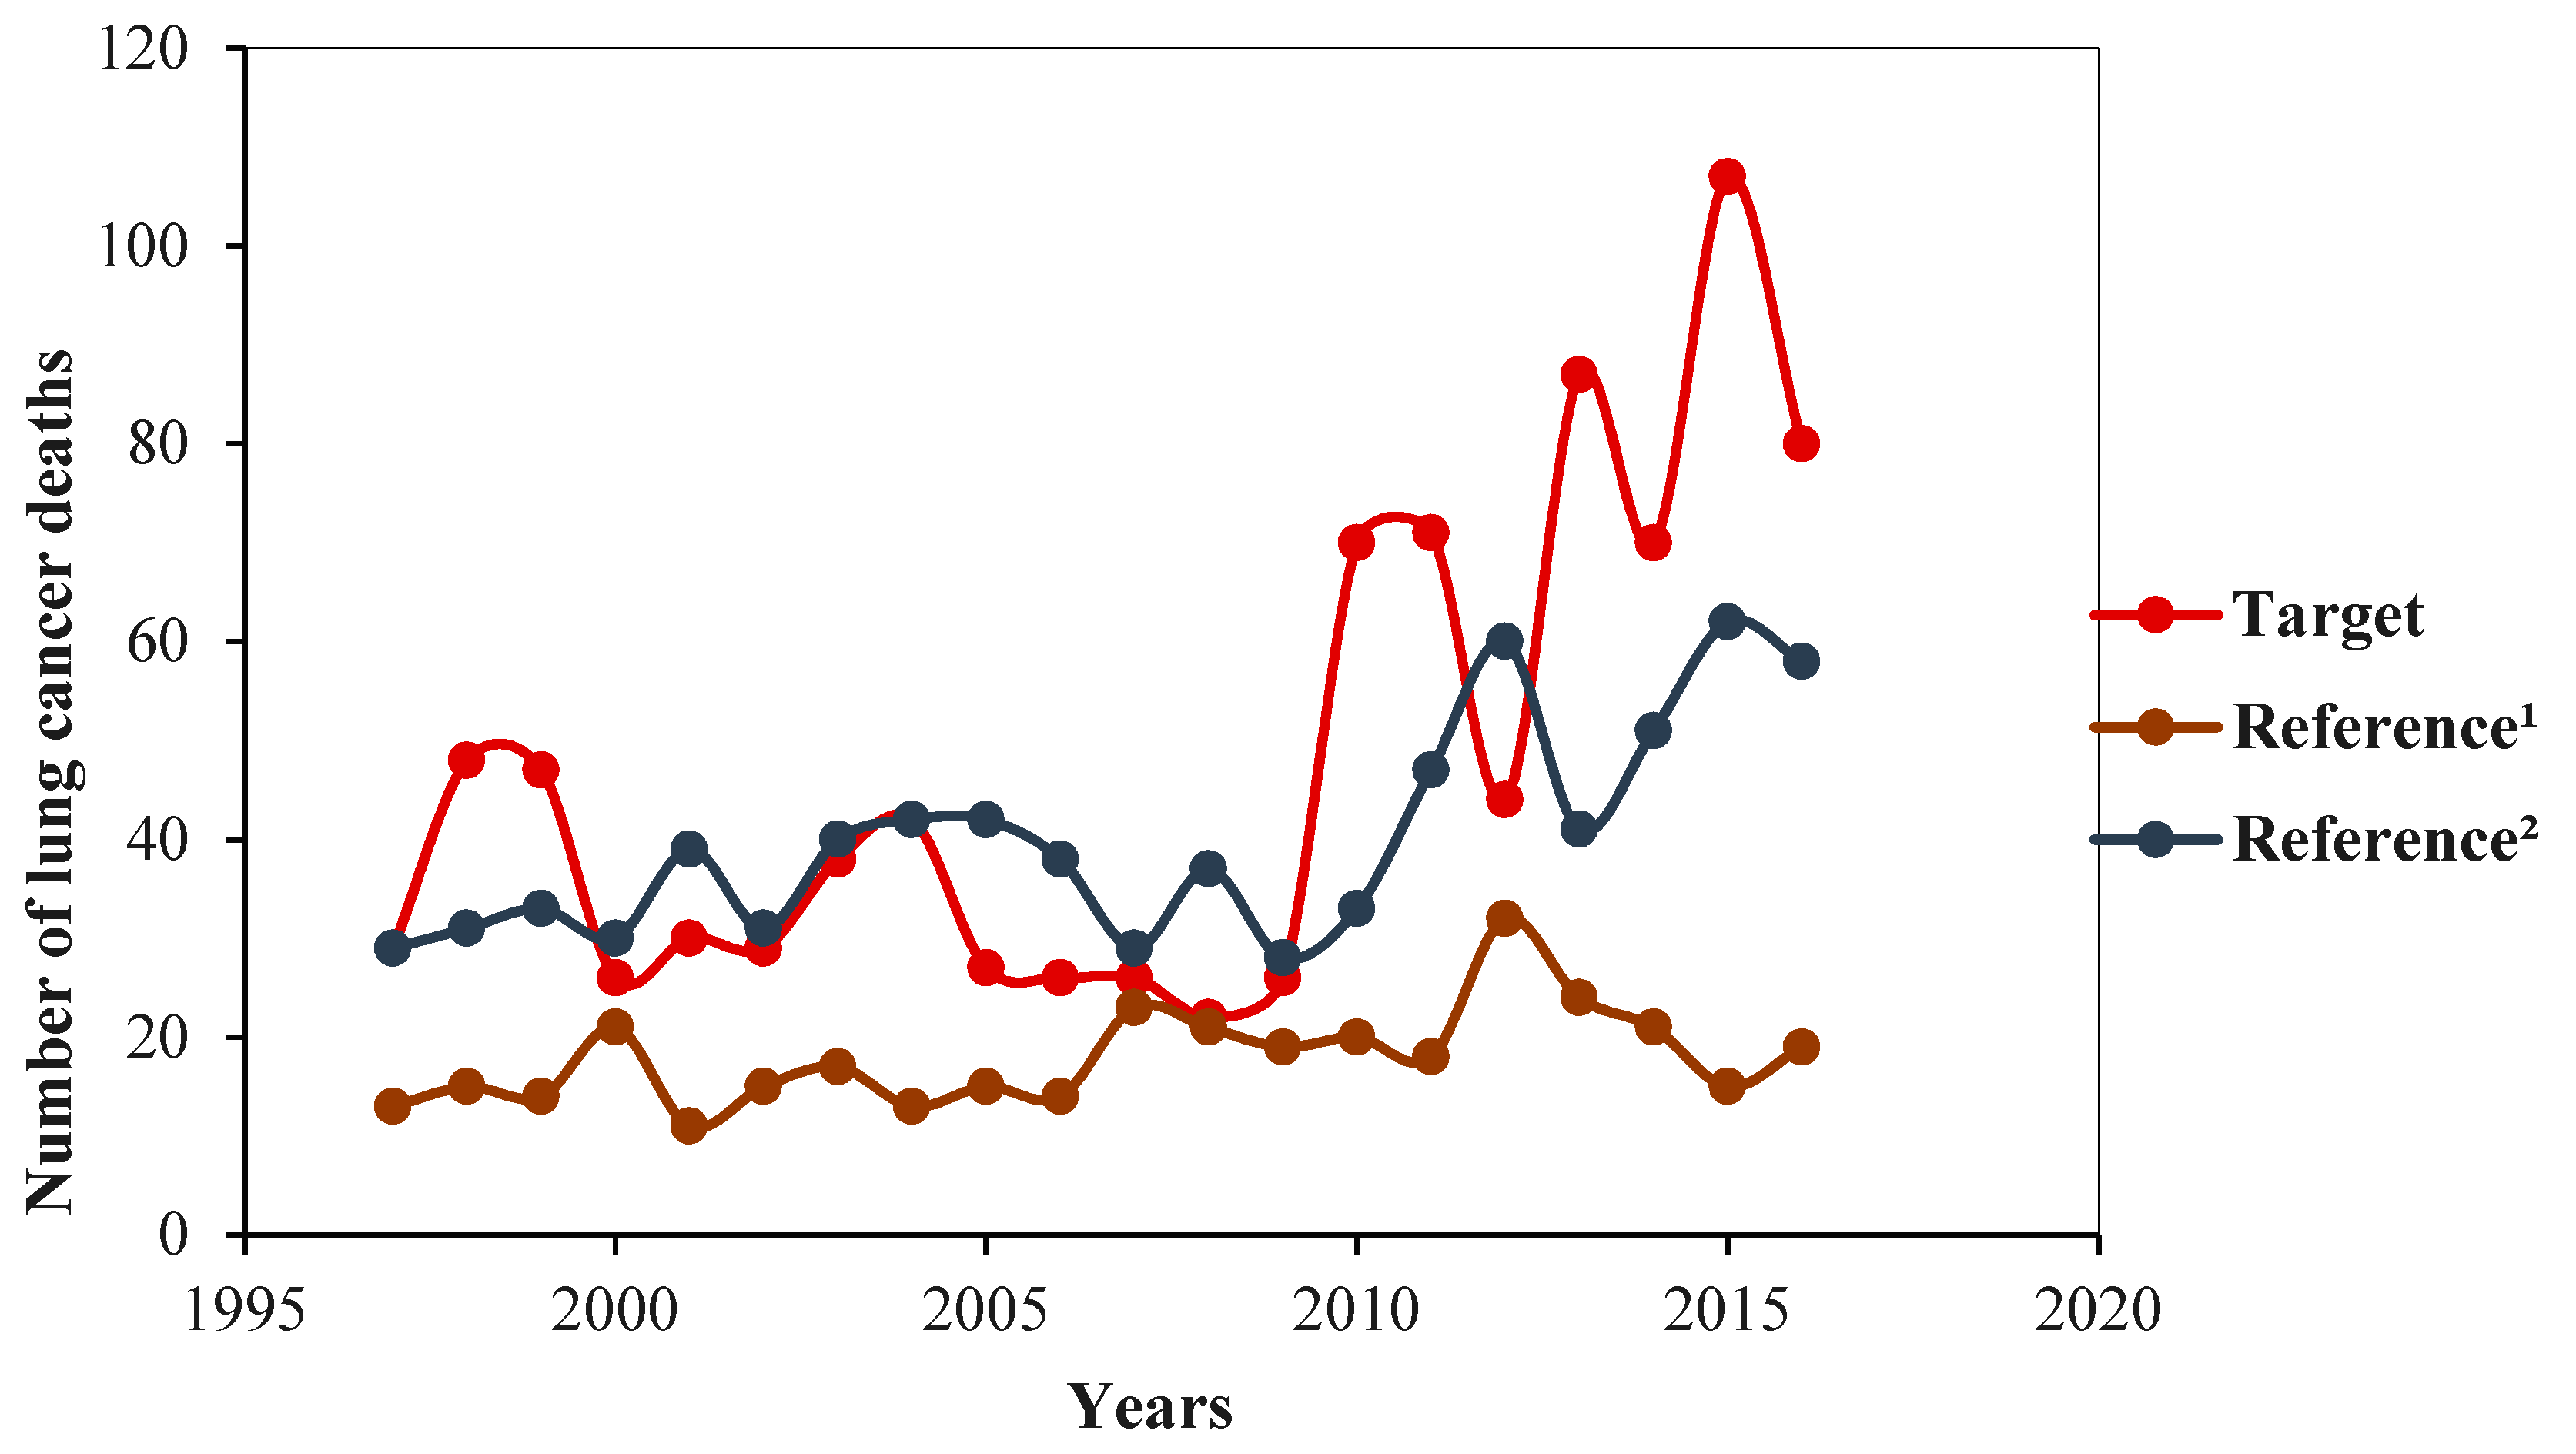
Based on the latest nationwide lung cancer cases recorded in 2014, a total of 2727 incidences were registered in South Africa by the National Cancer Registry. For the same year, a total of 79 lung cancer deaths were documented in the West Rand Municipality, of which 70 deaths occurred in the Mogale City Local Municipality, where the study area (Krugersdorp, Kagiso) is situated. In the Mogale City Local Municipality, high death rates relative to neighbouring municipalities were observed (Figure 12). The figures were comparable to the total lung cancer deaths within the West Rand Municipality as a whole. There were fluctuations throughout the years from 1997 to 2016, with increased rates from 2010 and the highest in 2015 (Figure 12). To further compare lung cancer rates and maintain the quality of the findings, municipalities in mining (target) and non-mining regions (reference sites) were compared (Figure 13). The comparative plots indicate that the highest lung cancer deaths were in the target population of the Mogale City Local Municipality as compared to the reference site with comparable demographics. Furthermore, the lung cancer deaths were generally high even when compared to the reference site with a population number that is about four times higher than that of the Mogale City Local Municipality (Figure 13).

4. Discussion

4.1. Characterisation of Prominent Radon Sources and Distribution in The Outdoor Environment

The amount of radon concentration in the environment is controlled by multiple attributes, such as the concentration of the parent radionuclide in source-terms, nature and permeability of the source, and meteorological processes [10,39,40]. To characterise prominent radon sources and controls, radon values, which originate from various measurement points, were compared with variable parameters. In this study, the overall findings showed that exceptionally higher radon levels were concentrated in tailings, and the levels decrease with an increasing distance from the tailings dominated region (Figure 5 and Figure 9). Despite the gradual decrease, radon levels in the background localities were approximately two times greater than the average levels found in control measurements (Table 2). Comparable values were expected to occur since both areas lie on similar rock types. Radon has the ability to escape readily from its potential source without any chemical interference and be widely dispersed in the air [39,40,41]. This could imply that through air circulation, the radon-rich air released from tailings probably gets dispersed to greater distances depending on wind speed and wind direction and dilute with radon-poor air in background localities. This gives a possible explanation to the elevated radon levels found in the direction opposite to the prevailing dominant wind direction (N-NNW) in relation to other directions in regions away from the mine residues dominated region (Figure 6). Spatial analysis indicated that there were no elevated radon levels confined to any rock type (Figure 10a), but rather to the tailings (Figure 10b). These findings indicate that tailings dams found to have the highest radon exhalations as the significant source with the greatest strength and have a direct input towards increasing radon levels in surrounding areas, though; the impact strongly depends upon the distance relative to tailings and atmospheric wind effects. In addition, tailings dams were found to be highly enriched with uranium (Table 1), which was the primitive parent radionuclide of radon. Although radon levels in the control areas were low when compared to levels found in tailings dams dominated regions, they showed levels that deviate sharply from the typical outdoor mean radon concentration of about 10 Bq/m3. This relation reveals that the high fraction of radon released possibly corresponds to the transuranic elements found in the rocks of the Witwatersrand Supergroup. The collected rock samples contained low values of uranium (Table 1); however, the levels obtained may not represent the whole area as sampling was limited to outcropping rocks. However, detailed geochemical studies demonstrated levels of up to 4.5 ppm for certain geological formations within the Witwatersrand Supergroup [42,43]. Studies revealed that rocks with uranium content of about 2 ppm hold great potential to results in significant radon contributions [44,45]. These observations ascertain that the rocks of the Witwatersrand Supergroup solely make significant radon contributions of about 34 Bq/m3 in the outdoor environment, which can, therefore, be characterised as the baseline value for areas with a similar geological makeup.
The uranium content in source-terms was the most important factor in determining the occurrence of radon in the environment [46,47]. The results from statistical analyses, however, indicated a weak correlation between uranium and radon (Figure 8). This could indicate that radon concentration in the environment was not solely controlled by the amount of uranium (U-238) but by the intermediary radionuclides, such as Th-234, Pa-234, U-234, Th-230, Ra-226, following the decaying order. In addition, the relationship observed could also show that the radon concentration may be proportional to the concentration of the immediate parent radium-226 radionuclide than the primitive uranium-238 radionuclide. As such, it would be more relevant for future studies to focus on detailed analysis on radium-226 in finding the relation between radon concentration and parent radionuclide, as during uranium mininglarge quantities of uranium were extracted, however not so for radium-226.

4.2. Indoor Radon Concentration

The results showed that residential areas nearby tailings dams were exposed to elevated levels of radon as compared to those away from the tailings dams (Table 3). In this study, elevated radon levels in outdoor environments were found in areas dominated by tailings dams; therefore, this could serve as the primary source to predispose dwellings to elevated radon levels since the houses are in proximity to tailings dams. The possible entry mechanism that results in high radon accumulation in indoor environments may be through the entry of radon bearing air released from tailings dams provided that favourable conditions for air exchange exist, and also through the underlying soils which may probably be enriched with radium-226 leached from tailings residues nearby. In addition, the building material used could account for substantial contributions due to their reasonable uranium content of up to 10.14 ppm, which may be associated with radium-226. Nonetheless, the amount that infiltrates into dwellings was dependent on the construction characteristics of the house and living style of inhabitants.

4.3. Radon Associated Health Impacts

The exposure to radon is considered as the ultimate cause of lung cancer in lifelong non-smokers and second among individuals who smoke [2]. Multiple studies revealed a strong positive correlation between radon and lung cancer [4,5,6,7,48,49]. The results obtained show high lung cancer rates in the Mogale City Local Municipality (MCLM) when compared to neighbouring municipalities in the West Rand area and when compared to the statistics in control areas (Figure 12 and Figure 13). The driving factor to the increased lung cancer mortality in the area could be that a large number of the population within the MCLM resides in the Kagiso area, which was characterised by high radon levels and effective doses (Figure 9 and Figure 11). To validate these findings, detailed epidemiological investigations and measurements of individual radon exposures on a large scale should be performed.

5. Conclusions

The results obtained in this study revealed that the abandoned gold and uranium mine tailings dams are responsible for elevated radon levels. This is also in agreement with the results from the geochemical analysis, whereby tailings dams contain a high concentration of uranium than the rock samples. It was also observed that factors, such as the relative distance from tailings dams and wind effects, hold a great influence on radon concentration and distribution in outdoor environments. It is evident that the atmospheric radon concentration is controlled by the interdependence of different parameters. Lung cancer deaths were found to be more common in the study area. Therefore, a detailed epidemiological study should be performed to link radon and lung cancer. The findings revealed that the radon prone areas were delineated in densely populated areas; as such, the effective management of mine waste materials is essential in the area and public awareness on radon exposure.

Author Contributions

P.M. carried out the investigation and prepared the original manuscript. T.A., H.M., and M.L. supervised the work and participated in the design of the study, field data collection and editing of the report. R.S. and M.S. provided guidelines on radon monitoring, performed the analysis, and also edited the report. All authors stated read and approved the manuscript.

Funding

This research was funded by the National Research Foundation (NRF), NRF collaborative postgraduate training programme, grant number 105294.

Acknowledgments

We thank PARC RGM for providing radon monitors and assisting in the analysis. National Cancer Registry and Statistics South Africa (StatsSA) are also acknowledged for providing valuable data. We are also grateful to the School of Geosciences for the logistical support and laboratory analysis.

Conflicts of Interest

The authors declare no conflict of interest.

References

  1. National Research Council. Health Effects of Exposure to Radon: BEIR VI; National Academies Press: Washington, DC, USA, 1999. [Google Scholar]
  2. World Health Organization. WHO Handbook on Indoor Radon: A Public Health Perspective; World Health Organization: Geneva, Switzerland, 2009. [Google Scholar]
  3. Darby, S.; Hill, D.; Doll, R. Radon: A likely carcinogen at all exposures. Ann. Oncol. 2001, 12, 1341–1351. [Google Scholar] [CrossRef] [PubMed]
  4. National Research Council. Health Risks of Radon and Other Internally Deposited Alpha-Emitters. In Health Risks of Radon and Other Internally Deposited Alpha-Emitters; National Academies Press: Washington, DC, USA, 1988. [Google Scholar]
  5. Samet, J.M. Radon and lung cancer. J. Natl. Cancer Inst. 1989, 81, 745–758. [Google Scholar] [CrossRef] [PubMed]
  6. Lubin, J.H.; Boice, J.D., Jr.; Edling, C.; Hornung, R.W.; Howe, G.R.; Kunz, E.; Kusiak, R.A.; Morrison, H.I.; Radford, E.P.; Samet, J.M.; et al. Lung cancer in radon-exposed miners and estimation of risk from indoor exposure. J. Natl. Cancer Inst. 1995, 87, 817–827. [Google Scholar] [CrossRef] [PubMed]
  7. Darby, S.; Hill, D.; Deo, H.; Auvinen, A.; Barros-Dios, J.M.; Baysson, H.; Bochicchio, F.; Falk, R.; Farchi, S.; Figueiras, A.; et al. Residential radon and lung cancer—Detailed results of a collaborative analysis of individual data on 7148 persons with lung cancer and 14,208 persons without lung cancer from 13 epidemiologic studies in Europe. Scand. J. Work. Environ. Heal. 2006, 32, 1–83. [Google Scholar]
  8. Chen, J.; Moir, D.; Whyte, J. Canadian population risk of radon induced lung cancer: A re-assessment based on the recent cross-Canada radon survey. Radiat. Prot. Dosim. 2012, 152, 9–13. [Google Scholar] [CrossRef] [PubMed]
  9. Ishimori, Y.; Lange, K.; Martin, P.; Mayya, Y.S.; Phaneuf, M. Measurement and Calculation of Radon Releases from NORM Residues; International Atomic Energy Agency: Vienna, Austria, 2013. [Google Scholar]
  10. Porstendorfer, J. Properties and behaviour of radon and thoron and their decay products in the air. J. Aerosol Sci. 1994, 25, 219–263. [Google Scholar] [CrossRef]
  11. United Nations Scientific Committee on the Effects of Atomic Radiation. United Nations Scientific Committee on the effects of Atomic Radiation. Sources and effects of ionizing radiation. Sources Eff. Ioniz. Radiat. 2000, 2. [Google Scholar]
  12. National Research Council. Board on Radiation Effects Research National Research Council. In Evaluation of Guidelines for Exposures to Technologically Enhanced Naturally Occurring Radioactive Materials; National Academy Press: Washington, DC, USA, 1999. [Google Scholar]
  13. Cecil, L.D.; Green, J.R. Radon-222. In Environmental Tracers in Subsurface Hydrology; Springer: Boston, MA, USA, 2000; pp. 175–194. [Google Scholar]
  14. Matooane, M.; Phala, N.; Wright, C.Y.; Oosthuizen, M.A. Risk perceptions of dust and its impacts among communities living in a mining area of the Witwatersrand, South Africa. Clean. Air J. 2014, 24, 22–27. [Google Scholar]
  15. Bench Marks Foundation. Waiting to inhale it. In A Survey of Household Health in Four Mine Affected Communities; Soweto Report; Policy Gap 12 Bench Marks Foundation: Johannesburg, South Africa, 2017. [Google Scholar]
  16. Leuschner, A.H.; Van As, D.; Grundling, A.; Steyn, A. A Survey of Indoor Exposure to Radon in South Africa. 1989. Available online: https://www.cleanairjournal.org.za/download/aleuschner_et_al_1989.pdf (accessed on 24 October 2019).
  17. Leuschner, A.H.; Steyn, A.; Strydom, R.; De Beer, G.P. Indoor radon concentrations in South African homes. In Proceedings of the 8. International congress of the International Radiation Protection Association (IRPA8), Montreal, QC, Canada, 17–22 May 1992. [Google Scholar]
  18. Lindsay, R.; Newman, R.; Speelman, W. A study of airborne radon levels in Paarl houses (South Africa) and associated source terms, using electret ion chambers and gamma-ray spectrometry. Appl. Radiat. Isot. 2008, 66, 1611–1614. [Google Scholar] [CrossRef]
  19. Kamunda, C.; Mathuthu, M.; Madhuku, M. Determination of Radon in mine dwellings of gauteng province of South Africa using AlphaGUARD radon professional monitor. J. Environ. Toxicol. Stud. 2017, 1. [Google Scholar]
  20. Lindsay, R.; De Meijer, R.; Maleka, P.; Newman, R.; Motlhabane, T.; De Villiers, D. Monitoring the radon flux from gold-mine dumps by γ-ray mapping. Nucl. Instrum. Methods Phys. Res. Sect. B Beam Interact. Mater. Atoms 2004, 213, 775–778. [Google Scholar] [CrossRef]
  21. Lindsay, R.; De Meijer, R.J.; Joseph, A.D.; Motlhabane, T.G.; Newman, R.T.; Tsela, S.A.; Speelman, W.J. Measurement of radon exhalation from a gold-mine tailings dam by gamma-ray mapping. Radiat. Phys. Chem. 2004, 71, 797–798. [Google Scholar] [CrossRef]
  22. Speelman, W.J. Modelling and Measurement of Radon Diffusion through Soil for Application on Mine Tailings Dam. Ph.D. Thesis, University of the Western Cape, Cape Town, South Africa, 2004. [Google Scholar]
  23. Ongori, J.N.; Lindsay, R.; Newman, R.T.; Maleka, P.P. Determining the radon exhalation rate from a gold mine tailings dump by measuring the gamma radiation. J. Environ. Radioact. 2015, 140, 16–24. [Google Scholar] [CrossRef] [PubMed]
  24. Pretorius, D.A. The nature of the Witwatersrand gold-uranium deposits. Handb. Strat. Stratif. Ore depos. 1976, 7, 29–88. [Google Scholar]
  25. Robb, L.J.; Meyer, F. The Witwatersrand Basin, South Africa: Geological framework and mineralization processes. Ore Geol. Rev. 1995, 10, 67–94. [Google Scholar] [CrossRef]
  26. Robb, L.J.; Charlesworth, E.G.; Drennan, G.R.; Gibson, R.L.; Tongu, E.L. Tectono-metamorphic setting and paragenetic sequence of Au-U mineralisation in the Archaean Witwatersrand Basin, South Africa. Aust. J. Earth Sci. 1997, 44, 353–371. [Google Scholar] [CrossRef]
  27. Els, B.G.; Berg, W.A.V.D.; Mayer, J.J. The Black Reef Quartzite Formation in the western Transvaal: Sedimentological and economic aspects, and significance for basin evolution. Miner. Deposita 1995, 30, 112–123. [Google Scholar] [CrossRef]
  28. Coward, M.P.; Spencer, R.M.; Spencer, C.E. Development of the Witwatersrand Basin, South Africa. Geol. Soc. Lond. Spec. Publ. 1995, 95, 243–269. [Google Scholar] [CrossRef]
  29. Abiye, T.A. Provenance of groundwater in the crystalline aquifer of Johannesburg area, South Africa. Int. J. Phys. Sci. 2011, 6, 98–111. [Google Scholar]
  30. Abiye, T.A.; Mengistu, H.; Demlie, M.B. Groundwater Resource in the Crystalline Rocks of the Johannesburg Area, South Africa. J. Water Resour. Prot. 2011, 3, 199–212. [Google Scholar] [CrossRef] [Green Version]
  31. Abiye, T.; Masindi, K.; Mengistu, H.; Demlie, M. Understanding the groundwater-level fluctuations for better management of groundwater resource: A case in the Johannesburg region. Groundw. Sustain. Dev. 2018, 7, 1–7. [Google Scholar] [CrossRef]
  32. Barnard, H.C. An Explanation of the 1: 500 000 General Hydrogeological Map: Johannesburg 2526; Department of Water Affairs and Forestry: Pretoria, South Africa, 2000. [Google Scholar]
  33. ICRP. Lung cancer risk from radon and progeny and statement on radon. ICRP publication 115. Ann. ICRP 2010, 40, 1–64. [Google Scholar] [CrossRef] [PubMed]
  34. Rosner, T. The Environmental Impact of Seepage from Gold Mine Tailings Dams Near Johannesburg, South Africa. Ph.D. Thesis, University of Pretoria, Pretoria, South Africa, 1999. [Google Scholar]
  35. Zhuo, W.; Furukawa, M.; Guo, Q.; Kim, Y.S. Soil radon flux and outdoor radon concentrations in East Asia. Int. Congr. Ser. 2005, 1276, 285–286. [Google Scholar] [CrossRef]
  36. Murty, V.; King, J.; Karunakara, N.; Raju, V. Indoor and outdoor radon levels and its diurnal variations in Botswana. Nucl. Instrum. Methods Phys. Res. Sect. A Accel. Spectrom. Detect. Assoc. Equip. 2010, 619, 446–448. [Google Scholar] [CrossRef]
  37. National Nuclear Regulator. Act 47 of 1999, and Regulations. 1999. Available online: http://www.nnr.co.za/wp-content/uploads/2018/07/NNR-ARISTA-disc-clich%C3%A9_3_PRINT.pdf (accessed on 19 November 2018).
  38. ICRP. Radiological protection in geological disposal of long-lived solid radioactive waste. ICRP publication 122. Ann. ICRP 2013, 42, 1–57. [Google Scholar] [CrossRef]
  39. Ball, T.K.; Cameron, D.G.; Colman, T.B.; Roberts, P.D. Behaviour of radon in the geological environment: A review. Q. J. Eng. Geol. Hydrogeol. 1991, 24, 169–182. [Google Scholar] [CrossRef]
  40. Otton, J.K.; Gundersen, L.C.S.; Schumann, R. The Geology of Radon; US Geological Survey: Reston, VA, USA, 1992.
  41. Levin, M.; Verhagen, B. Application of isotope techniques to trace location of leakage from dams and reservoirs. In The Use of Isotope Hydrology to Characterize and Assess Water Resources in South (ERN) Africa; Abiye, T., Ed.; Water Research Commission: Pretoria, South Africa, 2013; pp. 9–23. [Google Scholar]
  42. Wronkiewicz, D.J.; Condie, K.C. Geochemistry of Archean shales from the Witwatersrand Supergroup, South Africa: Source-area weathering and provenance. Geochim. Cosmochim. Acta 1987, 51, 2401–2416. [Google Scholar] [CrossRef]
  43. Wronkiewicz, D.J.; Condie, K.C. Geochemistry and mineralogy of sediments from the Ventersdorp and Transvaal Supergroups, South Africa: Cratonic evolution during the early Proterozoic. Geochim. Cosmochim. Acta 1990, 54, 343–354. [Google Scholar] [CrossRef]
  44. Gundersen, L.C.; Schumann, R.R.; Otton, J.K.; Dubiel, R.F.; Owen, D.E.; Dickinson, K.A. Geology of radon in the United States. Geol. Soc. Am. Spec. Pap. 1992, 271, 1–6. [Google Scholar]
  45. Drolet, J.-P.; Martel, R.; Poulin, P.; Dessau, J.-C.; Lavoie, D.; Parent, M.; Lévesque, B. An approach to define potential radon emission level maps using indoor radon concentration measurements and radiogeochemical data positive proportion relationships. J. Environ. Radioact. 2013, 124, 57–67. [Google Scholar] [CrossRef]
  46. Ielsch, G.; Thieblemont, D.; Labed, V.; Richon, P.; Tymen, G.; Ferry, C.; Robe, M.C.; Baubron, J.C.; Bechennec, F. Radon (222Rn) level variations on a regional scale: Influence of the basement trace element (U, Th) geochemistry on radon exhalation rates. J. Environ. Radioact. 2001, 53, 75–90. [Google Scholar] [CrossRef]
  47. Sharma, D.; Kumar, A.; Kumar, M.; Singh, S. Study of uranium, radium and radon exhalation rate in soil samples from some areas of Kangra district, Himachal Pradesh, India using solid-state nuclear track detectors. Radiat. Meas. 2003, 36, 363–366. [Google Scholar] [CrossRef]
  48. Darby, S.; Hill, D.; Auvinen, A.; Barros-Dios, J.M.; Baysson, H.; Bochicchio, F.; Deo, H.; Falk, R.; Forastiere, F.; Hakama, M.; et al. Radon in homes and risk of lung cancer: Collaborative analysis of individual data from 13 European case-control studies. BMJ 2005, 330, 223. [Google Scholar] [CrossRef] [PubMed]
  49. Krewski, D.; Lubin, J.H.; Zielinski, J.M.; Alavanja, M.; Catalan, V.S.; Field, R.W.; Klotz, J.B.; Letourneau, E.G.; Lynch, C.F.; Lyon, J.L.; et al. A Combined Analysis of North American Case-Control Studies of Residential Radon and Lung Cancer. J. Toxicol. Environ. Heal. Part A 2006, 69, 533–597. [Google Scholar] [CrossRef] [PubMed] [Green Version]
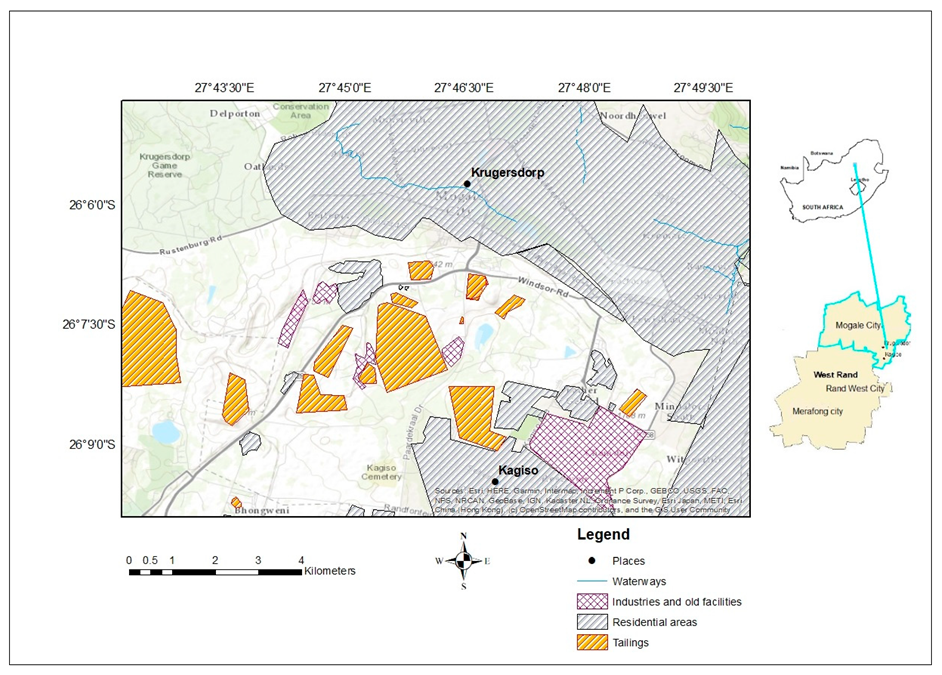
Figure 1. Location of the study area.
Geosciences 09 00466 g001
Figure 2. Local geology of the study area.
Geosciences 09 00466 g002
Figure 3. Radon gas monitor (RGMS).
Geosciences 09 00466 g003
Figure 4. Tailings dam found in the study area contributing to high radon levels.
Geosciences 09 00466 g004
Figure 5. Average radon concentration as a function of distance from the closest tailings residues (where d = 0 m is the location of the tailings dominated region).
Geosciences 09 00466 g005
Figure 6. Distribution of radon (Bq/m3) in different directions from the tailings dominated region, which is denoted as the central point on the plot.
Geosciences 09 00466 g006
Figure 7. A histogram plot presenting outdoor radon concentration.
Geosciences 09 00466 g007
Figure 8. Regression analysis results showing a correlation between uranium and radon.
Geosciences 09 00466 g008
Figure 9. Radon spatial distribution in the study area represented in Bq/m3.
Geosciences 09 00466 g009
Figure 10. (a) Radon (Bq/m3) distribution in relation to the underlying geology; (b) Radon (Bq/m3) distribution in relation to tailings dams.
Geosciences 09 00466 g010
Figure 11. Spatial distribution map of effective doses (mSv/y) received by the population in the area from outdoor exposure.
Geosciences 09 00466 g011
Figure 12. Lung cancer deaths in various municipalities of the West Rand, whereby the Mogale City Local Municipality show higher rates than Merafong and Rand West Local Municipality (Data source: StatsSA).
Geosciences 09 00466 g012
Figure 13. Comparison between lung cancer deaths in both radon exposed and non-exposed areas. Target—Mogale City with a population of about (362,421) in the West Rand, where the study area is located. Reference site1—Joe Gqabi district municipality away from mining activities with a comparable population number to the exposed region (349,768) (Data source: StatsSA); Reference site2—The highly populated OR Tambo district municipality away from mining activities with population number (1,364,943) (Data source: StatsSA).
Geosciences 09 00466 g013
Table 1. Uranium and thorium concentration found in tailings and rock samples collected in the study area.
Elements
(ppm)
Tailings Samples Collected in the Field
PB01TPB02TPB03TPB04TPB07TPB09TPB10TPB11TPB12TPB15TPB19T/BPB19T/BMeanSD
U42.6551.027.3874.328.0315.8817.470.01113.79149.7685.940.2548.8748.09
Th13.4112.530.0112.0611.38.007.860.0190.6115.0029.460.0116.6924.67
Elements
(ppm)
Rock samples collected in the field
PB01RPB04RPB07RPB08RPB10RPB12RPB14RPB16RPB17RPB18R MeanSD
U0.010.010.010.010.011.40.010.010.010.01 0.150.44
Th0.012.90.390.650.014.470.010.011.263.11 1.281.63
ppm is parts per million. SD stands for standard deviation.
Table 2. Outdoor radon levels measured in Krugersdorp and surrounding areas, all reported in Bq/m3.
Measurement LocationNo of MeasurementsRangeArithmetic MeanGeometric MeanMedianStandard Deviation
Directly on tailings 1937–1069 1879358298
Proximity to tailings1332–33386655085
All background measurements740–6881487742240
Background (exclusion to outlier)640–11158534328
Control330ؘ–373434353
All measurements (except controls)3932–10691478055236
Table 3. Indoor radon levels obtained in occupied dwellings at various locations.
ExposedRangeMean
222Rn (Bq/m3)37–174 105
Unexposed
222Rn (Bq/m3)30–51 41
Exposed: Houses located near tailings (±1 km); Unexposed: Houses located far away from tailings (±30 km).