Naturally Occurring Potentially Harmful Elements in Groundwater in Makueni County, South-Eastern Kenya: Effects on Drinking Water Quality and Agriculture
Abstract
1. Introduction
2. Materials and Methods
2.1. Study Area
2.1.1. Location, Population, and Water Supply
2.1.2. Physiography and Climate
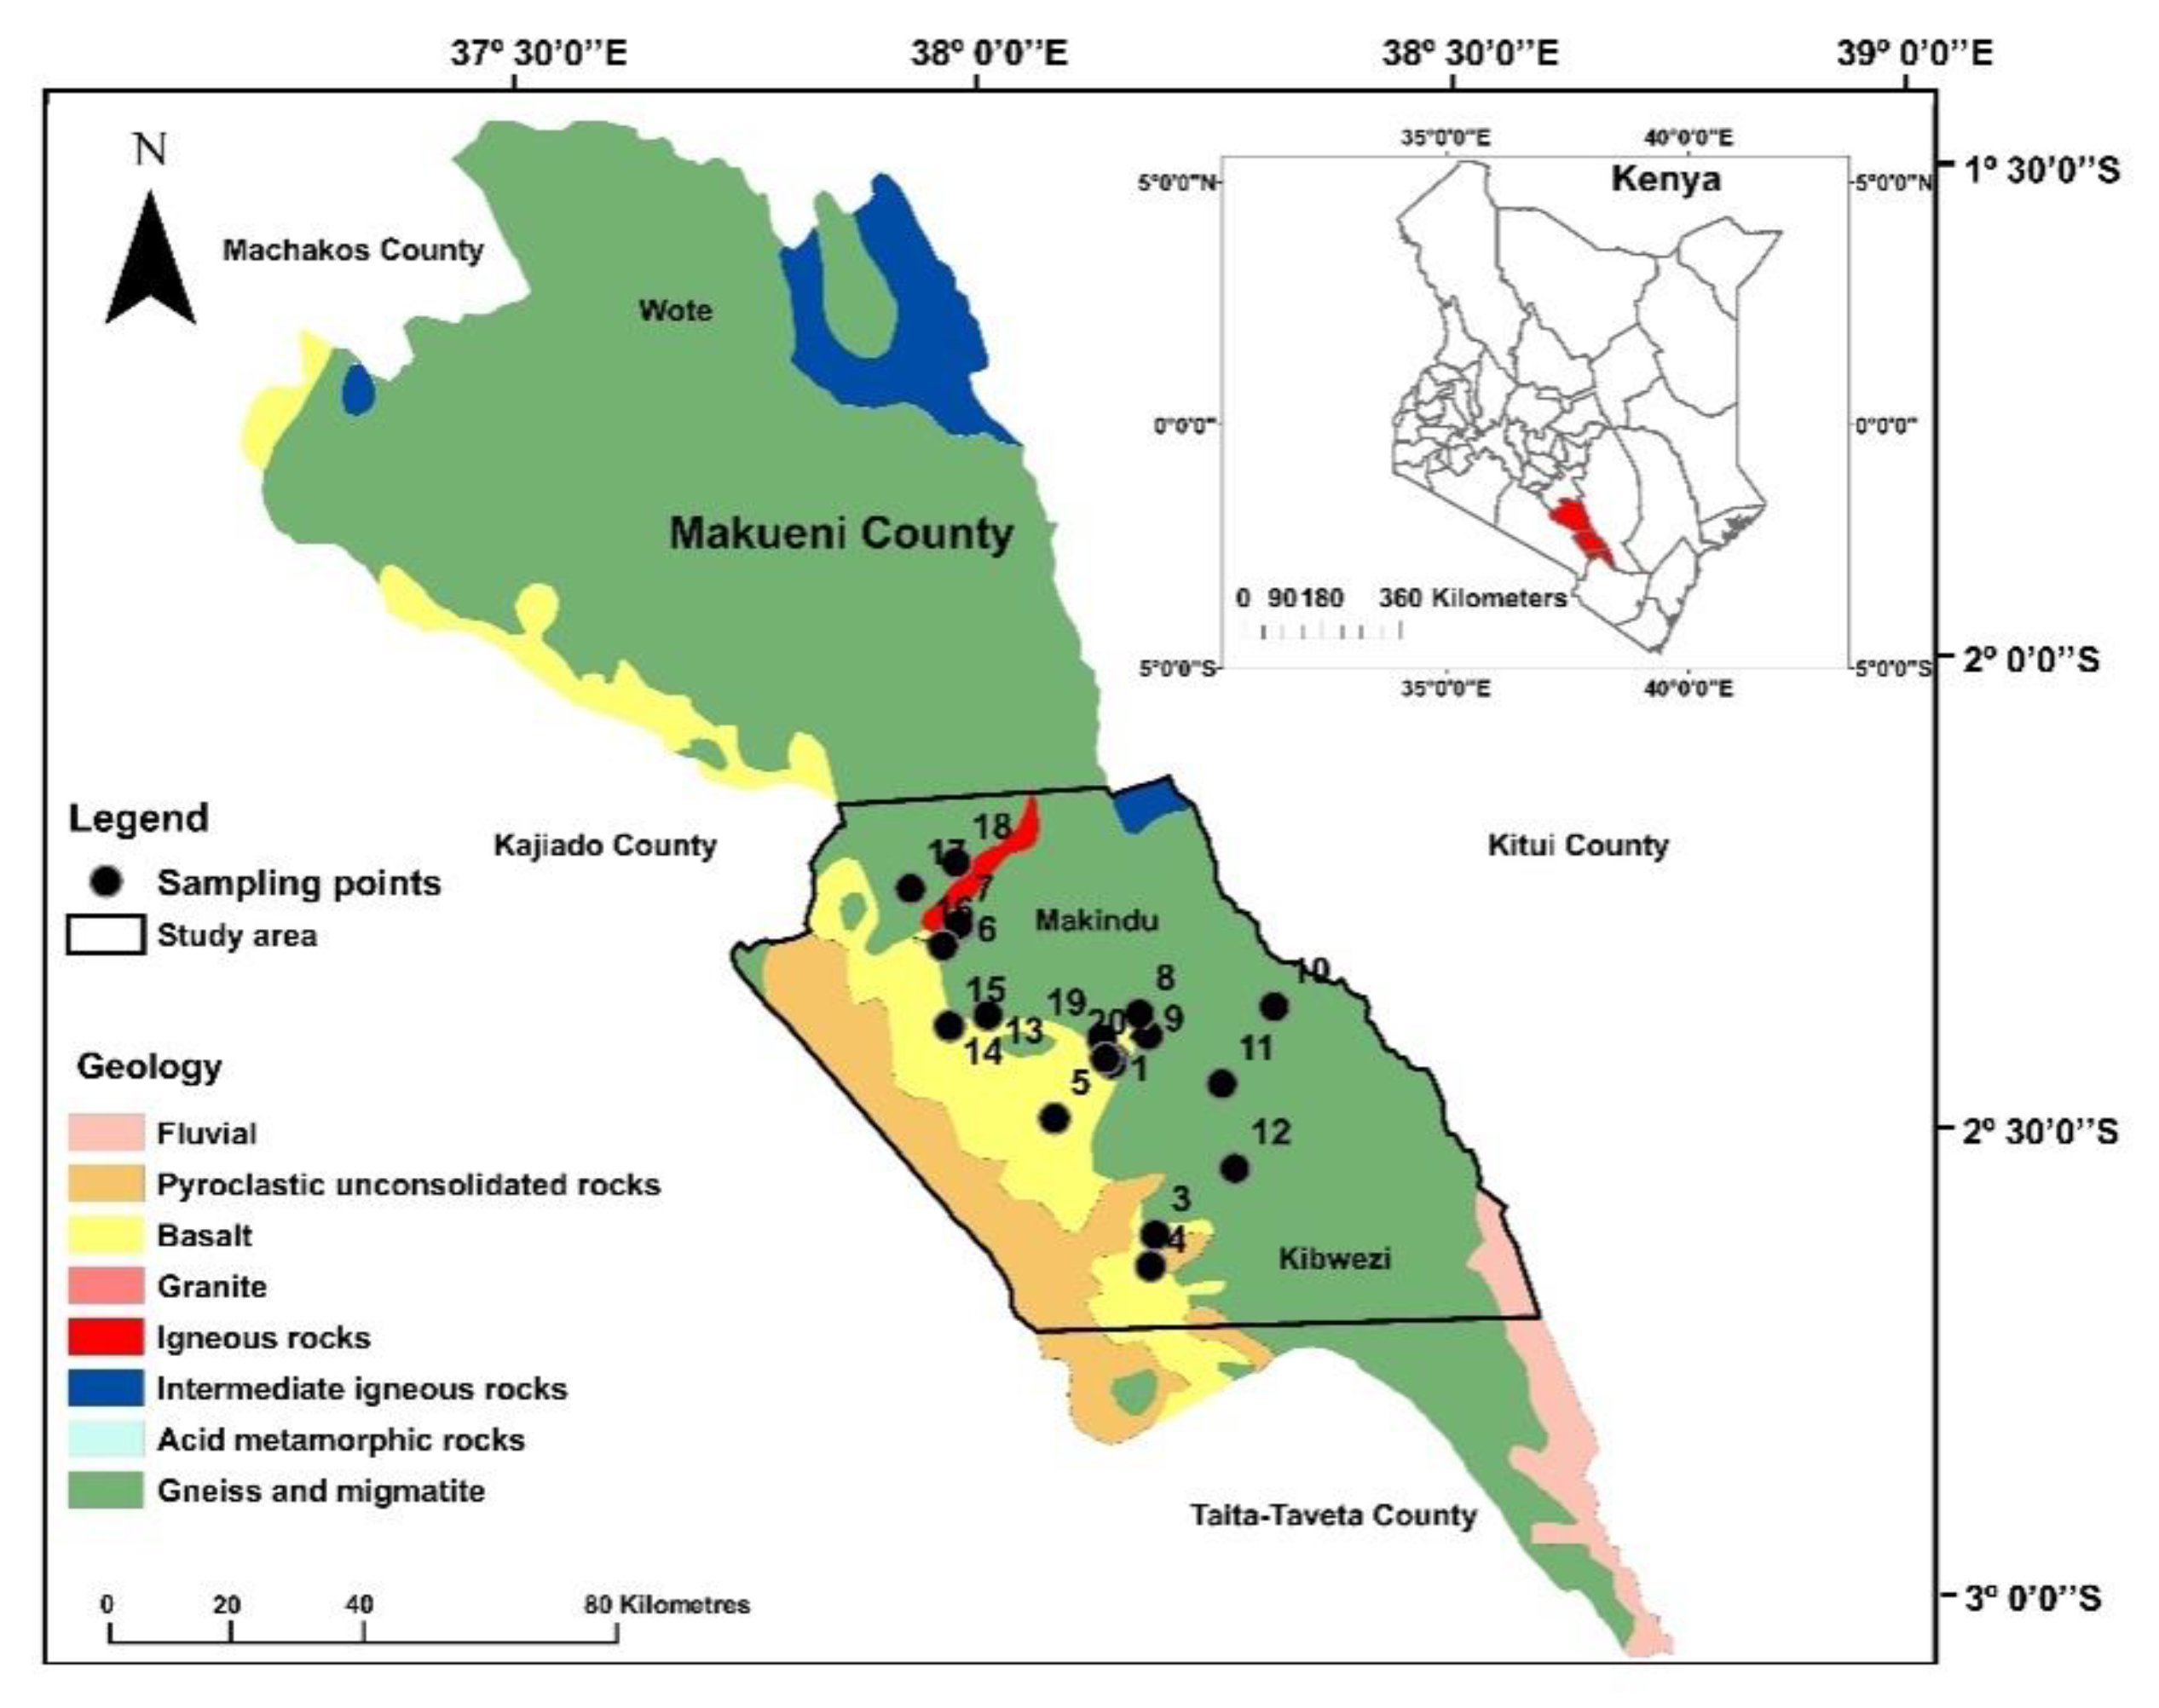
2.2. Geology and Hydrogeology
2.3. Sampling and Analysis
2.4. Data Analysis
3. Results
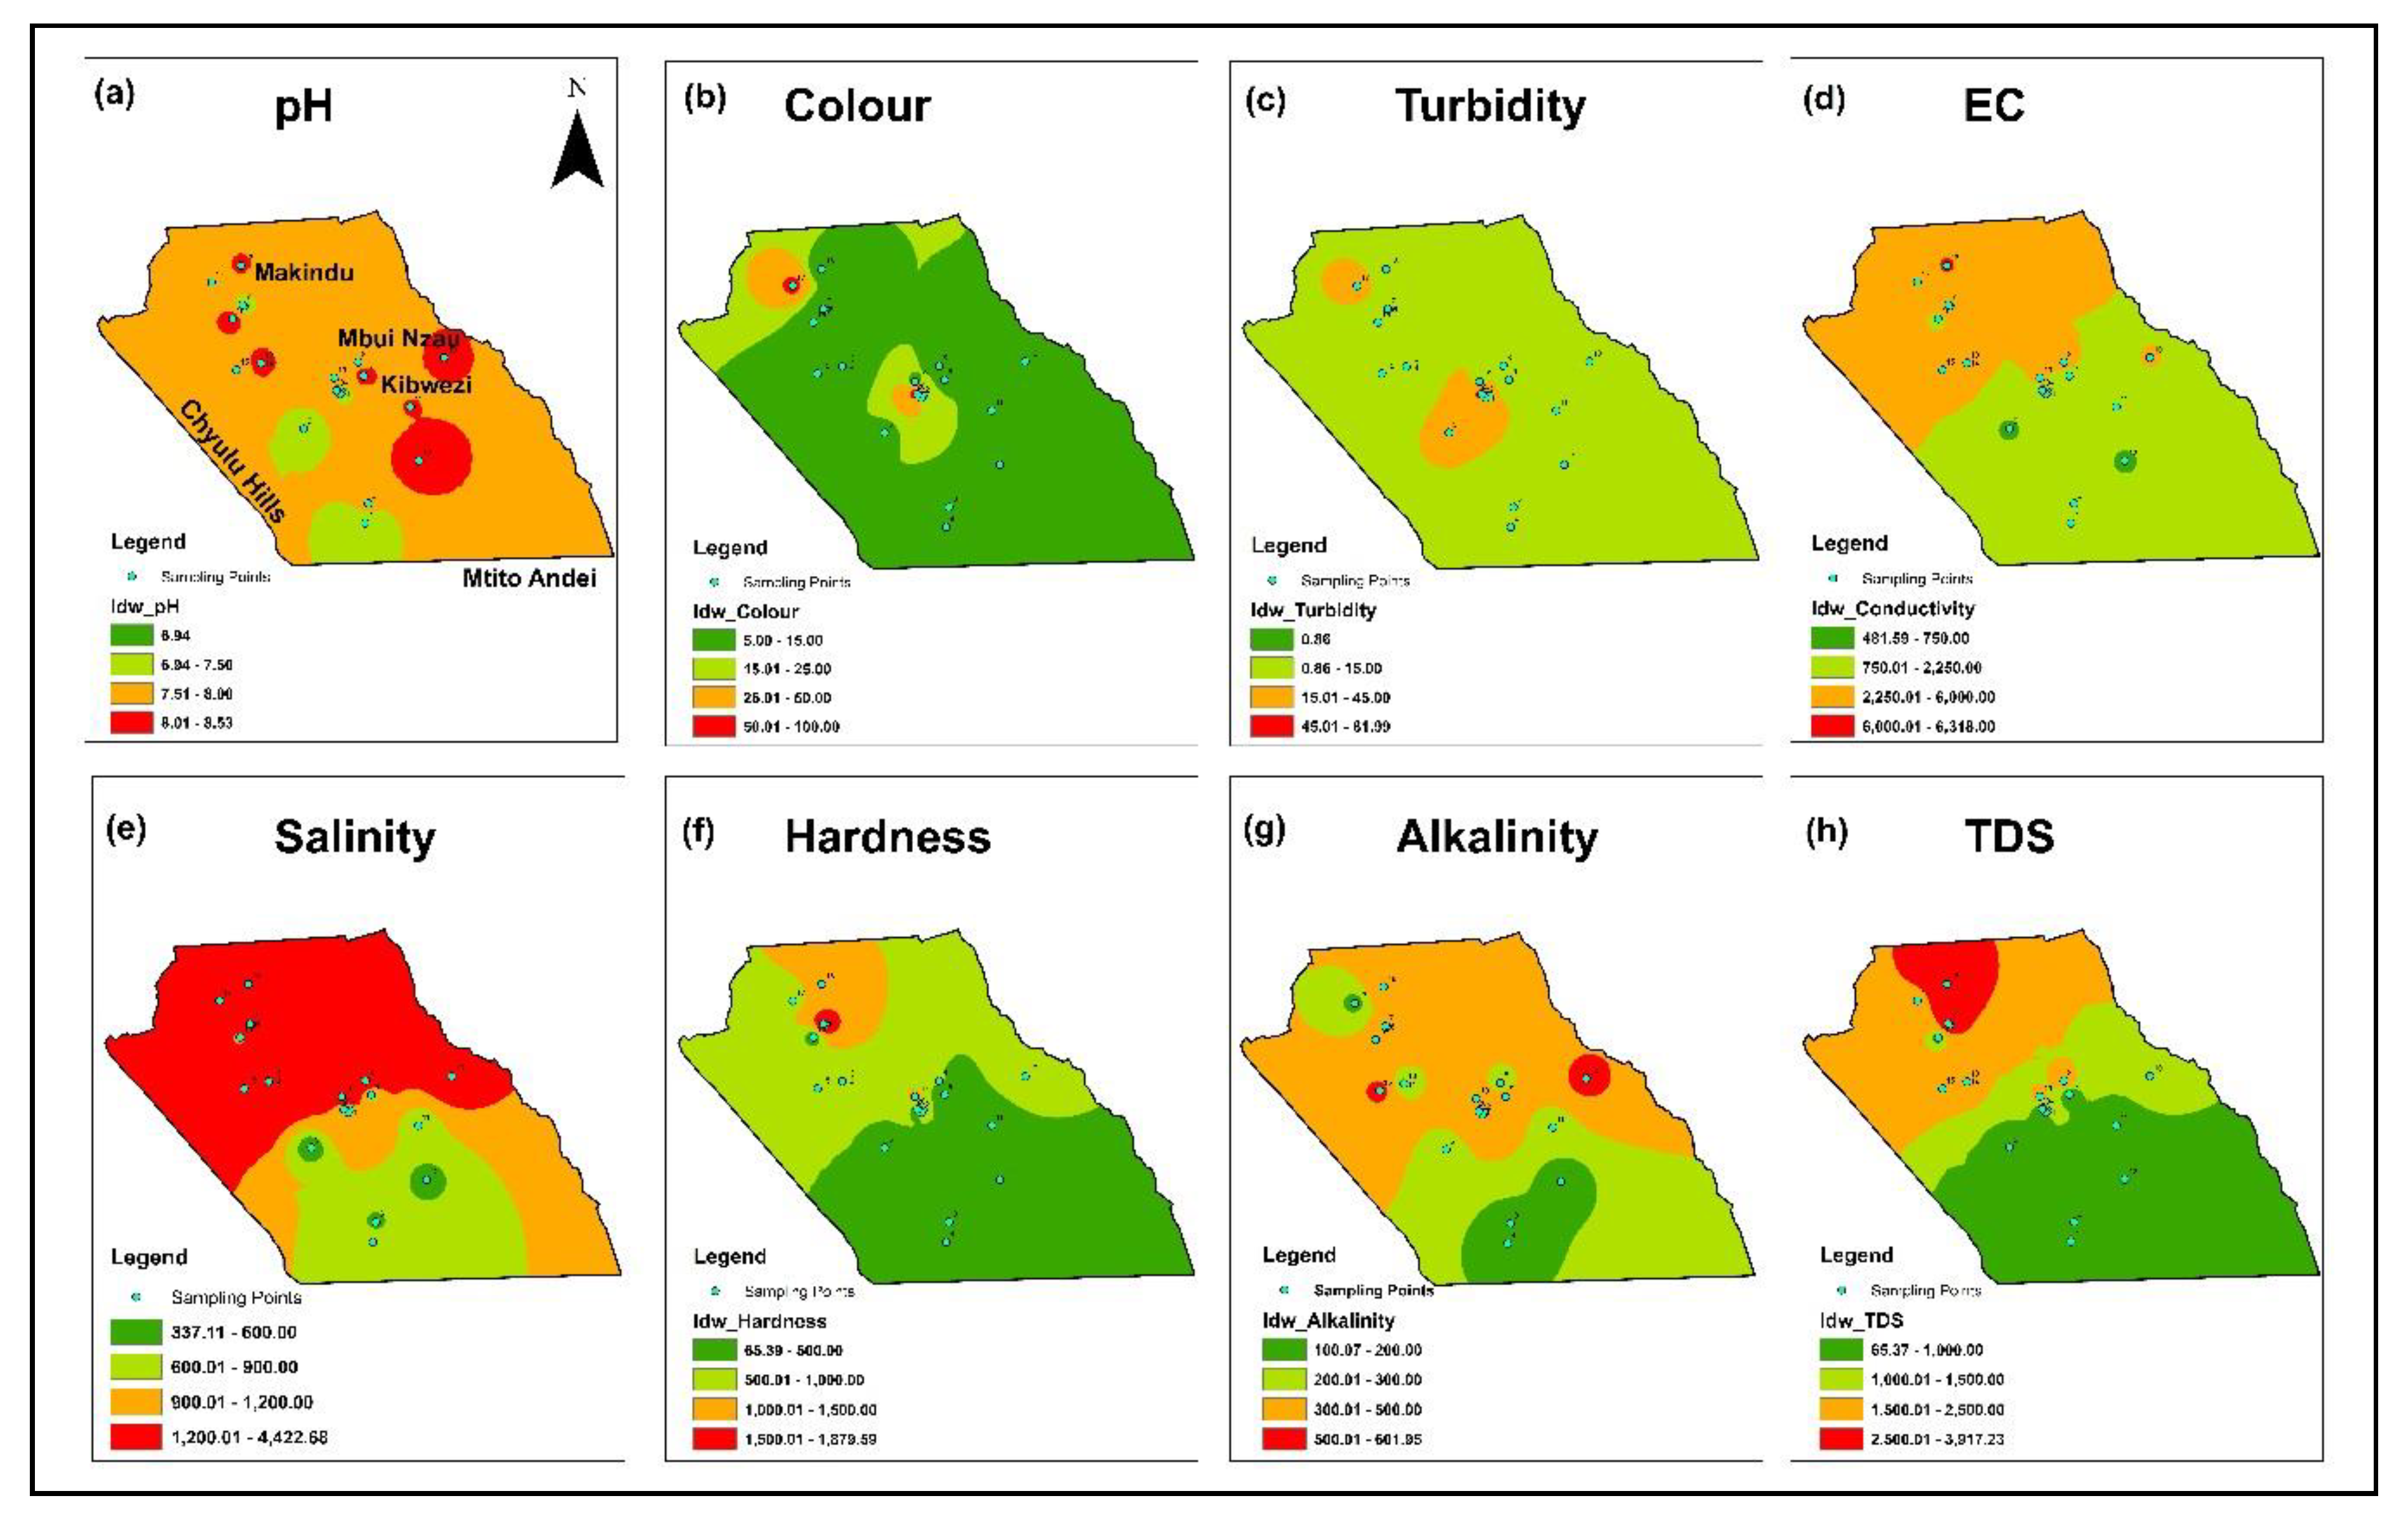
3.1. Physico-Chemical Characteristics of the Water and Spatial Distribution
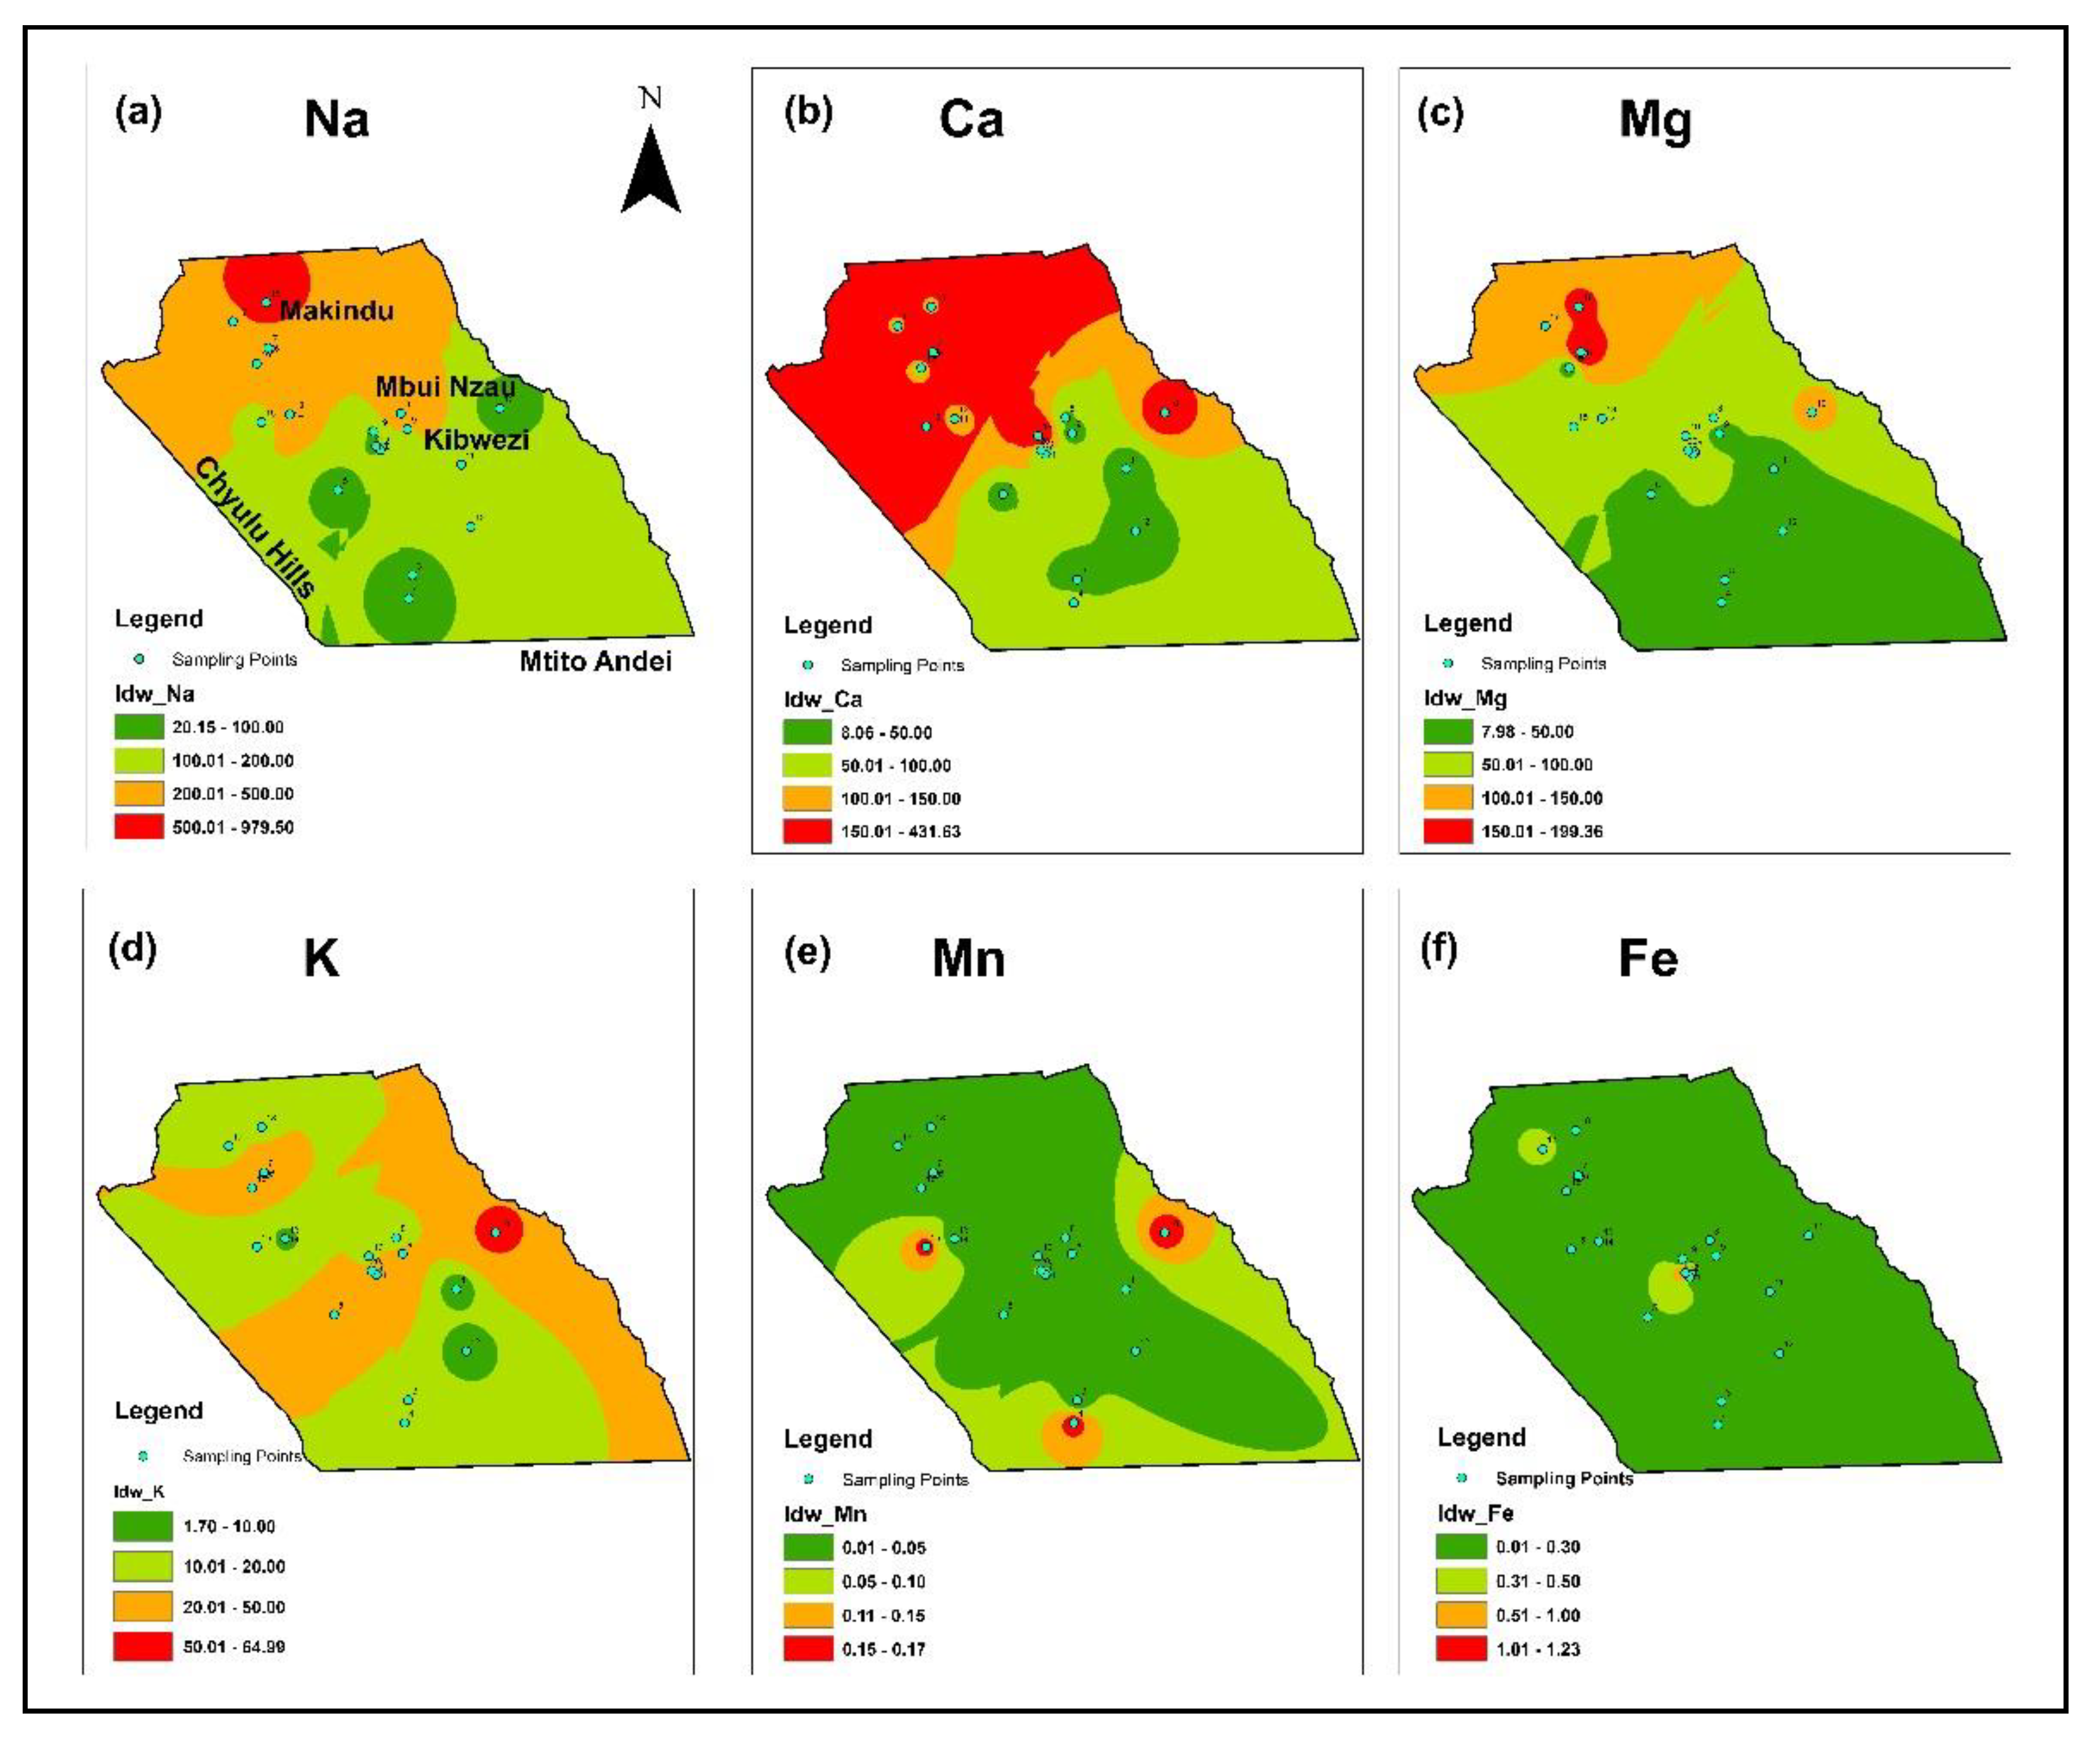
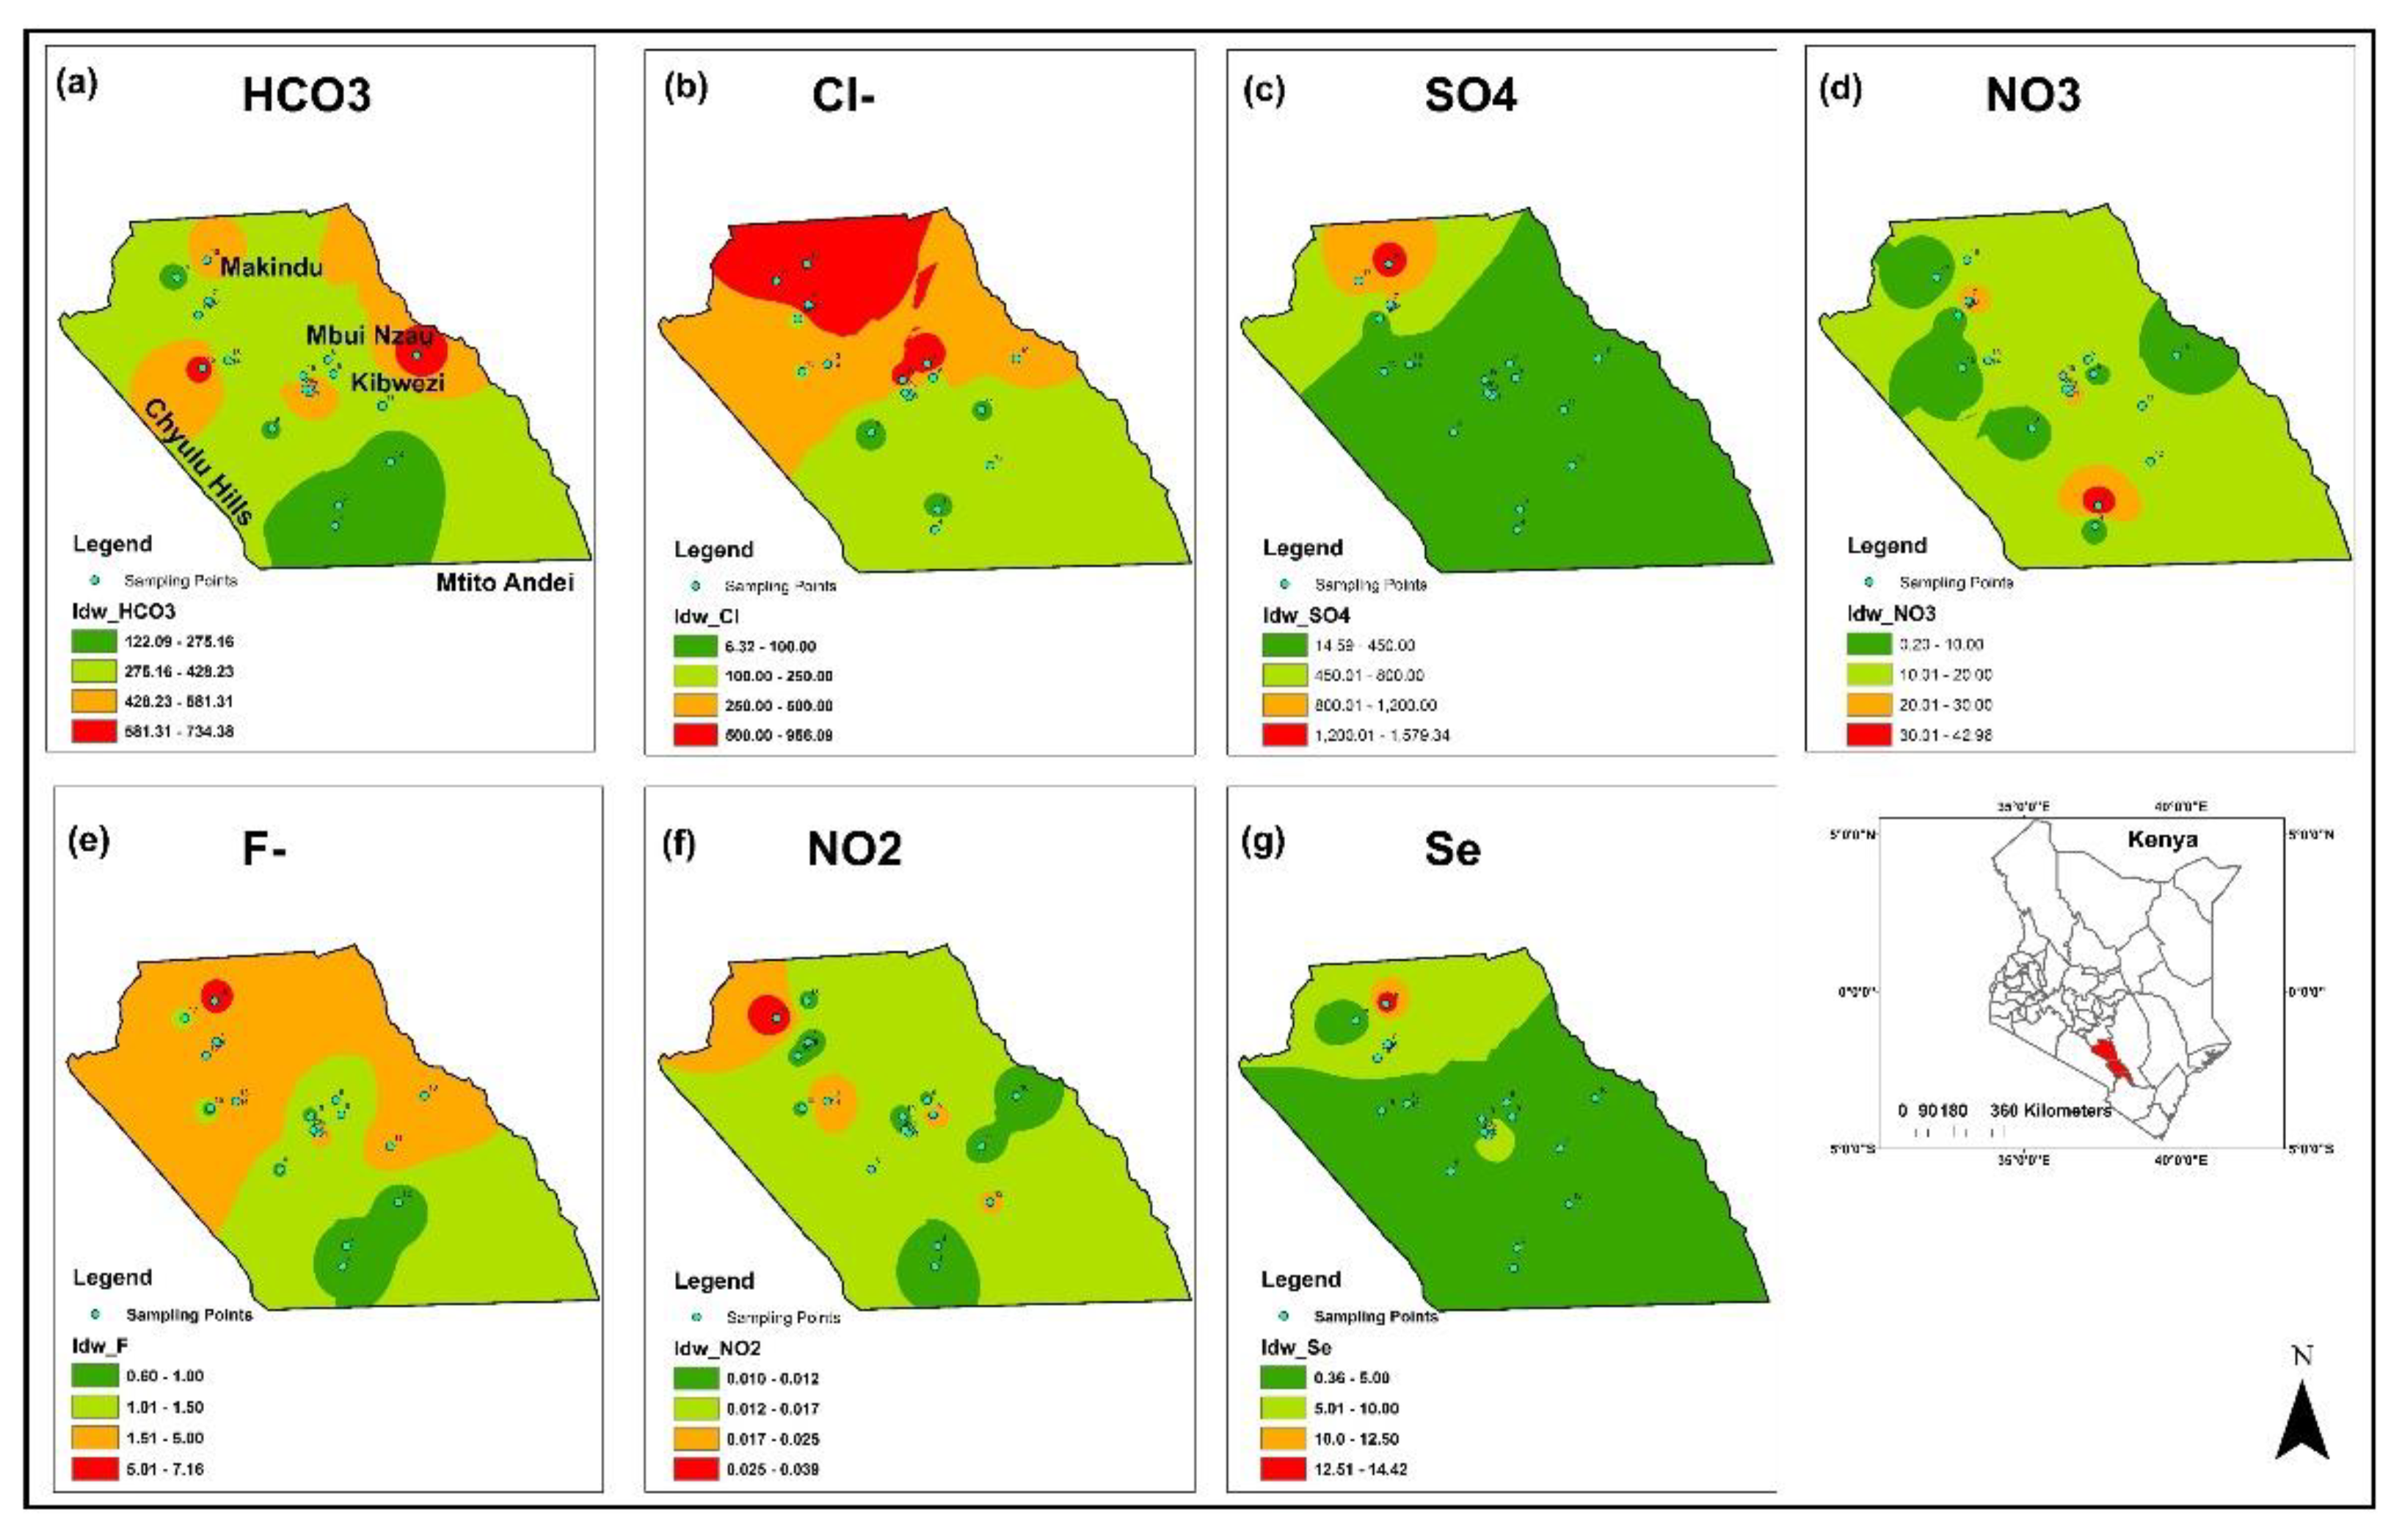
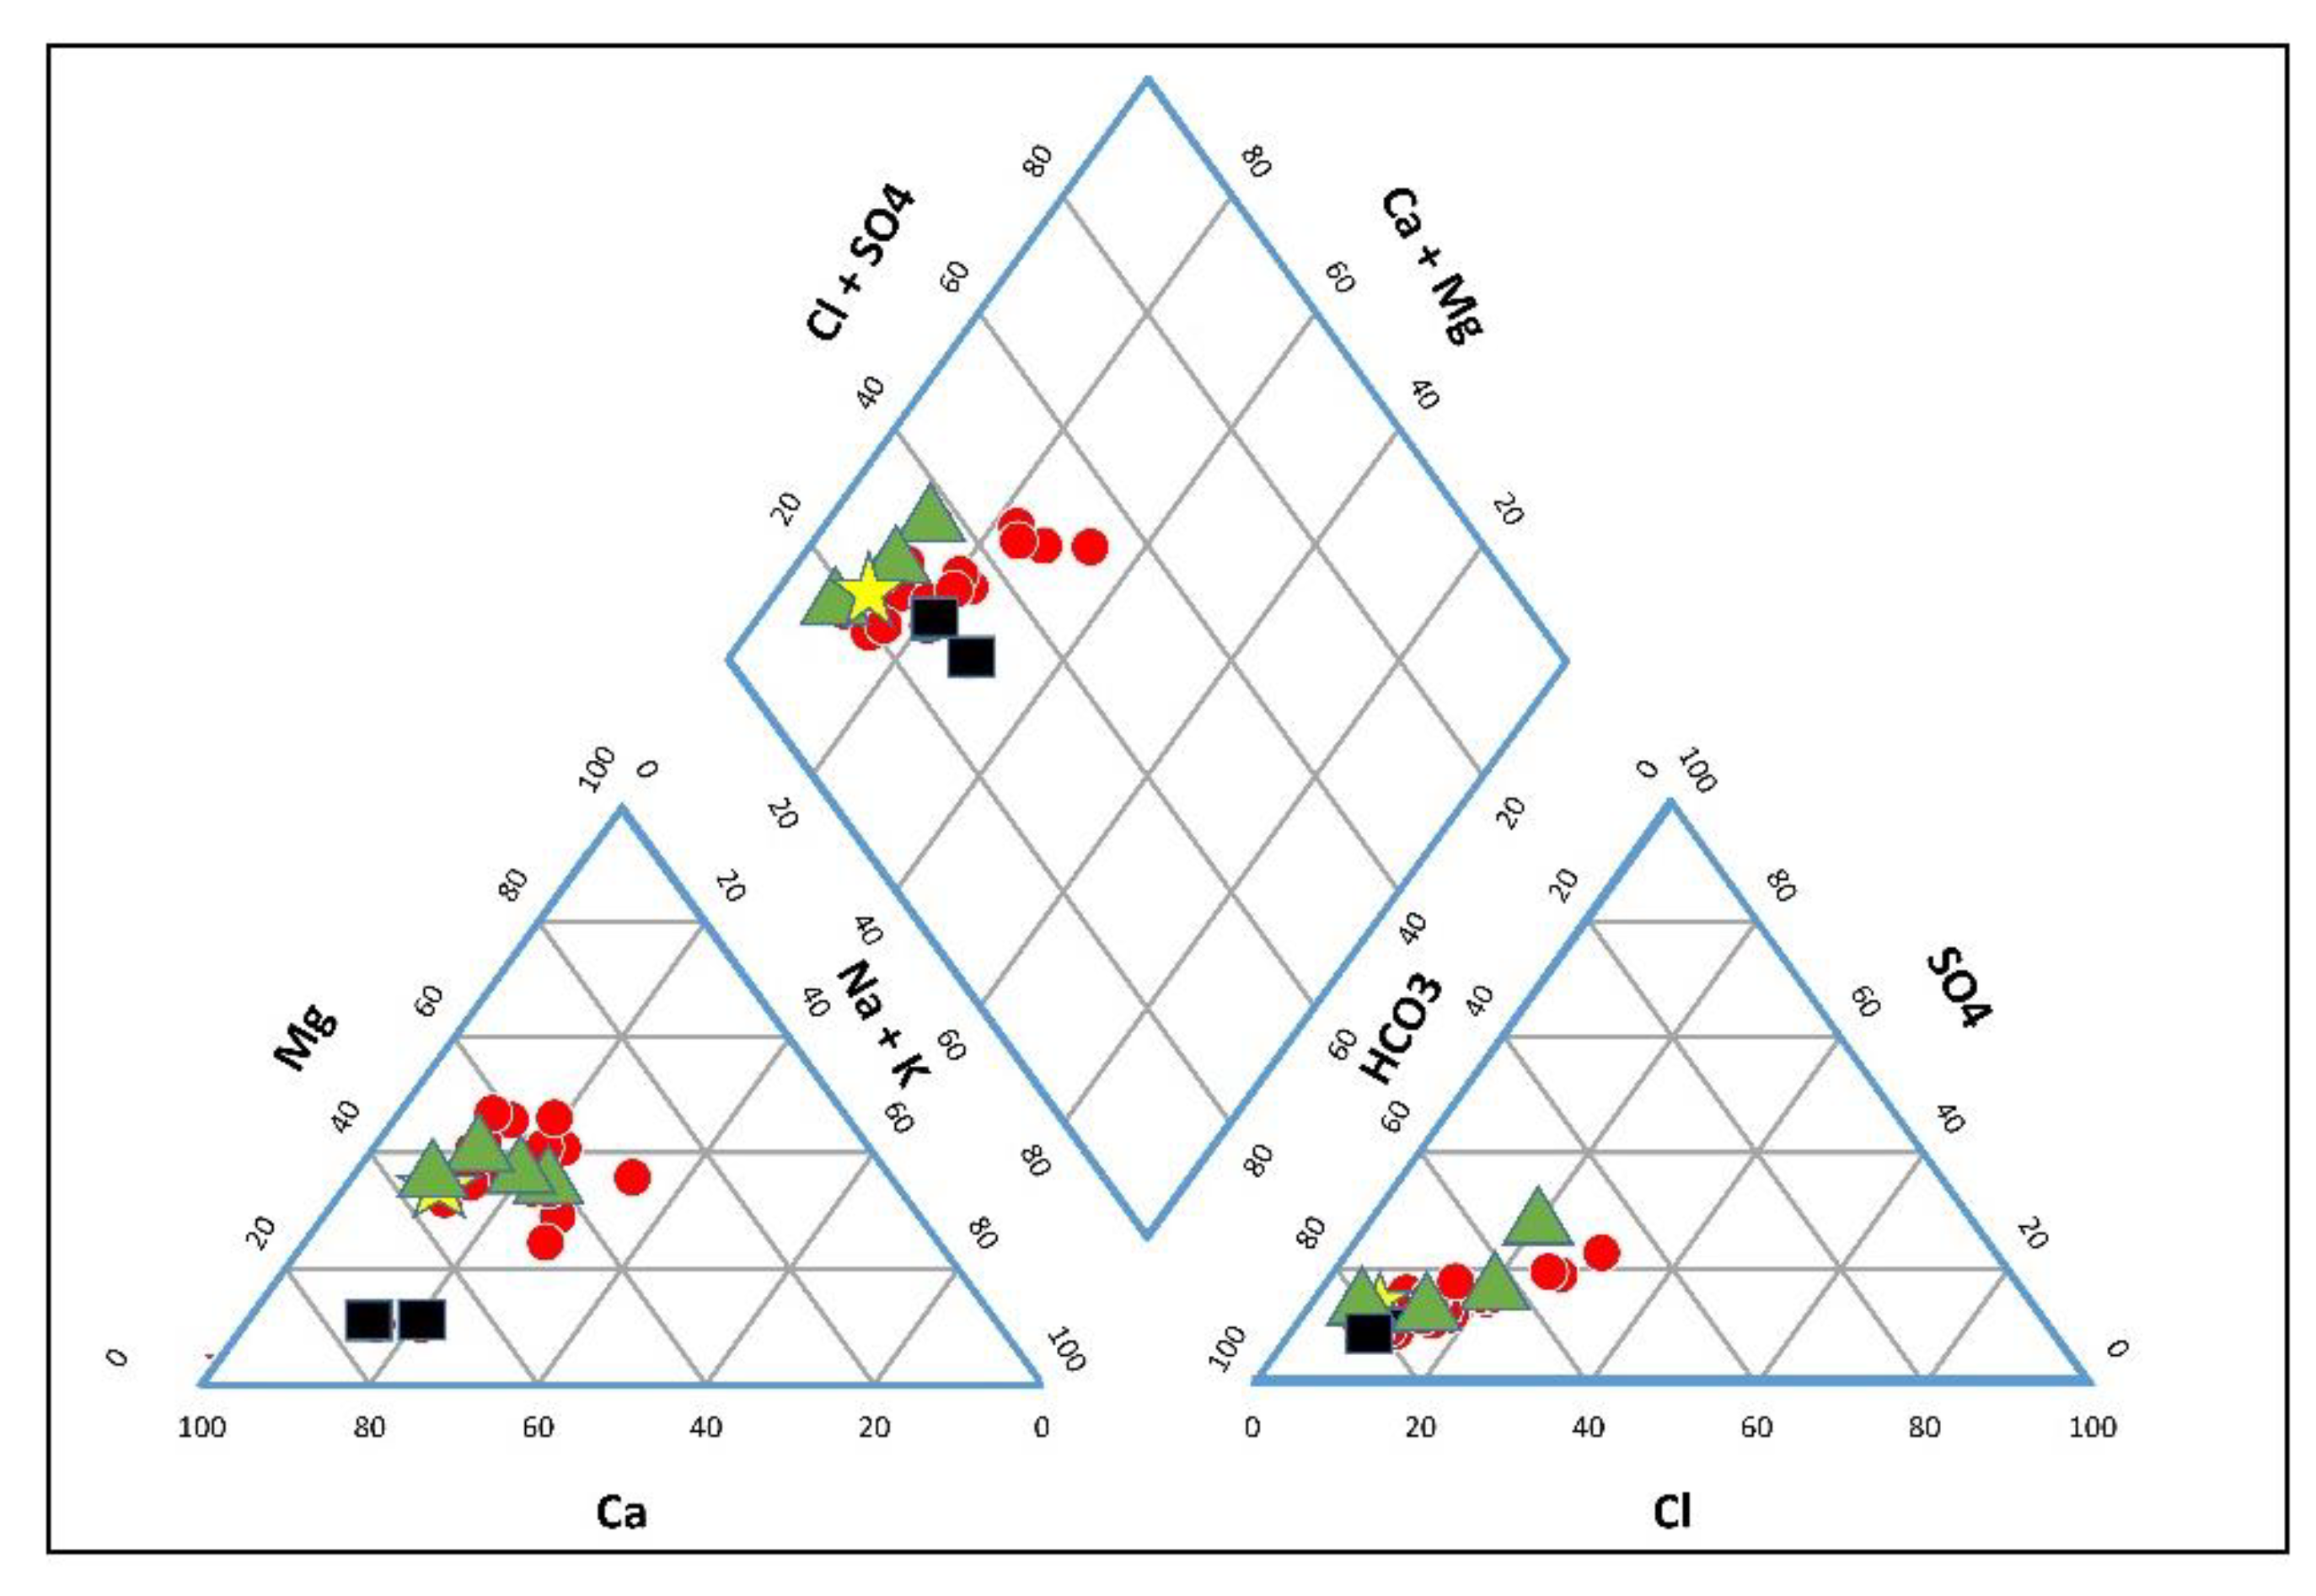
3.2. Hydro-Chemical Characteristics
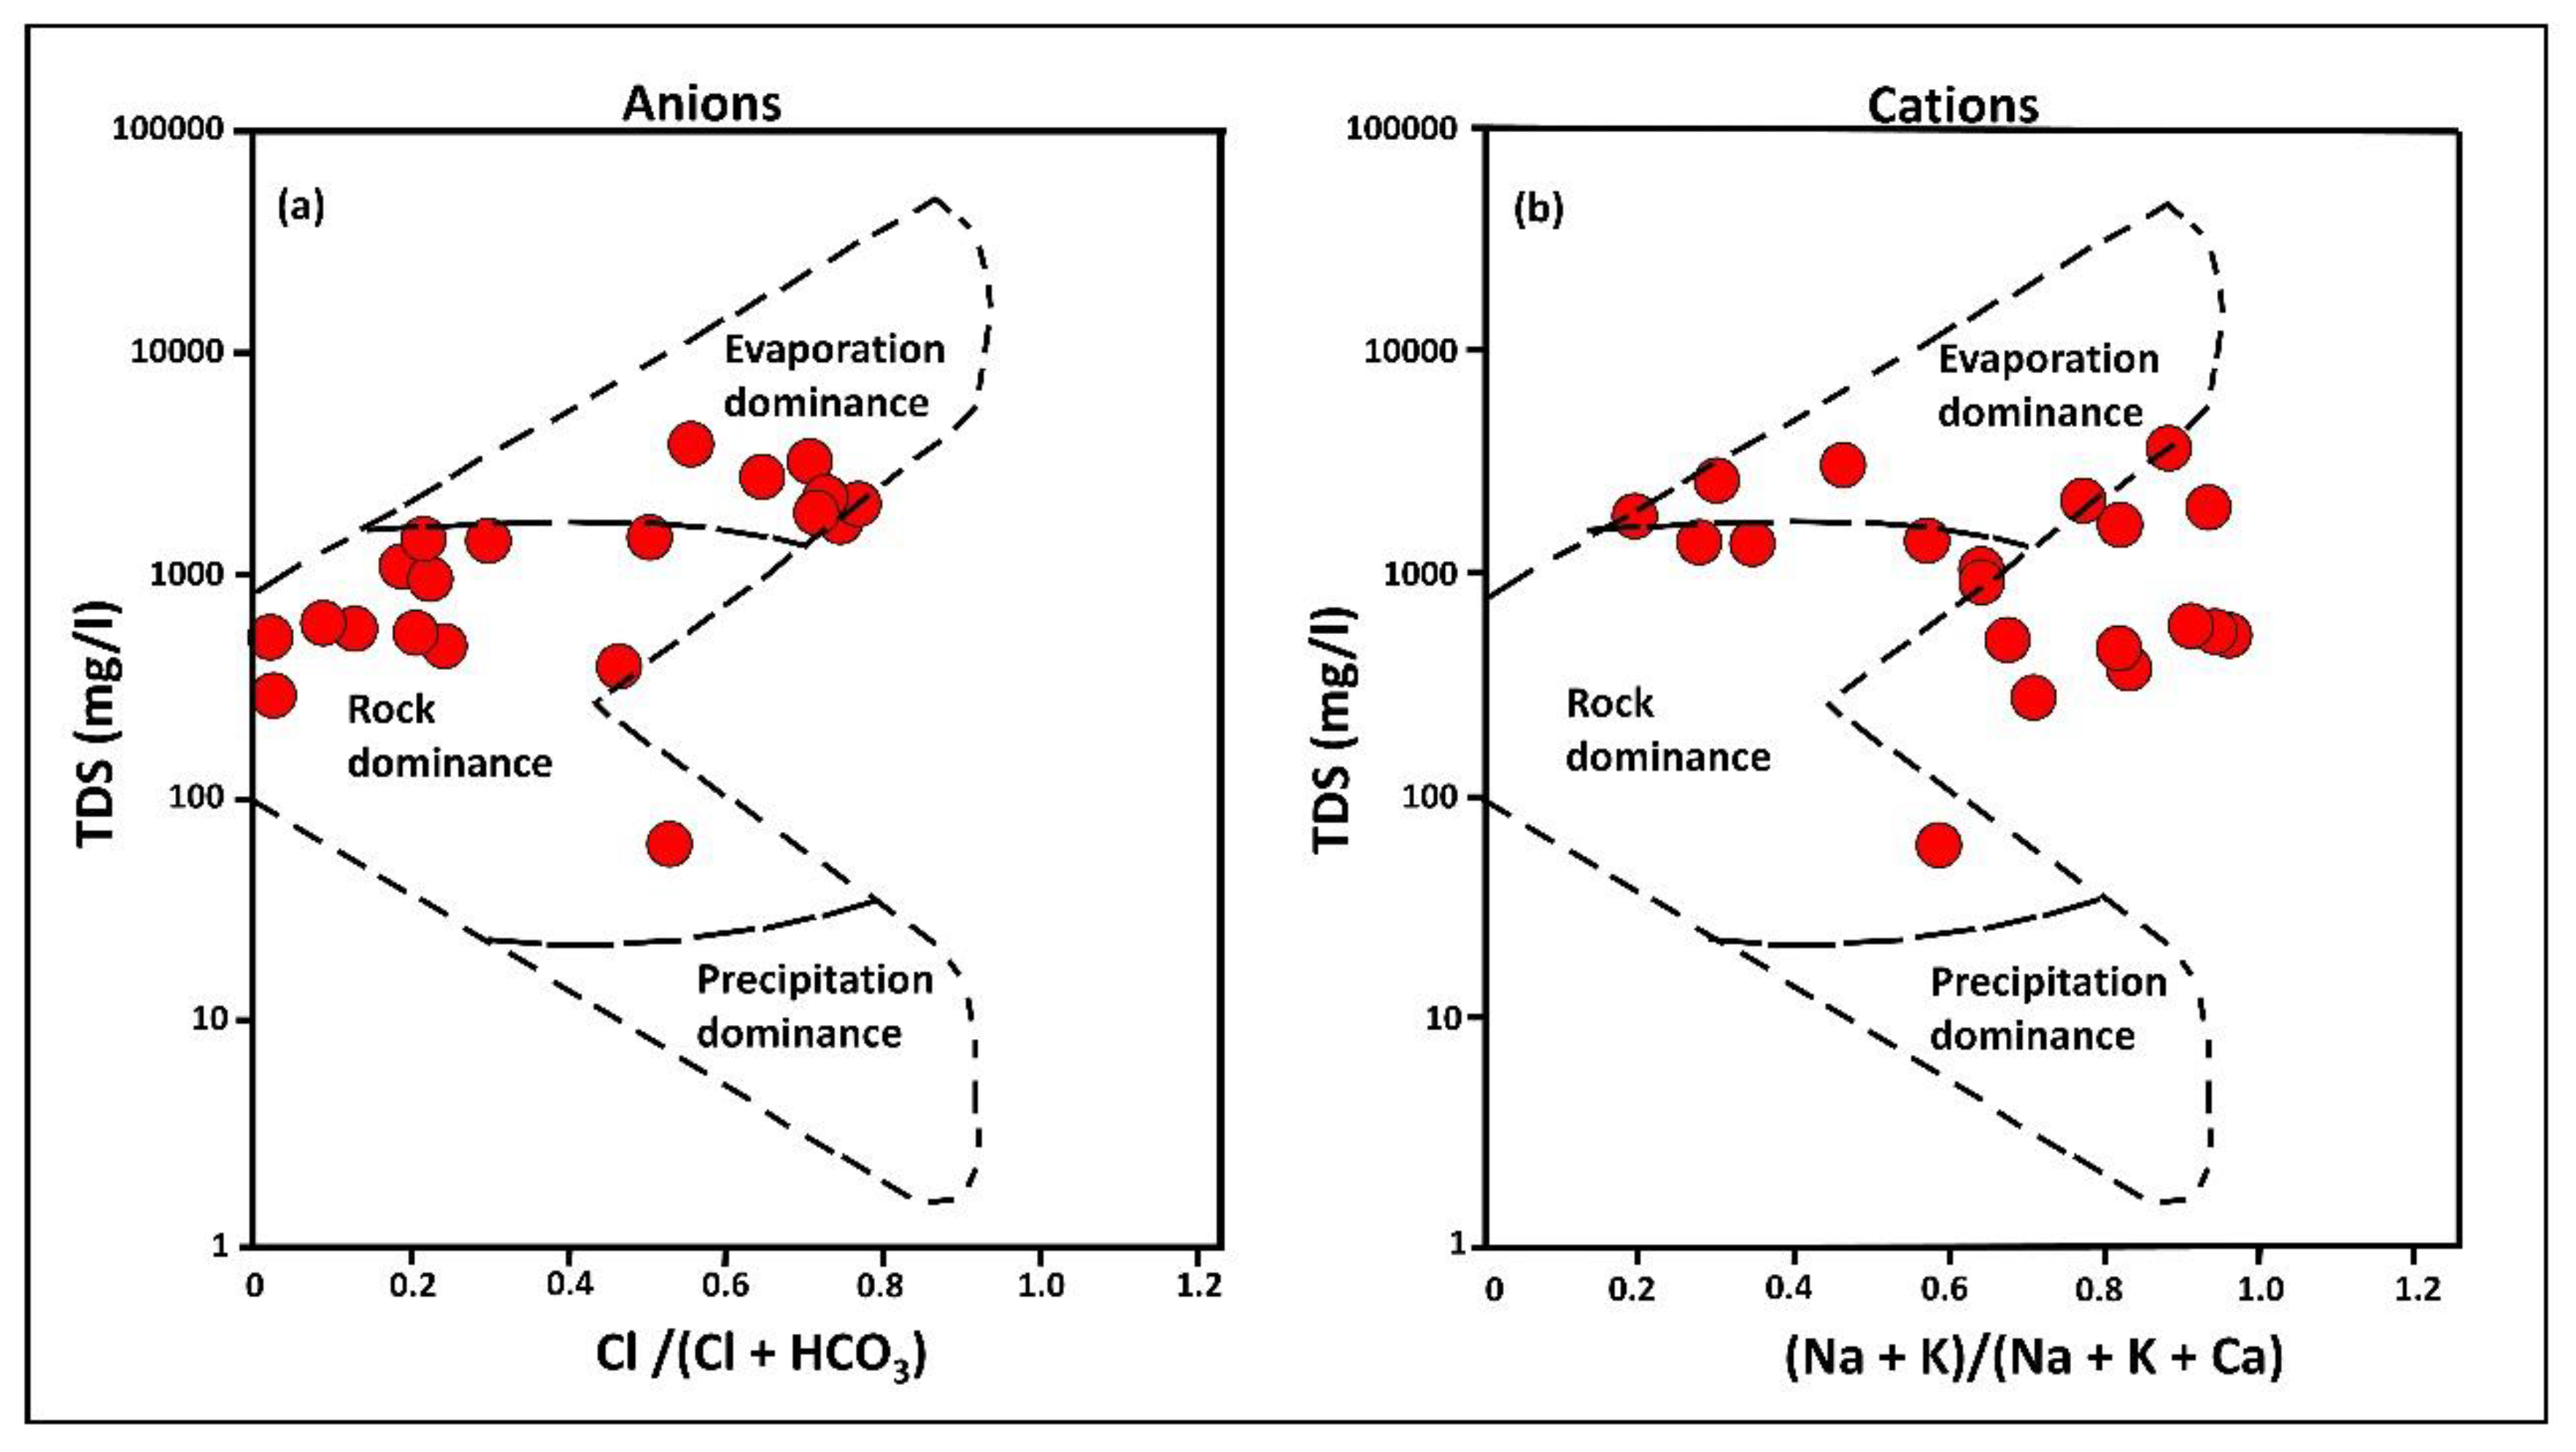
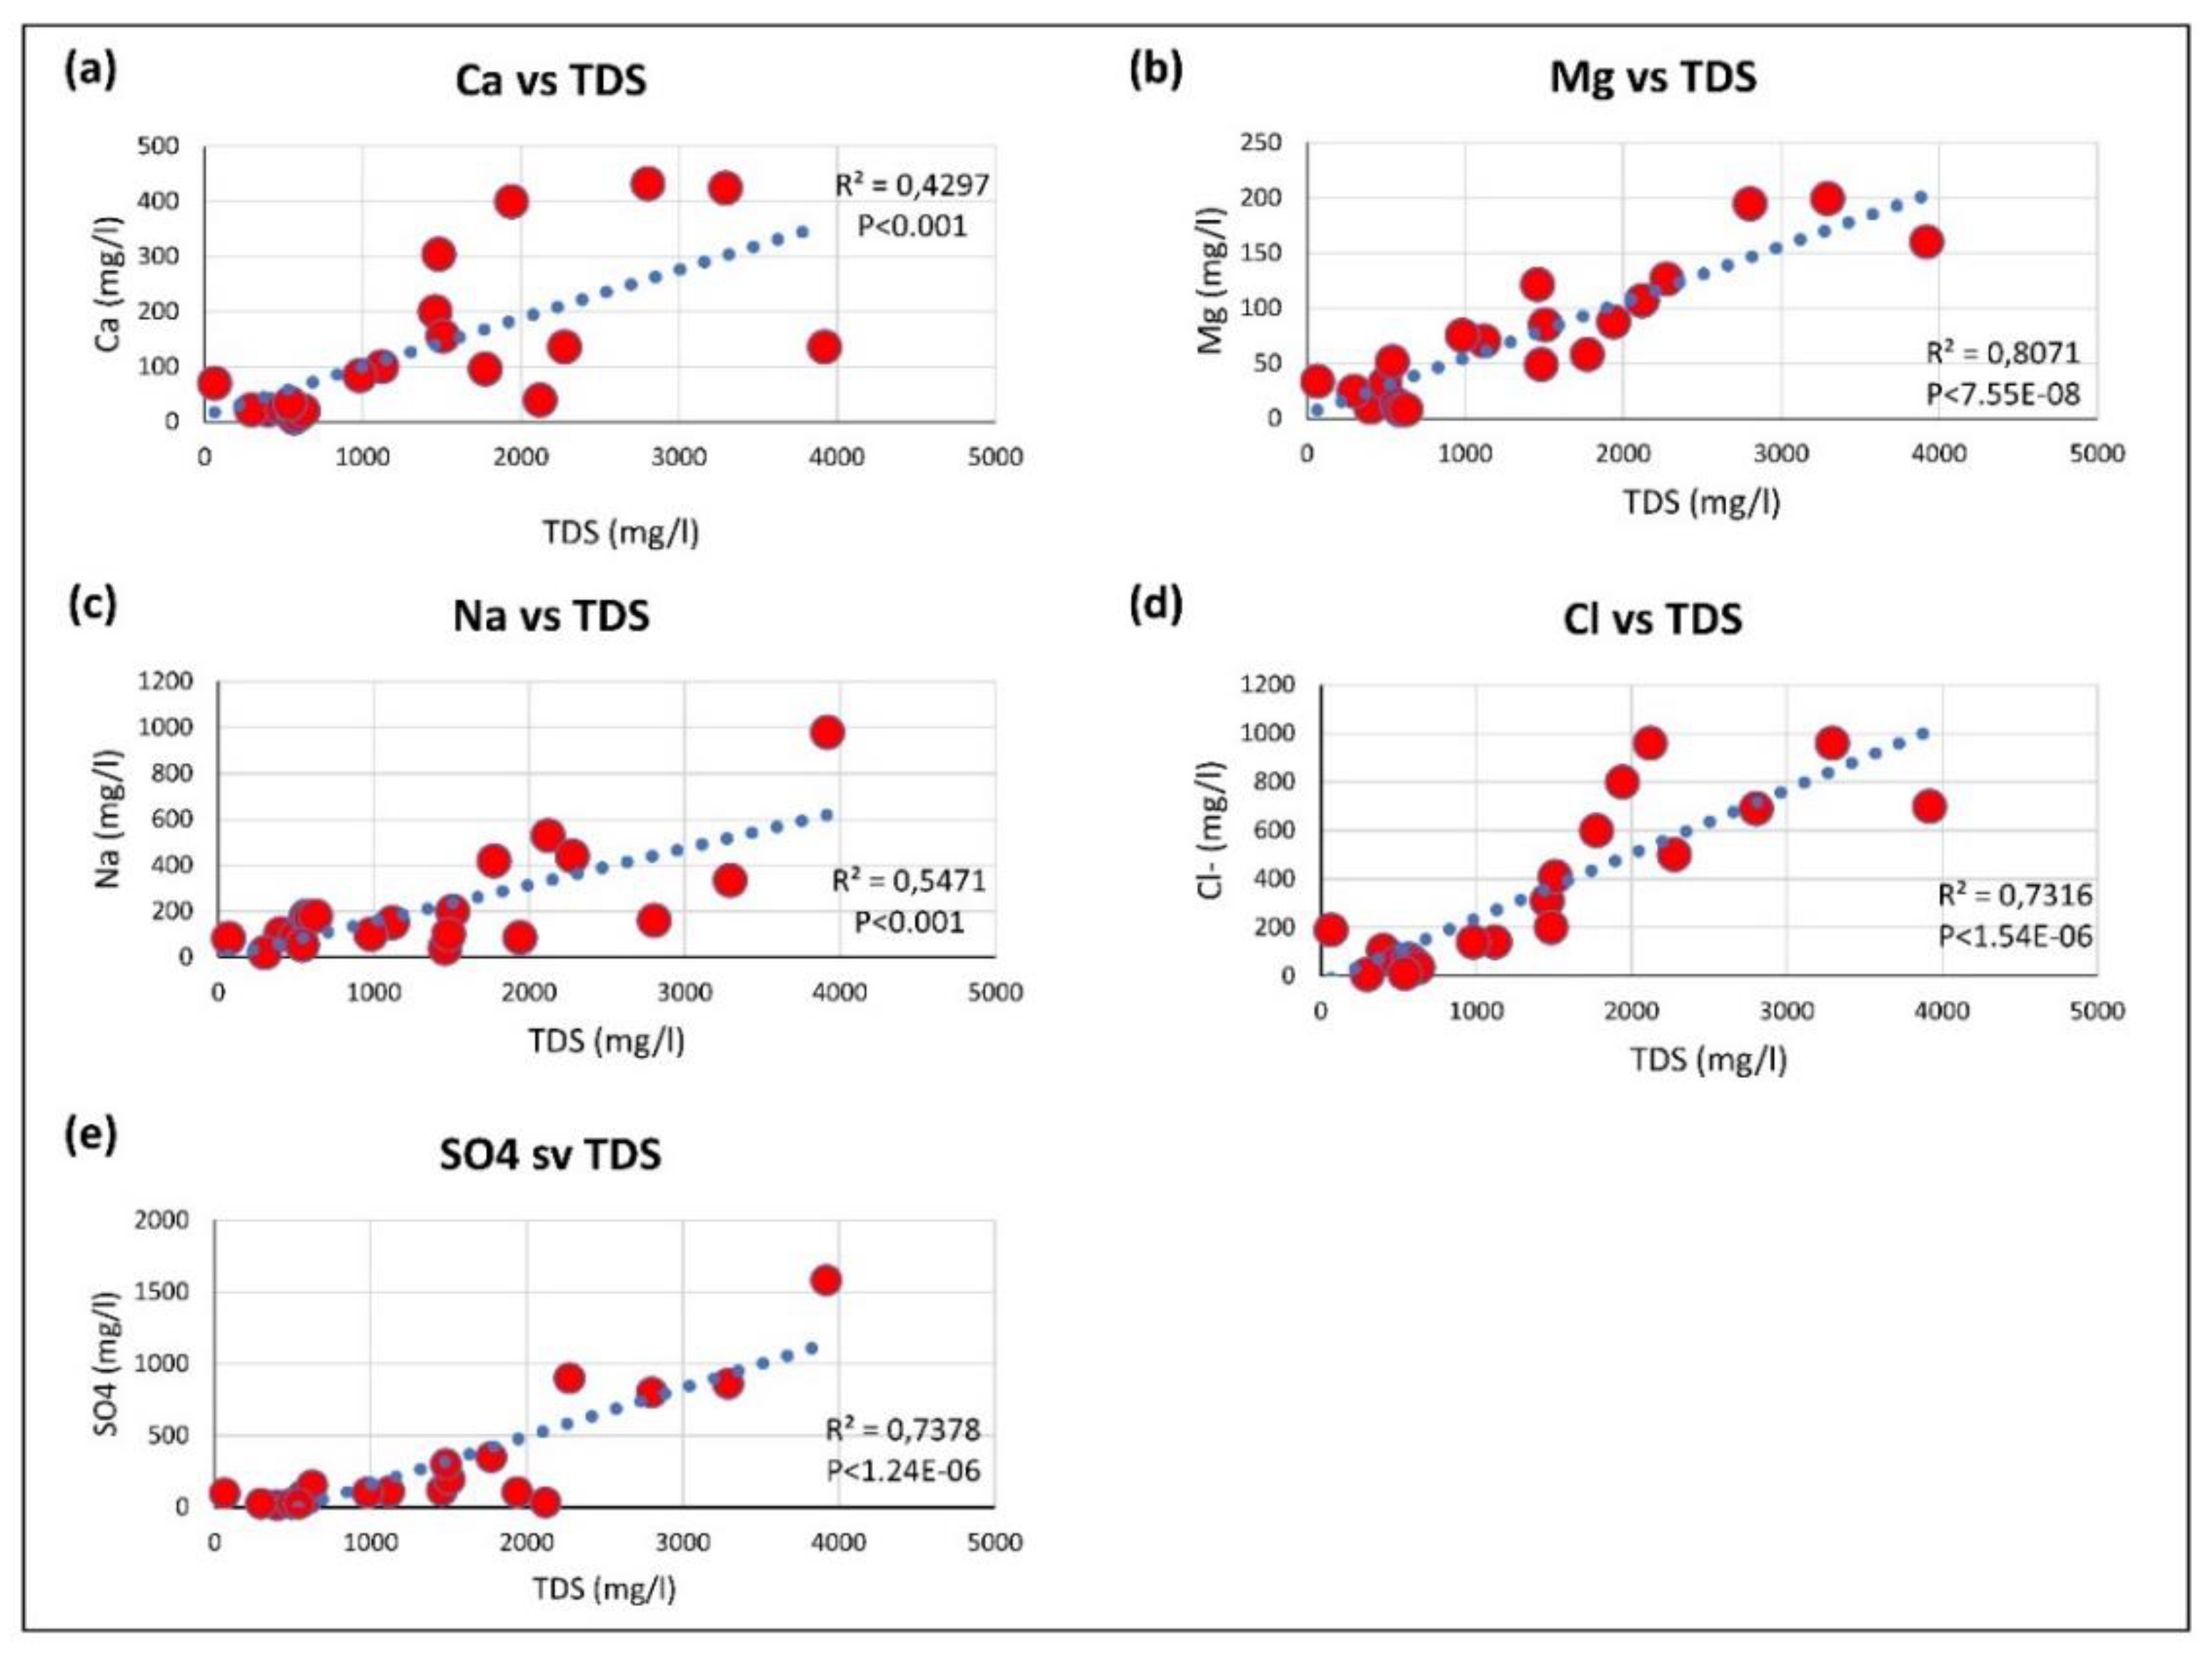
3.3. Geochemical Processes Controlling Groundwater Quality
3.4. Normality of Data, Principal Component, and Spearman’s Correlation Analysis
3.4.1. Normality of Data
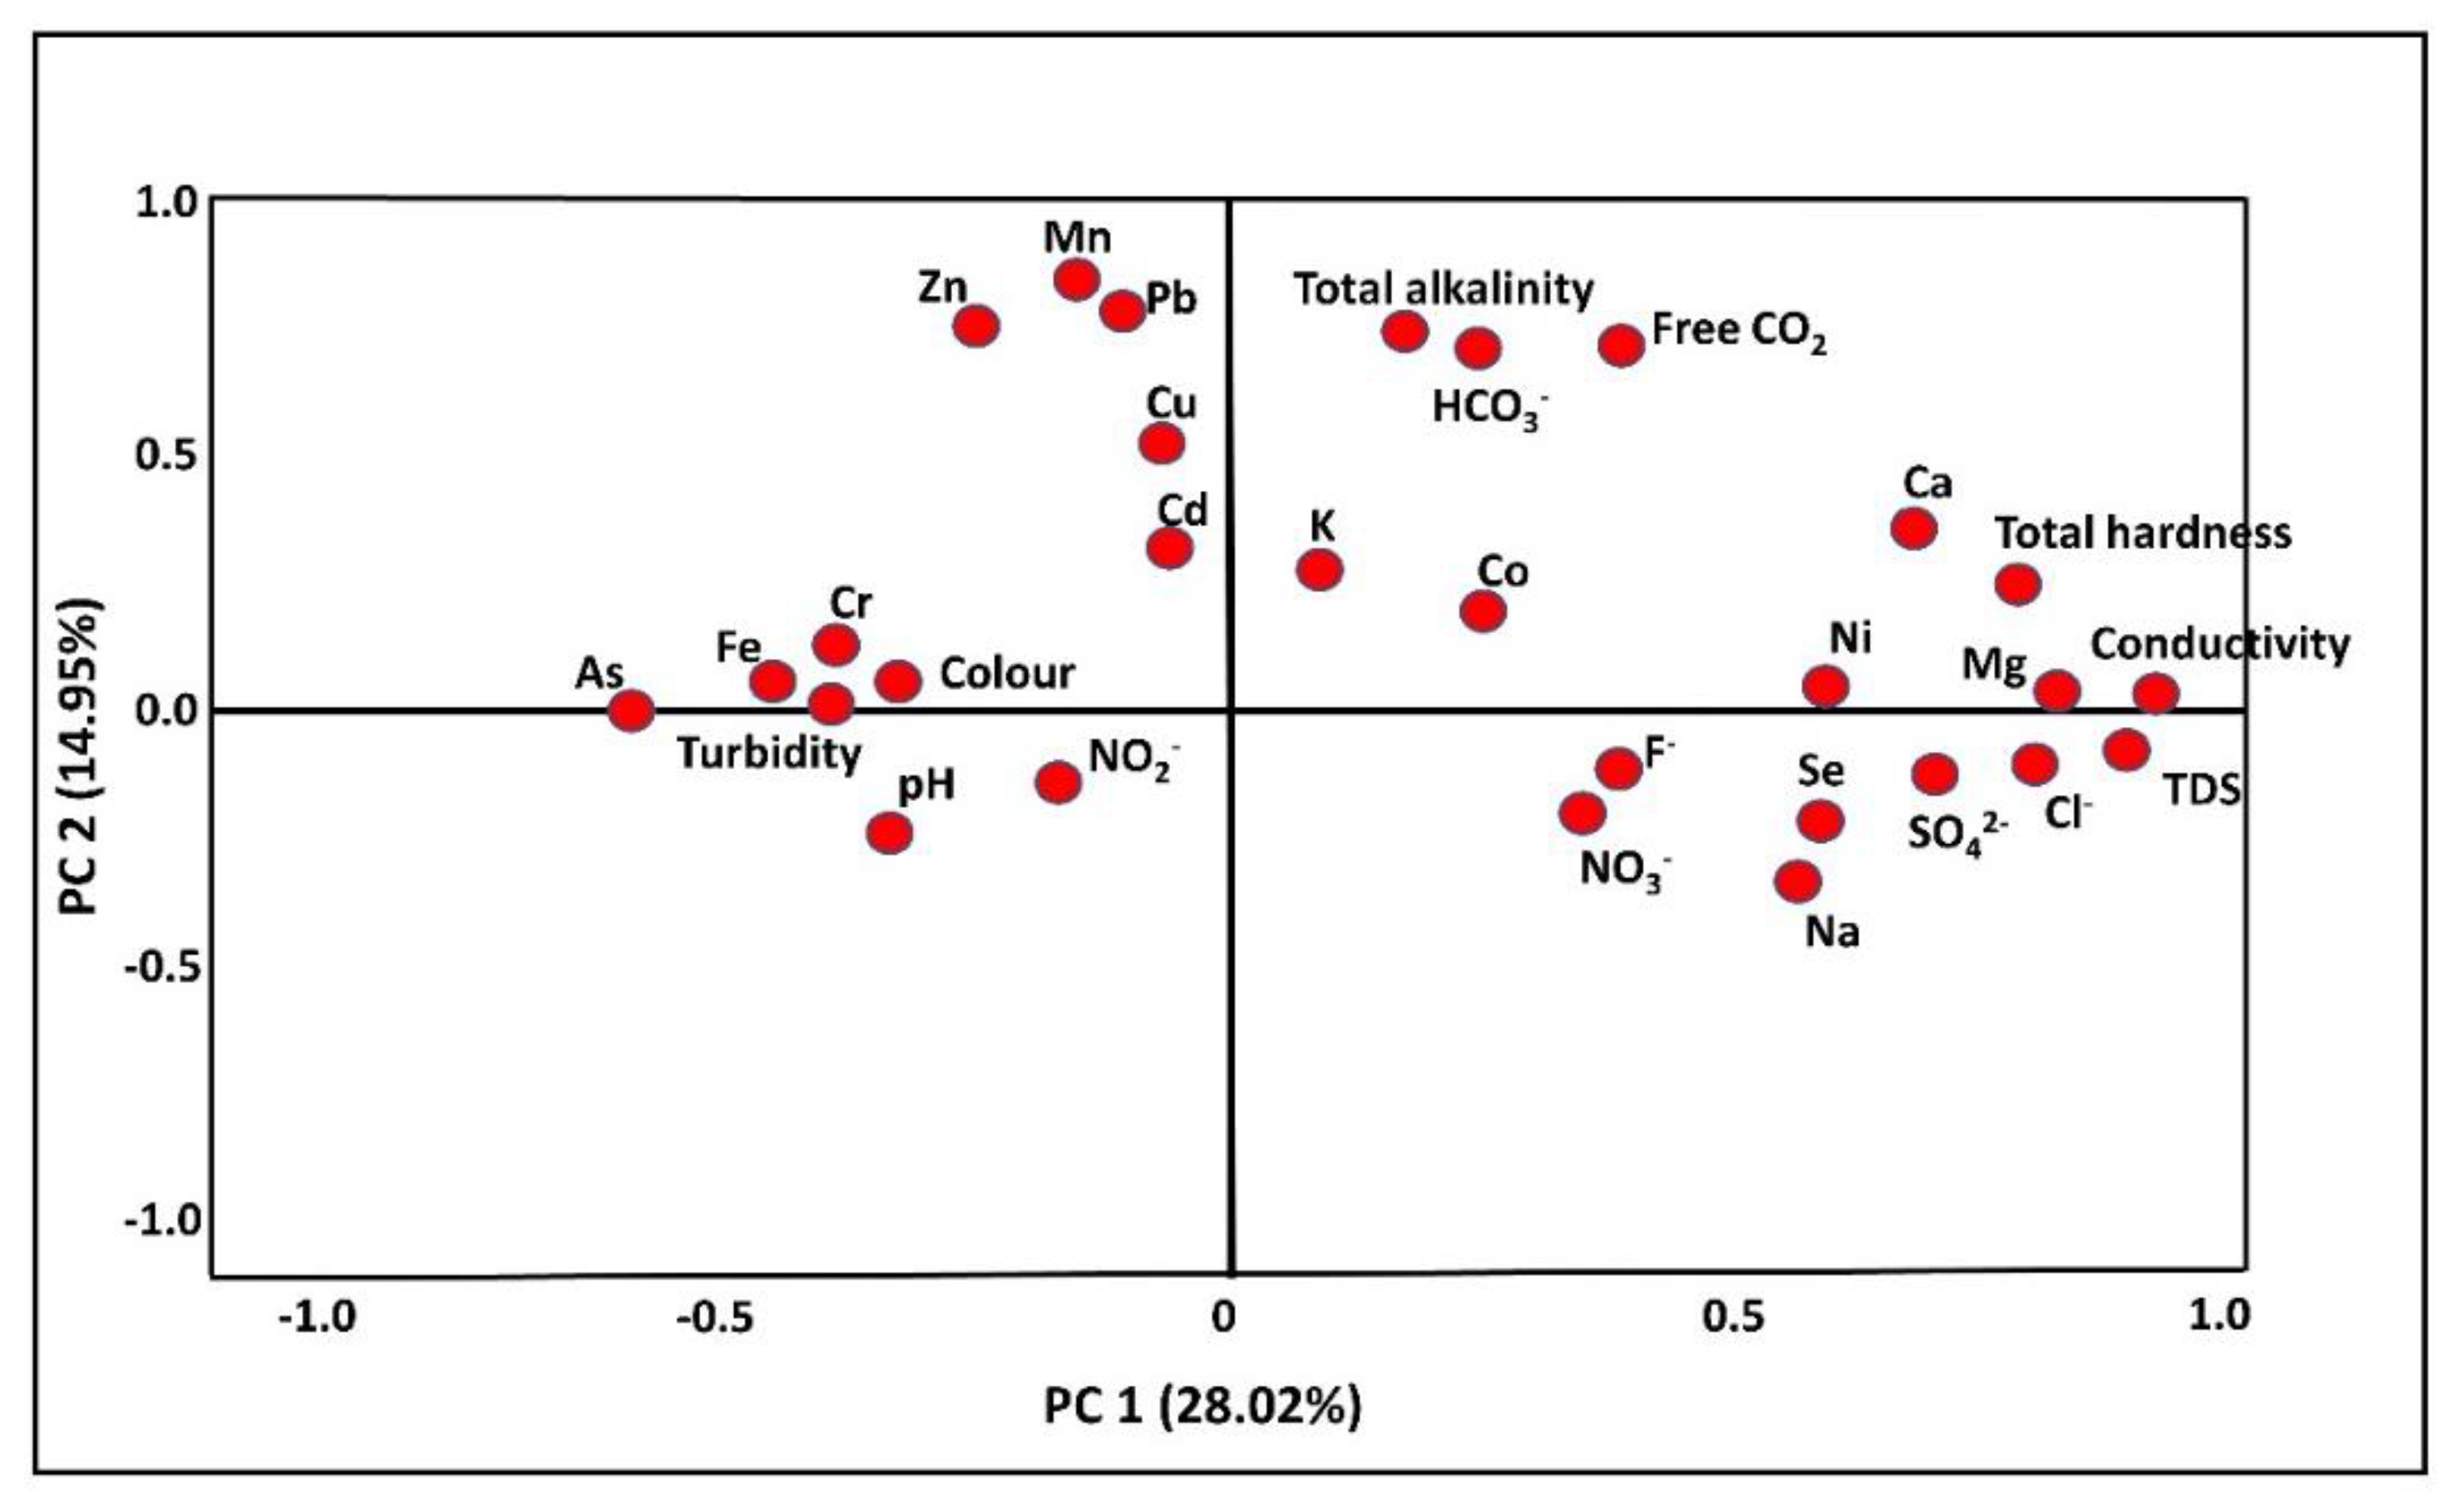
3.4.2. Principal Component Analysis
3.4.3. Spearman’s Correlation
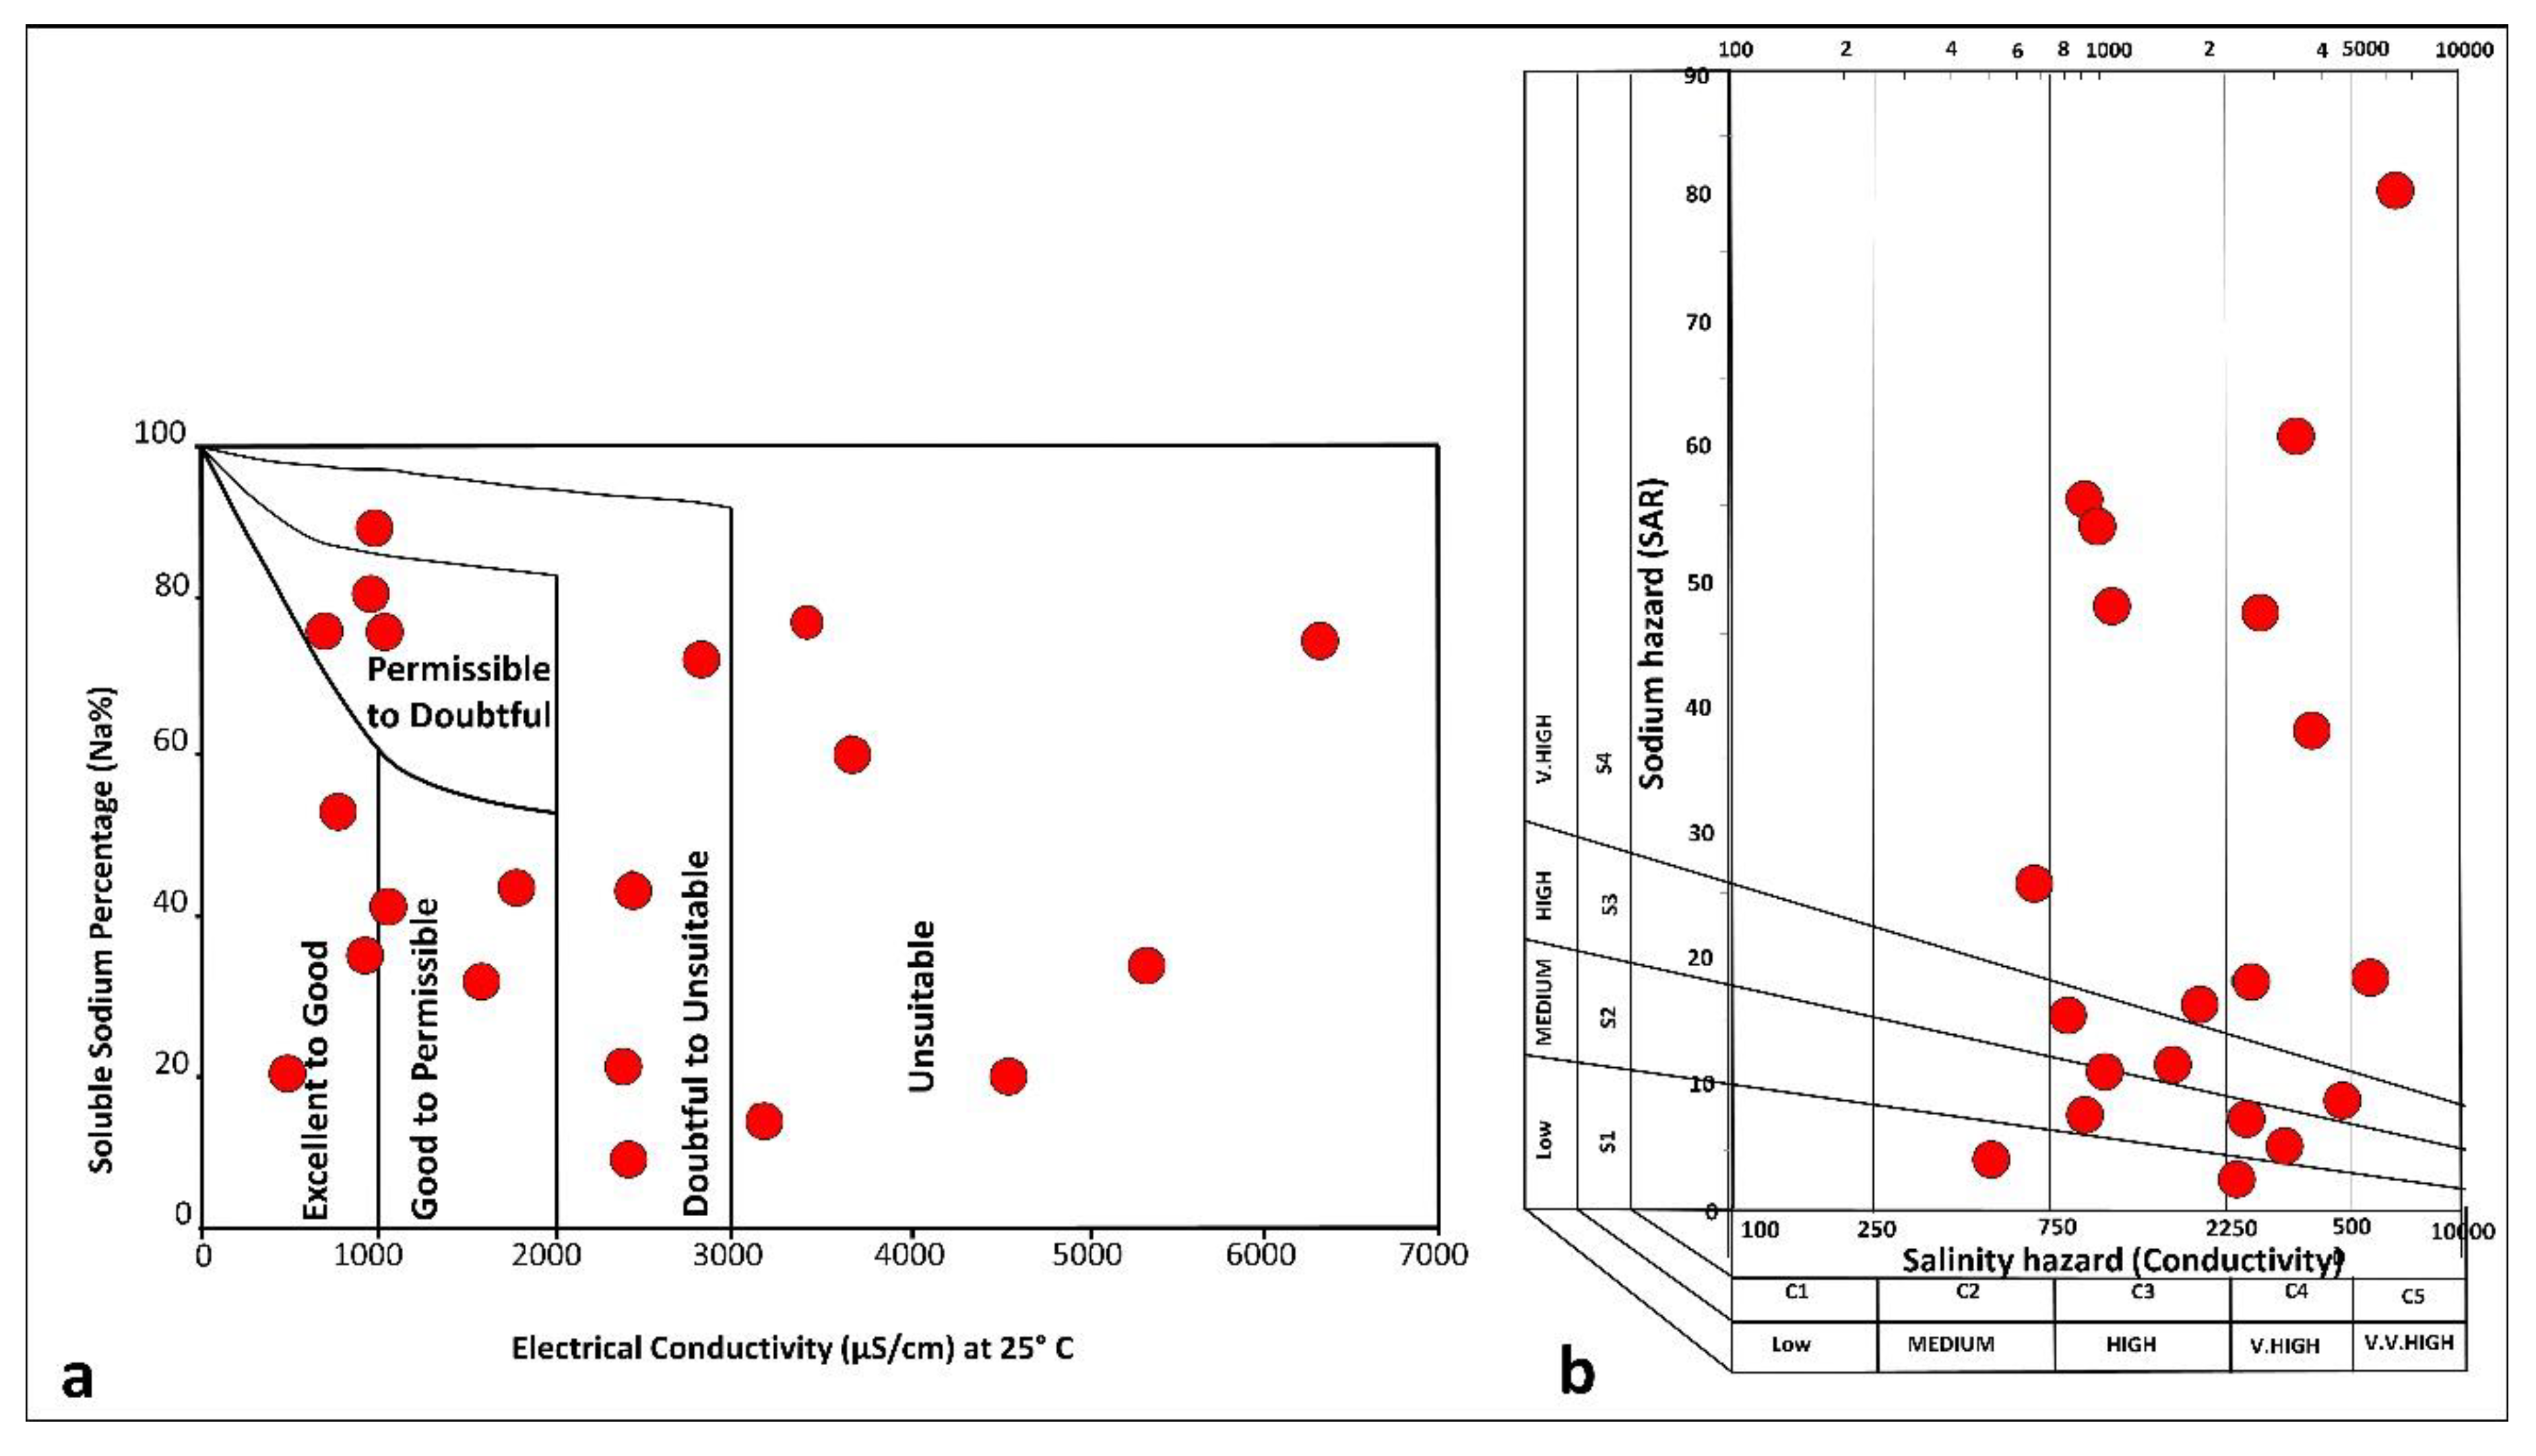
3.5. Evaluation of Groundwater for Agriculture
4. Discussion
5. Conclusions and Recommendations
Author Contributions
Funding
Acknowledgments
Conflicts of Interest
References
- United Nations (UN). The Sustainable Development Goals Report 2018; United Nations: New York, NY, USA, 2018. [Google Scholar]
- JICA Basic Design Study Report on the Project for Groundwater Development in Rural Districts (Machakos, Kitui, Makueni and Mwingi) in the Republic of Kenya. Available online: http://open_jicareport.jica.go.jp/618/618/618_407_11775582.html (accessed on 23 January 2019).
- Adimalla, N.; Venkatayogi, S. Mechanism of fluoride enrichment in groundwater of hard rock aquifers in Medak, Telangana State, South India. Environ. Earth Sci. 2017, 76, 45. [Google Scholar] [CrossRef]
- Venkatramanan, S.; Chung, S.Y.; Ramkumar, T.; Rajesh, R.; Gnanachandrasamy, G. Assessment of groundwater quality using GIS and CCME WQI techniques: A case study of Thiruthuraipoondi city in Cauvery deltaic region, Tamil Nadu, India. Desalin. Water Treat. 2016, 57, 12058–12073. [Google Scholar] [CrossRef]
- Adimalla, N.; Wu, J. Groundwater quality and associated health risks in a semi-arid region of south India: Implication to sustainable groundwater management. Hum. Ecol. Risk Assess. Int. J. 2019, 25, 1–26. [Google Scholar] [CrossRef]
- Sharaf, M.A.M.; Subyani, A.M. Assessing of groundwater contamination by toxic elements through multivariate statistics and Spatial Interpolation, Wadi Fatimah, Western Arabian Shield, Saudi Arabia. Int. J. Sci. Eng. Res. 2011, 2, 1–14. [Google Scholar]
- Mailu, G.M. The influence of Precambrian metamorphic rocks on groundwater in the Chyulu Area, Kenya. Appl. Hydrogeol. 1994, 2, 26–32. [Google Scholar] [CrossRef]
- Ng’ang’a, S.; Kibetu, P.; Thumbi, G.; Okwadha, G.; Nyadawa, M. Reduction of iron and manganese in groundwater through non-mechanical aeration and filtration method: Case study of Makueni County, Eastern Kenya. J. Int. Acad. Res. Multidiscip. 2017, 5, 25–37. [Google Scholar]
- Kenya National Bureau of Statistics. The 2009 Kenya Population and Housing Census; Kenya National Bureau of Statistics: Nairobi, Kenya, 2010; Volume 1.
- Mbithi, F.M. Assessment of the Impact of Groundwater Fluoride on Human Health in Makindu District, Makueni County, Kenya. Master’s Thesis, South Eastern Kenya University, Kitui County, Kenya, 2017. [Google Scholar]
- Raju, N.J. Iron contamination in groundwater: A case from Tirumala-Tirupati environs, India. Researcher 2006, 1, 28–31. [Google Scholar]
- Vineis, P.; Chan, Q.; Khan, A. Climate change impacts on water salinity and health. J. Epidemiol. Glob. Health 2011, 1, 5–10. [Google Scholar] [CrossRef]
- Saggerson, E.P. Geology of the Simba-Kibwezi Area: Degree Sheet 59, NE Quarter (with Coloured Geological Map); Geological Survey of Kenya: Nairobi, Kenya, 1963.
- Nair, K.R.; Manji, F.; Gitonga, J.N. The occurrence and distribution of fluoride in groundwaters of Kenya. East. Afr. Med. J. 1984, 61, 503–512. [Google Scholar]
- Mwamati, F.T.; Kitheka, J.U.; Njuru, P.G. An Assessment of the Spatial and Temporal variations of Groundwater quality in Yatta Plateau in Kitui County, Kenya. J. Environ. Earth Sci. 2017, 7, 90–104. [Google Scholar]
- Ngugi, E. Exploring Kenya’s Inequality: Pulling Apart or Pooling Together; Kenya National Bureau of Statistics: Nairobi, Kenya, 2013.
- Ng’ang’a, S.K.; Thumbi, G.M.; Nyadawa, M.O.; Okwadha, G.O.; Kibetu, P.M. Groundwater mapping of Makueni County, Eastern Kenya Using Remote Sensing and Geographical Information System (GIS) Technologies. J. Int. Acad. Res. Multidiscip. 2015, 3, 271–285. [Google Scholar]
- TANATHI Water Services Board. Brief Summary of TANATHI Water Services Board Recently Completed; (on-going and planned projects within Makueni); Ministry of Water and Sanitation State Department for Water: Nairobi City, Republic of Kenya, 2018.
- Kaggikah, D. Makueni County–017–2017. Available online: https://www.kenyacountyguide.co.ke/makueni-county-017/- (accessed on 24 April 2019).
- Dodson, R.G. Geology of the South-East Machakos Area: Degree Sheet 52, SE Quadrant (with Coloured Map); Geological Survey of Kenya: Nairobi, Kenya, 1953.
- Ng’ang’a, S.; Kibetu, P.; Thumbi, G.; Okwadha, G.; Nyadawa, M. Groundwater Quality Assessment and Water Quality Indexing: Case Study of Makueni County, Eastern Kenya. J. Int. Acad. Res. Multidiscip. 2018, 6, 77–91. [Google Scholar]
- Kithiia, S.M. An assessment of water quality changes within the Athi and Nairobi river basins during the last decade. IAHS Publ. 2007, 314, 205. [Google Scholar]
- US-EPA. Quick Guide to Drinking Water Sample Collection 2016. Available online: https://www.epa.gov/sites/production/files/2015-11/documents/drinking_water_sample_collection.pdf (accessed on 9 October 2019).
- Rice, E.W. Standard Methods for the Examination of Water and Wastewater, 22nd ed.; American Public Health Association, Ed.; American Public Health Association: Washington, DC, USA, 2012. [Google Scholar]
- Rhoades, J.D.; Kandiah, A.; Mashali, A.M. Saline waters as resources. In The Use of Saline Waters for Crop Production. FAO Irrigation and Drainage Paper 48; FAO: Rome, Italy, 1992; pp. 5–10. [Google Scholar]
- Creed, J.; Brockhoff, C.; Martin, T. Method 200.8: Determination of Trace Elements in Waters and Wastes by Inductively Coupled Plasma–Mass Spectrometry, EMMC Version, Revision 5.4; EPA: Cincinnati, OH, USA, 1994.
- WHO. Guidelines for Drinking-Water Quality: Fourth Edition Incorporating the First Addendum; WHO Guidelines Approved by the Guidelines Review Committee, World Health Organization: Geneva, Switzerland, 2017. [Google Scholar]
- KEBS. Drinking Water—Specification, Part 1: The Requirements for Drinking. In Water, 3rd ed.; KEBS: Nairobi, Kenya, 2007. [Google Scholar]
- Piper, A.M. A graphic procedure in the geochemical interpretation of water-analyses. Trans. Am. Geophys. Union 1944, 25, 914. [Google Scholar] [CrossRef]
- Gibbs, R.J. Mechanisms Controlling World Water Chemistry. Science 1970, 170, 1088–1090. [Google Scholar] [CrossRef]
- Luo, W.; Gao, X.; Zhang, X. Geochemical processes controlling the groundwater chemistry and fluoride contamination in the Yuncheng Basin, China—An area with complex hydrogeochemical conditions. PLoS ONE 2018, 13, e0199082. [Google Scholar] [CrossRef]
- Ghasemi, A.; Zahediasl, S. Normality Tests for Statistical Analysis: A Guide for Non-Statisticians. Int. J. Endocrinol. Metab. 2012, 10, 486–489. [Google Scholar] [CrossRef]
- Bhat, S.A.; Meraj, G.; Yaseen, S.; Pandit, A.K. Statistical Assessment of Water Quality Parameters for Pollution Source Identification in Sukhnag Stream: An Inflow Stream of Lake Wular (Ramsar Site), Kashmir Himalaya. J. Ecosyst. 2014, 2014, 1–18. [Google Scholar] [CrossRef]
- Richards, L. Diagnosis and improvement of saline and alkali soils. Science 1954, 120, 800. [Google Scholar] [CrossRef]
- Wilcox, L.V. Classification and Use of Irrigation Waters; United States Department of Agriculture: Washington, DC, USA, 1995; Volume 969.
- Szabolcs, I. The influence of irrigation water of high sodium carbonate content on soils. Agrokem. Talajt. 1964, 13, 237–246. [Google Scholar]
- Handa, B. Description and classification of media for hydro-geochemical investigations. In Proceedings of the Ground Water Studies in Arid and Semi Arid Regions, Roorkee, India, 1969; pp. 319–337. [Google Scholar]
- Ayers, R.S.; Westcot, D.W. Water quality evaluation. In Water Quality for Agriculture; FAO Irrigation and Drainage Paper; Food and Agriculture Organization of the United Nations: Rome, Italy, 1985. [Google Scholar]
- Al-Hadithi, M.S. Application of Wilcox and United State Salinity Laboratory diagrams to assess groundwater quality for irrigation purposes around Saqlawiyah area, Al-Anbar, Iraq. Iraqi Bull. Geol. Min. 2016, 12, 29–37. [Google Scholar]
- Shankar, K.; Aravindan, S.; Rajendran, S. Hydrochemical Profile for Assessing the Groundwater Quality of Paravanar River Sub-Basin, Cuddalore District, Tamil Nadu, India. Curr. World Environ. 2006, 1, 45–52. [Google Scholar] [CrossRef]
- Brindha, K.; Kavitha, R. Hydrochemical assessment of surface water and groundwater quality along Uyyakondan channel, south India. Environ. Earth Sci. 2015, 73, 5383–5393. [Google Scholar] [CrossRef]
- Gevera, P.; Mouri, H. Natural occurrence of potentially harmful fluoride contamination in groundwater: An example from Nakuru County, the Kenyan Rift Valley. Environ. Earth Sci. 2018, 77, 365. [Google Scholar] [CrossRef]
- Ward, M.; Jones, R.; Brender, J.; de Kok, T.; Weyer, P.; Nolan, B.; Villanueva, C.; van Breda, S. Drinking Water Nitrate and Human Health: An Updated Review. Int. J. Environ. Res. Public Health 2018, 15, 1557. [Google Scholar] [CrossRef]
- AGRA. Climate Change Pushing Farmers in Makueni County to Shift from Maize Farming to Growing of Pulses. Available online: https://agra.org/climate-change-pushing-farmers-in-makueni-county-to-shift-from-maize-farming-to-growing-of-pulses/ (accessed on 4 September 2019).
- NHMRC; NRMMR. Natural Resource Management Ministerial Council Physical and Chemical quality of drinking water. In Australian Drinking Water Guidelines 6 2011: National Water Quality Management Strategy; National Health and Medical Research Council, Commonwealth of Australia: Canberra, Australia, 2011; pp. 79–93. [Google Scholar]
- Khan, A.E.; Ireson, A.; Kovats, S.; Mojumder, S.K.; Khusru, A.; Rahman, A.; Vineis, P. Drinking Water Salinity and Maternal Health in Coastal Bangladesh: Implications of Climate Change. Environ. Health Perspect. 2011, 119, 1328–1332. [Google Scholar] [CrossRef]
- Nahian, M.A.; Ahmed, A.; Lázár, A.N.; Hutton, C.W.; Salehin, M.; Streatfield, P.K. Drinking water salinity associated health crisis in coastal Bangladesh. Elem. Sci. Anthr. 2018, 6, 2. [Google Scholar] [CrossRef]
- Skinner, H.C.W. Mineralogy of Bones. In Essentials of Medical Geology; Selinus, O., Ed.; Springer: Dordrecht, The Netherlands, 2013; pp. 665–687. [Google Scholar]
- Gevera, P.; Mouri, H.; Maronga, G. Occurrence of fluorosis in a population living in a high-fluoride groundwater area: Nakuru area in the Central Kenyan Rift Valley. Environ. Geochem. Health 2019, 41, 829–840. [Google Scholar] [CrossRef]
- James, R.M. Dental Fluorosis and Parental Knowledge of Risk Factors for Dental Fluorosis. Master’s Thesis, University of the Western Cape, Cape Town, South Africa, 2016. [Google Scholar]
| Water Quality Parameters | Range | Median | Mean | SD | WHO (2017) | % Above Standard | KEBS (2007) | % Above Standard |
|---|---|---|---|---|---|---|---|---|
| pH | 6.94–8.53 | 7.84 | 7.78 | 0.46 | 8.5 | 5 | 8.5 | 5 |
| Colour (mgPt/L) | 5–100 | 5 | 13 | 23 | 15 | 10 | 15 | 10 |
| Turbidity (N.T.U) | 0.85–84 | 2.16 | 9.04 | 18 | 5 | 25 | 5 | 25 |
| Conductivity (μS/cm) 25 °C | 480–6320 | 2077 | 2321 | 1618 | 2500 | 35 | - | - |
| Hardness (mgCaCO3/L) | 64–1880 | 530 | 651 | 547 | 500 | 50 | 300 | 60 |
| Alkalinity (mgCaCO3/L) | 100–602 | 306 | 310 | 144 | 500 | 20 | - | - |
| Salinity | 336–4424 | 1454 | 1624 | 1132 | - | - | - | - |
| TDS (mg/L) | 64–3918 | 1288 | 1412 | 1034 | 1500 | 23 | 1000 | 55 |
| Fe | 0.03–1.27 | 0.07 | 0.17 | 0.28 | 0.3 | 10 | 0.3 | 10 |
| Mn | 0.01–0.18 | 0.08 | 0.04 | 0.06 | 0.1 | 15 | 0.5 | 0 |
| Ca | 8–432 | 90 | 136 | 138 | 100 | 40 | 150 | 25 |
| Mg | 7.78–199 | 64 | 75 | 58 | 100 | 30 | 100 | 30 |
| Na | 20–980 | 155 | 221 | 222 | 200 | 25 | 200 | 25 |
| K | 1.7–65 | 17 | 20 | 14 | 50 | 5 | - | |
| Cl− | 6–960 | 195 | 347 | 320 | 250 | 45 | 250 | 45 |
| HCO3− | 122–734 | 373 | 378 | 175 | - | - | - | - |
| F− | 0.6–7.17 | 1.365 | 1.86 | 1.59 | 1.5 | 50 | 1.5 | 50 |
| NO3− | 0.2–43 | 11 | 13 | 12 | 10 | 50 | - | |
| NO2− | 0.01–0.04 | 0.01 | 0.01 | 0.01 | 0.1 | 0 | 0.003 | 100 |
| SO42− | 14–1580 | 106 | 296 | 404 | 450 | 20 | 400 | 20 |
| Free CO2 | 0–94 | 28 | 33 | 23 | - | - | - | - |
| Cr | 0.00–2.43 | 0.12 | 0.47 | 0.66 | 50 | 0 | 50 | 0 |
| Co | 0.00–0.54 | 0.18 | 0.19 | 0.14 | 0 | - | - | |
| Ni | 0.15–11.27 | 1.48 | 2.29 | 3.00 | 70 | 0 | - | - |
| Cu | 0.74–13.22 | 1.50 | 3.04 | 3.38 | 2000 | 0 | 100 | 0 |
| Zn | 0.31–426 | 3.26 | 68.08 | 130 | 3000 | 0 | 5000 | 0 |
| As | 0.02–2.78 | 0.25 | 0.58 | 0.76 | 10 | 0 | 50 | 0 |
| Se | 0.36–14 | 3.54 | 4.41 | 3.88 | 10 | 10 | 10 | 10 |
| Cd | 0.01–0.27 | 0.01 | 0.03 | 3.88 | 3 | 0 | 5 | 0 |
| Pb | 0.05–0.23 | 0.05 | 0.02 | 0.06 | 50 | 0 | 10 | 0 |
| Tests of Normality | |||
|---|---|---|---|
| Shapiro–Wilk | |||
| Statistic | df | Sig. | |
| pH | 0.95 | 20 | 0.367 * |
| Colour | 0.39 | 20 | 0.000 |
| Turbidity | 0.46 | 20 | 0.000 |
| Conductivity | 0.89 | 20 | 0.030 |
| Fe | 0.48 | 20 | 0.000 |
| Mn | 0.56 | 20 | 0.000 |
| Ca | 0.79 | 20 | 0.001 |
| Mg | 0.90 | 20 | 0.061 * |
| Na | 0.74 | 20 | 0.000 |
| K | 0.87 | 20 | 0.012 |
| Total hardness | 0.87 | 20 | 0.015 |
| Total alkalinity | 0.94 | 20 | 0.252 * |
| Cl− | 0.86 | 20 | 0.009 |
| F− | 0.69 | 20 | 0.000 |
| NO3− | 0.86 | 20 | 0.009 |
| NO2− | 0.58 | 20 | 0.000 |
| SO42− | 0.68 | 20 | 0.000 |
| Free CO2 | 0.94 | 20 | 0.284 * |
| TDS | 0.91 | 20 | 0.092 * |
| HCO3− | 0.94 | 20 | 0.252 * |
| Cr | 0.71 | 20 | 0.000 |
| Co | 0.93 | 20 | 0.162 * |
| Ni | 0.69 | 20 | 0.000 |
| Cu | 0.69 | 20 | 0.000 |
| Zn | 0.58 | 20 | 0.000 |
| As | 0.70 | 20 | 0.000 |
| Se | 0.87 | 20 | 0.015 |
| Cd | 0.55 | 20 | 0.000 |
| Pb | 0.54 | 20 | 0.000 |
| PC1 | PC2 | PC3 | |
|---|---|---|---|
| Ca | 0.955 | 0.182 | −0.060 |
| Total hardness | 0.952 | 0.072 | 0.004 |
| Cl− | 0.823 | −0.069 | −0.122 |
| Ni | 0.800 | −0.112 | 0.013 |
| Mg | 0.790 | −0.099 | 0.096 |
| TDS | 0.749 | −0.066 | −0.016 |
| Conductivity | 0.735 | −0.022 | −0.027 |
| Zn | −0.123 | 0.885 | 0.317 |
| Pb | 0.092 | 0.883 | −0.040 |
| Mn | −0.069 | 0.746 | −0.028 |
| Free CO2 | 0.253 | 0.593 | −0.178 |
| Cu | −0.043 | 0.534 | −0.224 |
| Turbidity | 0.033 | −0.001 | 0.994 |
| Colour | 0.066 | 0.001 | 0.979 |
| Fe | −0.045 | 0.064 | 0.976 |
| F− | −0.066 | −0.007 | −0.140 |
| Na | 0.144 | −0.112 | −0.047 |
| SO42− | 0.465 | −0.033 | 0.075 |
| Se | 0.023 | −0.276 | −0.035 |
| K | 0.022 | −0.229 | −0.123 |
| Total alkalinity | 0.128 | 0.269 | 0.061 |
| HCO3− | 0.128 | 0.269 | 0.061 |
| Cr | −0.053 | 0.162 | 0.004 |
| Co | −0.147 | 0.154 | 0.060 |
| As | −0.270 | −0.221 | 0.242 |
| NO2− | 0.052 | −0.191 | 0.115 |
| NO3− | 0.113 | −0.253 | −0.134 |
| pH | −0.063 | −0.173 | 0.082 |
| Cd | −0.057 | −0.040 | −0.073 |
| Eigenvalue | 8.127 | 4.334 | 3.307 |
| Variance (%) | 28.024 | 14.945 | 11.403 |
| Cumulative % | 28.024 | 42.969 | 54.372 |
| TDS | Conductivity | Mg2+ | SO42− | Total Hardness | Cl− | Na+ | Ca2+ | Mn2+ | Pb2+ | Zn2+ | Total Alkalinity | HCO3− | Free CO2 | Fe2+ | Colour | Turbidity | F− | |
|---|---|---|---|---|---|---|---|---|---|---|---|---|---|---|---|---|---|---|
| TDS | 1.000 | |||||||||||||||||
| Conductivity | 0.958 ** | 1.000 | ||||||||||||||||
| Mg2+ | 0.838 ** | 0.866 ** | 1.000 | |||||||||||||||
| SO42− | 0.811 ** | 0.841 ** | 0.660 ** | 1.000 | ||||||||||||||
| Hardness | 0.801 ** | 0.843 ** | 0.921 ** | 0.690 ** | 1.000 | |||||||||||||
| Cl− | 0.859 ** | 0.922 ** | 0.824 ** | 0.638 ** | 0.816 ** | 1.000 | ||||||||||||
| Na+ | 0.670 ** | 0.626 ** | 0.334 | 0.563 ** | 0.167 | 0.543 * | 1.000 | |||||||||||
| Ca2+ | 0.733 ** | 0.786 ** | 0.840 ** | 0.703 ** | 0.971 ** | 0.755 ** | 0.094 | 1.000 | ||||||||||
| Mn2+ | −0.243 | −0.112 | 0.029 | −0.016 | 0.155 | −0.132 | −0.490 * | 0.246 | 1.000 | |||||||||
| Pb2+ | −0.481 * | −0.465 * | −0.280 | −0.265 | −0.135 | −0.429 | −0.591 ** | −0.029 | 0.437 | 1.000 | ||||||||
| Zn2+ | −0.305 | −0.230 | −0.355 | −0.259 | −0.264 | −0.176 | −0.042 | −0.211 | 0.271 | 0.359 | 1.000 | |||||||
| Alkalinity | 0.366 | 0.305 | 0.356 | 0.360 | 0.437 | 0.123 | −0.044 | 0.433 | 0.512 * | −0.129 | −0.259 | 1.000 | ||||||
| HCO3− | 0.366 | 0.305 | 0.356 | 0.360 | 0.437 | 0.123 | −0.044 | 0.433 | 0.512 * | −0.129 | −0.259 | 1.000 ** | 1.000 | |||||
| Free CO2 | 0.405 | 0.537 * | 0.463 * | 0.334 | 0.581 ** | 0.593 ** | 0.086 | 0.581 ** | 0.390 | −0.330 | 0.074 | 0.356 | 0.356 | 1.000 | ||||
| Fe2+ | −0.347 | −0.418 | −0.220 | −0.374 | −0.326 | −0.442 | −0.134 | −0.365 | 0.162 | 0.438 | 0.494 * | −0.108 | −0.108 | −0.335 | 1.000 | |||
| Colour | −0.280 | −0.343 | −0.084 | −0.284 | −0.202 | −0.432 | −0.297 | −0.222 | −0.063 | 0.451 * | 0.265 | −0.256 | −0.256 | −0.462 * | 0.698 ** | 1.000 | ||
| Turbidity | −0.071 | −0.165 | 0.027 | −0.224 | 0.019 | −0.224 | −0.297 | 0.038 | −0.182 | 0.238 | −0.033 | −0.105 | −0.105 | −0.253 | 0.163 | 0.582 ** | 1.000 | |
| F− | 0.298 | 0.263 | 0.205 | 0.424 * | 0.045 | 0.093 | 0.412 * | 0.017 | 0.008 | −0.388 * | −0.484 * | 0.413 * | 0.413 * | −0.86 | −0.222 | −0.355 | −0.510 * | 1.000 |
| Range | Category | Number of Samples |
|---|---|---|
| SAR (mg/L) | ||
| <10 | Excellent | 5 |
| 10–18 | Good | 5 |
| 18–26 | Doubtful | 3 |
| > 26 | Unsuitable | 7 |
| Na% | ||
| <20 | Excellent | 3 |
| 20–40 | Good | 5 |
| 40–60 | Permissible | 4 |
| 60–80 | Doubtful | 6 |
| > 80 | Unsuitable | 2 |
| MH (meq/L) | ||
| <50 | Suitable | 8 |
| >50 | Unsuitable | 12 |
| EC (µS/cm) | ||
| <250 | low | 0 |
| 250–750 | Medium | 2 |
| 750–2250 | High | 8 |
| >2250 | Very high | 10 |
© 2020 by the authors. Licensee MDPI, Basel, Switzerland. This article is an open access article distributed under the terms and conditions of the Creative Commons Attribution (CC BY) license (http://creativecommons.org/licenses/by/4.0/).
Share and Cite
Gevera, P.K.; Cave, M.; Dowling, K.; Gikuma-Njuru, P.; Mouri, H. Naturally Occurring Potentially Harmful Elements in Groundwater in Makueni County, South-Eastern Kenya: Effects on Drinking Water Quality and Agriculture. Geosciences 2020, 10, 62. https://doi.org/10.3390/geosciences10020062
Gevera PK, Cave M, Dowling K, Gikuma-Njuru P, Mouri H. Naturally Occurring Potentially Harmful Elements in Groundwater in Makueni County, South-Eastern Kenya: Effects on Drinking Water Quality and Agriculture. Geosciences. 2020; 10(2):62. https://doi.org/10.3390/geosciences10020062
Chicago/Turabian StyleGevera, Patrick Kirita, Mark Cave, Kim Dowling, Peter Gikuma-Njuru, and Hassina Mouri. 2020. "Naturally Occurring Potentially Harmful Elements in Groundwater in Makueni County, South-Eastern Kenya: Effects on Drinking Water Quality and Agriculture" Geosciences 10, no. 2: 62. https://doi.org/10.3390/geosciences10020062
APA StyleGevera, P. K., Cave, M., Dowling, K., Gikuma-Njuru, P., & Mouri, H. (2020). Naturally Occurring Potentially Harmful Elements in Groundwater in Makueni County, South-Eastern Kenya: Effects on Drinking Water Quality and Agriculture. Geosciences, 10(2), 62. https://doi.org/10.3390/geosciences10020062


