1. Introduction
Fault detection is an ongoing safety issue in the mining industry, especially in underground situations. Detailed information about faults and fractures reducing rock stability have crucial impact on mining activities. In 2017, a major rock fall occurred in one of the mining chambers of an underground marble mine. Since then, mining activities in the area near the rock fall have been shut down. However, the affected mining chamber still contains valuable marble reserves. To obtain further information concerning fault and fractures within the affected area, a fast detection method like the ground-penetrating radar (GPR) is of great interest.
GPR data collection is either performed in reflection mode with the receiver and transmitter situated next to each other or in transmission mode. For the latter, the antennas are put into different boreholes so that the signal travels through the underground. By varying the position of the antennas in the boreholes and measuring the time it takes for the signal to reach the receiver, one can create velocity models in between the boreholes [
1,
2]. Alternatively, it is possible to extract amplitude variations and create attenuation models of the underground [
3,
4].
While there are some examples for GPR (in reflection mode) applied to detect geohazards in mining environments [
5,
6,
7,
8], information on crosshole radar is very sparse. However, several studies show successful application of crosshole radar in sediments for identifying zones with higher moisture content [
2,
9,
10] or identifying voids in the subsurface [
11,
12]. It is known that faults inside the mine are exposed to the influx of meteoric water. As EM (electromagnetic) wave velocities are strongly reduced in presence of water, we aim to test if GPR and crosshole radar measurements are applicable to detect such features in the marble mine.
2. Measurements
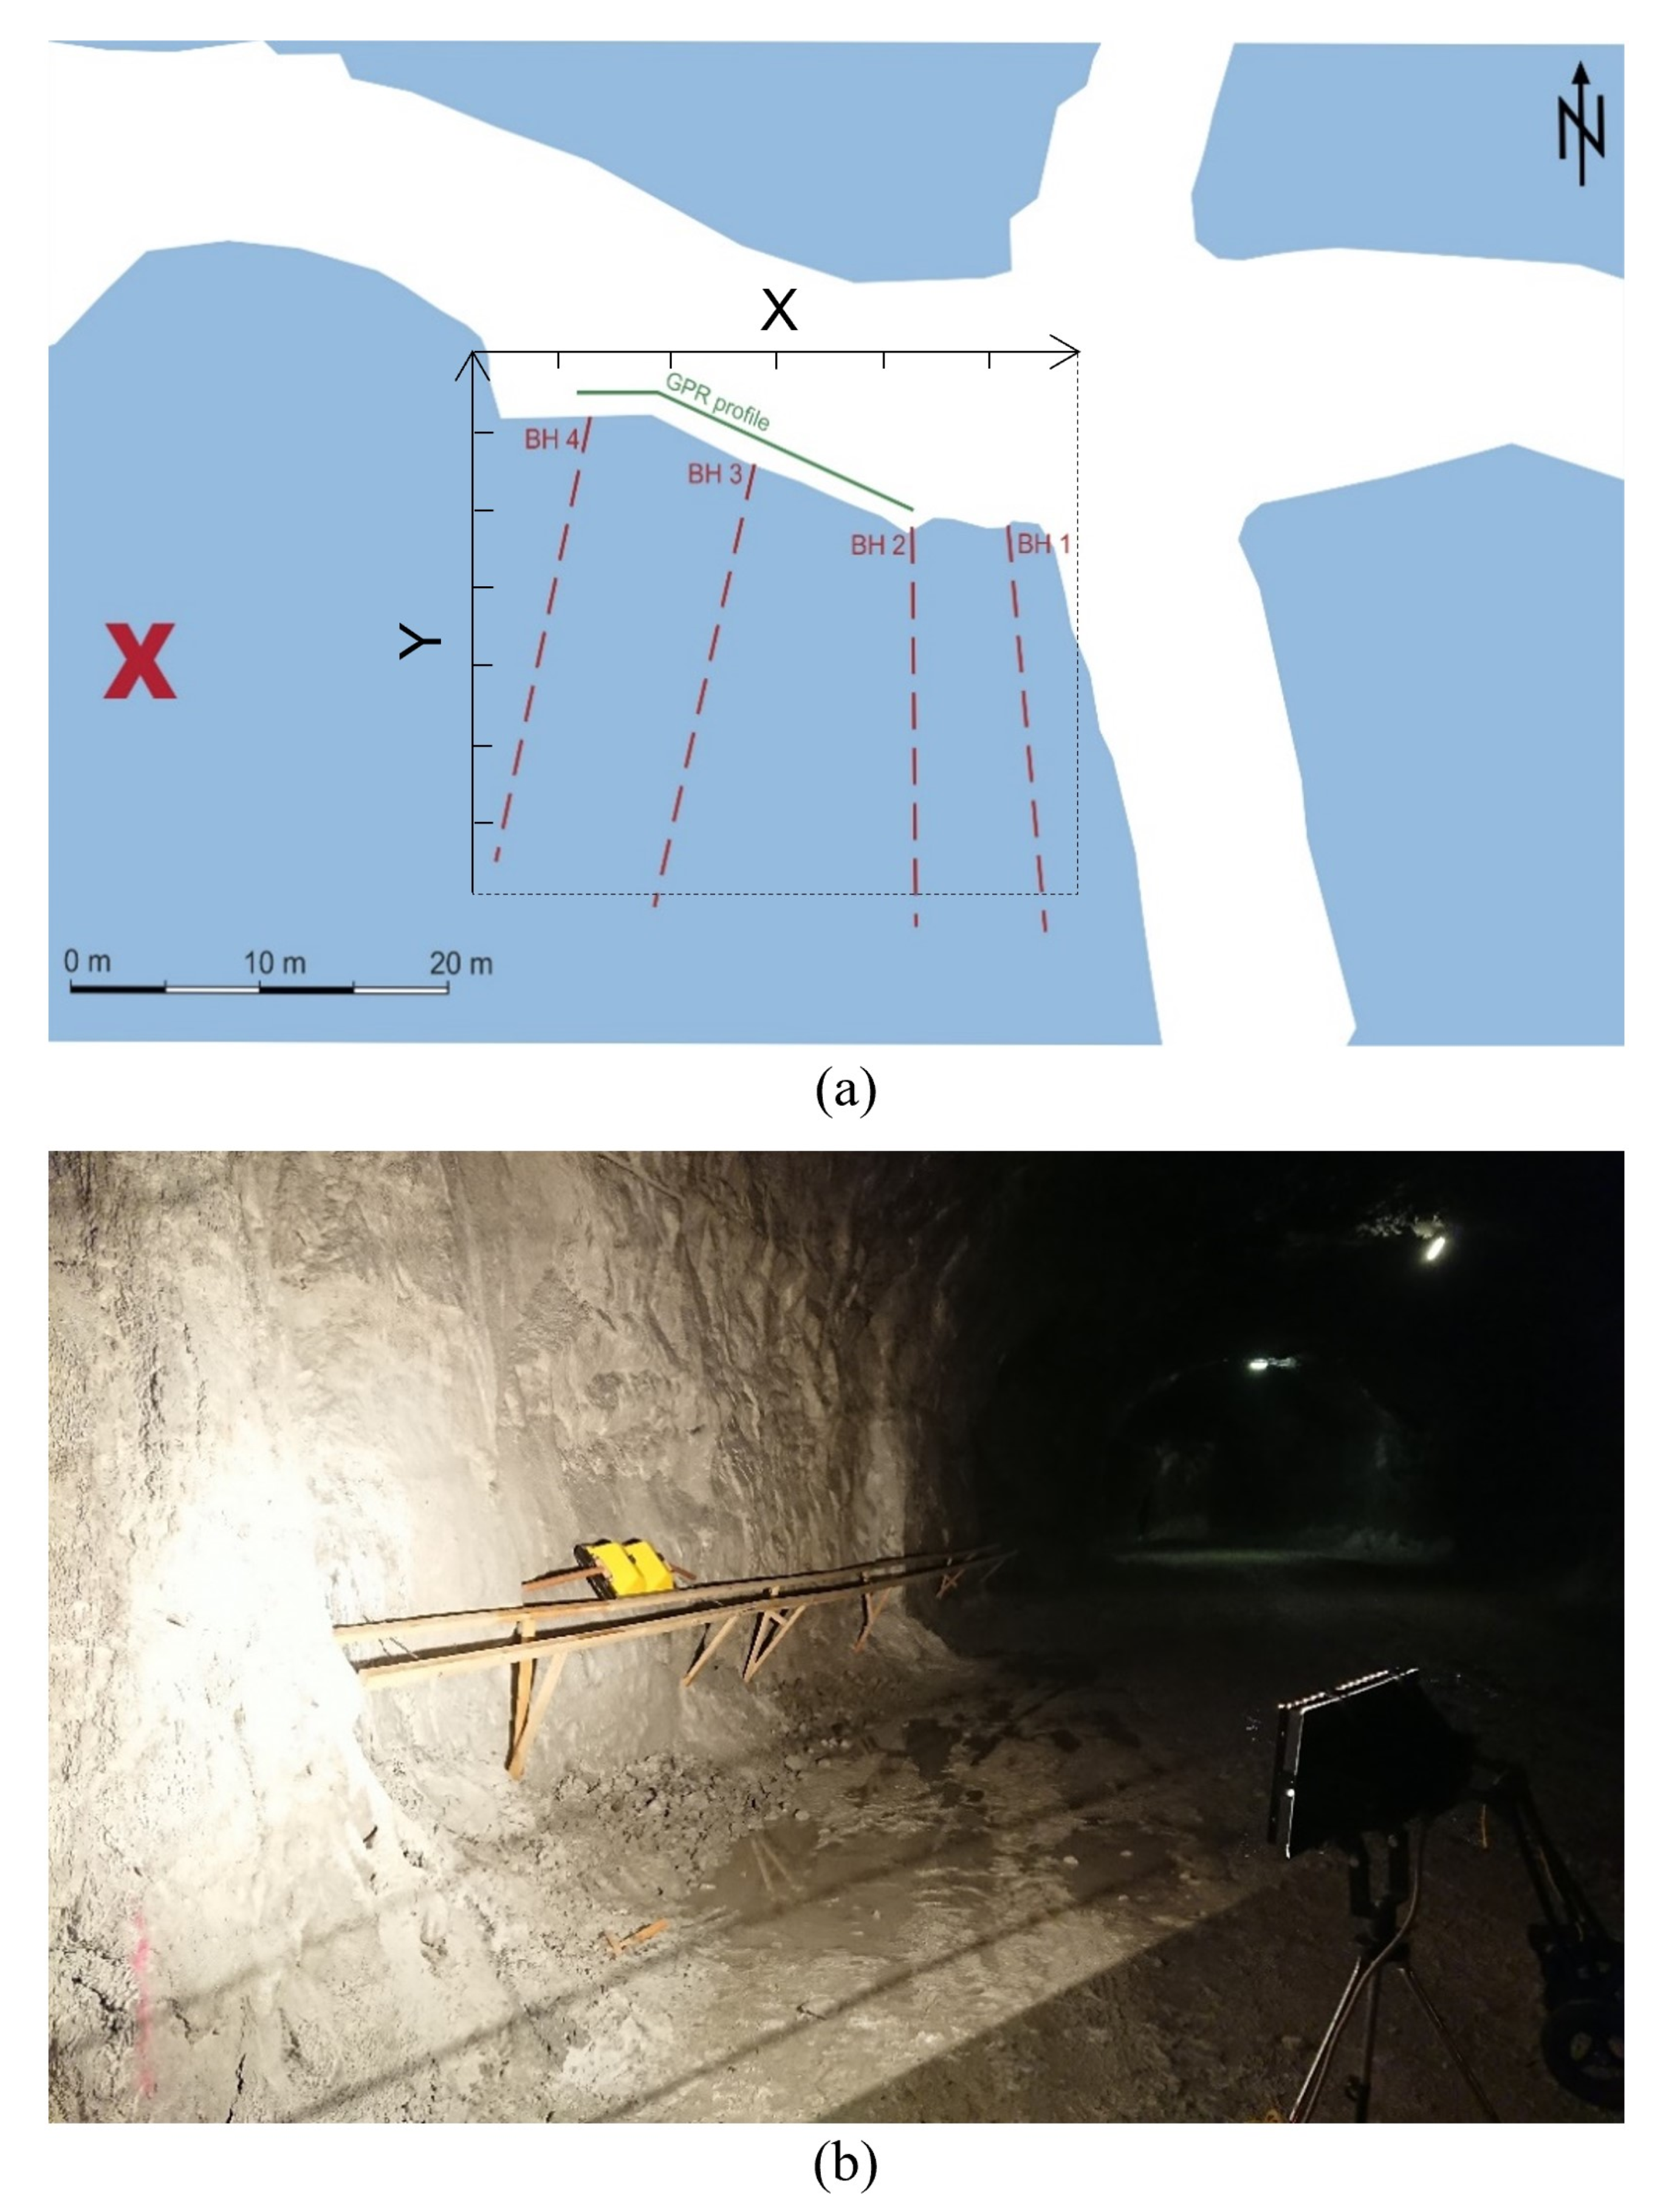
The marble unit in the mine is rather massive and homogenous, which enables sublevel stoping, yet the rock is often fractured and cut by several fault systems. The survey area is located one level above in the continuation of the rockfall (
Figure 1). All measurements were performed along a tunnel sidewall which is used for transportation and logistics within the mine. During the measurements in September 2018 and July 2019, there were no remarkable rainfalls in the survey area. The weather conditions inside the mine are constant throughout the year with a humidity of almost 100% and a temperature of about 8 °C. Inspection of the geological map of the mine reveals that faults run parallel to the marble successions, both having a dip of approximately 60° towards north. Accordingly, the four boreholes utilized were drilled orthogonal to geological structures, approximately 30° towards the south. As tomographic inversion is strongly affected by errors in borehole geometry, the precise location and deviation are of utmost importance [
13]. These had an increasing offset from about 5 to 25 m. As such, the position of the boreholes was measured with a theodolite, and the azimuth and dip angles were determined at 1 m steps by a borehole probe (Pulsar Blasthole Probe Mk3, Adelschlag, Germany) with an inclination precision of 0.25° and a compass precision of 1°, according to the manufacture’s website.
All data for the crosshole measurements were collected with a 100 MHz antenna (pulseEKKO PRO, Sensors & Software Inc., Mississauga, ON, Canada). The top antenna position is at 2 m and the lowest at 28 m depth. Transmitter and receiver step sizes of 0.5 and 1 m, respectively, were chosen for the boreholes. Measurements were performed between adjacent and various combinations of boreholes as described in
Table 1. Time zero calibration was performed to compensate for instrumentation drift. Crosshole radar data were collected statically with manual triggering and multiple offset gather (MOG) geometry—see [
14]. All boreholes were imaged with a standard borehole camera and checked for borehole quality, geology, faults and karstification zones. This information is used for correlation with the reflection and crosshole radar results. The boreholes appeared to be clear, without major deformation or strong changes in inclination. They are typically drilled for blasting using destructive methods without preserving any core material. Due to out-of-plane effects, meaningful correlation with the GPR profiles is only possible if the faults cross cut the boreholes perpendicular. Resolution of the crosshole radar depends on the applied frequency and the borehole distance (
Table 1). It is expected to be between 2.2–3.9 m (Fresnel-zone diameters for forward scattered waves).
GPR antennas from pulseEKKO PRO with 100 and 250 MHz center frequencies were used to collect data in reflection mode along a 20 m-long profile that runs between boreholes 2 and 4 (
Figure 1a). A wooden framework was built along the sidewalk to aide data acquisition and guide the radar antenna along the plane of the borehole tops. Ground conditions of the tunnel did not allow for sufficient radar penetration (
Figure 1b), and metal bolts which may have an influence on the data were used every five meters to attach the framework to the wall. Furthermore, weather conditions within the mine lead to the deposition of conductive fine-grained mud on the walls. This was brushed off before the measurements to guarantee a reasonable penetration depth. Data with the 250 MHz antenna were collected every 10 cm using a sampling interval of 0.4 ns. The 100 MHz antenna collected data every 25 cm with a 0.8 ns sampling. Noise reduction was attained by stacking the data 32 times. The vertical resolution of the reflection radars is expected to be around ¼ of the wavelength, which is, assuming velocities of about 0.1 m/ns, about 0.25 m for the 100 MHz antenna and 0.1 m for the 250 MHz antenna. Although the resolution limits of our radar measurements might be bigger than the size of the expected fractures, the increased permittivity contrast caused by water-saturated fractures has an influence on the GPR measurements. Such features can be recognized despite being smaller than the previously mentioned resolutions [
5].
GPR measurements collected with unshielded antennas are known to be affected by airborne signal reflected from above and around the radar. This effect is especially strong in underground situations were walls of the galleries produce strong reflections. For this reason, a self-made shielding, made of a fine-meshed metal, was tested on the unshielded 100 MHz antenna. The shield is 2 × 1 m in size and was attached to both the receiver and transmitter simultaneously. Although the higher frequency 250 MHz antenna is shielded by the manufacturer, one has to expect similar airborne reflections, as shielding is never perfect and comes with a trade-off in data quality reduction. Additionally, shielding is known to introduce ringing and affects the maximum penetration depth [
14]. Nevertheless, comparison of the shielded and unshielded antenna helps to determine the origin of reflectors observed in the data sets.
3. Processing and Modelling
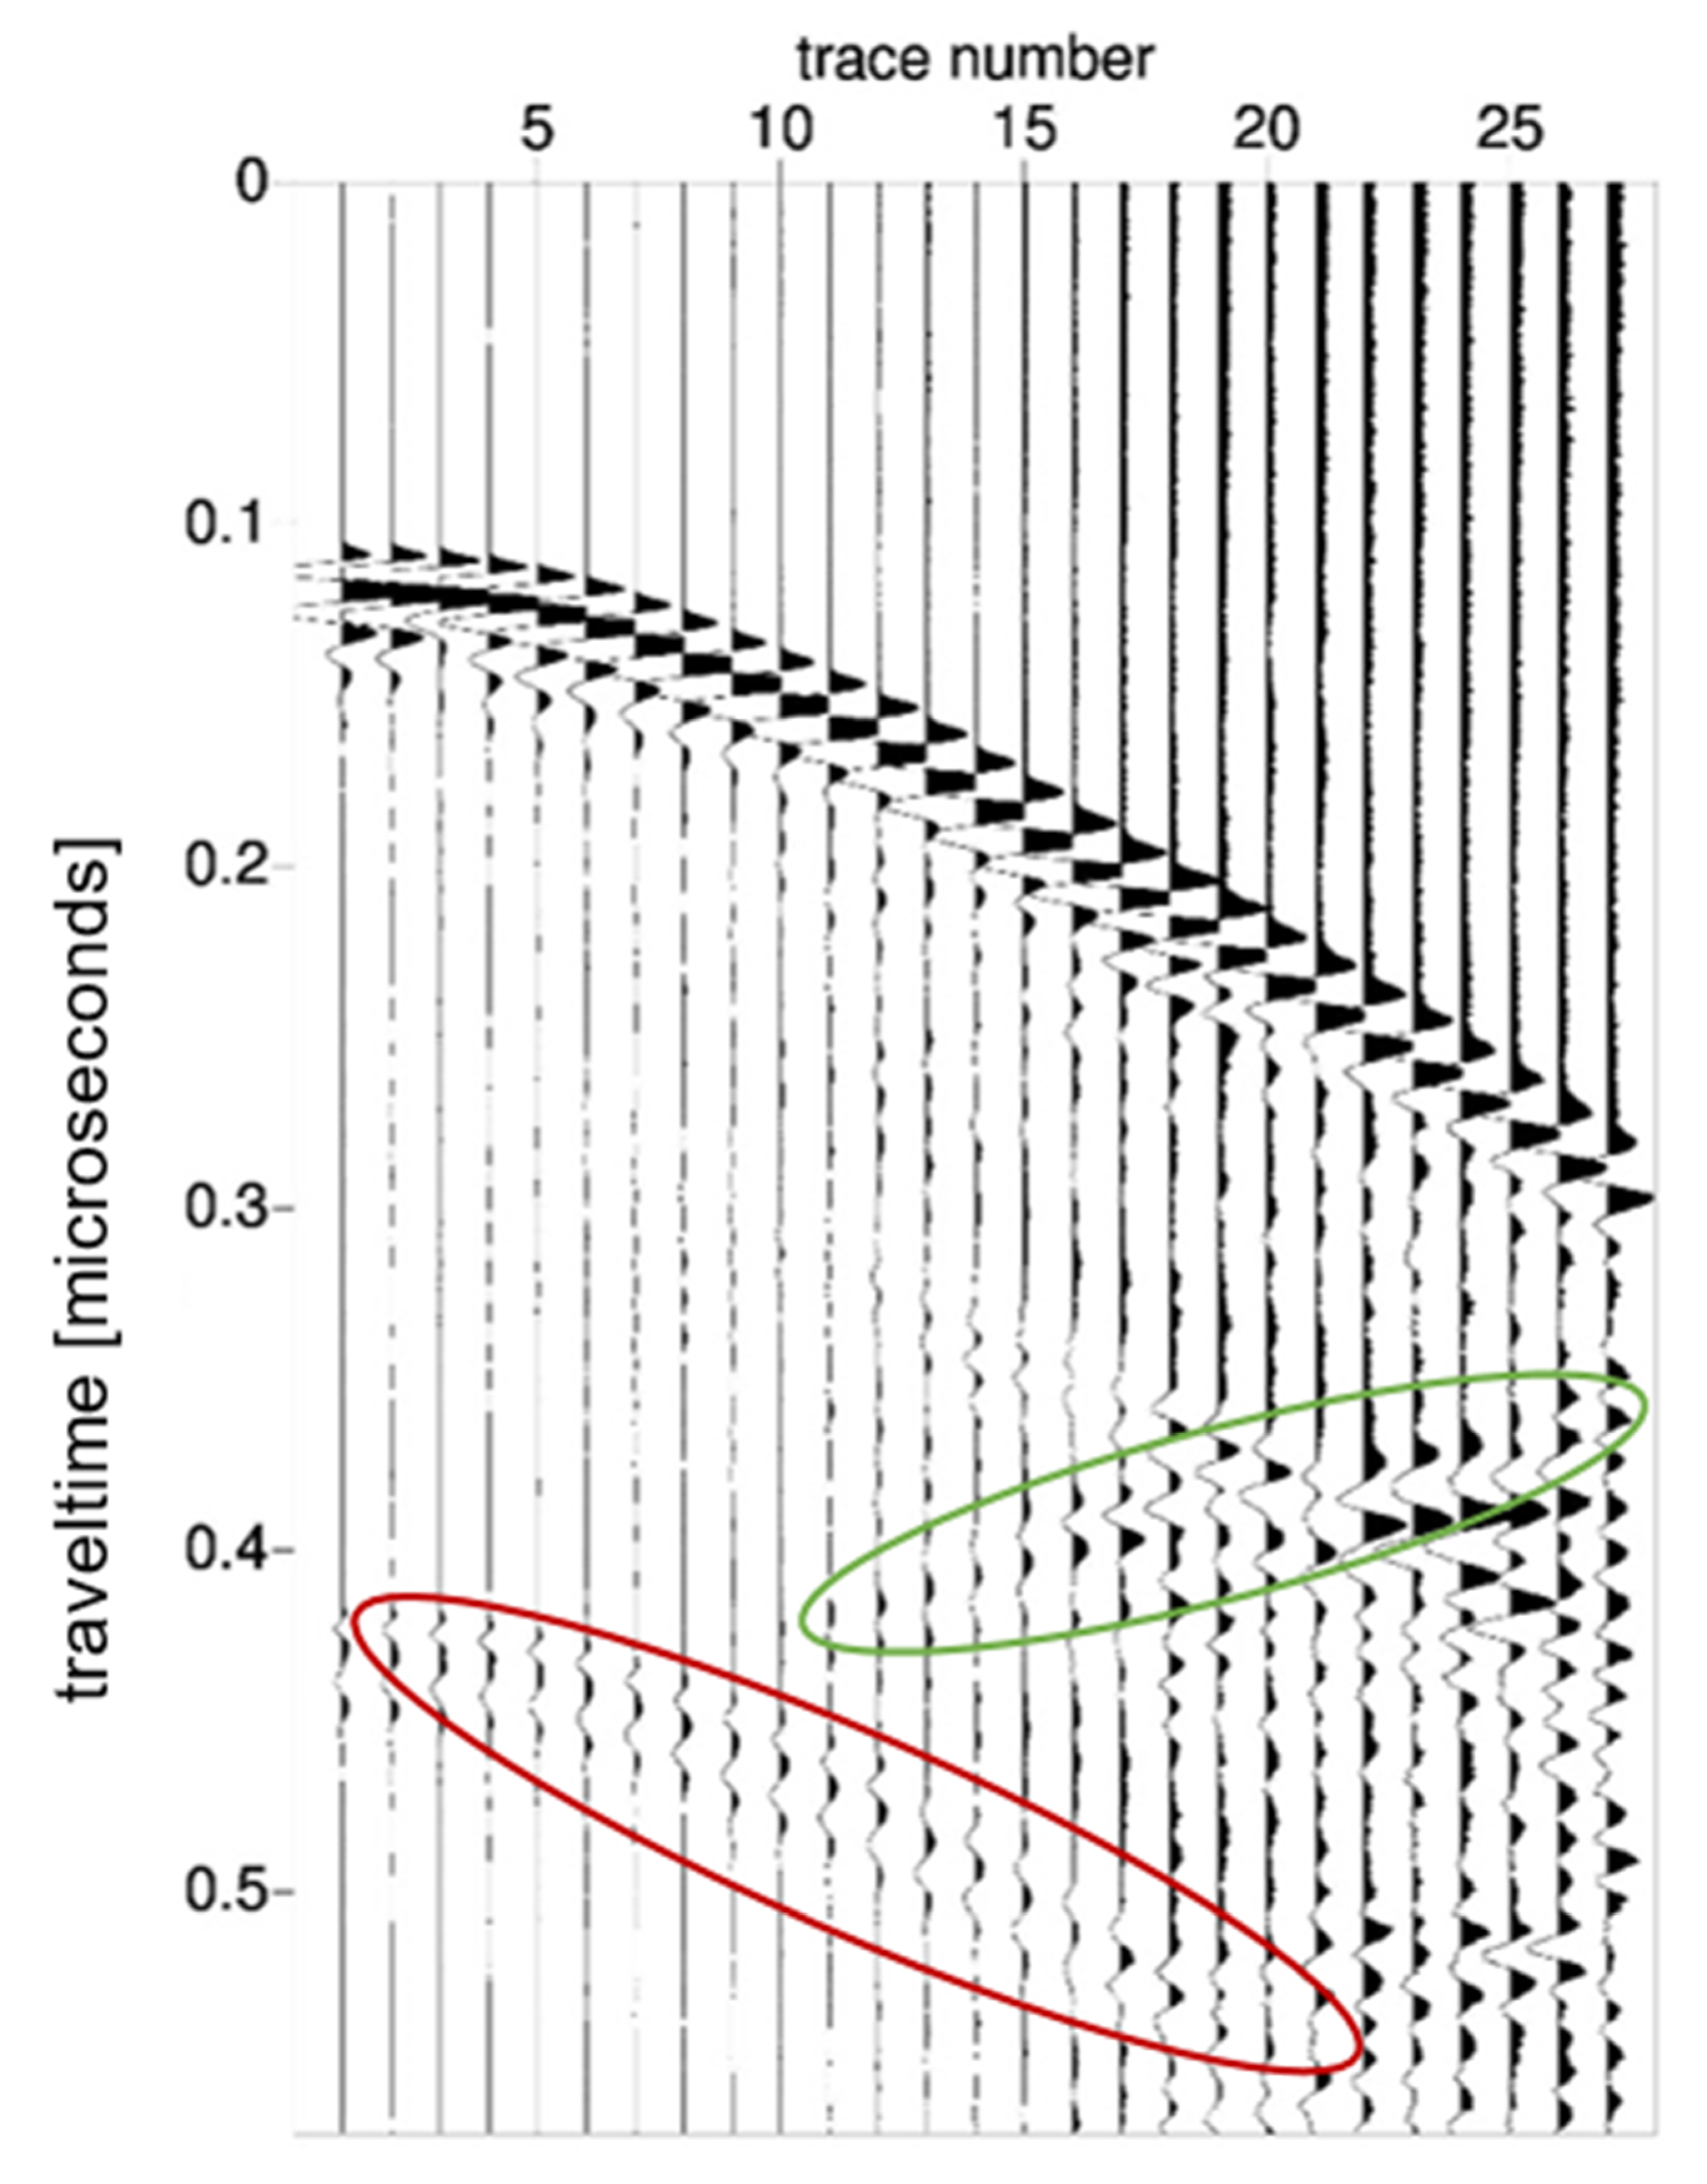
In contrast to radar data measured in reflection mode, crosshole data usually do not require cumbersome processing. The processing of the crosshole data started with applying “time-zero” correction as described in the manual of the manufacturer. In the following step, first arrivals were selected on raw shot gathers (
Figure 2) with the help of the program “zplot”. Several features are already visible on these gathers. A retrograde reflection (green circle,
Figure 2) represents the signal coming from the opposite of the gallery. Another hyperbola mimicking the first arrival (red circle,
Figure 2) is a reflection from the gallery wall next to borehole 1. Variations in travel times due to geologic heterogeneities might be in the order of a few ns; thus, sufficient time is invested into precise selection. First arrivals were selected with an accuracy of about 0.7 ns for small antenna separations and up to 2.5 ns for the more distant travel paths. All data were processed in the same local coordinate system to guarantee comparability of the individual GPR results (X and Y axes in Figures 3–6). If not stated otherwise, all processing steps were performed with Seismic Unix.
Tomographic inversion of real data is classically a mixed determined problem. A damped [
15] least-squares approach with updating model perturbations was chosen for solving the inversion—see [
16]. A finite difference algorithm, as described in [
17], was used to solve the forward problem and compute the travel paths of the rays—see [
18]. The homogeneous background model has a constant velocity of 0.102 m/ns, and the model parametrization gridding is 1 × 1 m. The inversion is computed with an offset weighting to compensate for the inaccuracy of the selections at long travel paths. Travel times were inverted with the program “simulr16”. Strictly speaking, the borehole geometry is three-dimensional and would therefore require a 3D model. However, as the boreholes all dip approximately 30° towards the south, the computed results were projected onto a dipping plane, and, therefore, 2D models are sufficient.
As stated above, the influence from geology on travel times is expected to be very small, and, hence, the geometry of the boreholes must be accurately identified. Boreholes in hard rock environments typically show deviation towards one direction with increasing depth and should never be assumed to run straight. Previous usage of the borehole probe revealed a measurement inaccuracy of up to 10 cm over a 30 m depth interval. Our first inversion results showed an unsatisfactory data misfit, likely due to an imprecise geometry. Thus, in a subsequent inversion scheme, we implemented a static shift between the transmitter and receiver stations. The resulting delay times show a drift with increasing depth. We assume that this is caused by a drift in the borehole survey probe, which introduces geometry errors. Therefore, we conclude our inversion procedure to be justified.
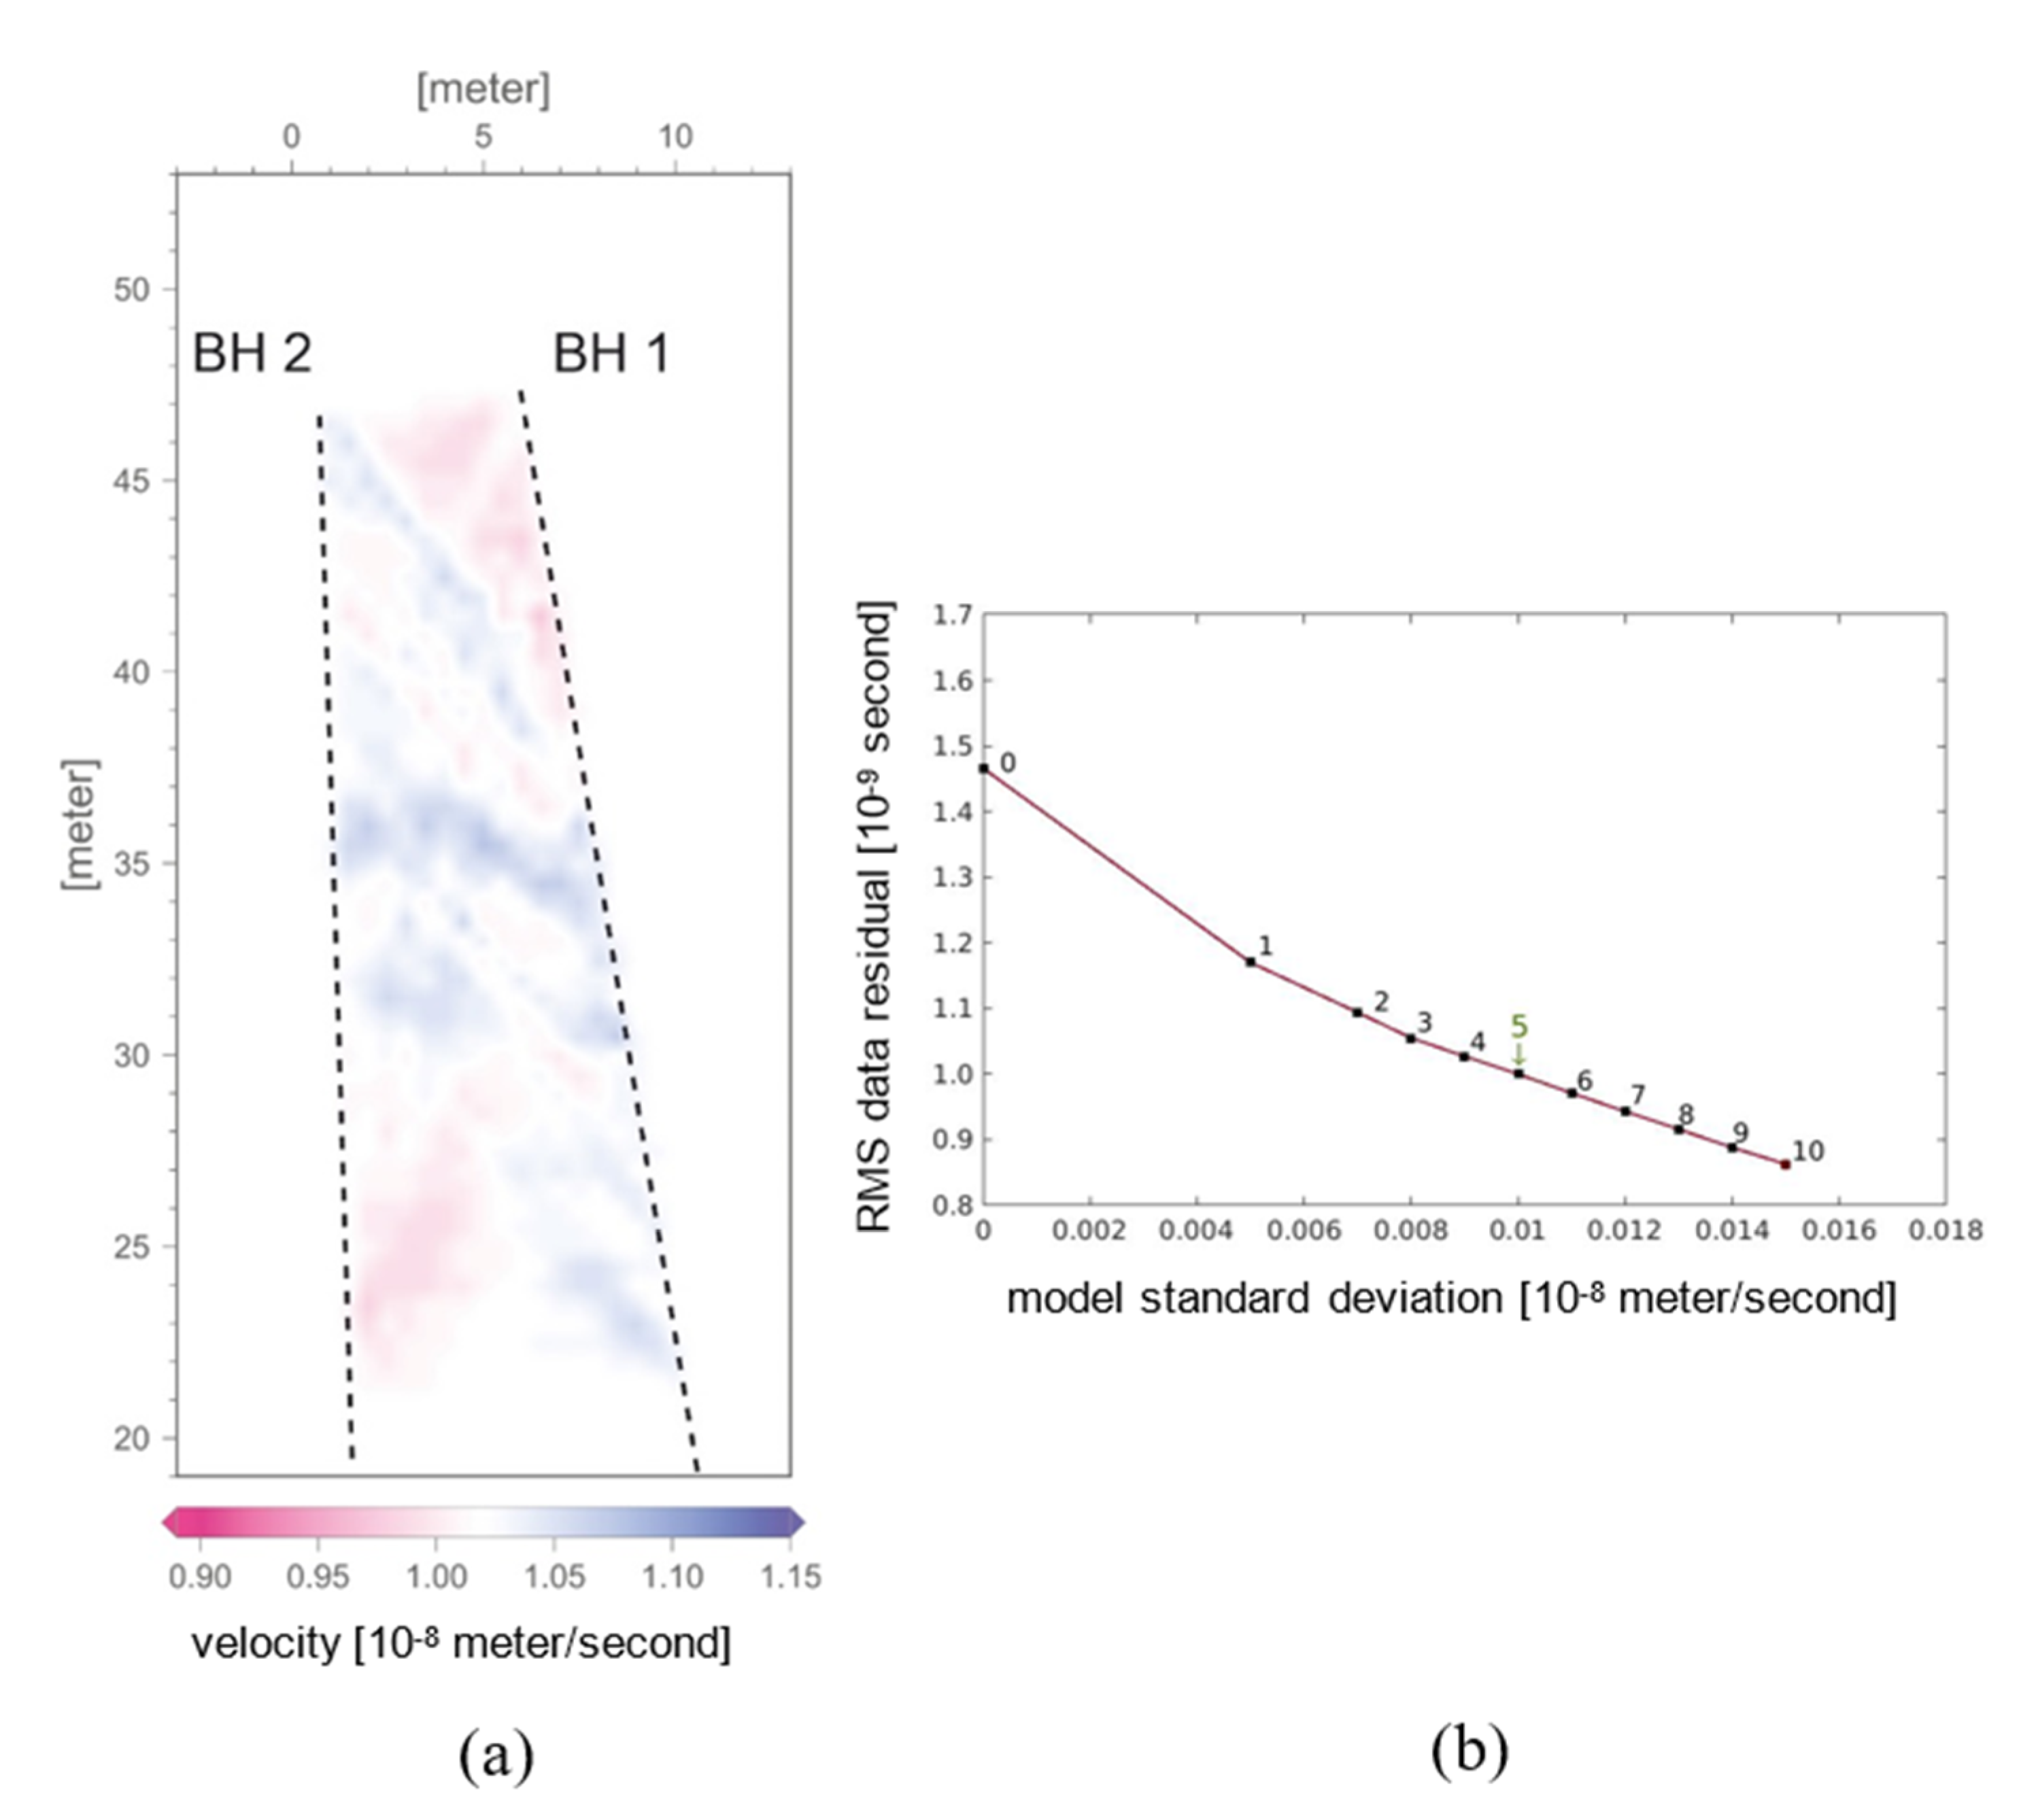
Tomographic images were created for all borehole pairs given in
Table 1 (one example is shown in
Figure 3a). The inversion process was computed until the data variance decreased to within the magnitude of the selection accuracy, which is around 1 ns when taking offset weighting into account (
Figure 3b). The individual tomograms showed strong artefacts in their corners that were attenuated by joining them into one image. Borehole pair 3-4 was excluded as it had erroneously strong velocity anomalies. We believe the coordinates of borehole 4 were not of sufficient accuracy. Erroneous geometry for close boreholes has a stronger influence on the result than for those further away, thus, we included the tomogram of borehole pair 2-4 into our final image (Figure 6). Processing of the reflection mode GPR included moving the start time to zero, applying a bandpass filter from 15–210 MHz for the 100 MHz antenna or 50–475 MHz for the 250 MHz antenna, respectively. Afterwards, an average trace was subtracted to remove horizontal ringing. Data gain was applied to correct for spherical divergence by multiplying the data with its arrival time, and traces were balanced by rms division. A kinematic 2D Kirchoff prestack depth migration was performed with a constant migration velocity of 0.102 (m/ns) which was determined by the crosshole measurements.
4. Results
All processed GPR results are imaged in a plane with the same
x axis as in
Figure 1 and a
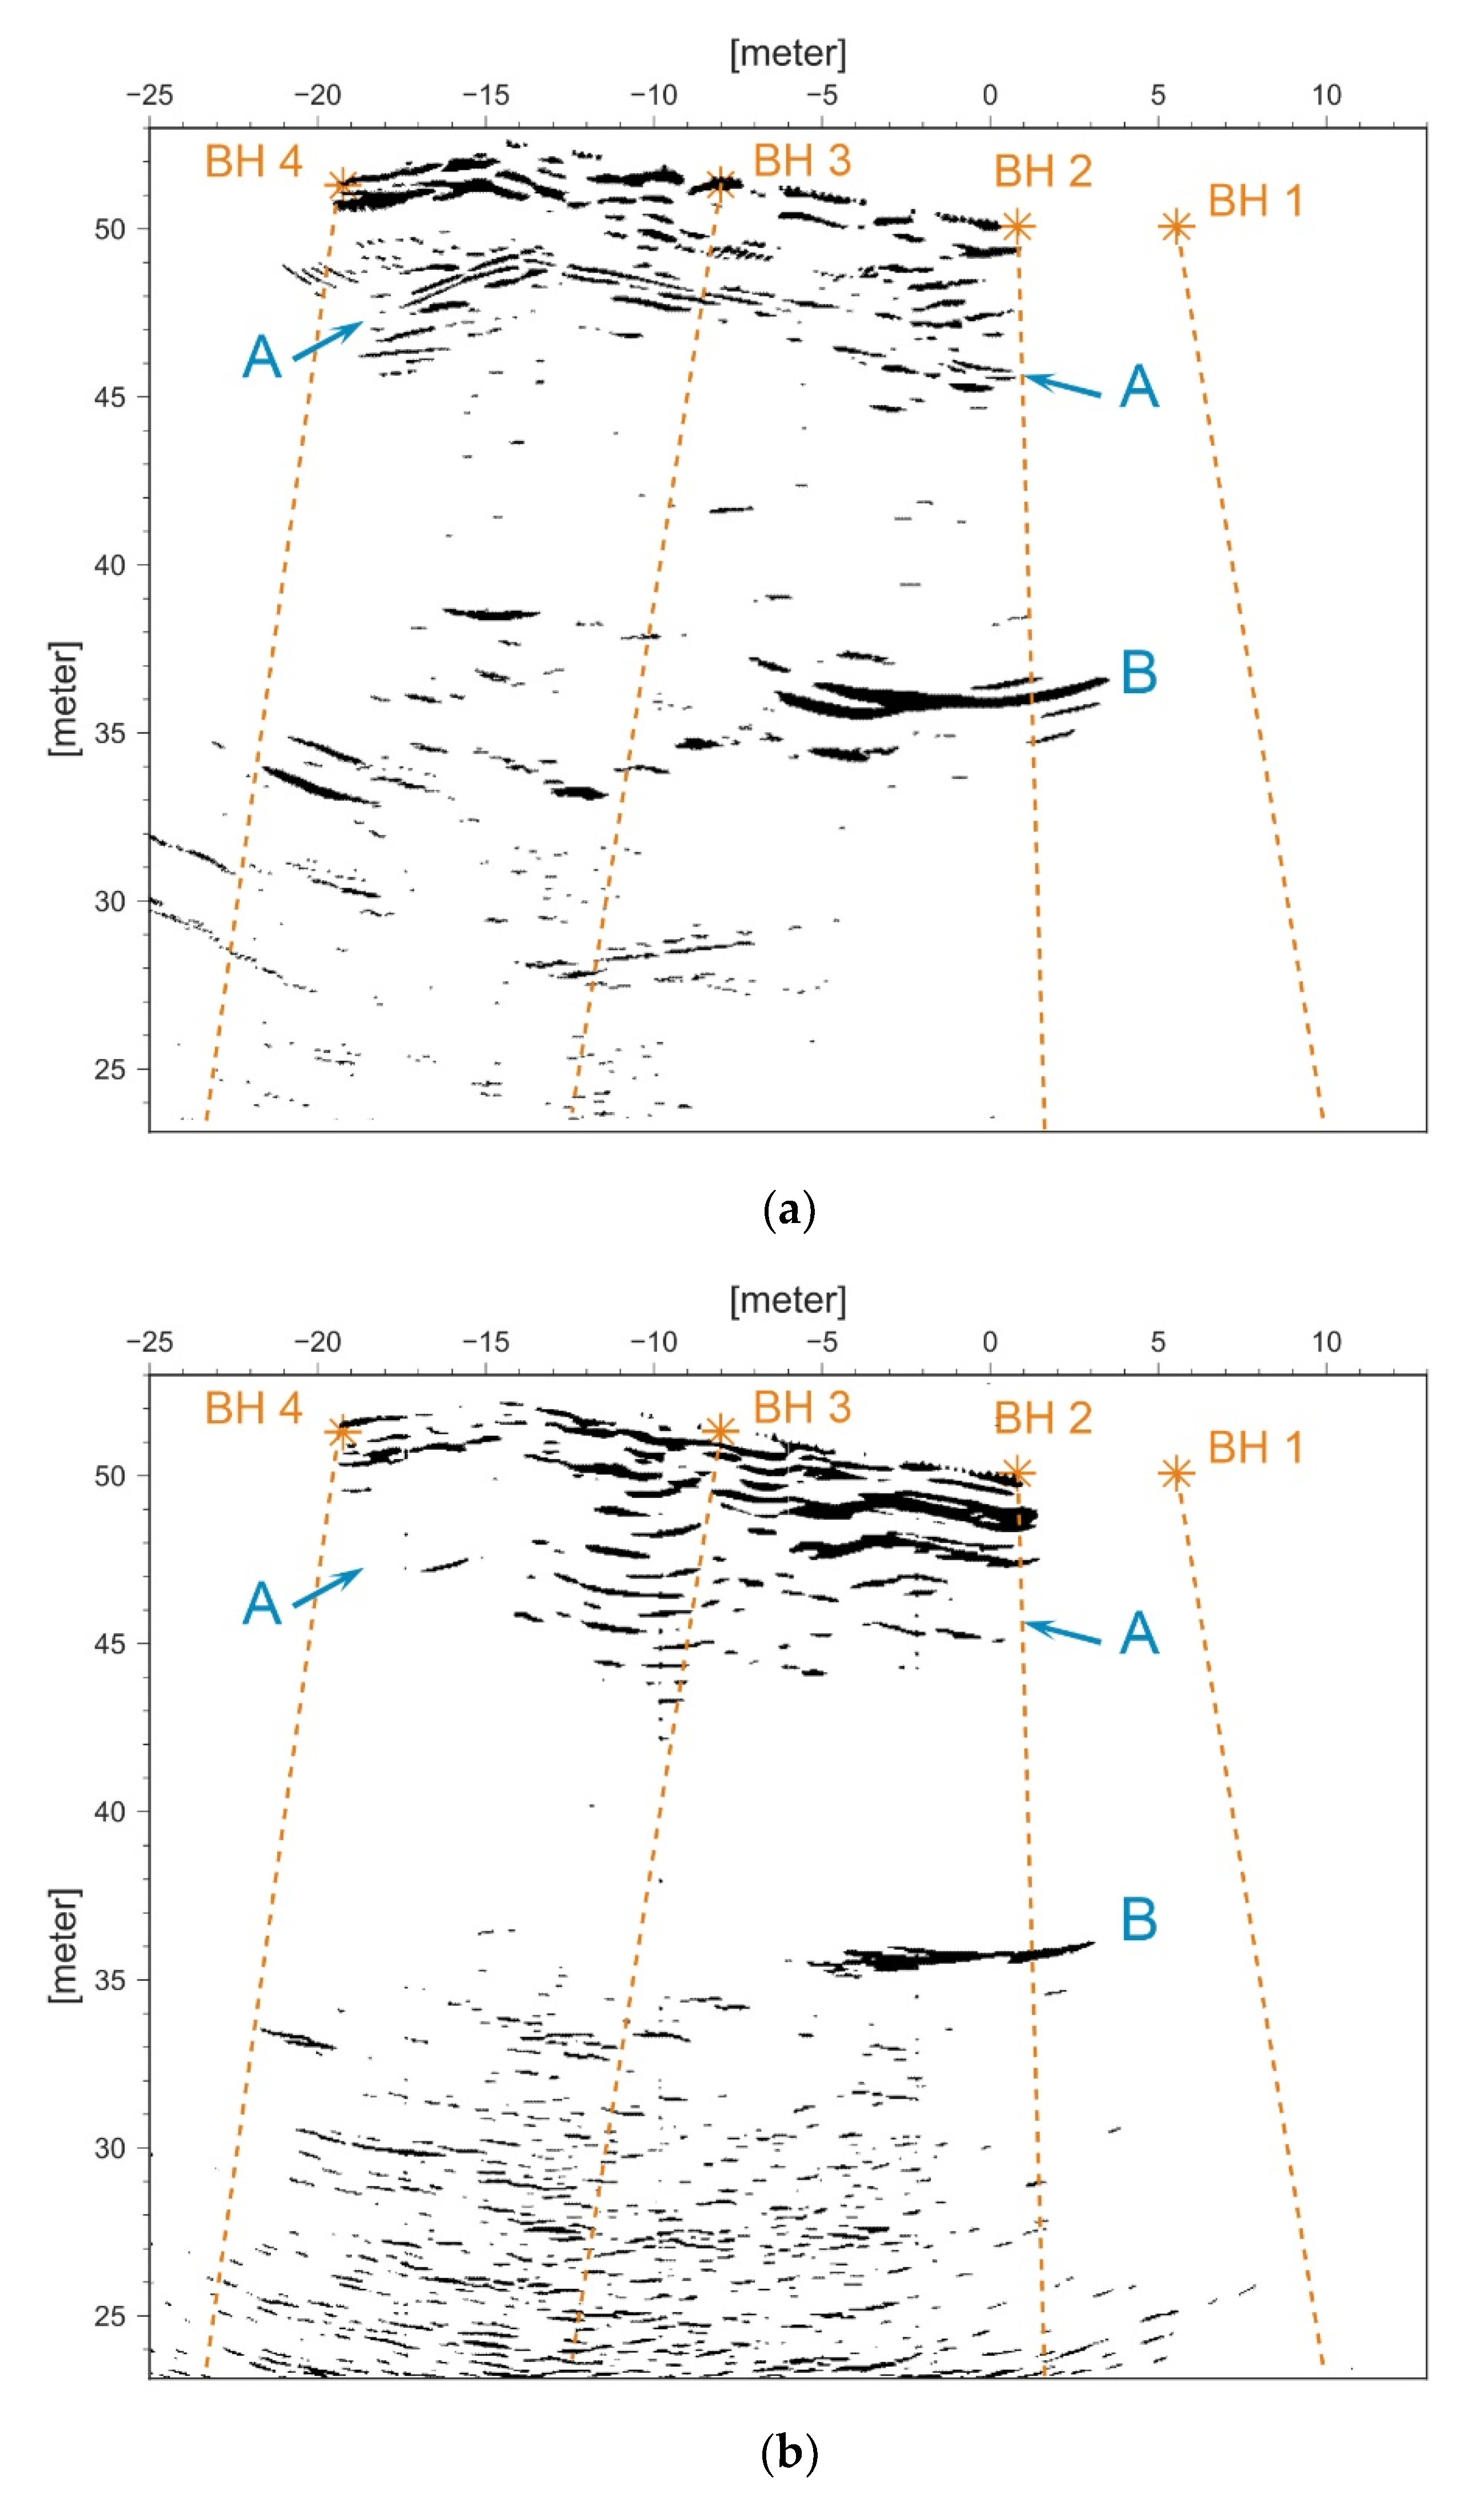
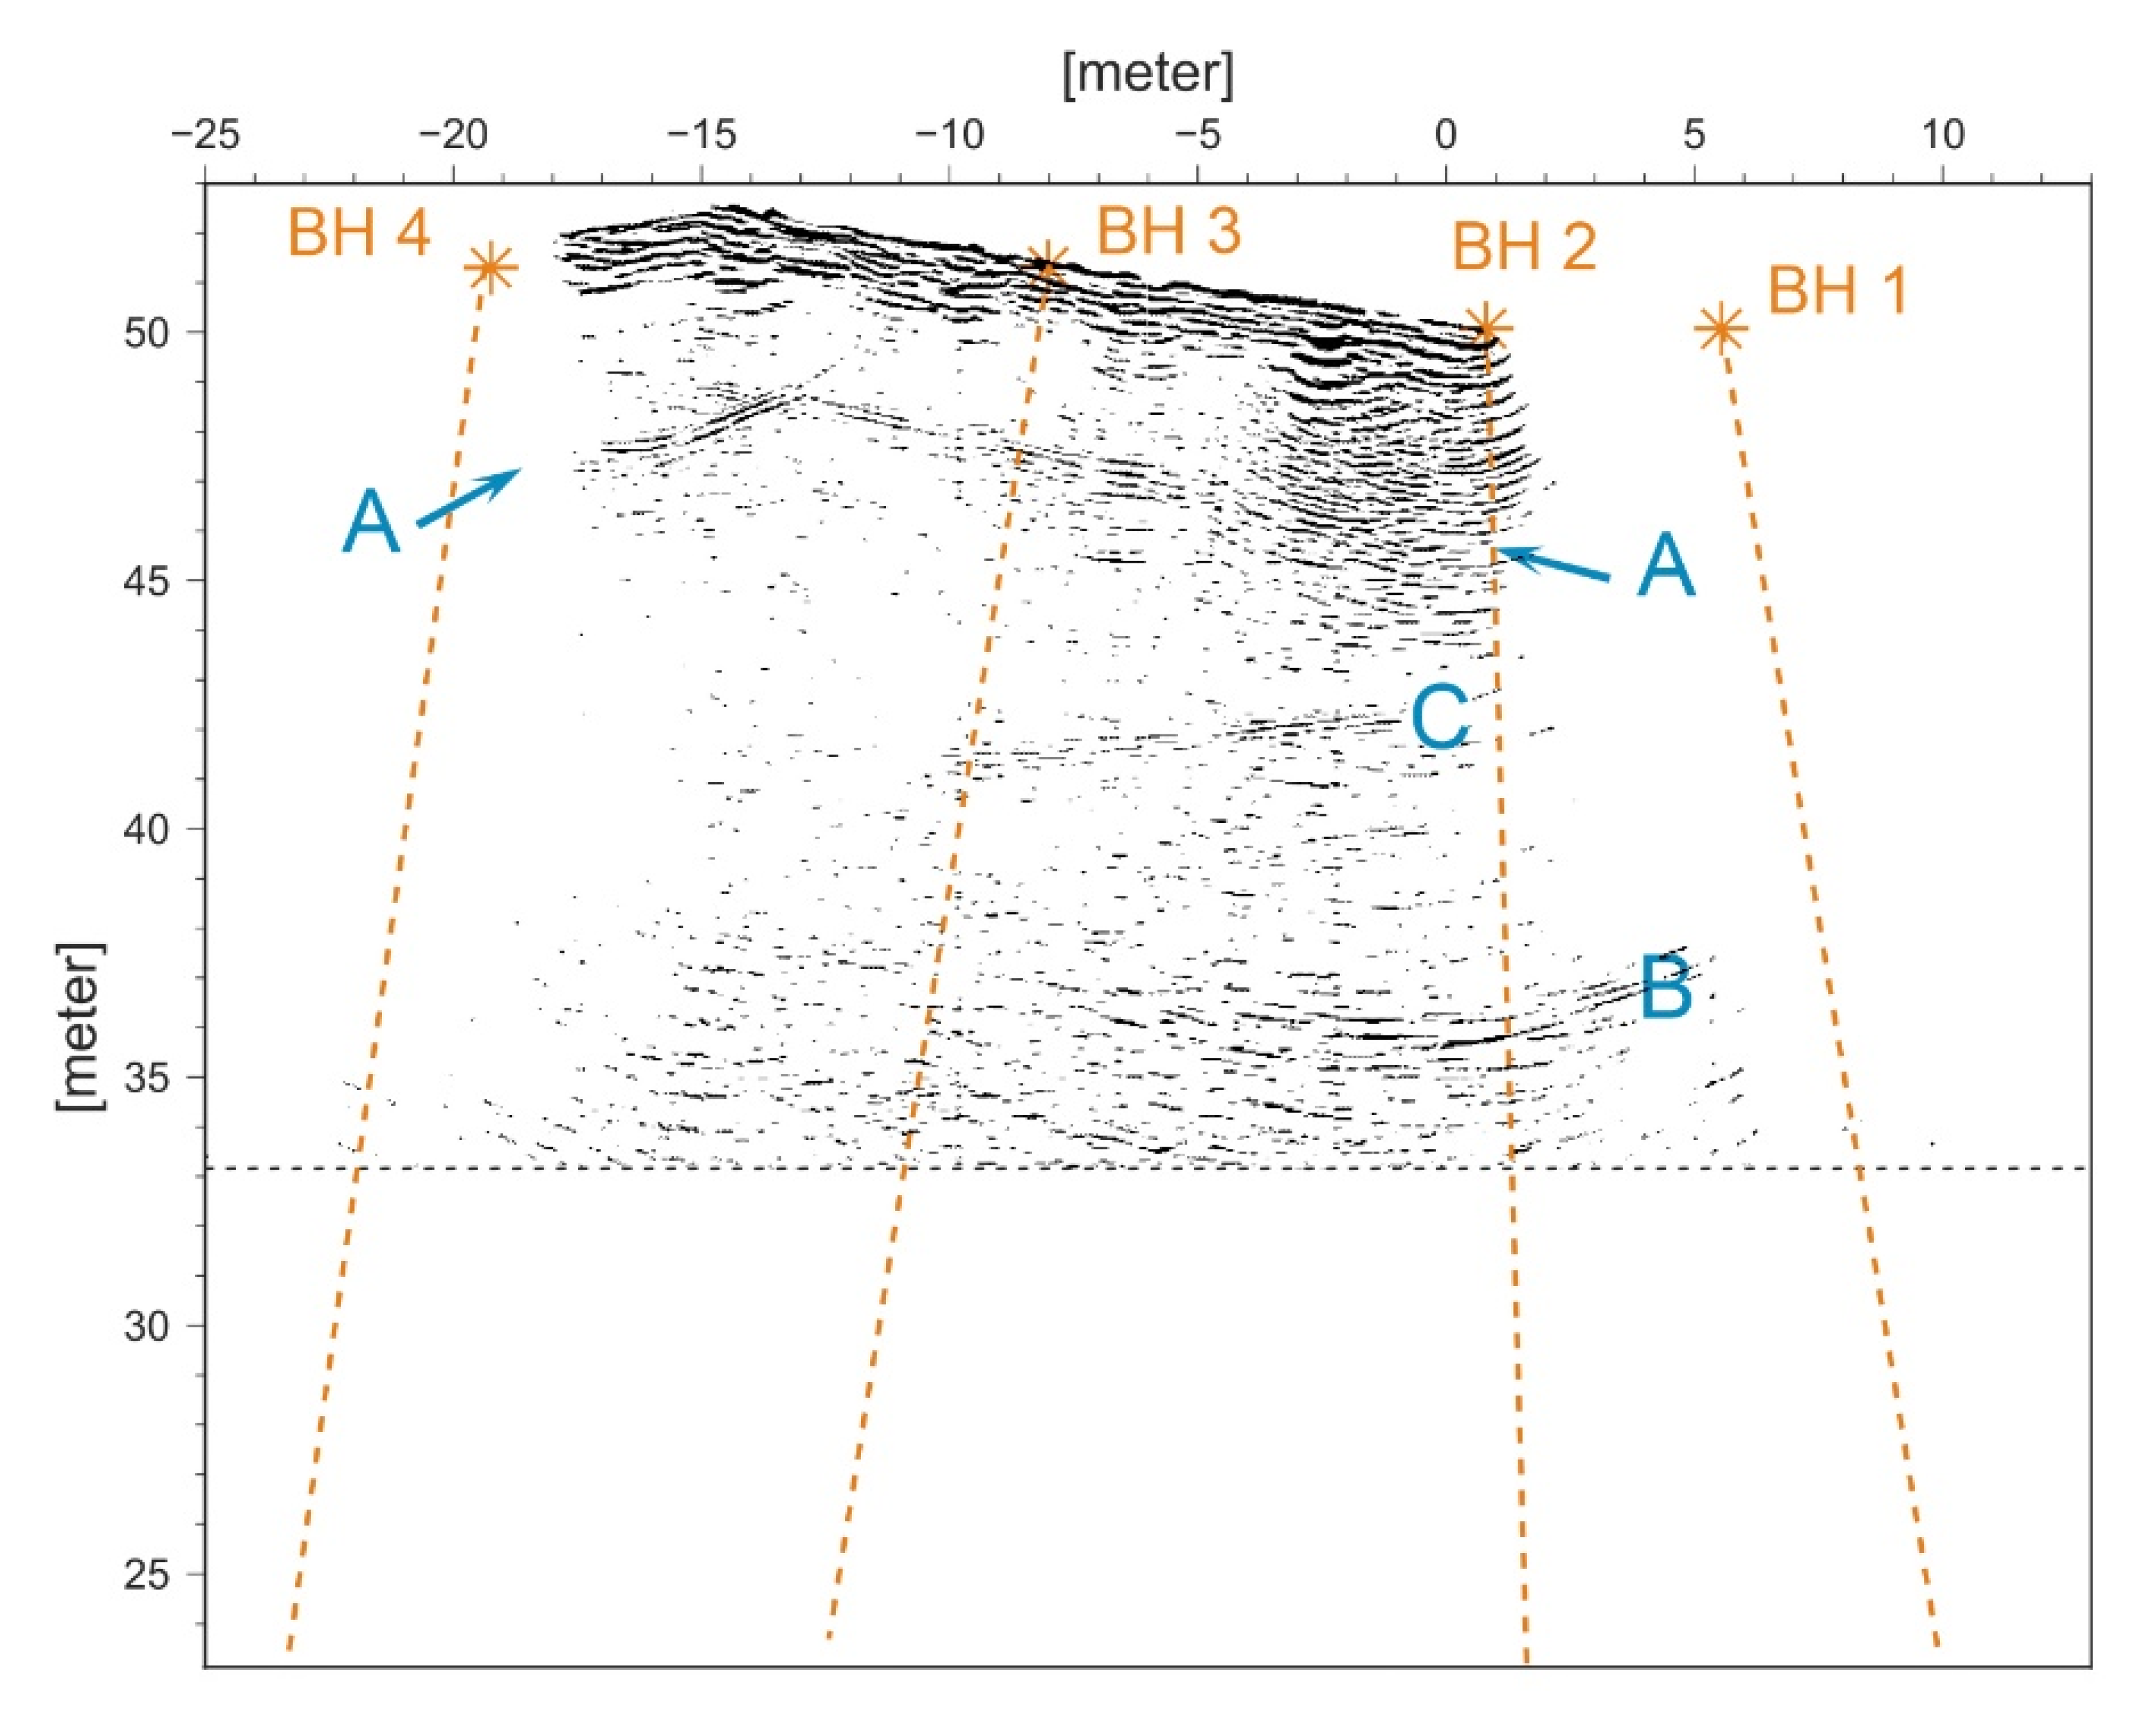
y axis dipping into the borehole plane. Several reflections are visible in the processed images. It is important to keep in mind that the origin of the reflections can be situated out of plane or from above the antenna. Inspecting the unshielded 100 MHz antenna (
Figure 4a), one can see a strong reflector at the 47–49 m y coordinate (marked with A). This is caused by the reflected airwave from the other side of the gallery and perfectly mimics its profile (
Figure 1). The gallery is about 12 m in diameter. As the signal velocity in air is about three times faster than in rock, the reflector should be visible in the migrated section at a depth of about 4 m. This reflector is missing in the shielded case, which indicates the effectiveness of our shielding (
Figure 4b). A strong reflection, located at a depth of 14 m (35 m y coordinate) is visible in both cases and should therefore be considered real (marked with B). Nevertheless, our shielding comes with a trade-off in resolution and introduces strong ringing in the upper part of the image.
The 250 MHz antenna shows similar features as the low-frequency antenna, and although shielded, the reflection from above is clearly visible (
Figure 5). One additional dipping reflector can be seen at a depth of approximately 9 m (42–43 m y coordinate marked with C). Underground mines with several levels and galleries comprise numerous potential reflectors, and, hence, interpretation might be ambiguous. Thus, whether the reflectors seen by the radar are related to geologic structures or mine infrastructure should be evaluated with additional measurements.
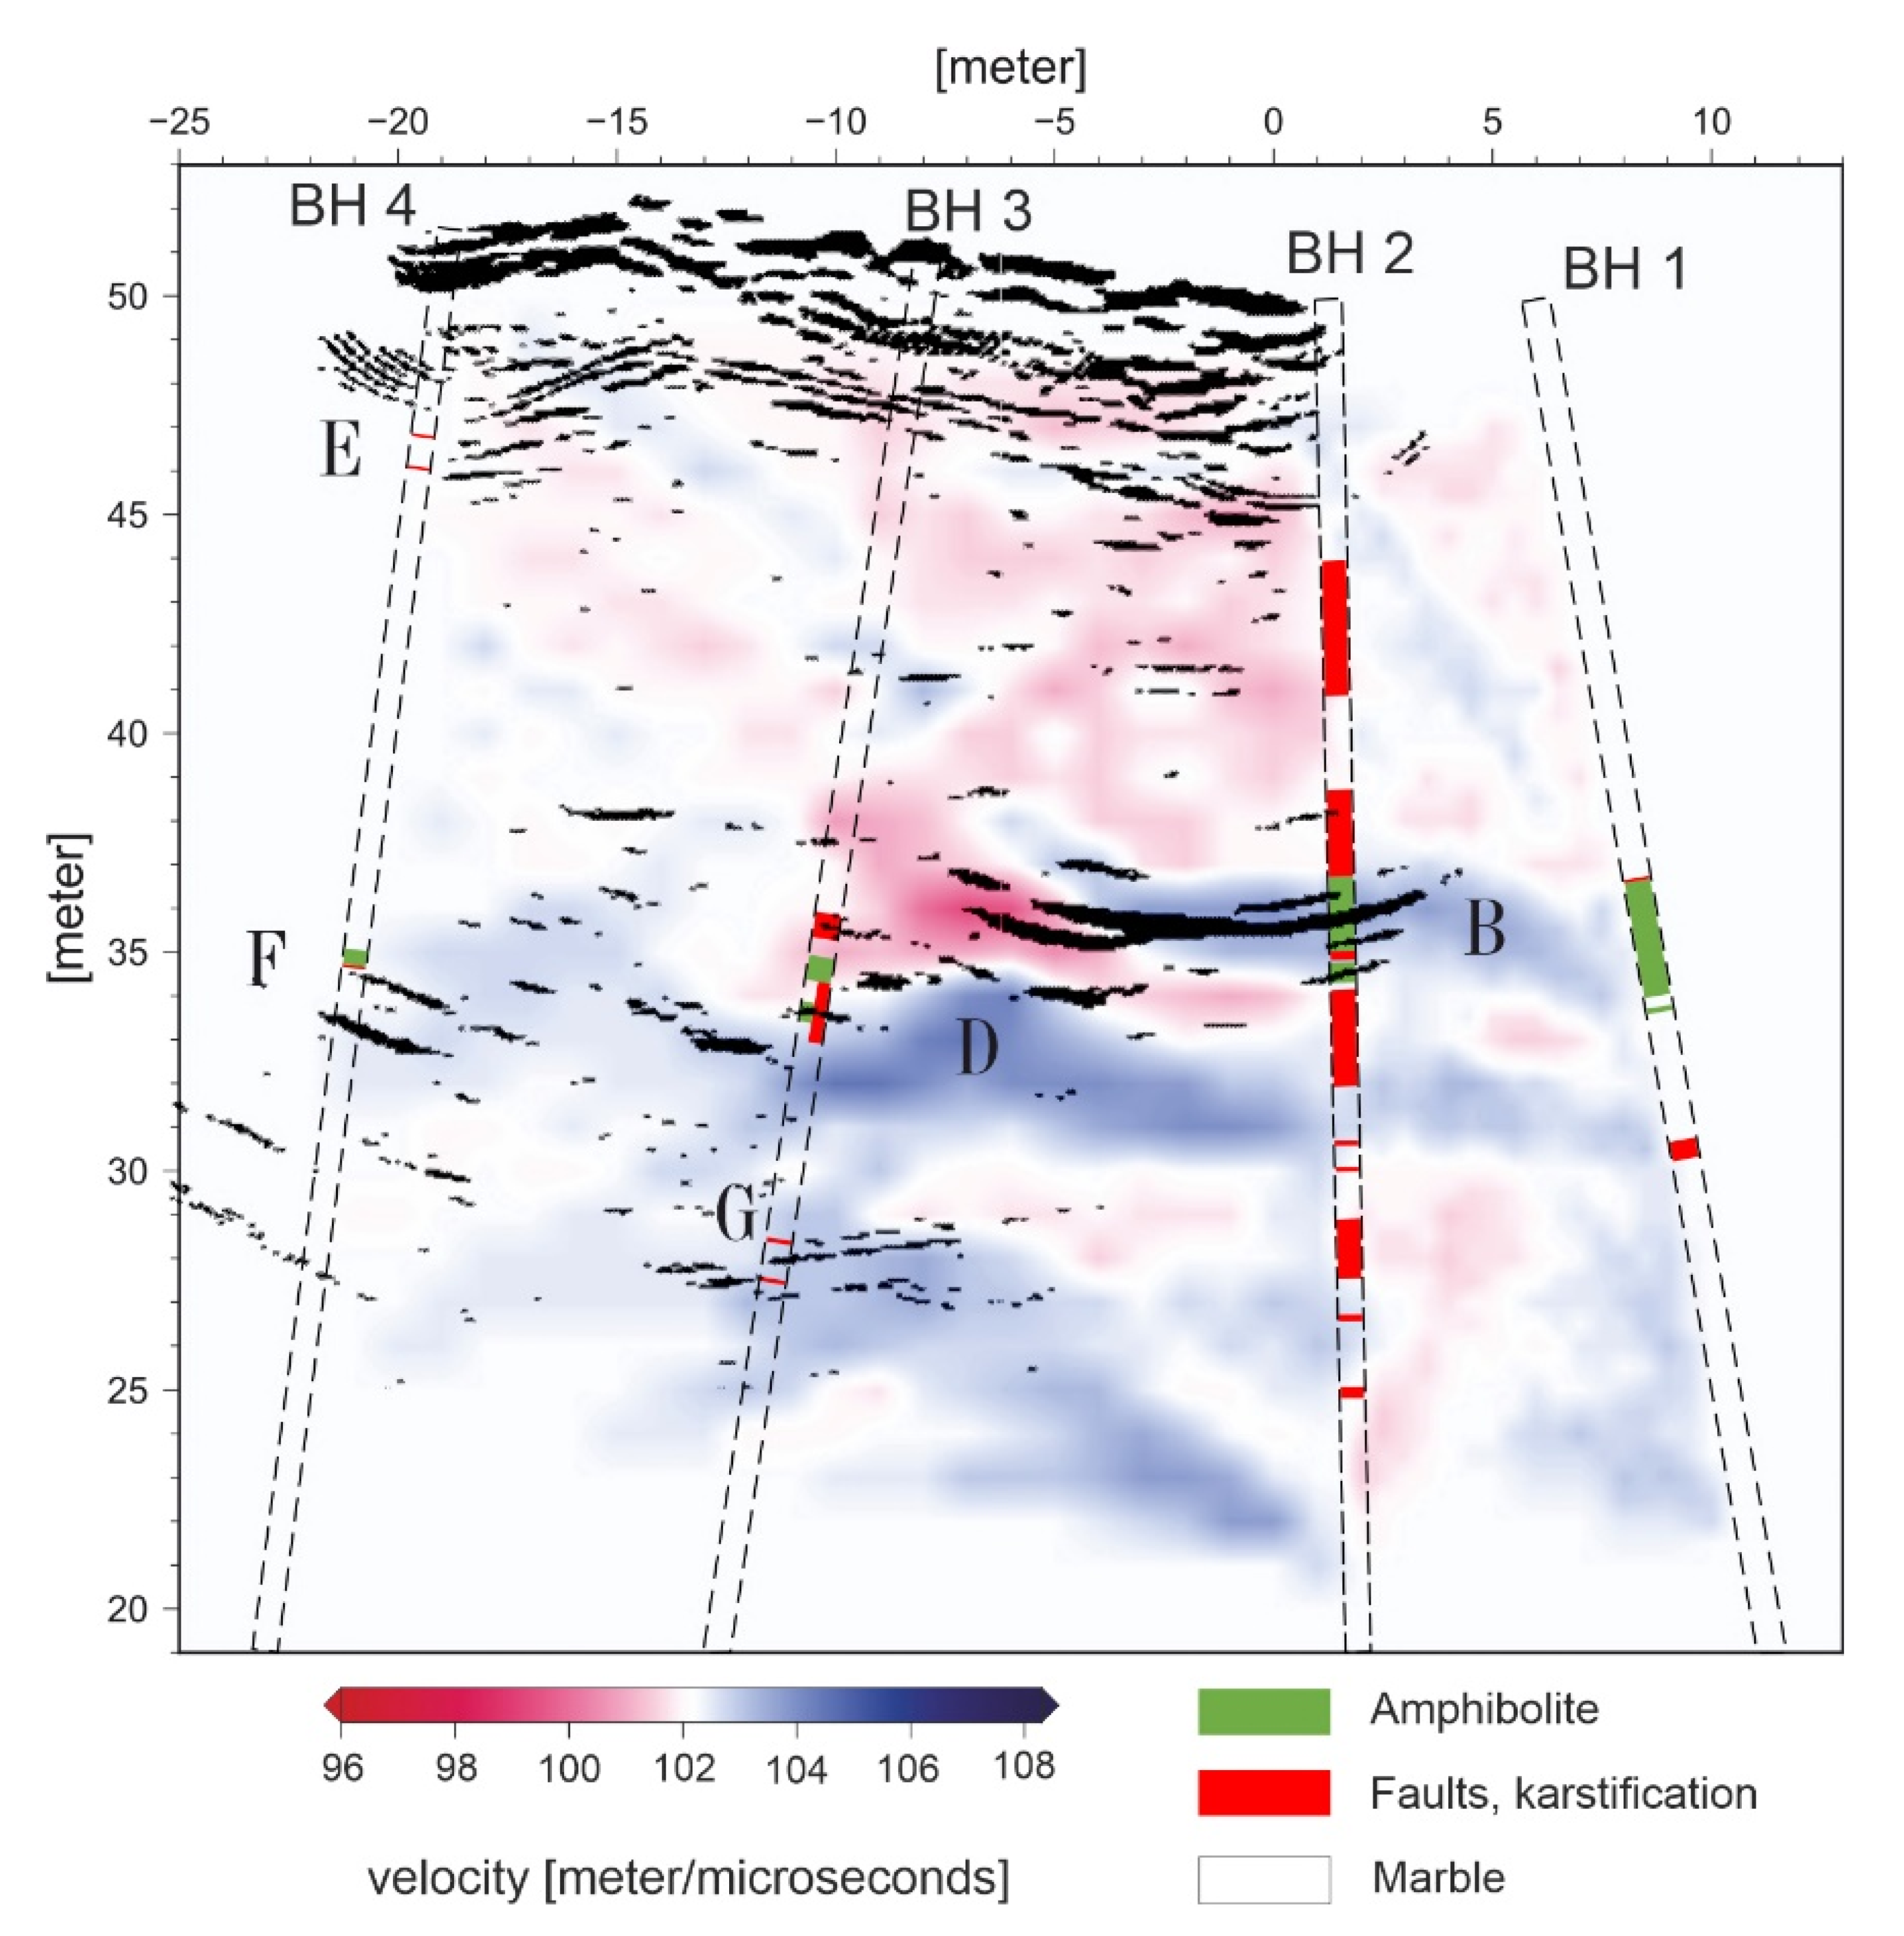
According to the tomographic profiles and the imaging of the boreholes, the measured area seems to comprise of compact rock without major fault zones. However, the borehole camera revealed several small faults and karstification zones, as well as two amphibolite layers located at a depth of about 13 m. Karstification is typically strong in the transition of amphibolite to marble. Within the profile, one can distinguish two different layers of amphibolite (
Figure 6). These are between boreholes 1 and 2 with a thickness of around 1.5 m and 0.4 m between boreholes 3 and 4. The thicker layer matches the higher velocity zone in the tomogram (
Figure 6, marked with B). Furthermore, the karstification zones in borehole 2 coincide with lower velocity zones and the transition to marble. Another high velocity zone is present between borehole 2 and 3 (
Figure 6, marked with D). However, there is no sign of a change in geology according to the images acquired with the borehole camera. High velocity zones might indicate less fractured marble with low moisture content compared to that of its surroundings. The second layer of amphibolite is not visible in the tomogram. On one hand, this is probably due to the sparse antenna step size of 0.5 and 1 m, and, on the other hand, strong karstification zones are missing, and the influence on travel times is therefore minor.
We support findings in the final tomogram with measurements from the unshielded 100 MHz antenna. Although the origin of reflections might be ambiguous, this image has the clearest reflections and the best penetration depth. The strong reflections marked with B in
Figure 4 and
Figure 5 coincide with the amphibolite layer and are, therefore, justifiably assumed to be real. Additionally, several reflections can be seen that match with smaller scaled faults identified by the borehole camera (
Figure 6, letters E–G).
5. Discussion
GPR measurements successfully delineated small-scale fault zones at depths up to 20 m. Radar penetration was ensured with clean contact between the antenna and rock assisted by a wooden construction. Our idea that water-filled fractured zones will be visible in the tomographic images could only be validated to a certain point. Although no rainfalls occurred during the measurement, the rock seemed to be saturated, as water was constantly draining into the mine. We therefore assume that that it is not the absence of water responsible for our weak velocity anomalies in our tomographic image, but rather the geological situation. The rock is far more compact and less fractured than originally assumed. We suggest performing additional measurements in stronger fractured rock. However, tomographic images revealed low-velocity zones within the rock, associated with amphibolite layers and karstification zones that bound the transition of marble to amphibolite. These results are in agreement with observations of mining geologists, whereby these transition zones act as drainage systems, especially after heavy rainfalls or snowmelts. Based on our measurements, the greatest risk for another rockfall comes from these transition zones.
Small scale faults within massive metamorphic rocks have only a minor influence on travel times. Thus, precise travel time selection and accurate determination of the borehole geometry are an important prerequisite for high-quality results. Although we measured the geometry of our boreholes, there are still artefacts visibly expressed by diagonal features in our tomographic images. More accurate determination of the borehole geometry will be a future task to overcome this problem.
Author Contributions
Conceptualization, J.K. and F.B.; data curation, J.K. and F.B.; investigation, J.K.; methodology, J.K. and F.B.; project administration F.B.; resources, F.B.; software, J.K. and F.B.; validation, F.B.; visualization, J.K.; writing—original draft, J.K.; writing—review and editing, J.K., F.B. All authors have read and agreed to the published version of the manuscript.
Funding
This research received no external funding.
Acknowledgments
We would like to thank the mining company for allowing us to perform the measurements as well as the staff who helped with data acquisition. Additionally, we wish to express many thanks to Franz Pusterwallner for building the shielding and maintaining our equipment, and to Andrew Greenwood for proof reading and language editing. We would also like to thank the reviewers for their great input that helped to improve our work.
Conflicts of Interest
The authors declare no conflict of interest.
References
- LaBrecque, D.; Alumbaugh, D.L.; Yang, X.; Paprocki, L.; Brainard, J. Chapter 15 Three-dimensional monitoring of vadose zone infiltration using electrical resistivity tomography and cross-borehole ground-penetrating radar. In Three-Dimensional Electromagnetics; Zhdanov, M.S., Wannamaker, P.E., Eds.; Elsevier: Amsterdam, The Netherlands, 2002; Volume 35, pp. 259–272. [Google Scholar]
- Hubbard, S.S.; Peterson, J.E.; Majer, E.L.; Zawislanski, P.T.; Williams, K.H.; Roberts, J.; Wobber, F. Estimation of permeable pathways and water content using tomographic radar data. Lead. Edge (TulsaOk) 1997, 16, 1623. [Google Scholar] [CrossRef]
- Fullagar, P.K.; Livelybrooks, D.W.; Zhang, P.; Calvert, A.J.; Wu, Y. Radio tomography and borehole radar delineation of the McConnell nickel sulfide deposit, Sudbury, Ontario, Canada. Geophysics 2000, 65, 1920–1930. [Google Scholar] [CrossRef]
- Nelliat, S.; Butchi, B.B.; Jha, P.C.; Sivaram, Y.V.; Verma, S.N.; Dutta, S.; Jha, A. Borehole GPR investigations from underground for mapping the extension of old working at a Pb-Zn Mine in Rajasthan, India. In Proceedings of the Conference on Recent Advances in Rock Engineering (RARE 2016); Atlantis Press: Paris, France, 2016; Volume 11, pp. 512–517. [Google Scholar]
- Apel, D.; Dezelic, V. Using ground penetrating radar (GPR) in analyzing structural composition of mine roof. SME J. 2005, 60, 56–60. [Google Scholar]
- Grégoire, C.; Halleux, L.; Lukas, V. GPR abilities for the detection and characterisation of open fractures in a salt mine. Near Surf. Geophys. 2003, 1, 139–147. [Google Scholar] [CrossRef]
- Grégoire, C.; Halleux, L. Characterization of fractures by GPR in a mining environment. First Break 2002, 20, 467–471. [Google Scholar]
- Kovin, O. Ground Penetrating Radar Investigations in Upper Kama Potash Mines. Ph.D. Thesis, Missouri University of Science and Technology, Rolla, MO, USA, 2010. [Google Scholar]
- Alumbaugh, D.; Chang, P.Y.; Paprocki, L.; Brainard, J.R.; Glass, R.J.; Rautman, C.A. Estimating moisture contents in the vadose zone using cross-borehole ground penetrating radar: A study of accuracy and repeatability. Water Resour. Res. 2002, 38, 45–1–45–12. [Google Scholar] [CrossRef]
- Binley, A.; Winship, P.; Middleton, R.; Pokar, M.; West, J. High-resolution characterization of vadose zone dynamics using cross-borehole radar. Water Resour. Res. 2001, 37, 2639–2652. [Google Scholar] [CrossRef]
- Haeni, F.; Halleux, L.; Johnson, C.; Lane, J. Detection and mapping of fractures and cavities using borehole radar. In Proceedings of the Fractured-Rocks Aquifers 2002, Denver, CO, USA, 13–15 March 2002; p. 4. [Google Scholar]
- Becht, A.; Tronicke, J.; Appel, E.; Dietrich, P. Inversion strategy in crosshole radar tomography using information of data subsets. Geophysics 2004, 69, 222–230. [Google Scholar] [CrossRef]
- Peterson, J.E. Pre-inversion Corrections and Analysis of Radar Tomographic Data. J. Environ. Eng. Geophys. 2001, 6, 1–18. [Google Scholar] [CrossRef]
- Annan, A.P. Electromagnetic Principles of Ground Penetrating Radar. In Ground Penetrating Radar Theory and Applications; Elsevier: Amsterdam, The Netherlands, 2009; pp. 1–40. [Google Scholar]
- Eberhart-Phillips, D. Three-dimensional velocity structure in northern California Coast Ranges from inversion of local earthquake arrival times. Bull. Seism. Soc. Am. 1986, 76, 1025–1052. [Google Scholar]
- Thurber, C.H. Earthquake Locations and Three-Dimensional Crustal Structure in the Coyote Lake Area, Central California. Artic. J. Geophys. Res. Atmos. 1983, 88, 8226–8236. [Google Scholar] [CrossRef]
- Vidale, J.E. Finite-difference calculation of traveltimes in three dimensions. Geophysics 1990, 55, 521–526. [Google Scholar] [CrossRef]
- Hole, J.A.; Zelt, B.C. 3-D finite-difference reflection travel times. Geophys. J. Int. 1995, 121, 427–434. [Google Scholar] [CrossRef]
| Publisher’s Note: MDPI stays neutral with regard to jurisdictional claims in published maps and institutional affiliations. |
© 2020 by the authors. Licensee MDPI, Basel, Switzerland. This article is an open access article distributed under the terms and conditions of the Creative Commons Attribution (CC BY) license (http://creativecommons.org/licenses/by/4.0/).


