Article

Combined Space–Time Analysis of Geodetic and Geological Surveys for Evaluation of the Reliability of the Position of Points in the Geodynamic Network of the City of Zagreb

1
Faculty of Geodesy, University of Zagreb, Kaciceva 26, 10 000 Zagreb, Croatia
2
Faculty of Mining, Geology and Petroleum Engineering, University of Zagreb, Pierottieva 6, 10000 Zagreb, Croatia
*
Author to whom correspondence should be addressed.
Geosciences 2020, 10(12), 498; https://doi.org/10.3390/geosciences10120498
Submission received: 23 November 2020 / Revised: 3 December 2020 / Accepted: 8 December 2020 / Published: 11 December 2020
(This article belongs to the Special Issue Modern Surveying and Geophysical Methods for Soil and Rock)

Abstract

:
This paper describes the long-standing interdisciplinary geodynamic research for the wider Zagreb area, the most seismically active area of the continental part of the Republic of Croatia, extending over an area of around 800 km2. As a result of the research, which is based on geodetic and geological field measurements, a unique interdisciplinary movement model of the surface layers of the Earth’s crust for the project area is created. The analysis of survey data has determined the continuous tectonic activity of the wider Zagreb area. In the past 18 years, a total of 10 GPS measurement campaigns have been conducted. For each campaign, the velocities of geodynamic network points were calculated, and the cumulative velocity rate was determined from all measurement campaigns for the entire period of observations using GAMIT/GLOBK software. Displacements at individual measuring points of the network, throughout research, vary widely and depend on its location within the local geologic structural framework and regional tectonic movements. These displacements in detail represent a measurable insight into the tectonic activity of the area of research. Therefore, in this paper, special attention is given to the analysis and explanation of these variations in the displacements of the individual geodynamic points, even indicating the questionable quality of location selection for some points. In this way, we seek to explain the causes and mechanisms of such displacements. The results presented in this paper represent the preseismic area condition and further can be used in coseismic 2020 earthquake displacement analysis.

1. Introduction

The wider Zagreb area is the most seismically active area of the continental part of the Republic of Croatia [1,2] and therefore the most seismically endangered. Historically, there were strong earthquakes in 1775, 1880, 1905 and 1906, some of which were catastrophic for the City of Zagreb itself [3]. Considering that the subject area occupies only 7% of the total area, and 30% of the population lives there, which earns 50% of the national gross income of the Republic of Croatia, it is clear that this area is of great importance. This fact was the main reason for the development of the geodynamic project to monitor tectonic movements in the area of Zagrebačka gora and the peripheral areas of several important tectonic units that are encountered in the wider Zagreb area. On one side are the outcrops of the Southeastern Alps; on the other, the Dinarides; and on the third, the Pannonian Basin.
According to geological classifications, the area around Zagreb is located in the border area between the western and southern part of the Pannonian Basin (Figure 1a). The boundaries are represented by the Zagreb fault (5 in Figure 1a) and the Brežice-Koprivnica fault (6 in Figure 1a). The area limited by these faults is from 12 to 25 km wide and extends for a length of around 100 km in the SW-NE direction. The most important feature is the pronounced tectonic activity. To identify the cause of the tectonic activity, it is necessary to observe the regional space shown in Figure 1a [4,5,6,7,8,9]. The tectonic movements of the Adriatic microplate are crucial in the model. They condition the extreme compression in the Southern Alps and the northern part of the Dinarides. Possible regional deformations are the reverse movements of the structural units, the Alps and the Dinarides, or their rightward transcurrent movements. The western edge of the Pannonian Basin is located partly in a trapped position between the Alps and the Dinarides. The consequence is the transpression of space. This means that tectonic movements condition the compression of space along with the generally rightward tectonic transport. It is precisely the movements of space towards the southeast that create a pronounced compression in the frontal part, especially in Medvednica. The present recent tectonic activity is directly indicated by seismic activity [10,11,12,13,14,15]. Figure 1b shows significant concentrations of earthquake epicenters in the marginal parts of the Dinarides and the Alps and the area of the western marginal part of the Pannonian Basin, especially parallel to the Zagreb fault (5 in Figure 1a) and the Brežice-Koprivnica fault (6 in Figure 1a). The strongest earthquakes occur in Medvednica [3,12].
Modern satellite GPS methods enable high-precision geodetic measurements, allowing, in the tectonically active areas, ground movements to be determined with high accuracy. Our goal is to determine the actual geodynamic displacements with high accuracy over a long period of time around the Croatian capital, Zagreb [4,8,16]. This objective is crucial because the region around the capital has the highest concentration of the population and industry in the Republic of Croatia and is seismically active. The results of studies that were carried out over 18 years show that the Zagreb area is one of the most seismotectonically active areas in Croatia [1,2,17], where a possible stronger earthquake could cause very considerable material damage and human losses.
This paper describes the research work on the development of a geodetic velocity model based on geodetic GPS measurements on specially stabilized points of the geodynamic network in the form of GPS campaigns, and a geologic movement model created based on geologic field measurements. The results obtained, based on the processing of such interdisciplinary measurement data, combined with earthquake data, fully confirm the distinct tectonic and seismic activity of the area of research, particularly along the Medvednica mountain and Žumberak hills [18]. The performed interdisciplinary analysis of geodetic and geological measurements resulted in movement values of near-surface structures and their directions in space, which enabled the development of an acceptable geodynamic model of the wider area of Zagreb and offered an explanation of possible causes of unexpected directions of movements at certain points in the geodynamic network of the City of Zagreb. These models are dynamic and they change over time. The changes and their causes can be explained only by repeated long-term measurements. This combined space–time analysis of geodetic and geological surveys is also used for the evaluation of the reliability of the position of points in the Geodynamic network of the City of Zagreb.
Geodetic research performed so far, and previous geological research, including the recent seismic activity, indicate the slow accumulation of stress, which could result in a strong earthquake in the wider Zagreb area in the near future. This was verified on 22 March 2020, when Zagreb was hit by an earthquake (M 5.5) shortly before this paper was written. The epicenter of this earthquake is marked in Figure 2.

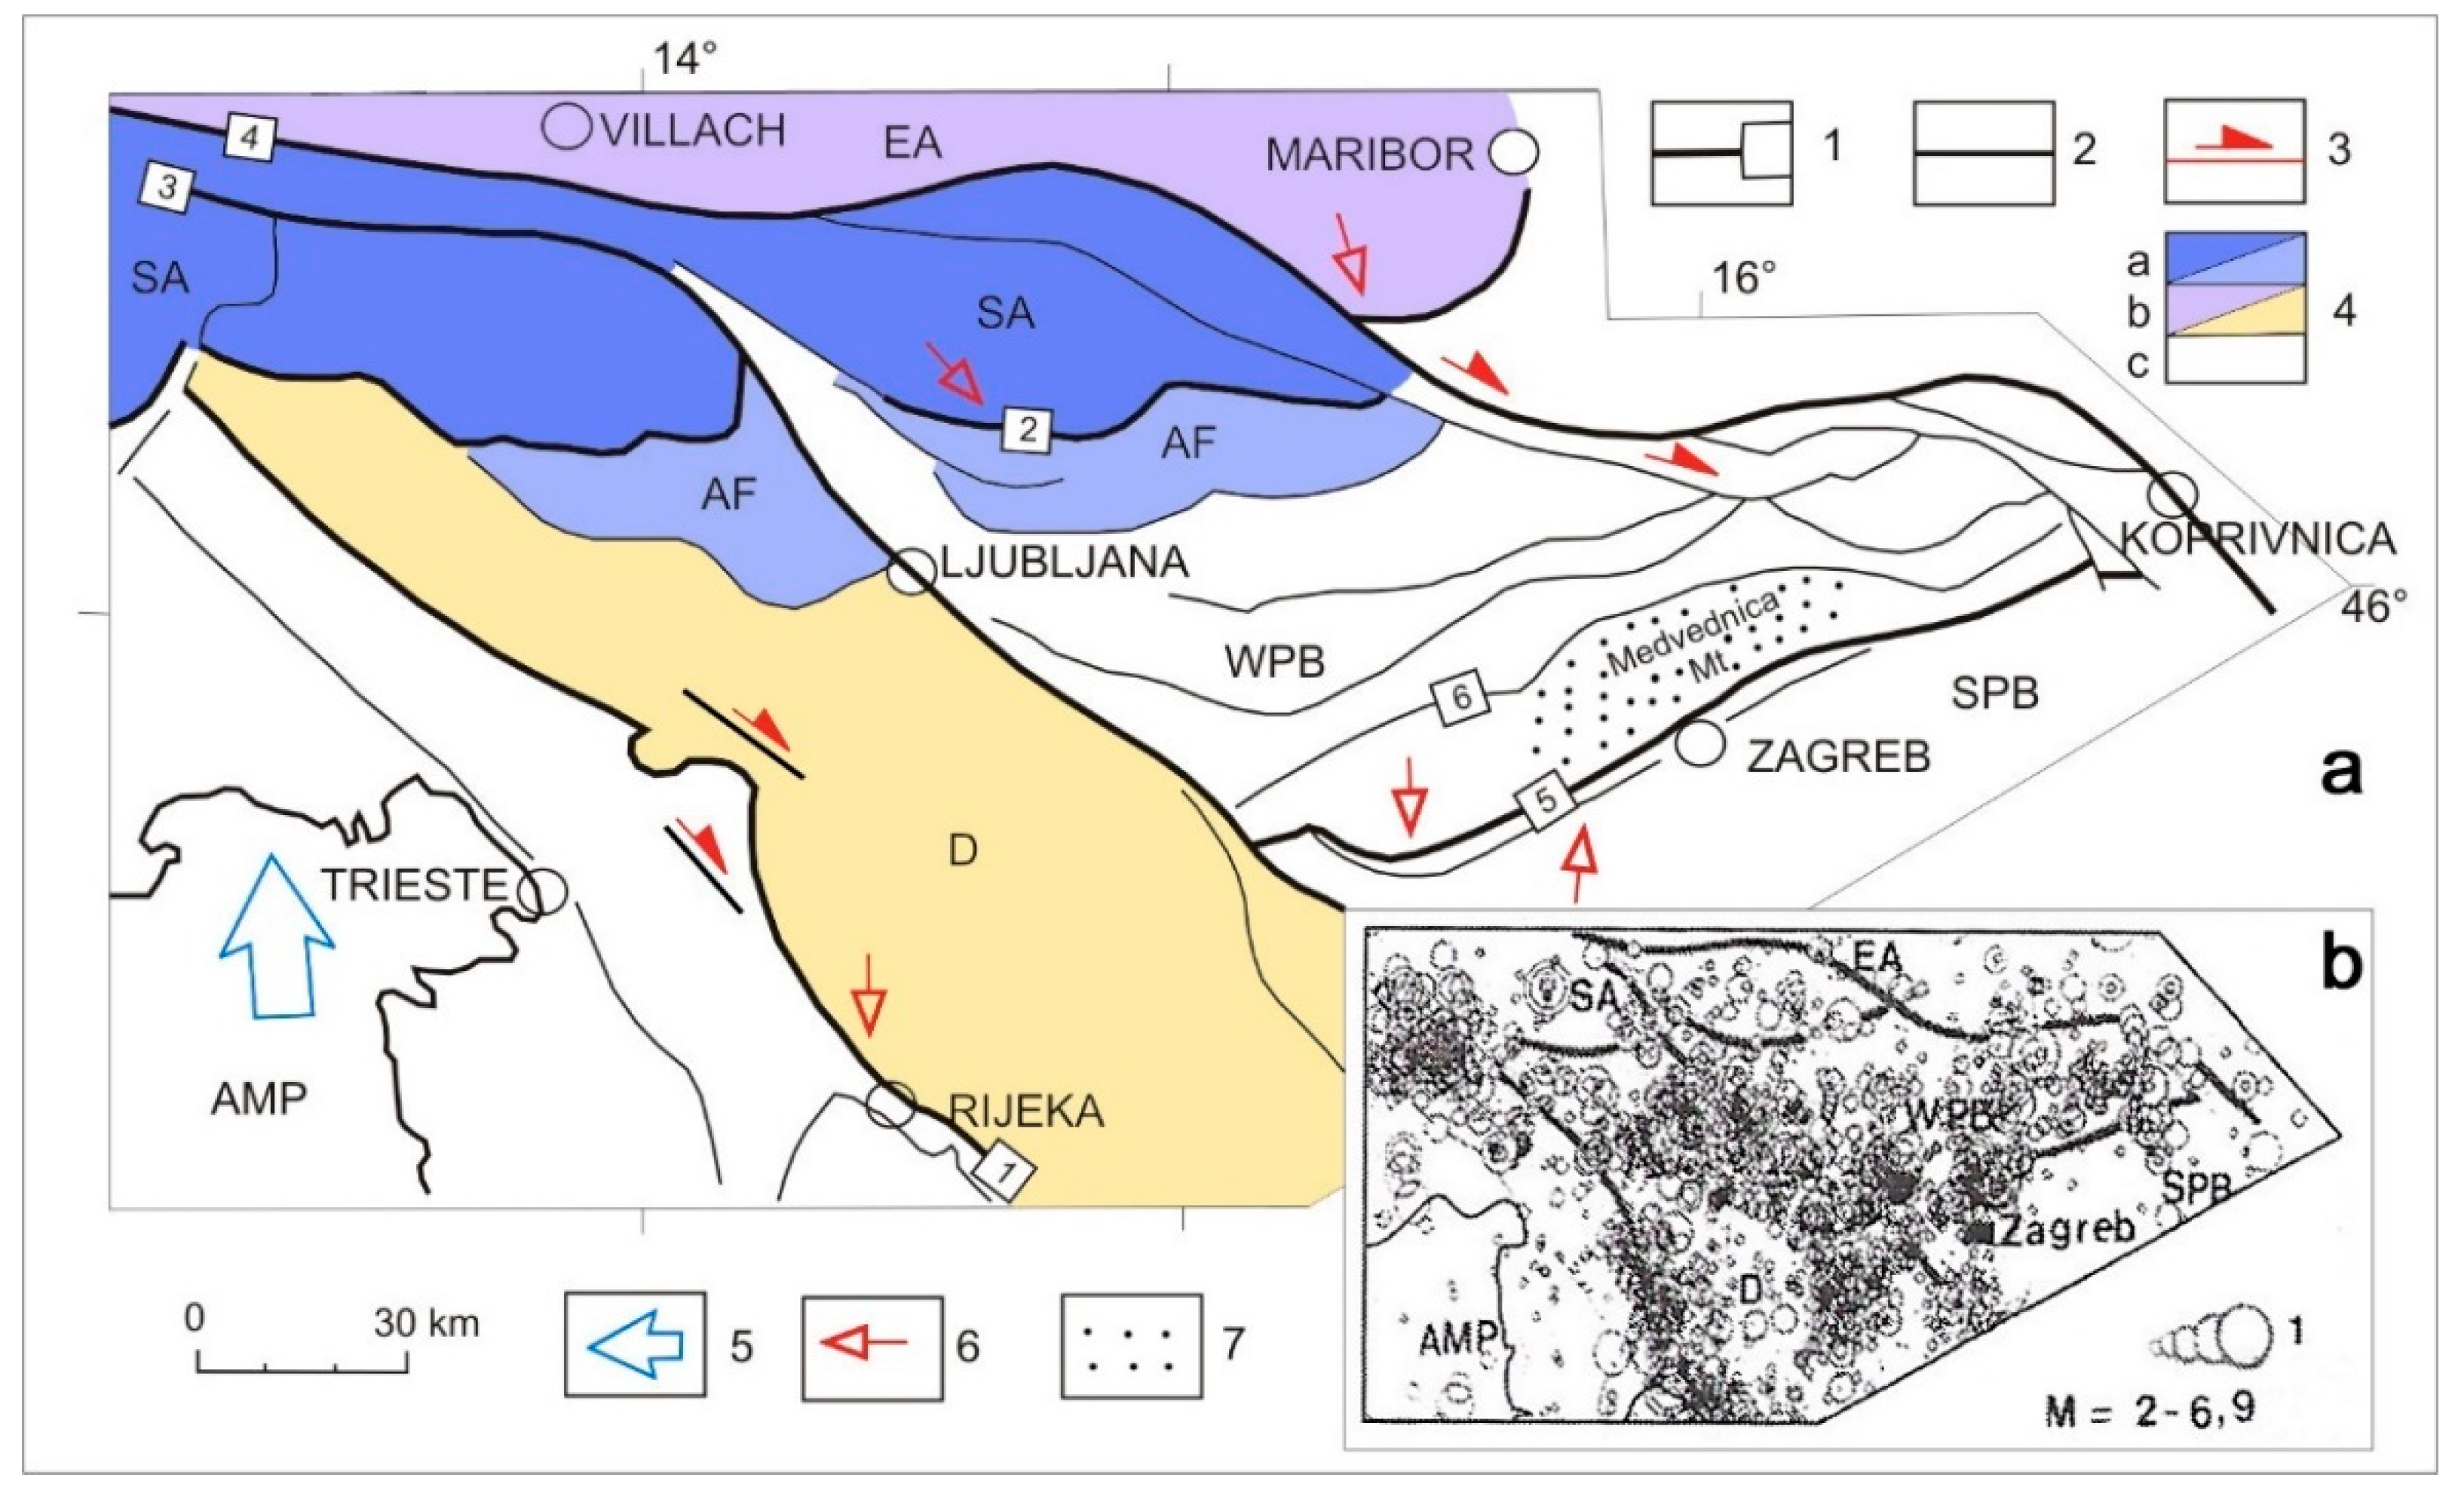
2. Geologic Framework and Tectonic Evolution in the Zagreb Area

Development of the geodynamic movement model is based on decades of geological field measurements on rock outcrops in the wider Zagreb area [4,12,16,17,18,19,20].
According to geological classification, the wider Zagreb area is located in the border area between the western and southern part of the Pannonian Basin (Figure 1) [4]. In this area, there is active seismotectonic activity (Figures 2, 8 and 9). The causes of these activities are regional tectonic movements (as described in the Introduction and Figure 1). The intensity and direction of movement of geological structures along the fault depend on the size, location and extension of various rock complexes at depth. Figure 2 shows the included geological structural framework. The most important is the position of the structural unit Žumberačka gora–Medvednica (1 in Figure 2) with NE–SW extension. In the regional framework, it represents an immediate border between the western and southern edge of the Pannonian Basin. Units Vukomeričke gorice–Šamarica (2) Dugo Selo–Vrbovec–Moslavačka gora (3) and the Sava River Basin (4) belong to the southern edge of the Pannonian Basin. They have an NW–SE extension. Along the boundaries of the structural units and structures, faults are extended. Faults presented by zones of different widths stand out in particular. Main boundary faults of individual zones are marked by the letters a and b. The most important are faults bordering the most seismotectonically active structural unit, Žumberačka gora-Medvednica (1 in Figure 2). These are the Zagreb fault (1a, b) and Brežice-Koprivnica fault (2a, b).
To calculate the present regional tectonic movements, the position of the western edge portion of the Pannonian Basin (Sava faults) in a regional framework is essential. Partially, it is wedged between the Alps and the Dinarides. This creates transpression of space. This means that tectonic movements control the compression of space with regional right shifts of structures to the east and southeast [4,5,6,16,21,22,23]. These movements create in the front part, along with the structural unit Žumberačka gora–Medvednica (1 in Figure 2), a very noticeable compression. Tectonic movements are particularly present in Medvednica (1 in Figure 2) with the occurrence of earthquakes with relatively high intensity (locations of major earthquakes shown in Figure 2) [3]. However, the constant occurrence of earthquakes of weaker intensity directly indicates the ever-present tectonic activity [3,12,13,14,15,24].
Within structural units, certain structures stand out. In Medvednica (1 in Figure 2), due to the different movement, two major structural blocks differ: Sljeme (1) and Zelinska gora (2 in Figure 2). It is especially important to note that in the deformations and displacements of parts of structural unit Žumberačka gora-Medvednica (1 in Figure 2), there is a direct influence on the position and extent of the rock complex of higher density in the depth that builds the structural units of the southern edge portion of the Pannonian Basin. The most important is a large complex of granite rocks within the structural unit Dugo Selo-Vrbovec-Moslavačka gora (3 in Figure 2).
Directly east of the area, shown in Figure 2, granites are located at a depth of around 1 km. In Vukomeričke gorice (7 in Figure 2), in the first few kilometers of depth, Palaeozoic schists and Mesozoic carbonates are widespread. In Medvednica (1 in Figure 2), Marija Gorica (2 in Figure 2) and Hum (3 in Figure 2), these rocks are located on the surface [25,26]. Gravimetric maximums indicate the positions of said rock complexes (Figure 2). Within the Sava Basin (4 in Figure 2) and Stubica sub-basin (9 in Figure 2), the thickness of the Neogene-Quaternary rock complex reaches depths of 3500 and 2700 m, respectively [25,26]. This rock arrangement points to a compression of space which is directly indicated by geodetic and geologic measurements from this paper and can be recognized in Figures 2, 14 and 15.
In the structural framework, the faults have the most importance. In their outcrops on numerous localities, the movements of parts of structures have been determined [6,21]. The most important directions of movements are shown in Figure 2. Along the boundaries of structural units and structures, the reverse faults with opposite vergence are extended. Within individual fault zones, there are arrays of faults with parallel extension. The main zones are followed by branches which are particularly pronounced in the parallel extension of the Zagreb fault (1a, b). Significant reverse movements of Neogene and Quaternary rocks along the most important fault zones are well known—for example, Zagreb fault (1a, b)—2800 m, Brežice-Koprivnica fault (2a, b)—up to 2800 m and Bistra-Laz fault—up to 3300 m. Due to tectonic movements in the structural framework, the stress field is generated. The orientation of the maximum compressional stress is north–south, and local stress is variable. The orientation of compressional stress directly affects the movements and deformations of individual structures. It is especially important to point out that in Medvednica (1), deflection of the orientation of the local compressional stress to the left is discerned going from Zagreb over Medvednica (1). This indicates the presence of retrograde rotation of parts of Medvednica (1). Directions of movement, determined by geological field measurements, indicate the rotation of its parts too. Especially the retrograde rotation of movement in the Zagreb fault zone (1a, b) is expressed. This is the result of the position of the granite rock complex that resists regional tectonic movements. In conditions of compression of space, only movements of Zelinska gora (2) towards SW and S, and not towards SE, are possible (Figure 2).
Earthquakes directly indicate the constant presence of tectonic activity in the period 1997–2015. In this period, there were more than 100 earthquakes of magnitude up to 3.5 [18]. In the seismotectonic profile, the foci of these earthquakes are marked (Figure 3). The concentration of hotspots in the zones that are directly connected with the zones of the Zagreb fault (1a,b in Figure 2), the Brežice-Koprivnica fault (2a,b in Figure 2) and the Bistra-Laz fault (3 in Figure 2) is noticeable. The branches of the Zagreb fault are also seismotectonically active (1a,b in Figure 2). Most earthquakes occurred to a depth of around 5–15 km. Earthquakes that occurred in the period 2009–2015 were specially marked. The epicenters of these earthquakes on the surface are marked in Figure 2.

3. Geodetic Movement Model

The geodetic movement model is determined from the results of GPS measurements that have been carried out on points of the geodynamic network in the period from 1997, when the geodynamic network of the City of Zagreb was first established, until 2015.

3.1. Establishment of the Geodynamic Network

Since the research area covers around 800 km2, the network is designed to form triangles with points whose mutual distance does not exceed five kilometers. The network configuration with approximate locations of the points was determined on the geodetic map, before entering the field, while the definite location of the points was chosen in the field. An interdisciplinary team of experts, consisting of geodetic, geologic and geotechnics experts, chose the location of the points that will best meet the requirements of the geodynamic network quality [27]. Thus, the network consists of 43 (specifically) stabilized points that meet all the criteria that are set for this kind of research. In Figure 1, a sketch of the pillar of geodynamic points and photo of built pillars on the field are shown. As can be seen on the Figure 4, the foundations of points are reinforced by micro piling Ø200 mm. Reinforcement is carried out by four micro-piles, and their depth was determined by trial geotechnical drilling directly on the field, mostly 2 to 4 m, and on some points, it reaches 10 m in depth.
With such stabilization, the intention was to ensure the stability of geodynamic points over a longer period and provide installation of GPS antennas on the same place with high accuracy, which enables the determination of real geodynamic movement with precision within a millimeter [4].
Since the area of research is seismically very active (earthquake epicenters with magnitude: (a) 4.6–5.0; (b) 5.1–6.0; (c) 6.1–6.3 are given on Figure 2), the network is designed in a way that optimally covers the recent structural framework in the area, which covers more than 800 km2 (Figure 5). Network points are set according to fault zones in positions that should represent geodynamic processes in the area of research [19].

3.2. GPS Measurements

GPS measurements were carried out so that in one measuring campaign, all of the points in the network are included (epoch measurements). GPS measurements within a campaign were conducted in three sessions, where each lasted for 24 h. Theoretically, it would be best that the measurement campaign could be carried out as a single session, but practically, it would require many more GPS receivers than were available. When organizing measurement campaigns in three sessions, we were able to implement GPS receivers of the same manufacturer on all points, which significantly simplified the measurement process and the subsequent data processing.
In the preparation of campaigns, for all GPS receivers (during these years, only Trimble GPS receivers, from model 4000SSI to 5700 and R8, were used, and on points CAOP and ZZFP, choke ring antennas were mounted), all the necessary actions to synchronize the parameters of observations were done. Moreover, all the receivers were tested on the test site to check their status, power supply and the possibility to store and transfer data. Based on the results of preliminary testing, a schedule of receivers in each of the three sessions was prepared. Setting up and testing of instruments significantly facilitates the field measurements, because the pre-tested and adjusted instruments and measurement plan are handed over to all field crews.
In the past 18 years, a total of 10 measurement GPS campaigns were performed as follows: 1997, 2001, 2003, 2004, 2005, 2006, 2007, 2008, 2009 and 2015 (Table 1). All campaigns were carried out with 24-h sessions with a 30-s interval of observations, giving 2880 measuring epochs per session/point [19,20] (except 2015 and all latter, which were recorded in 15-s intervals collecting 5760 epochs per point). All measurement campaigns were performed in the same period of the year to eliminate seasonal influences on measurements.

3.3. Processing of GPS Measurements

For the subject research, the scientific GPS software GAMIT/GLOBK, which runs under the Linux operating system, was used. GAMIT/GLOBK uses Kalman filtering to determine the point velocities from time separated GPS measuring campaigns. In current practice, the GAMIT solution is not usually used directly to obtain the final estimates of station positions from a survey. Rather, GAMIT is used to produce estimates and an associated covariance matrix (“quasi-observations”) of station positions and (optionally) orbital and Earth-rotation parameters, which are then input to GLOBK to combine the data with those from times to estimate positions and velocities [28,29]. GLOBK uses a Kalman filter (equivalent to sequential least-squares if there are no stochastic parameters in the solution) which operates on covariance matrices rather than normal equations and hence requires specifying a non-infinite a priori constraint for each parameter estimated [30]. In order not to bias the combination, GAMIT generates the solution used by GLOBK with loose constraints on the parameters. Since phase ambiguities must be resolved (if possible) in the phase processing, however, GAMIT also generates several intermediate solutions with user-defined constraints before loosening the constraints for its final solution. These steps are described in [31,32].
The data were processed in series: 1997–2001, 2001–2004, 2004–2006, 2006–2007, 2007–2008, 2008–2009 and 2009–2015, and a final one using all of the above. For each period, a separate velocity model on the network points was determined (Figure 6) and then the cumulative model that includes all the measurement campaigns conducted since 1997 (Figure 7).
Point velocities are computed using the module GLOBK; therefore, the velocity field is calculated according to a special computation model using the Kalman filtering method as described in [29,30,31,32,33,34,35]. When processing GNSS measurements, all parameters were set for the local network in order to determine only unbiased local movements in the Zagreb area, and the two most stable points in the study area were selected as a reference, the city’s permanent GNSS station, CAOP, and the ZZFP station. The offsets of all other points in the network refer to the vector between the two points mentioned. The FES2004 ocean loading model was used through otl.grid, while the atmospheric correction model was not available. IGS final orbits and corresponding Earth orientation parameters were used. ITRF08 was used to map the velocities. Velocities are expressed in millimeters per year (mm/yr). In addition, the magnitude of the total spatial vector in all three dimensions is determined. The results obtained with the GAMIT/GLOBK software package were verified by independent calculation using the BERNESE software package, with the only difference being that, in this case, the IGS points GRAZ, MATE and MEDI were used as reference points [36].
The final results are GPS velocities of the geodynamic network points, obtained for the mentioned seven periods and cumulatively for the whole period from 1997 to 2015 (Figure 7). The maximum absolute value of the velocity for a cumulative solution in the horizontal direction is 4.9 mm/yr, and in the vertical, 12.4 mm/yr, and the mean spatial velocity is 2.3 mm/yr. The largest absolute value of velocity was obtained during the period 2006–2007 and amounted to 19.4 mm/yr in the horizontal direction, from which it is evident that these are significant in a geodynamic sense. However, it should be noted that the mean spatial velocity is 3 mm/yr.
From the obtained velocity values for each period, an analysis of movement for each point was carried out in order to show the spatial movement of a point in time between individual campaigns. Accordingly, an interdisciplinary geodetic and geological analysis of the behaviour of network points within a structural framework, depending on their position in it, was conducted. A more detailed analysis is presented in Section 4.1. In Figure 8, Figure 9, Figure 10, Figure 11, Figure 12 and Figure 13, a few selected points and their movements in each period are shown. In the end, the original geodetic model of the velocity field of the observed area for the entire research period from 1997 to 2015 was created, which is shown in Figure 7.
The values of the velocity components of the network points, for the whole period from 1997 to 2015, calculated from all measurement campaigns, are shown in Table 2.
In Table 2, the first column shows the name of the point; the second and third column show latitude and longitude. The fourth and sixth column show velocity components in latitude and longitude directions (vφ and vλ), and the fifth and seventh show their accuracies, while the eighth and ninth column are the vertical velocity component (vH), and its accuracy, respectively. The 10th column shows the velocity in the horizontal plane as the result of the first and second component (horizontal velocity—vhor), the 11th column shows the value of spatial velocity (vsum), and the 12th and 13th column show the azimuth and vertical angle of velocity vectors. The statistical overview of the absolute values of velocity components for the period 1997–2015 is shown in Table 3.

4. Discussion

The interdisciplinary analysis performed in the current study includes joint analysis of the obtained movement models described in the two previous chapters, in order to determine the unique movement model of near-surface layers in the wider Zagreb area.
The most important data on the tectonic activity, in the period 1997–2015, were obtained using geodetic GPS measurements. Configuration of the geodynamic network enabled the collection of data which directly indicate the amplitudes of tectonic movements in areas covered by the geologic structural framework, directions and angles of inclination of movement of certain points.
It is necessary to point out two important facts. First, constant changes in the intensity of tectonic activity occur. This also results in movement direction changes, which are almost always diagonal in space and can be positive (elevation) or negative (lowering). Second, it is also noticed that variable movement angles are present, which, for example, show parts of structures where the compression of space is predominant, reverse movements or rotation of structures.

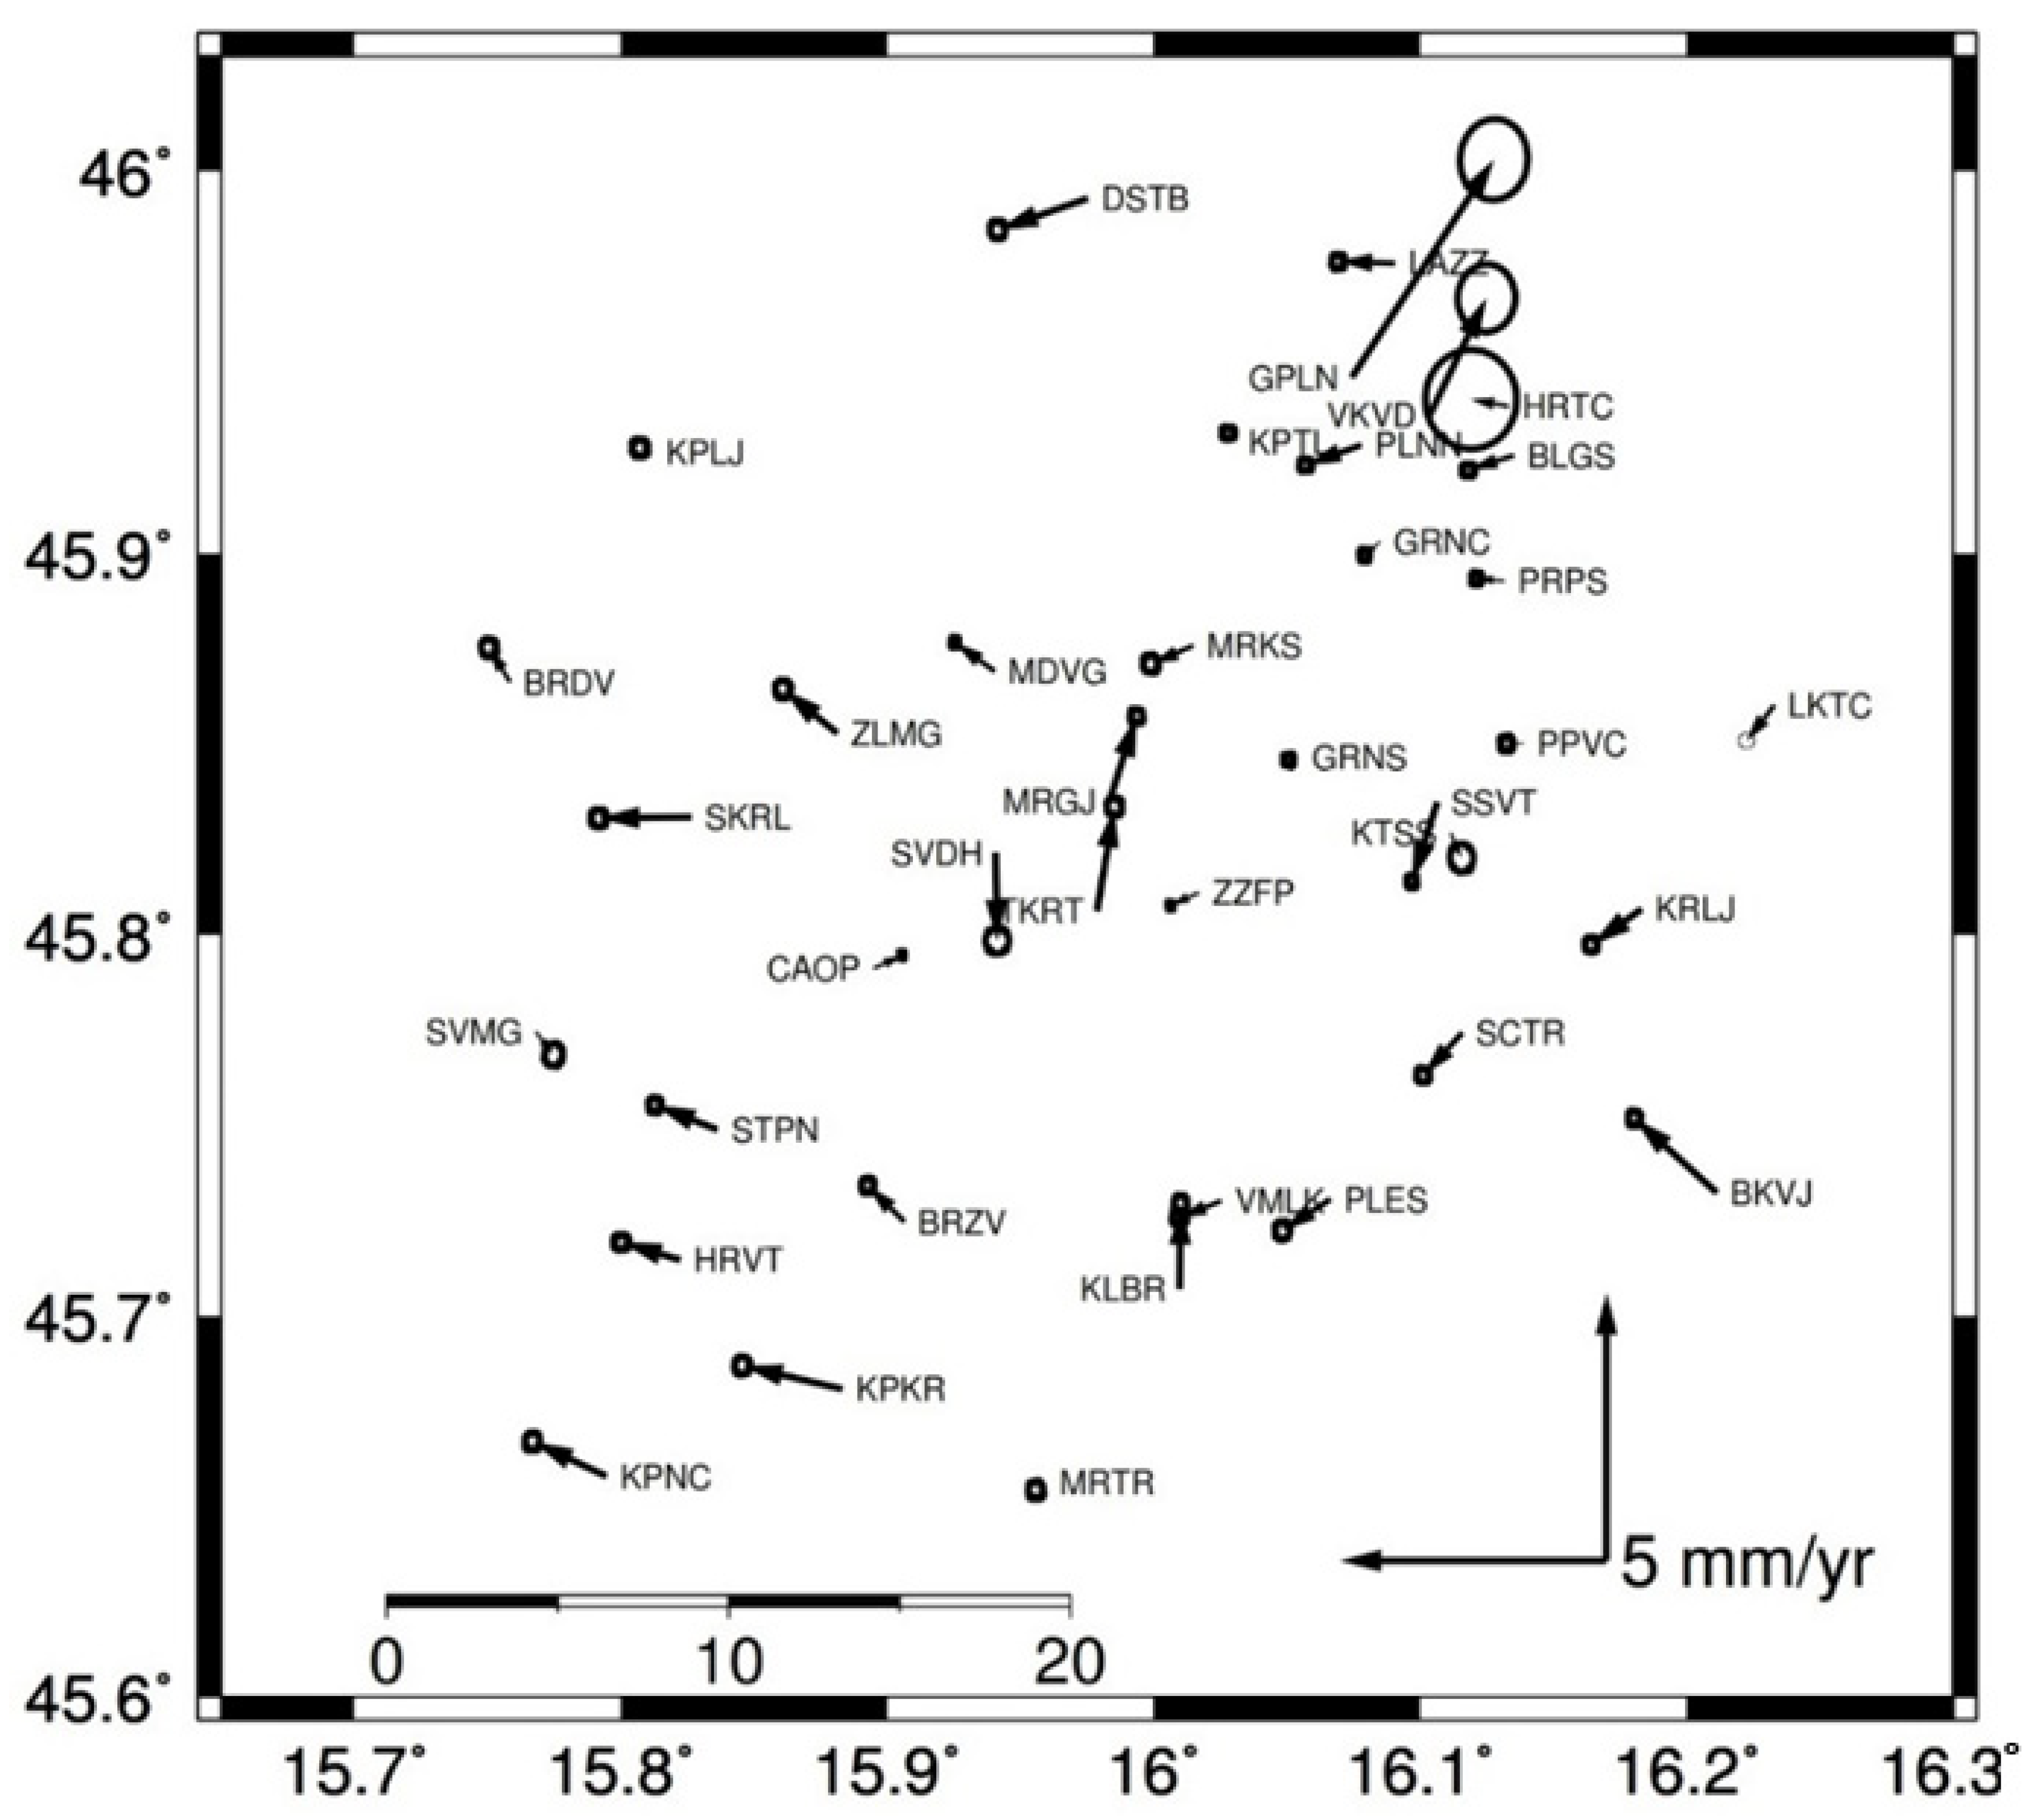
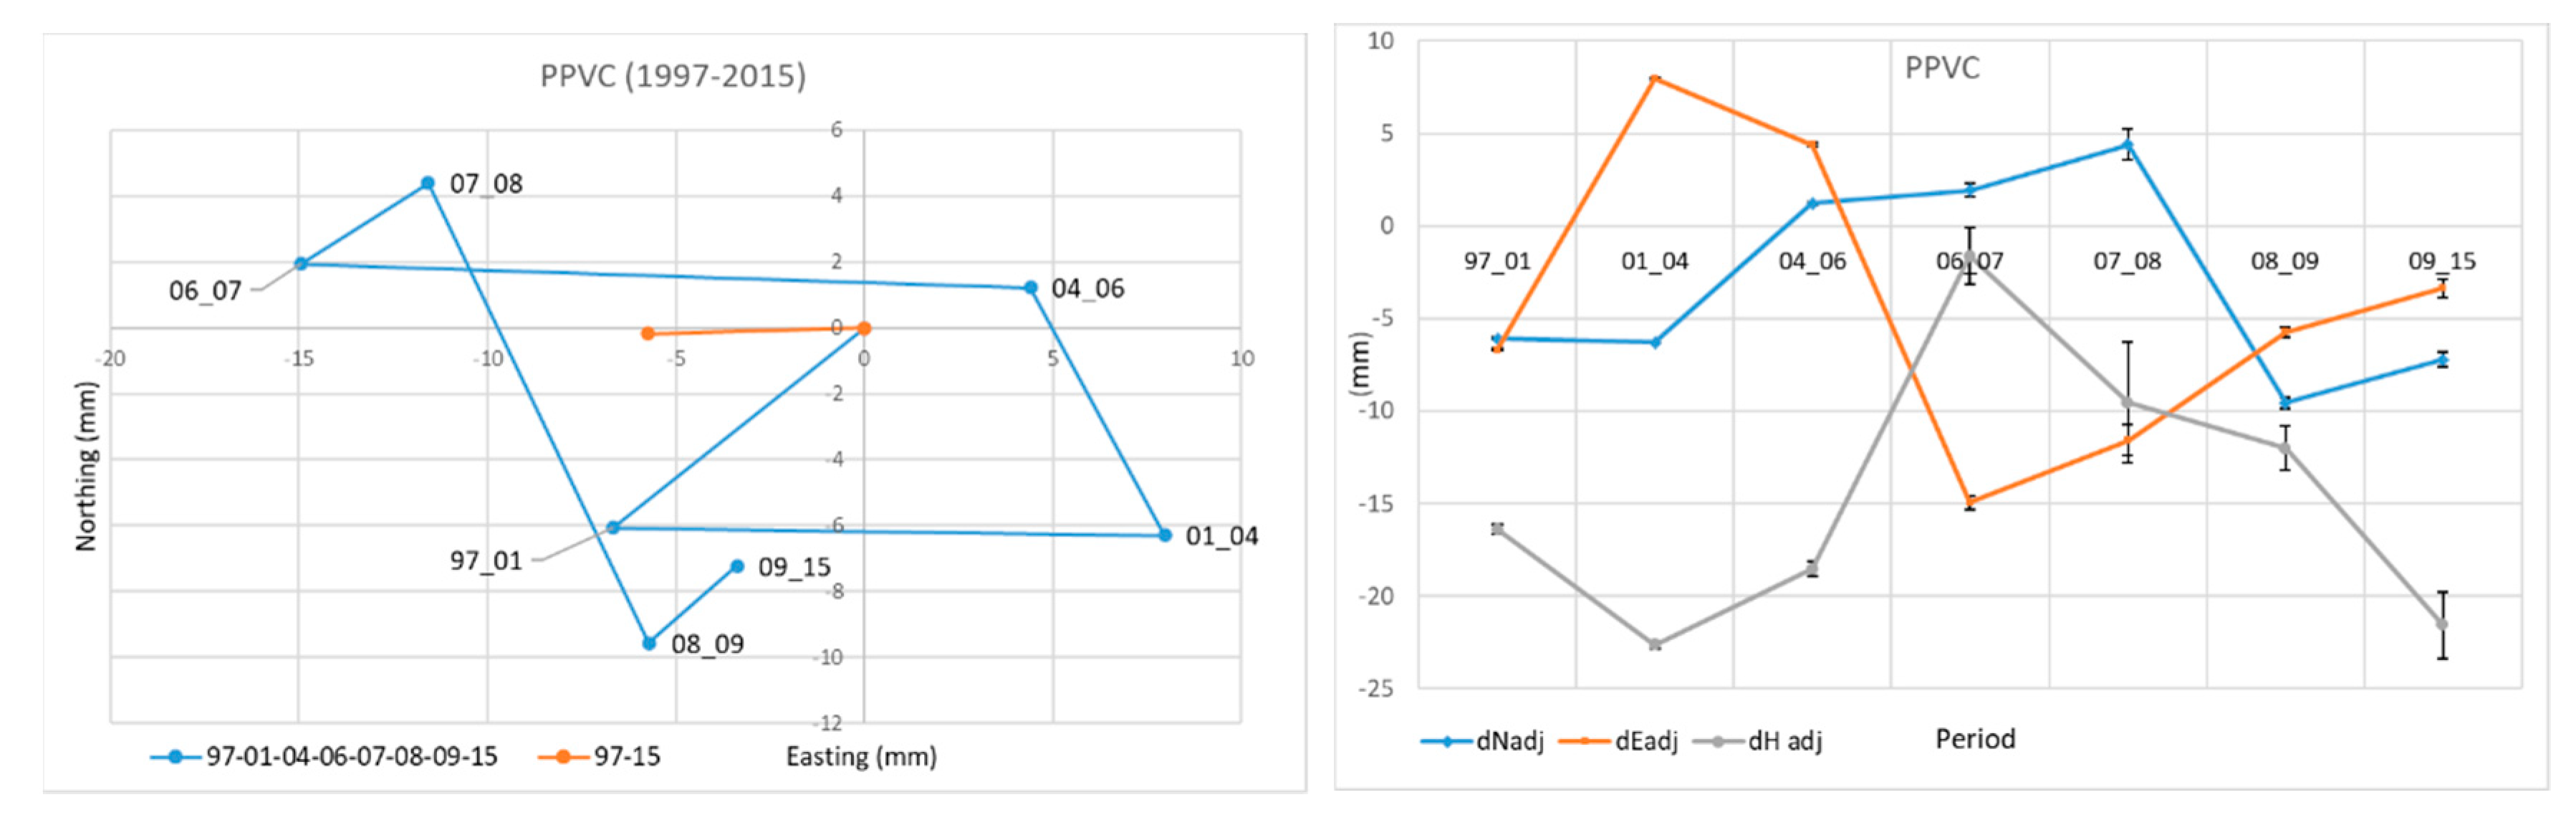
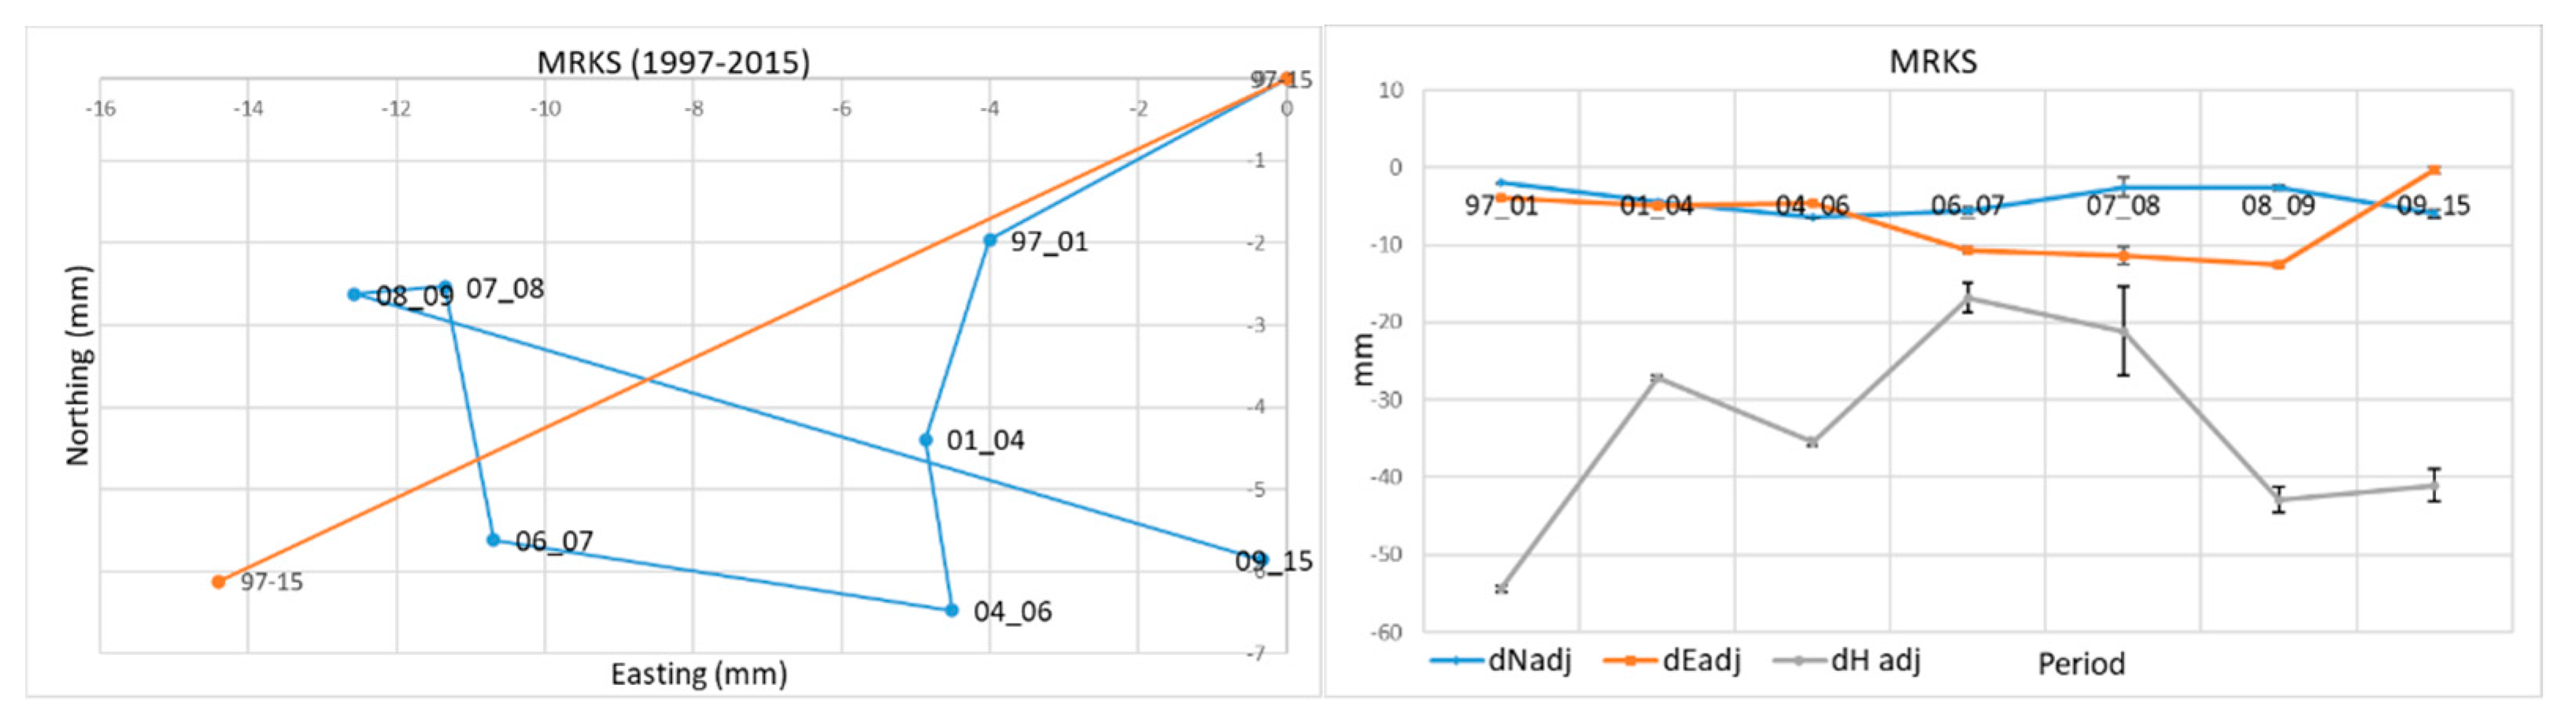
4.1. Analysis of the Movement of the Geodynamic Points

A good example of the constant change in the direction and magnitude of the movement was observed at the point PPVC (Figure 8), which is located east of Zagreb, outside of the zone of the Zagreb fault (1). The causes of these changes are probably twofold. The main reason is probably the movements and retrograde rotation of Zelinska gora (2) and the rising and compression of space in the local geological structure Dugo Selo–Lupoglav (5 in Figure 2). However, around the point on the surface, there are predominantly clayey sediments. During sudden tectonic movements of relatively larger amplitudes, which cause the mentioned rotation, this may represent a less stable substrate. This arose as a result of considering the possible cause of the specific movements determined at the PPVC point since the errors in the retrieved GPS velocities are not significant. Namely, we do not consider that there was a movement due to poor stabilization or displacement of clay sediments directly below the point, but the whole wider area around the point is of this soil type, and these movements are therefore manifested in the previously described way.
The following isolated points are located on solid rocks of higher density. The change in direction is even more pronounced but with relatively larger movements in the most active periods on the point VMLK, situated south of Zagreb (Figure 9). It is located in the Sava basin (4). Most predominant is the horizontal component of movement. Obviously, the oscillating changes are mainly influenced by the movements of the surrounding elevated structures that cause compression of the basin area and different movement directions of the observed geodynamic point.
Especially interesting are the data obtained at the point BLGS (Figure 10). It is located directly along the route of the main fault 1a of the Zagreb zone in Zelinska gora (2). The prevailing movements are towards SW and W but with the compression of space in the periods 2001–2004 and 2008–2009. Then, the movements were in the opposite direction. Movements of individual geodynamic points obviously depend on their position in the geological structural framework. For example, point MRKS is located in the zone of the main fault 1a in Zagreb (Figure 11). In the period 2009–2015, the Zagreb fault activity is increased.
Interesting are the directions of small movements mainly towards the SW, W and NW, and only in the period 2004–2006 were they oriented towards the SE. This is probably the result of the retrograde rotation of parts of Medvednica (1) and the relatively small activity along the section of main fault 1a in the Zagreb zone.
Larger movements with a steep slope in space were recorded at points that are located in parts with predominant compression of geologic structures. The point ZLMG stands out (Figure 12). It is located in the western part of Medvednica (1). The prevailing movements are towards WNW and WSW. Only in periods 2004–2006 and 2008–2009, the directions of movements were towards ENE. The latter is probably a reflection of larger reverse movements in the fault zone of Bistra-Laz (3), which cause the rotation of part of Medvednica (2) around an obliquely inclined axis and the movement’s direction changes with the descent of the observed point.
A particular example is point SVMG. It is located west of Zagreb along the route of the main fault 1a in the Zagreb zone in the structure Plešivica (4). This structure is relatively compressed and elevated between reverse faults of opposite vergences. Directions of movements towards W and WNW indicate the reverse movements along the fault Sv. Nedjelja-Plešivica (8) and towards E and SE along the main fault 1a in the Zagreb zone. The most active periods are between 1997–2001 and 2009–2015.

4.2. Tectonic Movements

The key fact is that the intensity of tectonic movements for the observed period (1997–2015) is highly oscillatory. There are constantly changing periods of higher and lower tectonic activity. In these periods, the amplitudes, the directions and angles of movements are variable in space.
Data for the entire observed period between 1997 and 2015 include the summary values of movements of geodynamic points. The amplitudes of tectonic movements, for the period 1997–2015, are shown in Figure 14. Small summary values were obtained. Nevertheless, it was possible to separate the parts of the structures in which the value of the amplitude is larger than 2 mm/yr and in particular 5 mm/yr. On certain points, amplitudes stand out: SVD2-5, 1 mm/yr (Zagreb), GPLN-9, 2 mm/yr (fault zone Stubica-Kašina, 4ab on Figure 2) and SVMG-12, 1 mm/yr (Plešivica, 4 on Figure 2). Discerned is the activity of the zone of the Zagreb fault (1a,b on Figure 2), the western part of Medvednica (1 on Figure 2), the western part of Zelinska gora (2 on Figure 2) and particularly around the fault zone Stubica-Kašina (4a,b on Figure 2) and the entirety of Vukomeričke gorice (7 on Figure 2). The amplitudes of less than 1 mm/yr are separated east of Zagreb, then within the Sava Basin (4) and Stubica sub-basin (9 on Figure 2). Also important are the average movement directions of certain parts of geologic structures.
There are three main observations; first, terrain movements WNW and NW in Medvednica (1) and Vukomeričke gorice (7 on Figure 2) present a response to regional tectonic movements. In Medvednica, this also means reverse movements along the fault Bistra-Laz (3). Furthermore, the rotation of the parts of Medvednica (1 on Figure 2) east of Zagreb is evident. Particularly noteworthy is the part of the geological structure Plešivica (4 on Figure 2). The summary direction of the movement at point SVMG towards SE indicates a significant concentration of the structure and the activity of Zagreb fault (1a,b on Figure 2).
The performed analysis shows that the tilt angles and directions of tectonic movements for the period 1997 to 2015 are very different (Figure 15). Particular emphasis is placed on the parts of the geologic structures in which positive and negative spatial movements of a steep slope, greater than 70°, have been determined.
Movements with steep slope indicate the prevailing of the vertical component of movement which appears in the conditions of the compression of space. The uplift is present in the western part of Medvednica (1), Plešivica (4) and Vukomeričke gorice (7). The compression of space but also the descent of certain network points are noted in parts of Sljeme (1) and Zelinska gora (2), northeast of Zagreb, and in the area between the points GRNC, PRPS and PPVC. Movement directions in all observed points are emphasized. Particularly, three areas are pointed out. First perceived are the prevailing horizontal movements of parts of Vukomeričke gorice (7) and the geological structure Brezovica (6) towards WNW and movements of points in different directions in the Sava basin (4). Especially noticeable are the different directions of movements of points around fault zones Stubica-Kašina (4a,b), indicating the expansion of space in the observed zone.

5. Conclusions

Geodetic measurements at the points of the geodynamic network in the period 1997–2015 directly indicate the permanent presence of tectonic activity in the wider Zagreb area. Based on the processing in GAMIT/GLOBK software, amplitudes and directions and tilt angles of movements of the geodynamic points were determined.
Tectonic activity in the encompassed geological structural framework is influenced by the regional tectonic movements, as described earlier (Figure 1). They are responsible for the compression and reverse movements along the most important fault zones. It should be noted that the data show that the tectonic movements have different oscillating intensity. Directions and tilt angles of movements of some geodynamic points are constantly changing. The causes are not only regional tectonic movements but also the arrangement, attitude and position of rocks of different density within the structural units and, in particular, Medvednica (1 in Figure 2). Their existence sets preconditions for the creation of smaller structural blocks. It can also be noted that there are further changes in the direction and magnitude of tectonic movements in certain fault zones. However, here, we must also conclude that some of the odd behavior of the points shown in the paper also indicates that those points should be further checked and possibly excluded from the solutions since it can also mean that their position in the structural setting is questionable and new points should be stabilized on a better, more suitable location.
Based on the interdisciplinary analysis of geodetic and geological movement models for the wider Zagreb area in the observed period, there are several important conclusions:
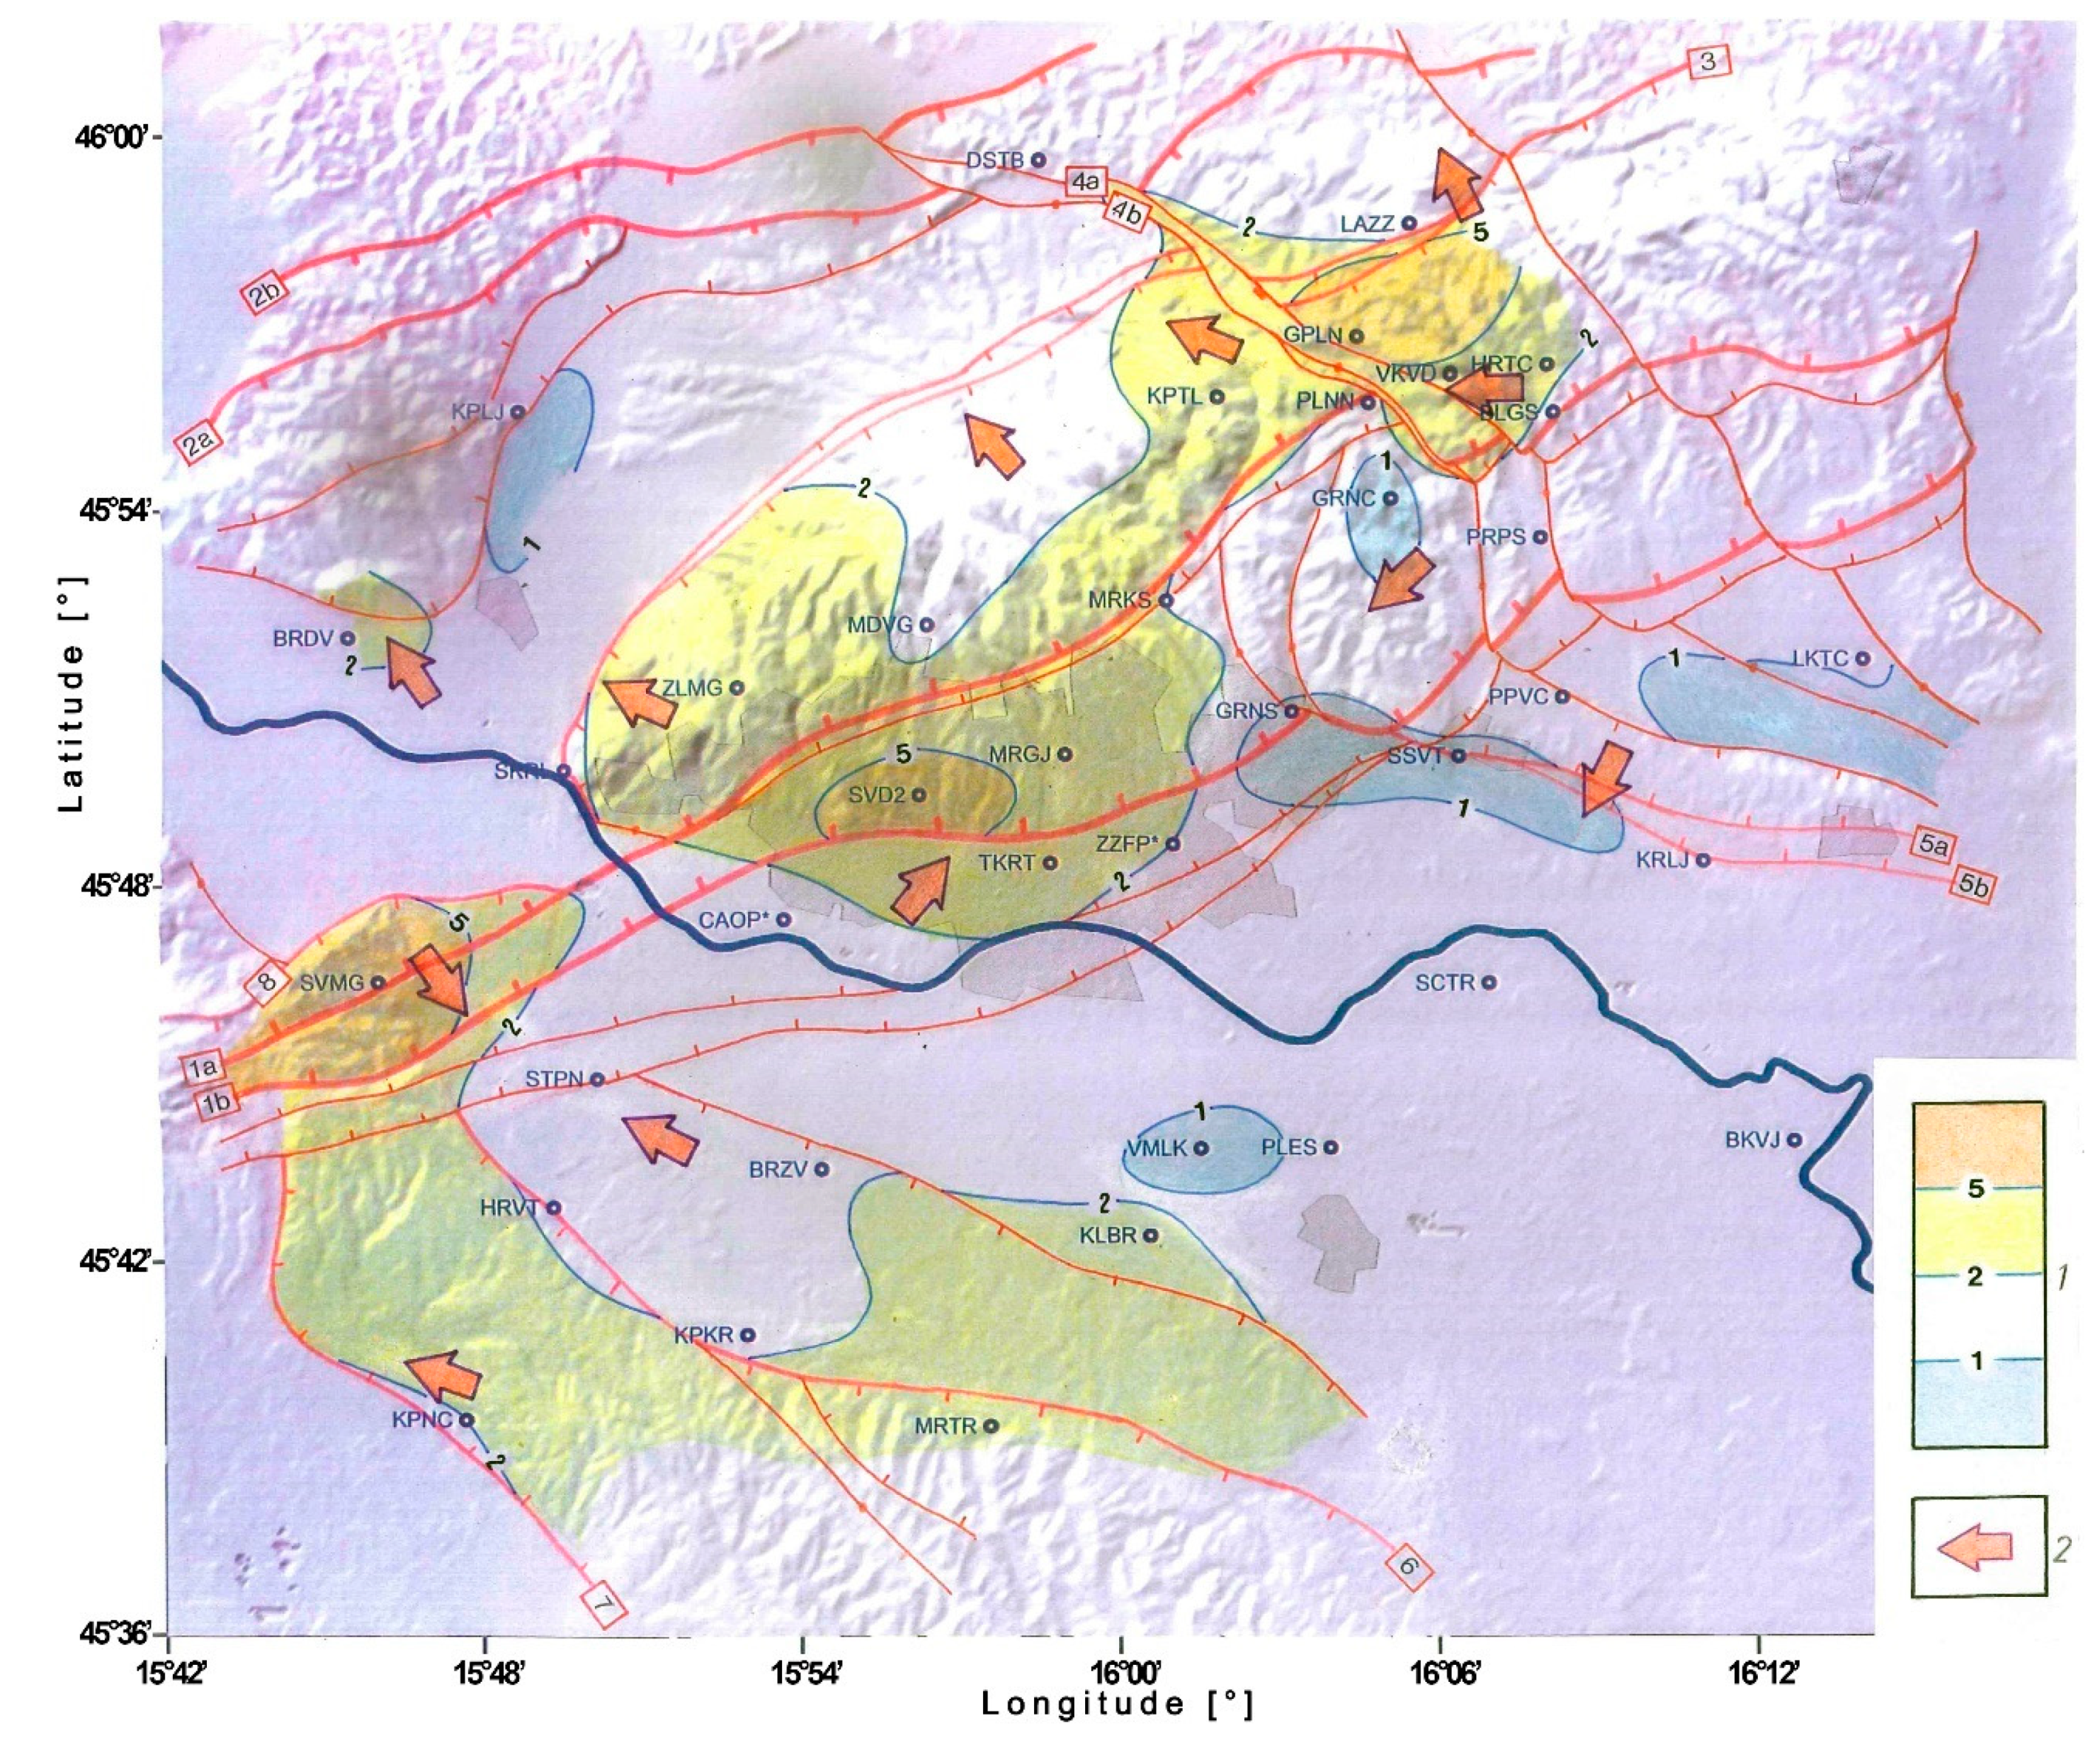
  • The largest amplitudes of tectonic movements are present in the western part of Medvednica, then along the zone of Zagreb fault and west of Zagreb, around the fault zone of Stubica-Kašina and in parts of Vukomeričke gorice.
  • The resulting different average movement directions, as in Medvednica, show that regional tectonic movements initiate retrograde rotation of its structural blocks. This is especially expressed with the different directions of movements of Zelinska gora.
  • In the western part of Medvednica, positive movements (elevation) were recorded in certain points. These parts of Medvednica directly oppose the action of regional tectonic movements. In contrary, in the eastern part of Medvednica, mainly in the wider area around the fault zone Stubica–Kašina, negative movements (subsidence) at geodynamic points are prevailing. This indicates that in the Medvednica area, a general rotation around the obliquely inclined axis in space is present.
It can be concluded that by using geodetically precisely determined movements of the points of the geodynamic network, a detailed analysis of the tectonic activity in the area of research has been conducted. Movements determined at each specially stabilized geodynamic network point vary widely and depend on its position within the local geologic structural framework, as well as on regional tectonic movements and possibly due to poor location selection of some points. The poorly located points should be excluded from the tectonic analysis and moved to more suitable locations. Currently, a densification project for the geodynamic network of the City of Zagreb is in its preparatory phase.
The next step in the research is to enhance the research on the geodynamic network with the results from two recent GPS measurement campaigns conducted in 2018 and 2019 and using the InSAR (Interferometric Synthetic Aperture Radar) technique, in order to obtain a more detailed insight into ongoing ground deformations. Current research includes the utilization of InSAR data. InSAR data will provide better coverage of the area, especially in urban parts. The combination of GPS and InSAR methods will give a more accurate and more detailed insight into future geodynamic activities that occur in the area of research.

Author Contributions

Conceptualization, A.Đ., B.P., E.P. and M.P.; methodology, A.Đ., M.P. and E.P.; software, A.Đ. and M.P.; validation, A.Đ., B.P., E.P. and M.P.; formal analysis, A.Đ., M.P. and E.P.; investigation, A.Đ., M.P. and E.P.; resources, A.Đ., M.P., E.P. and B.P.; data curation, A.Đ., M.P. and E.P.; writing—original draft preparation, A.Đ., M.P. and E.P.; writing—review and editing, A.Đ., M.P. and E.P.; visualization, A.Đ., M.P. and E.P.; supervision, A.Đ., M.P. and B.P.; project administration, B.P.; funding acquisition, B.P. All authors have read and agreed to the published version of the manuscript.

Funding

This research was funded by Croatian science foundation, grant number IP-01-2018-8944 and the APC was funded by IP-01-2018-8944.

Conflicts of Interest

The authors declare no conflict of interest.

References

  1. Herak, D.; Herak, M.; Tomljenović, B. Seismicity and earthquake focal mechanisms in North-Western Croatia. Tectonophysics 2009, 485, 212–220. [Google Scholar] [CrossRef]
  2. Herak, M.; Allegretti, I.; Herak, D.; Ivančić, I.; Kuk, K.; Marie, K.; Markušić, S.; Sović, I. Seismic hazard maps of Croatia. In Proceedings of the Geophysical Challenges of the 21st Century, Zagreb, Croatia, 2 December 2011. [Google Scholar]
  3. Prelogović, E.; Cvijanović, D. Potres u Medvednici 1880. godine. Geol. Vjesn. 1981, 34, 137–146. (In Croatian) [Google Scholar]
  4. Pribičević, B.; Medak, D.; Prelogović, E.; Đapo, A. Geodinamika Prostora Grada Zagreba; Scientific monograph: Faculty of Geodesy; University of Zagreb: Zagreb, Croatia, 2007. (In Croatian) [Google Scholar]
  5. Decker, K. Miocene tectonics at the Alpine-Carpathian junction and the evolution of the Vienna Basin. Mitt. Ges. Geol. Bergbaustud. Österr 1996, 41, 33–44. [Google Scholar]
  6. Prelogović, E.; Jamičić, D.; Aljinović, B.; Velić, J.; Saftić, B.; Dragaš, M. Dinamika nastanka struktura južnog dijela panonskog bazena. In Proceedings of the First Croatian Geological Congress, Opatija, Croatia, 18–21 October 1995; pp. 481–486. (In Croatian). [Google Scholar]
  7. Pribičević, B. Uporaba Geološko-geofizičnih in Geodetskih baz Podatkov za Računanje Ploskve Geoida Republike Slovenije. In Znanstvena Monografija; Univerza v Ljubljani, Fakulteta za gradbeništvo in geodezije: Ljubljana, Slovenia, 2001; pp. 1–115. [Google Scholar]
  8. Medak, D.; Pribičević, B. Geodinamička mreža Grada Zagreba. In Zbornik Geodetskog Fakulteta Sveučilišta u Zagrebu Povodom 40. Obljetnice Samostalnog Djelovanja 1962–2002; University of Zagreb: Zagreb, Croatia, 2002; pp. 145–156. [Google Scholar]
  9. Medak, D.; Pribičević, B.; Prelogović, E. Determination of the recent structural fabric in the Alps-Dinarides area by a combination of geodetic and geologic methods. In Raziskave s Področja Geodezije in Geofizike; Brilly, M., Ed.; Slovensko združenje za geodezije in geofiziko: Ljubljana, Slovenia, 2002; pp. 57–64. [Google Scholar]
  10. Ben, A.D.; Finetti, I.; Rebez, A.; Slejko, D. Seismicity and seismotectonics at the Alps-Dinarides contact. Boll. Geof. Teor. Appl. 1991, 33, 155–176. [Google Scholar]
  11. Prelogović, E. Preliminarni Model Potresnih Izvora Slovenije; RGN Fakultet: Zagreb, Croatia, 1996. (In Croatian) [Google Scholar]
  12. Kuk, V.; Prelogović, E.; Sović, L.; Kuk, K.; Marić, K. Seizmološke i seizmotektonske značajke šireg zagrebačkog područja. Građevinar 2000, 52, 647–653. (In Croatian) [Google Scholar]
  13. Herak, M.; Herak, D.; Markušić, S. Revision of the earthquake catalogue and seismicity of Croatia, 1908–1992. Terra Nova 1996, 8, 86–94. [Google Scholar] [CrossRef]
  14. Ivančić, I.; Herak, D.; Markušić, S.; Sović, I.; Herak, M. Seismicity of Croatia in the period 2002–2005. Geofizika 2006, 2, 1–17. [Google Scholar]
  15. Ivančić, I.; Herak, D.; Herak, M.; Allegretti, I.; Fiket, T.; Kuk, K.; Markušić, S.; Prevolnik, S.; Sović, I.; Dasović, I.; et al. Seismicity of Croatia in the period 2006–2015. Geofizika 2018, 1, 69–98. [Google Scholar] [CrossRef]
  16. Pribičević, B.; Medak, D.; Đapo, A. Progušćenje točaka Geodinamičke mreže Grada Zagreba u podsljemenskoj zoni. Geodetski List 2007, 61, 247–258. (In Croatian) [Google Scholar]
  17. Matoš, B.; Tomljenović, B.; Trenc, N. Identification of tectonically active areas using DEM: A quantitative morphometric analysis of Mt. Medvednica, NW Croatia. Geol. Q. 2014, 58, 51–70. [Google Scholar] [CrossRef] [Green Version]
  18. Pribičević, B.; Đapo, A. Analiza pomaka na Geodinamičkoj mreži Grada Zagreba iz različitih vremenskih epoha. Geodetski List 2016, 70, 207–230. (In Croatian) [Google Scholar]
  19. Pribičević, B.; Đapo, A.; Medak, D. Geodetsko-geološka istraživanja na širem zagrebačkom području oslonjena na Geodinamičku mrežu Grada Zagreba. Geodetski List 2011, 65, 1–19. (In Croatian) [Google Scholar]
  20. Đapo, A.; Pribičević, B.; Medak, D.; Prelogović, E. Correlation between Geodetic and Geological Models in the Geodynamic Network of the City of Zagreb. Rep. Geod. 2009, 86, 115–122. [Google Scholar]
  21. Lučić, D.; Saftić, B.; Krizmanić, K.; Prelogović, E.; Britvić, V.; Mesić, I.; Tadej, J. The Neogene evolution and hydrocarbon potential of the Pannonian Basin in Croatia. Mar. Pet. Geol. 2001, 18, 133–147. [Google Scholar] [CrossRef]
  22. Vrabec, M.; Fodor, L. Late Cenozoic tectonics of Slovenia: Structural styles at the North-eastern corner of the Adriatic microplate. In The Adria Microplate: GPS Geodesy, Tectonics and Hazards, 151–168; Springer: Amsterdam, The Netherlands.
  23. Tomljenović, B.; Csontos, L. Neogene–Quaternary structures in the border zone between Alps, Dinarides and Pannonian Basin. Int. J. Earth Sci. 2001, 90, 560–578. [Google Scholar] [CrossRef]
  24. Prelogović, E.; Kuk, V. Seizmotektonska aktivnost zapadnog dijela Hrvatske. In Proceedings of the the Scientific Conference “Andrija Mohorovičić”; Bajić, A., Ed.; Državni hidrometeorološki zavod: Zagreb, Croatia, 1998; pp. 115–124. (In Croatian) [Google Scholar]
  25. Basch, O. (1983a): Osnovna Geološka Karta SFRJ 1:100.000, List Ivanić-Grad L33–81.–Geološki Zavod, Zagreb; OOUR za Geologiju i Paleontologiju (1969–1976); Savezni Geološki Institut: Beograd, Jugoslavija, 1981. [Google Scholar]
  26. Basch, O. (1983b): Osnovna Geološka karta SFRJ 1:100.000, Tumač za list Ivanić-Grad L33–81.–Geološki Zavod, Zagreb (1980); Savezni Geološki Institut: Beograd, Jugoslavija, 1980. [Google Scholar]
  27. Gerasimenko, M.D.; Shestakov, N.V.; Kato, T. On optimal geodetic network design for fault-mechanics studies. Earth Planets Space 2000, 52, 985–987. [Google Scholar] [CrossRef] [Green Version]
  28. Feigl, K.L.; Duncan, C.A.; Bock, Y.; Dong, D.; Donnellan, A.; Hager, H.B.; Herring, T.A.; Jackson, D.D.; Jordan, T.H.; King, R.W.; et al. Space geodetic measurement of crustal deformation in central and southern California, 1984–1992. J. Geophys. Res. 1993, 98, 21677–21712. [Google Scholar] [CrossRef]
  29. Dong, D.; Herring, T.; King, R. Estimating regional deformation from a combination of space and terrestrial geodetic data. J. Geod. 1998, 72, 200–214. [Google Scholar] [CrossRef]
  30. Herring, T.; Davis, J.; Shapiro, I. Geodesy by radio astronomy: The aplication of Kalman filtering to Very Long Baseline Interferometry. J. Geophys. Res 1990, 95, 12561–12581. [Google Scholar] [CrossRef]
  31. Herring, T.A.; King, R.W.; Floyd, M.A.; McClusky, S.C. Introduction to GAMIT/GLOBK. In Proceedings of the GAMIT–GPS Analysis at MIT; Department of Earth, Atmospheric, and Planetary Sciences Massachusetts Institute of Technology: Cambridge, MA, USA, 2015. [Google Scholar]
  32. Herring, T.A.; King, R.W.; Floyd, M.A.; McClusky, S.C. GAMIT Reference Maunal 10.6. In Proceedings of the GAMIT–GPS Analysis at MIT; Department of Earth, Atmospheric, and Planetary Sciences Massachusetts Institute of Technology: Cambridge, MA, USA, 2015. [Google Scholar]
  33. Reilinger, R.; McClusky, S.; Vernant, P.; Lawrence, S.; Ergintav, S.; Cakmak, R.; Ozener, H.; Kadirov, F.; Guliev, I.; Stepanyan, R.; et al. GPS Constraints on Continental Deformation in the Africa-Arabia-Eurasia Continental Collision Zone and implications for the Dynamics of Plate Interactions. J. Geophys. Res. 2006, 111, 2156–2202. [Google Scholar] [CrossRef]
  34. McClusky, S.; Balassanian, S.; Barka, A.; Demir, C.; Ergintav, S.; Georgiev, I.; Gurkan, O.; Hamburger, M.; Hurst, K.; Kahle, H.; et al. Global Positioning System constraints on plate kinematics and dynamics in the eastern Mediterranean and Caucasus. J. Geophys. Res. 2000, 105, 5695–5719. [Google Scholar] [CrossRef]
  35. Davies, P.; Blewitt, G. Methodology for global geodetic time series estimation: A new tool for geodynamics. J. Geophys. Res. Space Phys. 2000, 105, 11083–11100. [Google Scholar] [CrossRef] [Green Version]
  36. Premužić, M.; Đapo, A.; Bačić, Ž.; Pribičević, B. Accuracy analysis of point velocities determined by different software packages and GNSS measurement processing methods. Tech. J. 2020, 14, 1. [Google Scholar] [CrossRef]
Figure 1. (a) Regional structural relations; Legend: 1—Most important faults: Gorica-Ilirska Bistrica-Rijeka fault (1), fault of the Southern Alps (2), Fella-Sava-Karlovac fault (3), Periadriatic-Drava fault (4), Zagreb fault (5), Brežice-Koprivnica fault (6); 2—Other important faults; 3—The direction of horizontal movement in fault zones; 4—Regional structural units: Southern Alps (SA) and Prealps (AF), Eastern Alps (EA), Dinarides (D), Adriatic Microplate (AMP), Western Pannonian Basin (WPB), Southern Pannonian Basin (SPB); 5—Direction of displacement of the Adriatic microplate; 6—Movement directions of structural units parts; 7—Medvednica. (b) Earthquake epicenters of magnitude 2–6.9 [4].
Geosciences 10 00498 g001
Figure 2. Recent geologic structural framework and seismotectonic activity; 1—Structural units: Žumberačka gora-Medvednica (1), Vukomeričke gorice-Šamarica (2), Dugo Selo-Vrbovec-Moslavačka gora (3), Sava River Basin (4); 2—Structures: Medvednica (1), Marija Gorica (2), Hum (3), Plešivica (4), Dugo Selo-Lupoglav (5), Brezovica (6), Vukomeričke gorice (7), Krško-Zagorje subbasin (8), Stubica subbasin (9); 3—Structural blocks of Medvednica: Sljeme (1), Zelinska gora (2); 4—Axis of maximum and minimum of gravimetric Bougue anomalies; 5—Most important faults of the structural framework: Zagreb fault (1a,b), Brežice-Koprivnica fault (2a,b), Bistra-Laz fault (3a,b), Stubica-Kašina fault (4a,b), Dugo Selo-Ivanić Grad-Kutina fault (5a,b), Vukomerice fault (6), Pokupsko fault (7), Sv. Nedjelja-Plešivica fault (8); 6—Larger faults within structures and fault zones and faults following most important faults; 7—Reverse faults; 8—Normal faults; 9—Faults of unambiguous character; 10—Fault zones; 11—Earthquake epicenters with magnitude: (a) 4.6–5.0; (b) 5.1–6.0; (c) 6.1–6.3; 12—Orientation of maximal compressional stress; 13—Orientation of local compressional stress; 14—Direction of movement of structure parts according to geological measurements; 15—Faults with mostly horizontal wing movement; 16—Seismotectonic profile; 17—GPS points of the geodynamic network.
Geosciences 10 00498 g002
Figure 3. Seismotectonic profile (A–B in Figure 2). 1a—Outbreaks of earthquakes that occurred in the period 1997–2009 with a magnitude of up to 3.5; 1b—in the period 2009–2015 with a magnitude of up to 3.2; 2—The most important faults in the bordering structural unit Žumberačka gora-Medvednica: Zagreb fault (1), Brežice-Koprivnica fault (2) and Bistra-Laz fault (3); 3—Other active faults; 4—Seismotectonically active zone in space (updated from [4]).
Geosciences 10 00498 g003
Figure 4. Sketch of the pillar of geodynamic points and photo of built pillars.
Geosciences 10 00498 g004
Figure 5. Configuration of the geodynamic network (blue dots with four-letter names). Most important faults of the structural framework: Zagreb fault (1a, b), Brežice-Koprivnica fault (2a, b), Bistra-Laz fault (3a, b), Stubica-Kašina fault (4a, b), Dugo Selo-Ivanić Grad-Kutina fault (5a, b), Vukomerice fault (6), Pokupsko fault (7), Sv. Nedjelja-Plešivica fault (8).
Geosciences 10 00498 g005
Figure 6. Velocity models for periods between epoch campaigns respectively: ‘97-‘01, ‘01-‘04, ‘04-‘06, ‘06-‘08, ‘08-‘09, ‘09-‘15. Formal errors scaled by 1.0, confidence interval 95%.
Geosciences 10 00498 g006
Figure 7. Cumulative geodetic velocity model on the geodynamic network points for the period 1997–2015. Formal errors scaled by 1.0, confidence interval 95%.
Geosciences 10 00498 g007
Figure 8. Point PPVC. Movements on all sides, small values of movements; Movement causes–position in the framework.
Geosciences 10 00498 g008
Figure 9. A typical example of movement direction change. Most active period 2006–2008 and 2009–2015. Movement causes—position in the framework.
Geosciences 10 00498 g009
Figure 10. Point BLGS. Larger movements with opposite direction (movement of Zelinska gora). Larger movement values 2008–2009 and 2009–2015.
Geosciences 10 00498 g010
Figure 11. Point MRKS. The continuous direction of movement, average and small movement values. The condition between the movement of Zelinska gora and elevation of the Sljeme mountain (less active part).
Geosciences 10 00498 g011
Figure 12. Point SVMG. Example of larger activities. Most active 1997–2001 and 2009–2015. Direction change due to compression of space.
Geosciences 10 00498 g012
Figure 13. Point ZLMG. Example of prevailing of the same direction towards WNW and WSW, only in the period 2008–2009 towards ENE. Largest activity in 2009–2015.
Geosciences 10 00498 g013
Figure 14. Amplitudes of tectonic movements based on geodetic data for the period 1997–2015; 1—amplitudes of tectonic movements in mm for the period 1997–2015, 2—average movement directions of geologic structure parts according to geodetic measurements.
Geosciences 10 00498 g014
Figure 15. Tilt angles and directions of tectonic movements based on GPS data for the period 1997–2015; 1a—positive spatial (elevation/uplift) and 1b—negative movement (descent) under the angle higher than 70° (prevailing of vertical movement component); 2a—positive spatial (elevation/uplift) and 2b—negative movements (descent) with an angle between 30° and 70°; 3a—positive spatial (elevation/uplift) and 3b—negative movements (descent) with an angle less than 30° (prevailing of horizontal movement component).
Geosciences 10 00498 g015
Table 1. All conducted GPS campaigns with the number of sessions, points included and used receivers.
CampaignDate (from–to)Nr.
Session
Nr.
Pts
Nr.
GPS Receivers
Nr.
Epochs/pt
Zagreb 199727.10.1997–29.10.1997243272880
Zagreb 200125.06.2001–28.06.2001340162880
Zagreb 200322.06.2003–23.06.2003113132880
Zagreb 200417.06.2004–20.06.2004339132880
Zagreb 200510.09.2005–11.09.2005111112880
Zagreb 200622.06.2006–25.06.2006341152880
Zagreb 200713.07.2007–15.07.2007221132880
Zagreb 200810.06.2008–13.06.2008341152880
Zagreb 200911.06.2009–14.06.2009341152880
Zagreb 201511.06.2015–14.06.2015341155760
Table 2. Velocity components on the network points for the 1997–2015 period.
Nameλφvφ
(mm/yr)
+/− mmvλ
(mm/yr)
+/− mmvH
(mm/yr)
+/− mmvhor
(mm/yr)
vsum
(mm/yr)
Azimuth°V. ang°
BKVJ16.211445.73231.40.06−1.60.05−0.20.232.12.1312.1−6.0
BLGS16.135345.9257−0.30.05−0.90.05−1.40.200.91.6252.0−56.2
BRDV15.758545.86620.70.07−0.40.06−2.30.290.82.4328.4−71.5
BRZV15.906545.72470.70.06−0.70.050.80.251.01.3314.640.2
CAOP15.894945.79120.30.030.50.021.30.110.61.564.766.2
DSTB15.975345.9929−0.60.07−1.70.06−0.10.271.81.8250.8−4.2
GPLN16.074345.94604.10.312.70.26−7.81.534.99.233.1−58.1
GRNC16.085045.9031−0.30.05−0.30.04−0.50.180.40.6228.1−52.6
GRNS16.054445.8466−0.10.05−0.20.04−0.50.200.20.5255.3−68.2
HRTC16.133345.93850.10.38−0.70.35−2.11.450.72.2280.4−70.9
HRVT15.822545.71470.30.06−1.10.060.00.251.21.2286.60.5
KLBR16.009745.70701.60.070.00.05−2.80.241.63.20.7−60.4
KPKR15.883245.68090.40.07−1.90.060.20.241.91.9283.25.3
KPLJ15.811845.92650.10.07−0.20.06−0.70.240.20.7289.2−70.0
KPNC15.794745.65800.70.07−1.40.061.30.261.52.0295.140.7
KPTL16.030445.92910.20.05−0.10.05−2.40.210.22.4324.8−85.0
KRLJ16.183245.8068−0.70.06−1.00.05−0.20.231.21.2234.8−7.4
KTSS16.111445.8268−0.50.110.20.090.60.450.50.8155.947.9
LAZZ16.090645.97590.00.06−1.10.05−0.80.221.11.4271.6−38.1
LKTC16.233045.8604−0.70.06−0.50.06−0.70.250.81.1217.8−38.7
MDVG15.940445.86910.50.04−0.80.03−1.20.150.91.5305.8−53.1
MRGJ15.983445.83511.60.060.50.05−1.40.281.72.217.8−39.6
MRKS16.014945.8758−0.30.07−0.80.06−1.80.320.92.0247.0−64.0
MRTR15.959645.6562−0.10.07−0.20.063.00.260.23.0235.685.6
PLES16.066345.7307−0.60.07−0.90.06−0.10.281.11.1236.8−6.9
PLNN16.078045.9284−0.40.05−1.10.050.70.221.11.3250.131.0
PPVC16.138845.85030.00.06−0.30.05−1.50.220.31.5268.2−77.5
PRPS16.131745.89270.10.05−0.50.04−1.10.200.51.2275.4−63.3
SCTR16.115945.7744−0.80.06−0.70.05−2.50.231.12.7222.8−66.0
SKRL15.826545.83090.00.07−1.70.060.80.271.71.9269.323.3
SSVT16.106545.8349−1.50.05−0.50.040.10.201.61.6197.94.4
STPN15.836445.74890.50.06−1.20.050.70.211.31.4291.328.2
SVDH15.940745.8216−1.70.100.00.094.80.431.75.1179.071.0
SVMG15.768145.7746−0.40.090.30.0712.00.350.512.1142.587.4
TKRT15.978745.80622.00.070.30.061.20.282.02.39.631.1
VKVD16.103545.93612.20.261.10.22−1.11.352.42.725.9−24.8
VMLK16.025545.7302−0.30.06−0.80.06−0.20.270.80.9248.6−15.8
ZLMG15.881345.85280.80.07−1.00.062.30.281.32.6309.159.8
ZZFP16.017045.8112−0.30.03−0.50.02−1.90.110.62.0244.7−73.0
Table 3. The statistical value of the velocity components for the 1997–2015 periods.

(mm/yr)

(mm/yr)
vH
(mm/yr)
vhor
(mm/yr)
vsum
(mm/yr)
max4.092.6712.044.8812.05
min0.010.020.010.200.53
avg0.700.761.711.142.28
Publisher’s Note: MDPI stays neutral with regard to jurisdictional claims in published maps and institutional affiliations.

