The 2013–2018 Matese and Beneventano Seismic Sequences (Central–Southern Apennines): New Constraints on the Hypocentral Depth Determination


Abstract
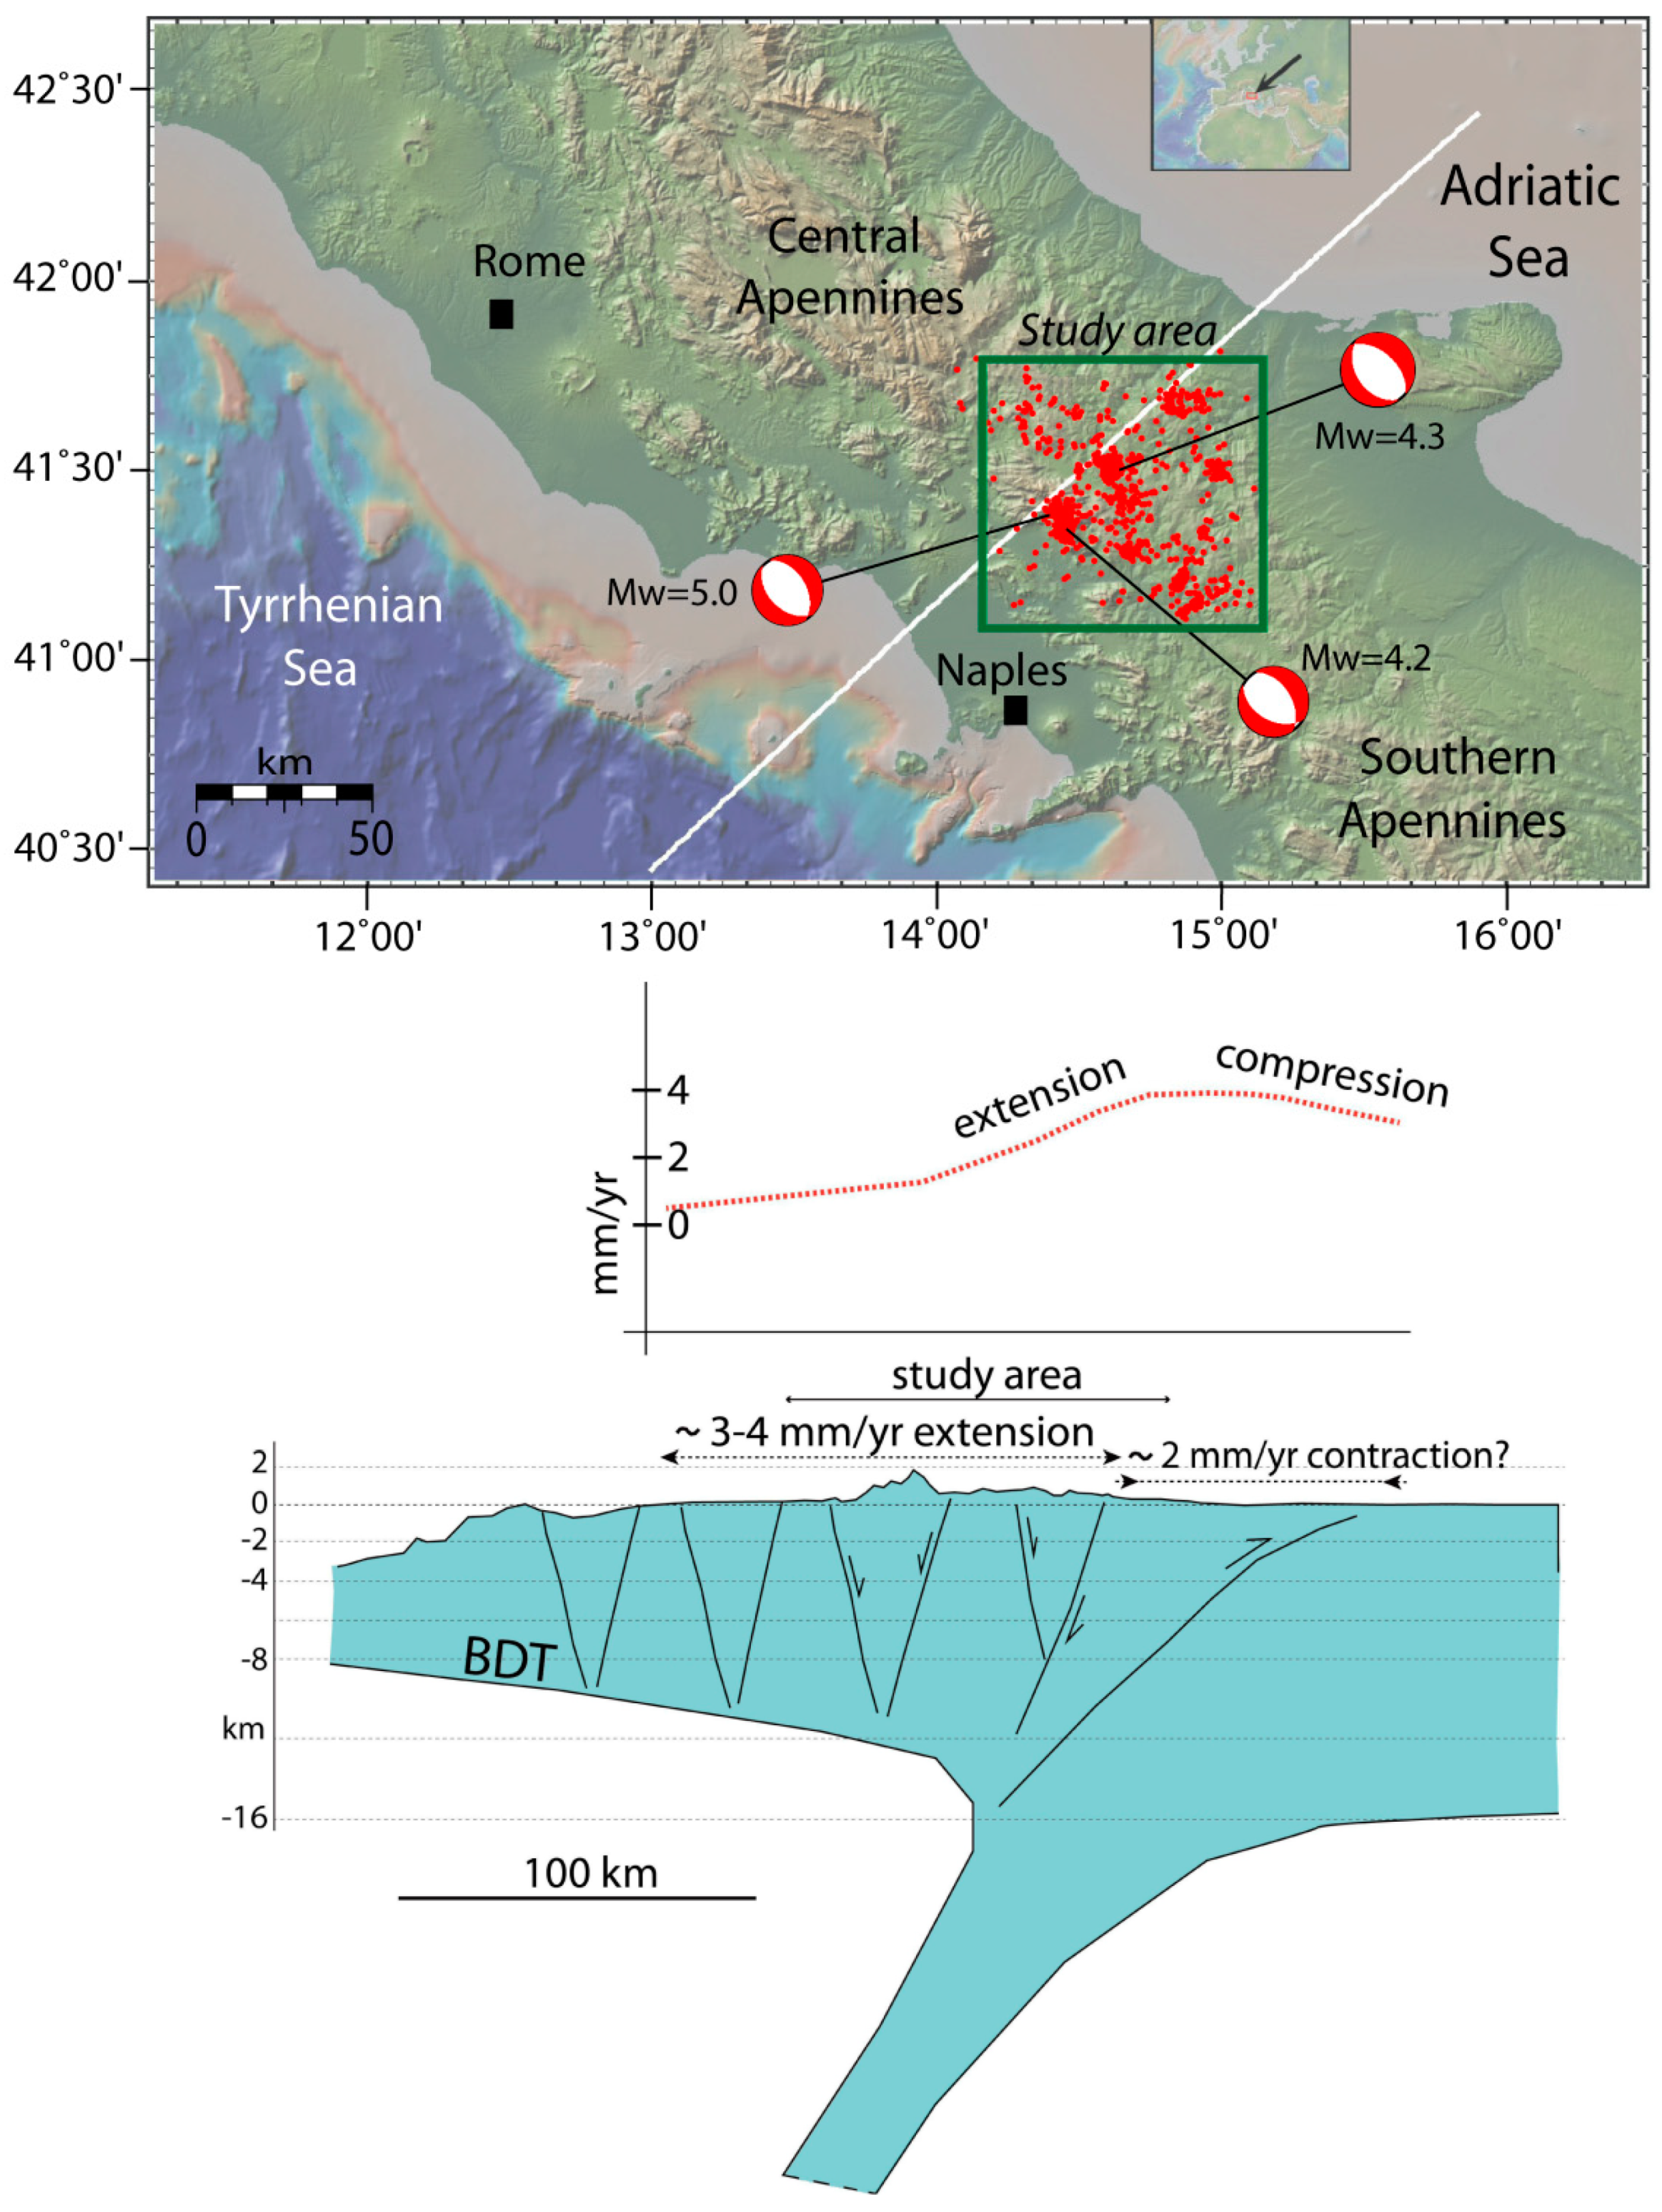
1. Introduction
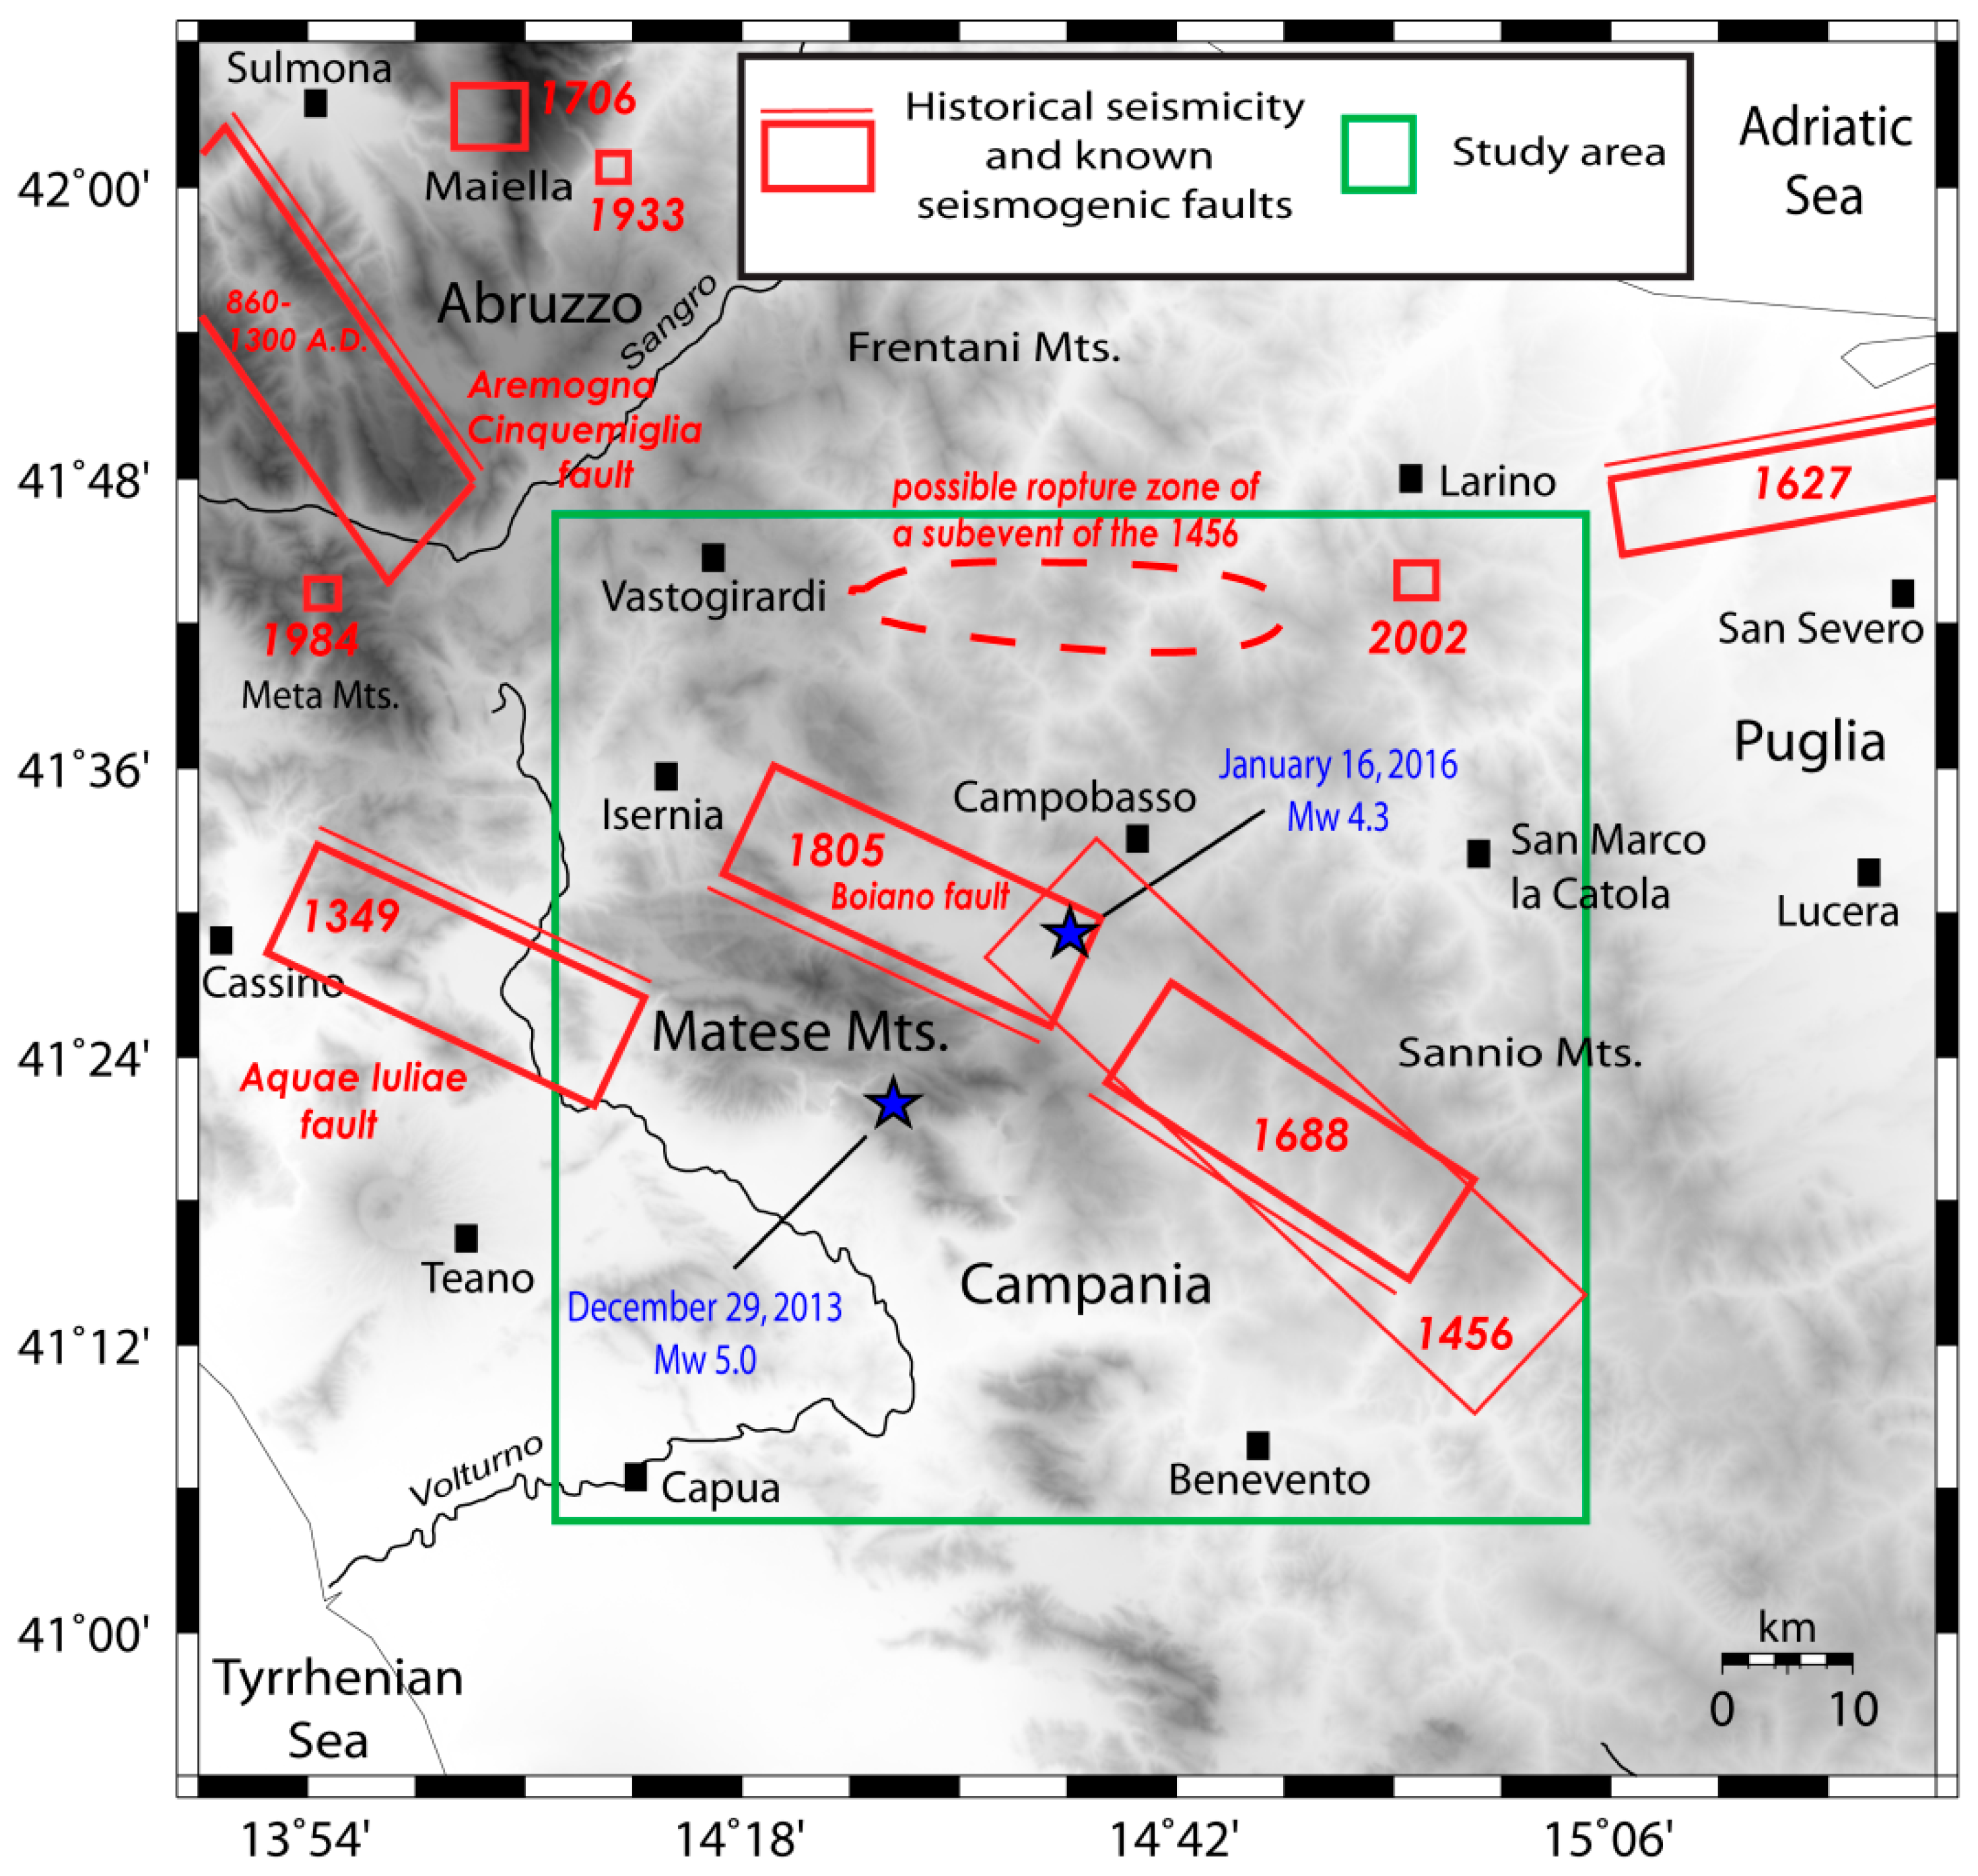
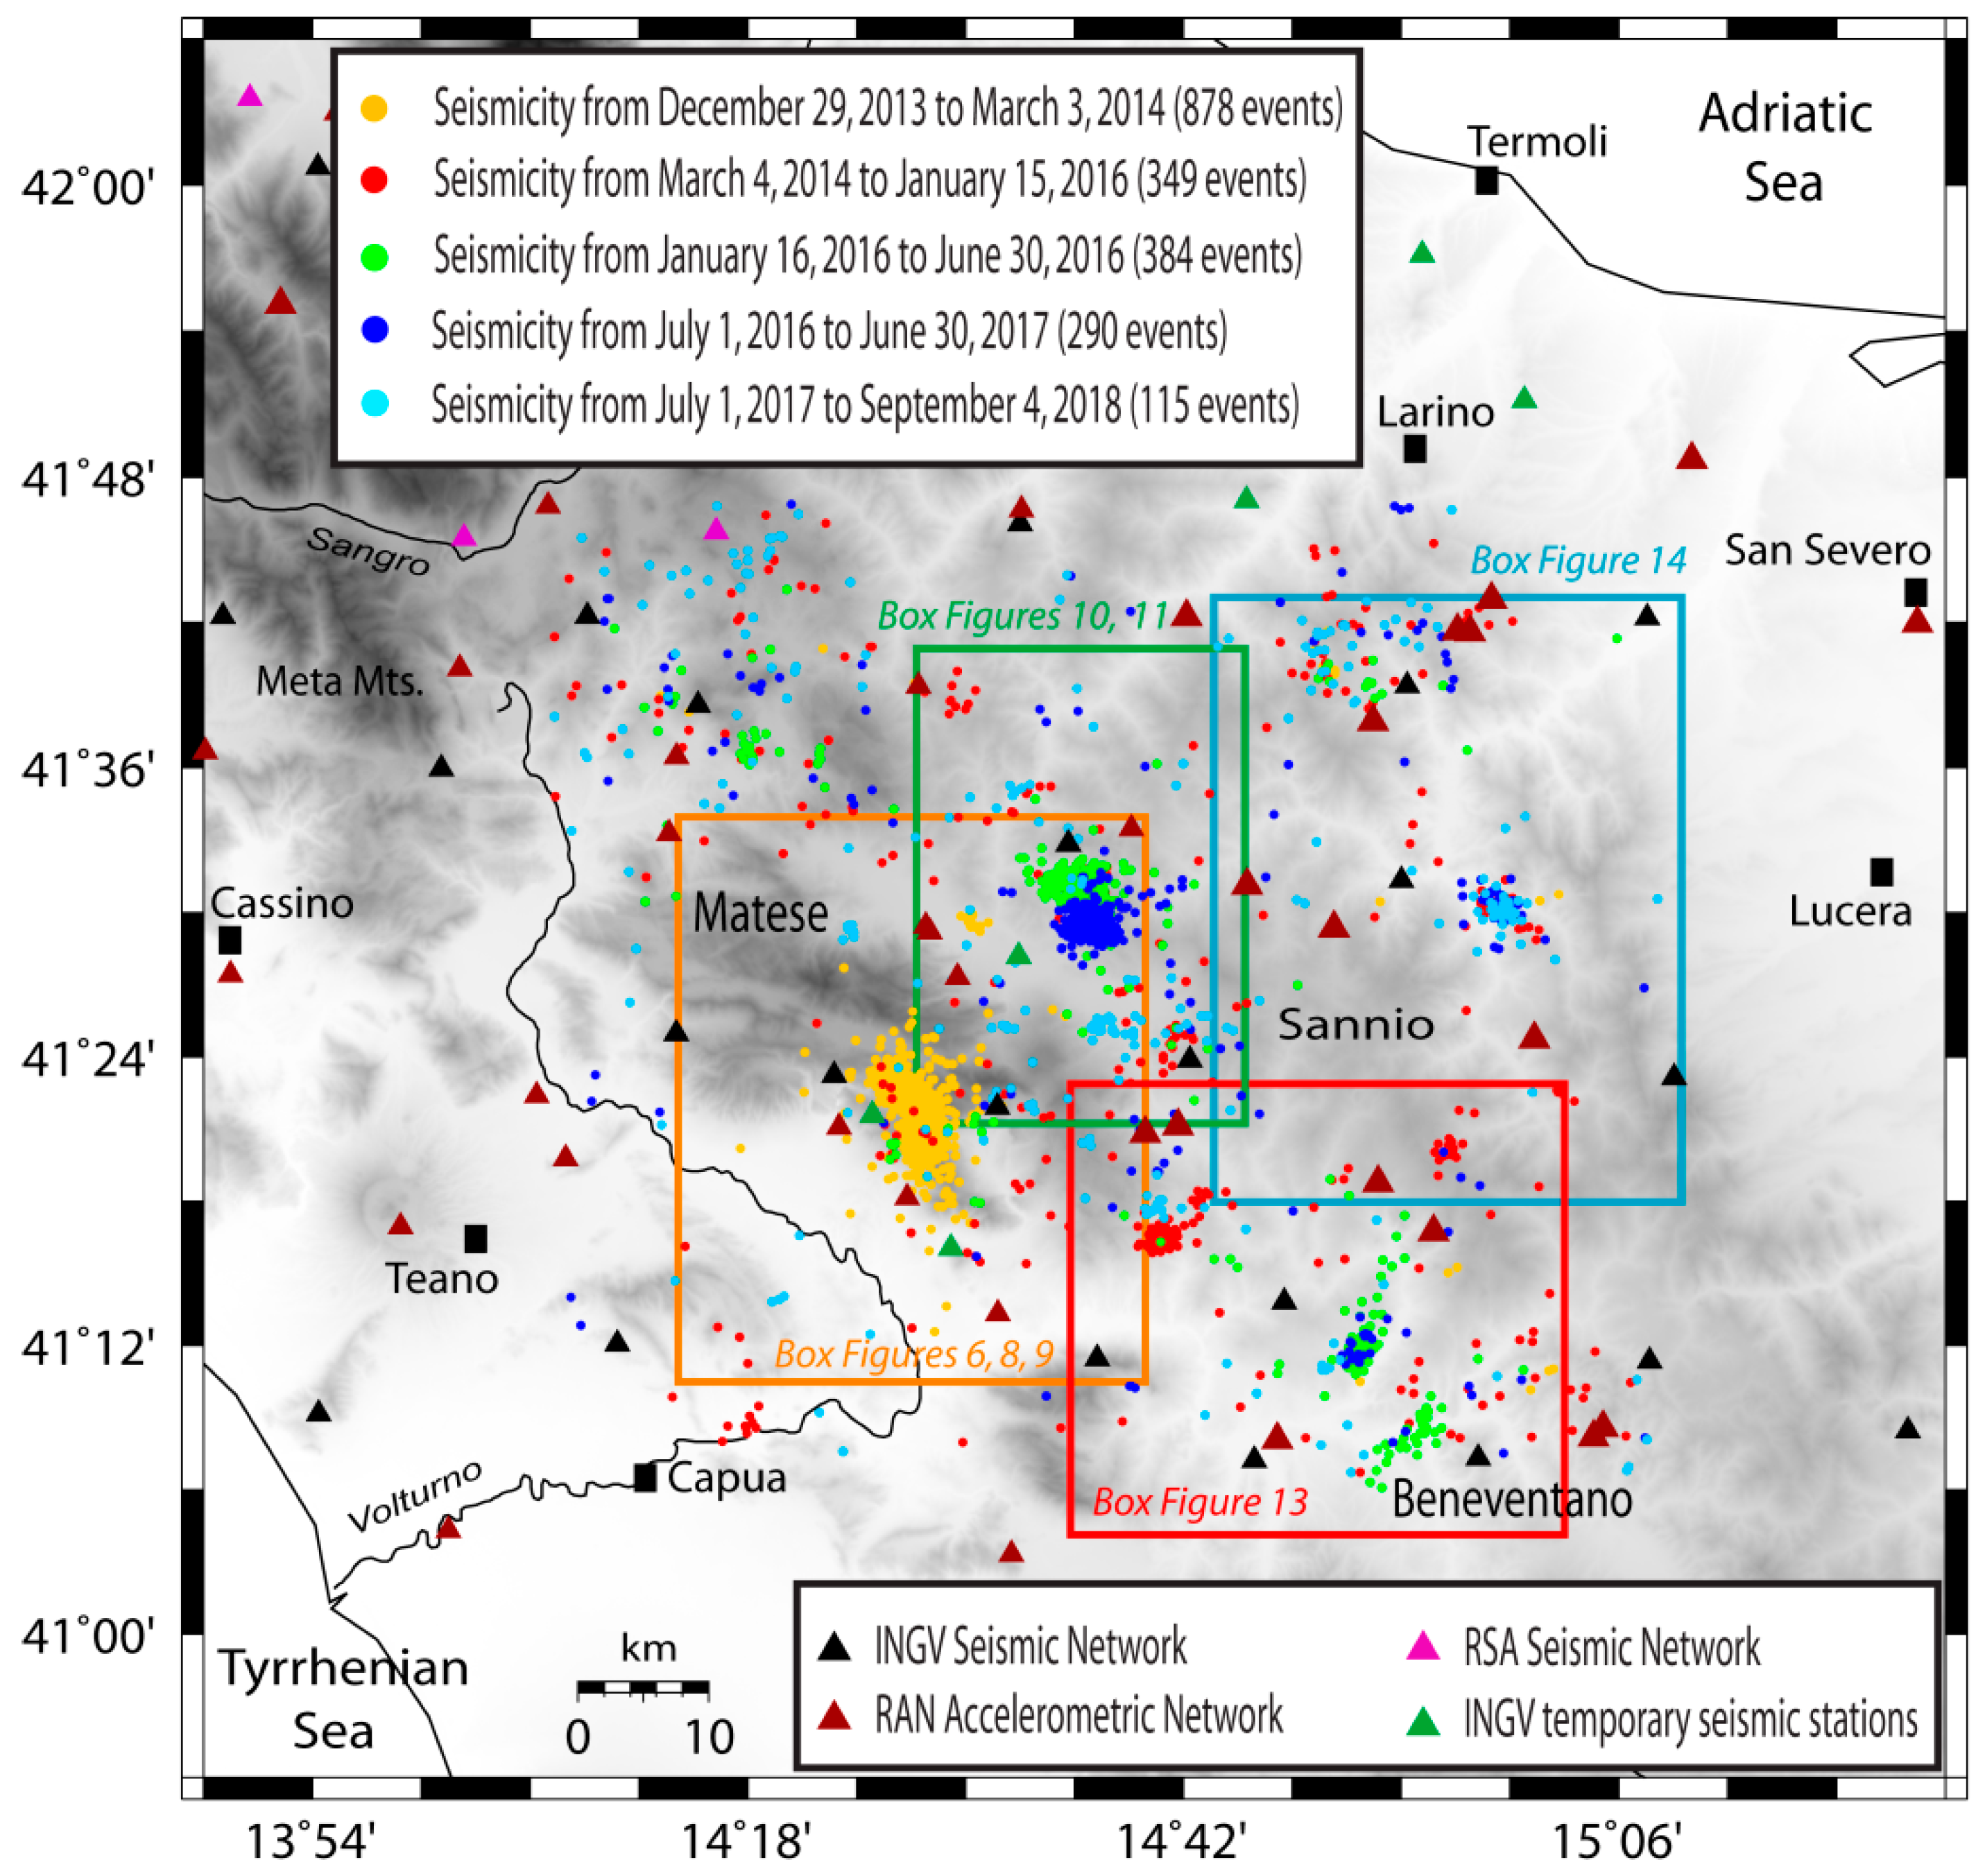
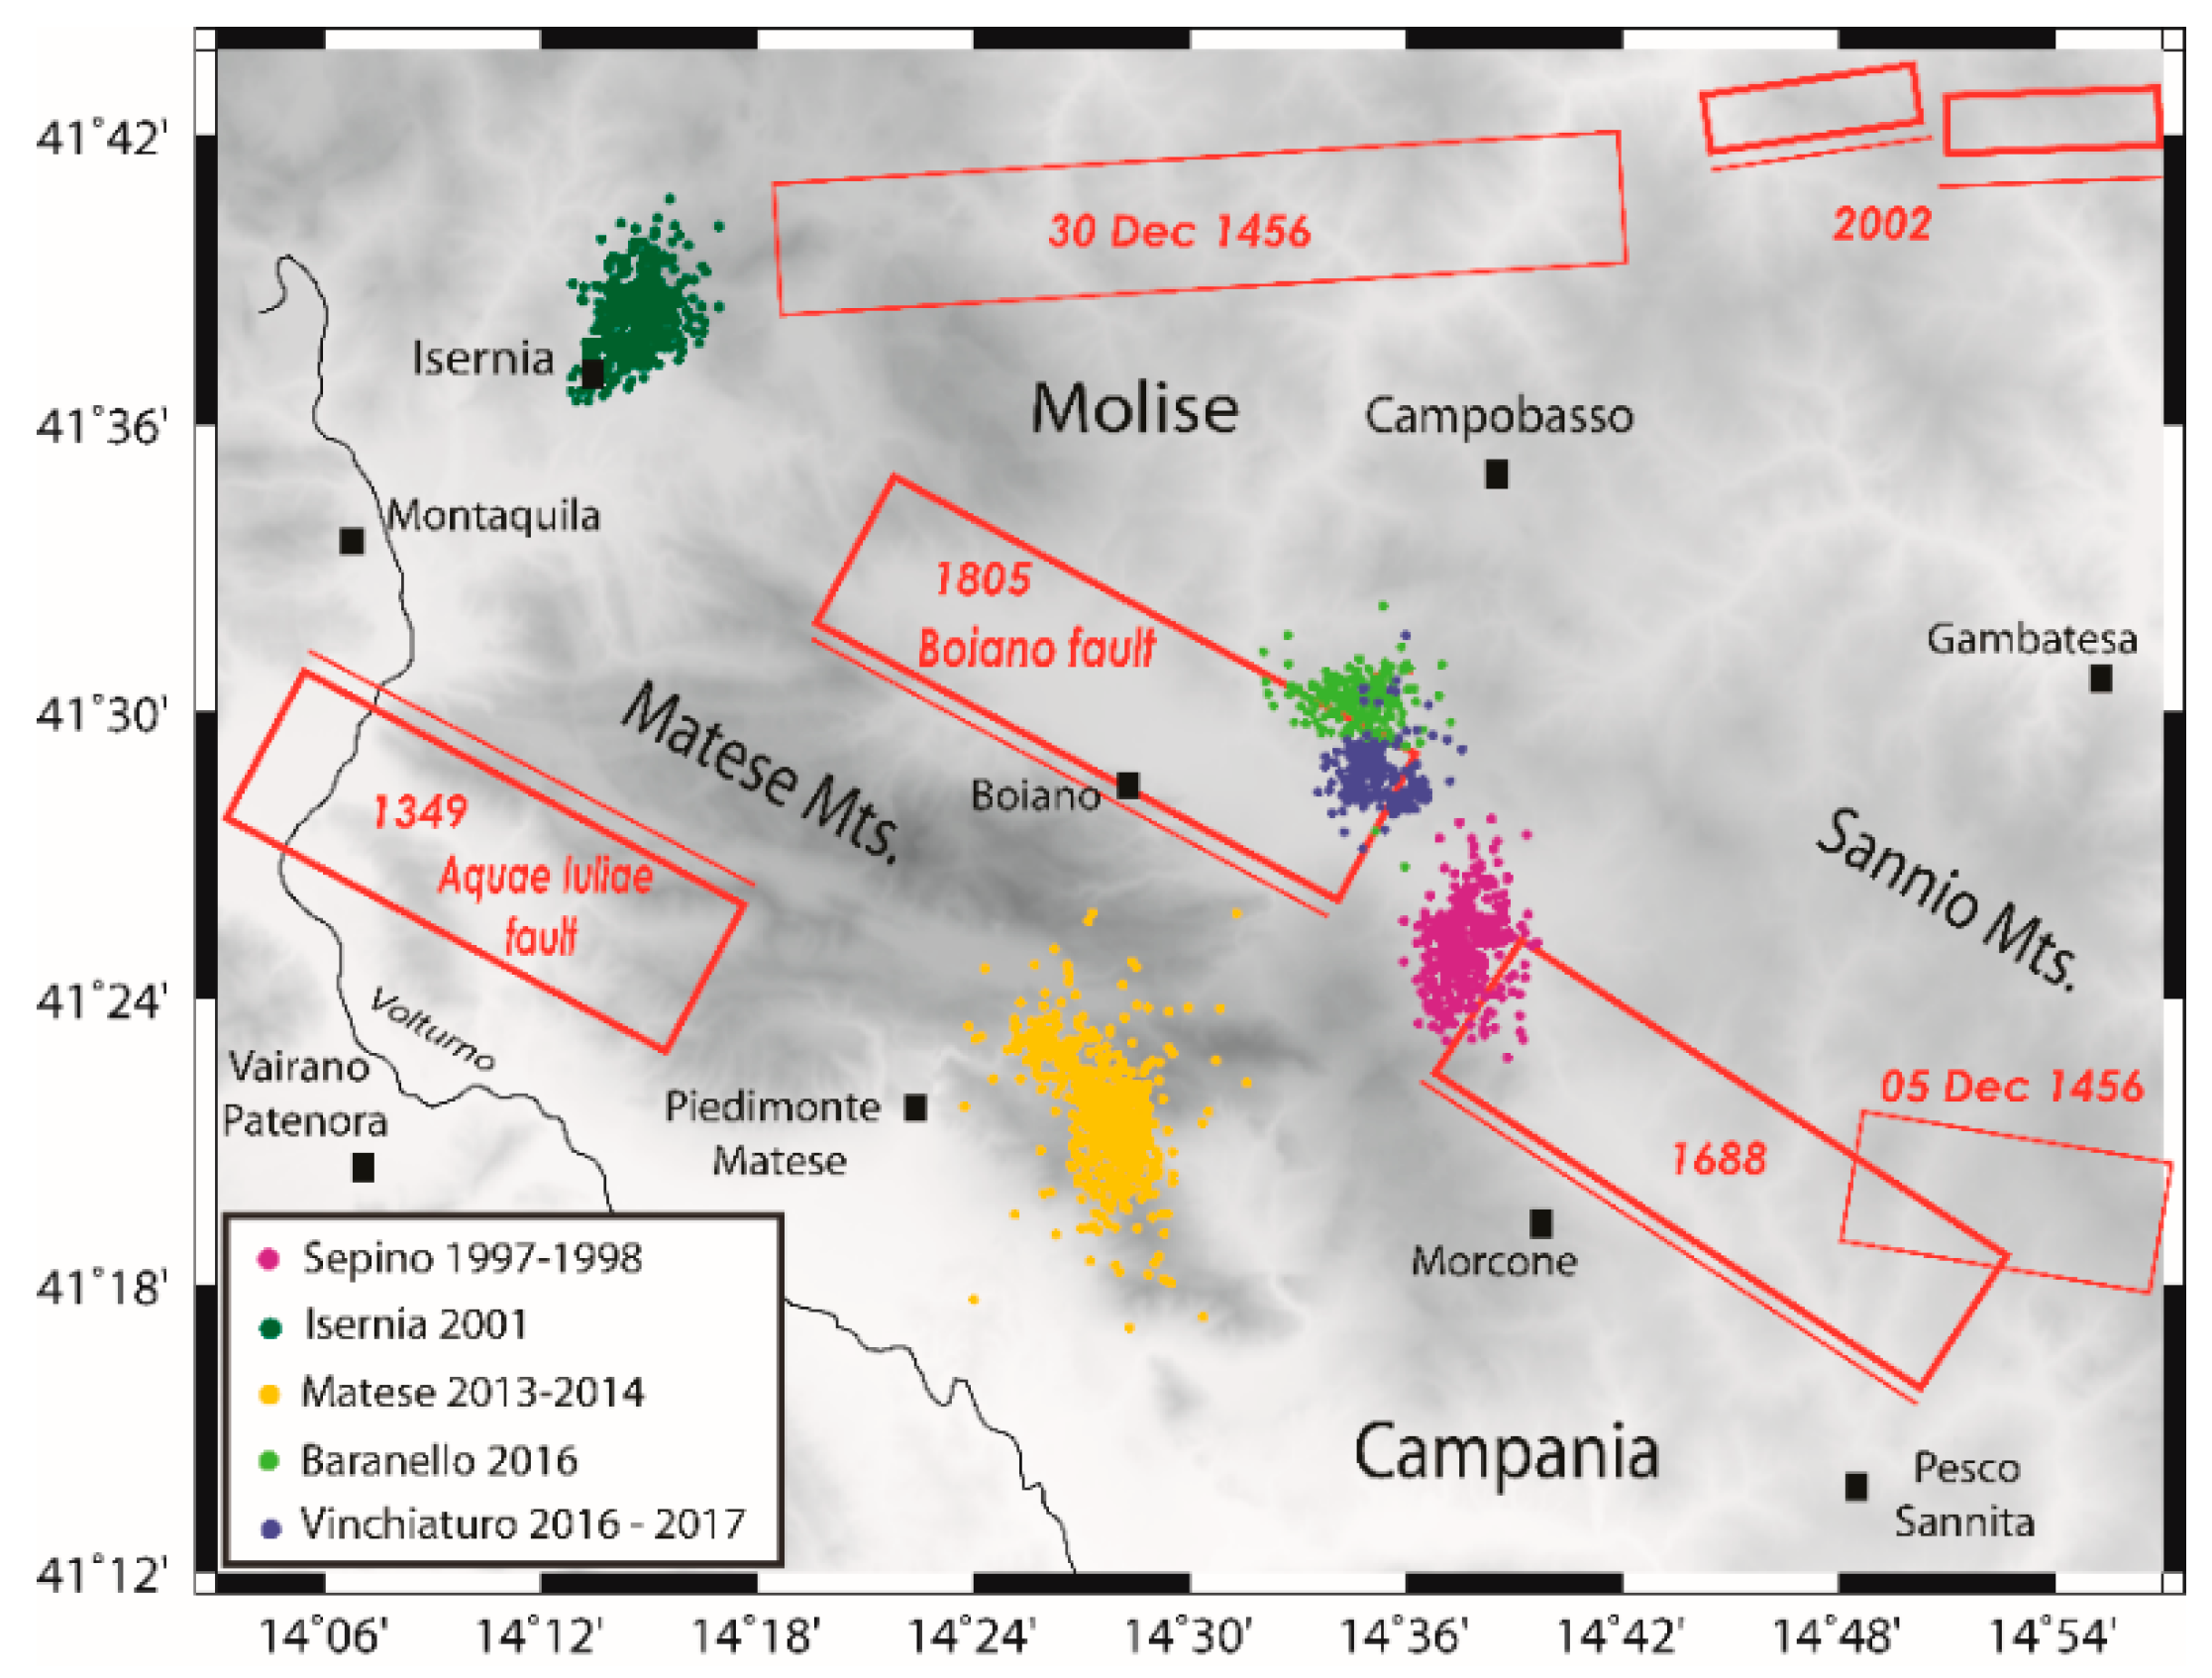
Geologic and Seismotectonic Setting of the MATESE and Beneventano Areas
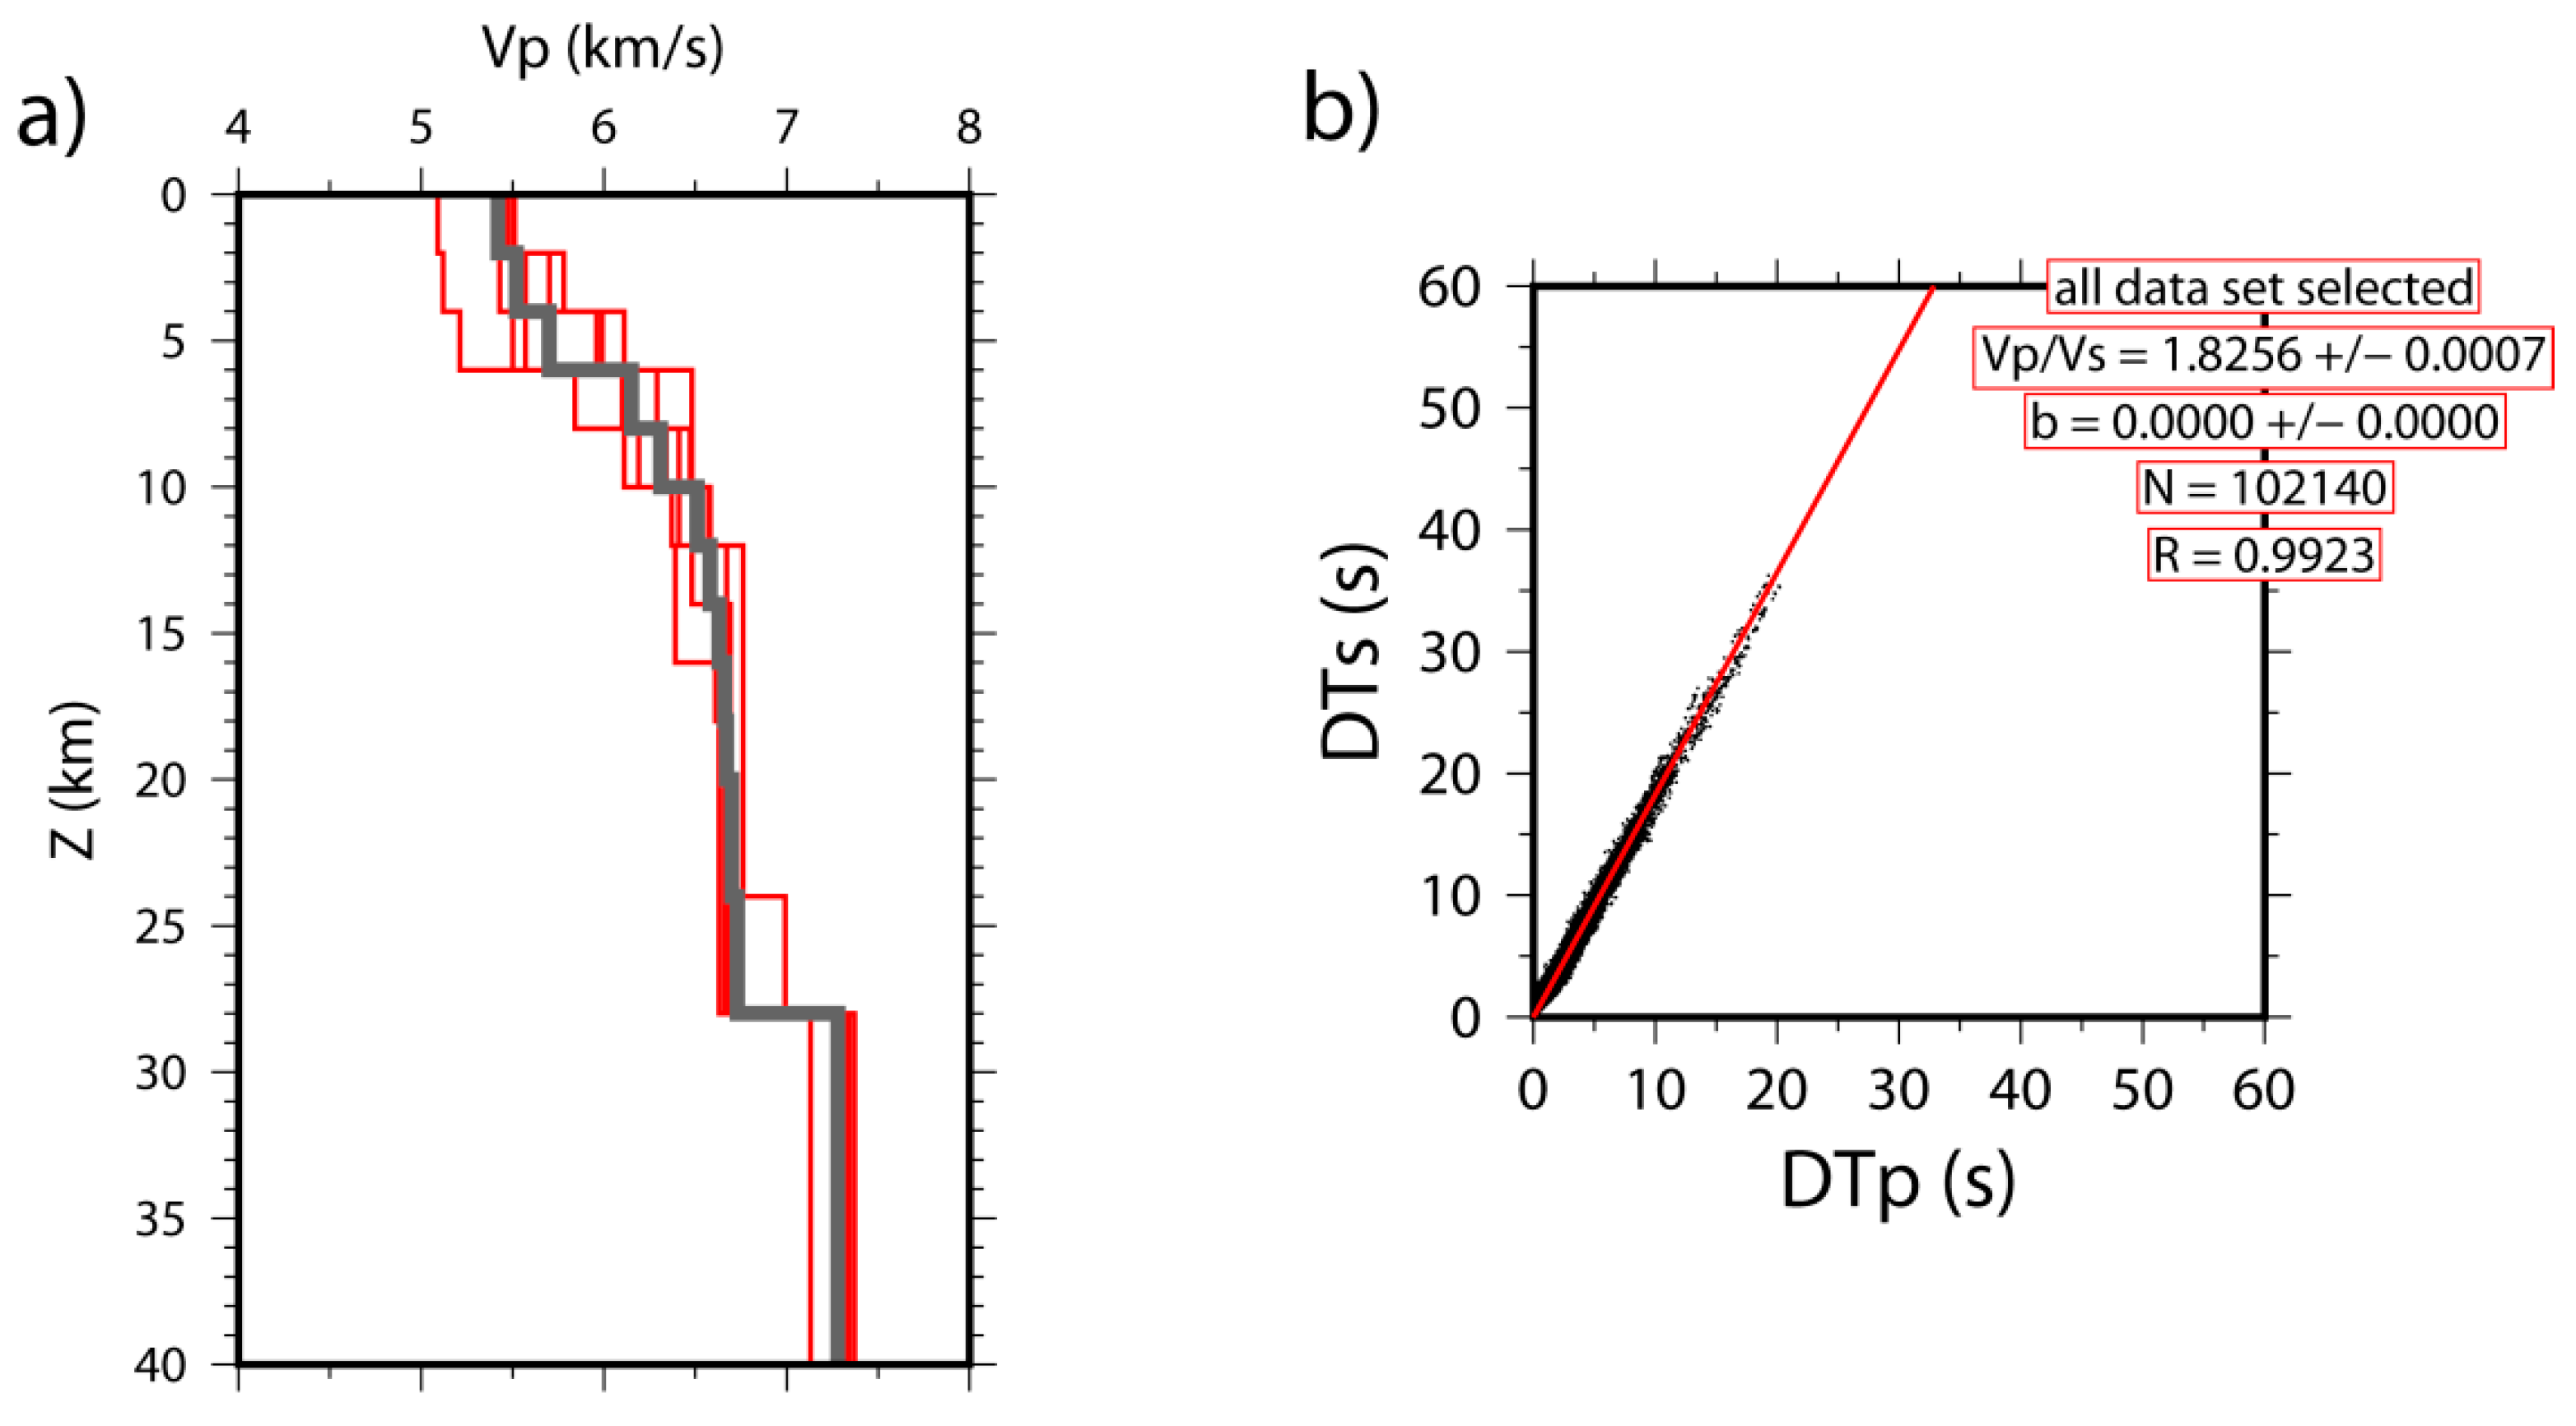
2. Methods
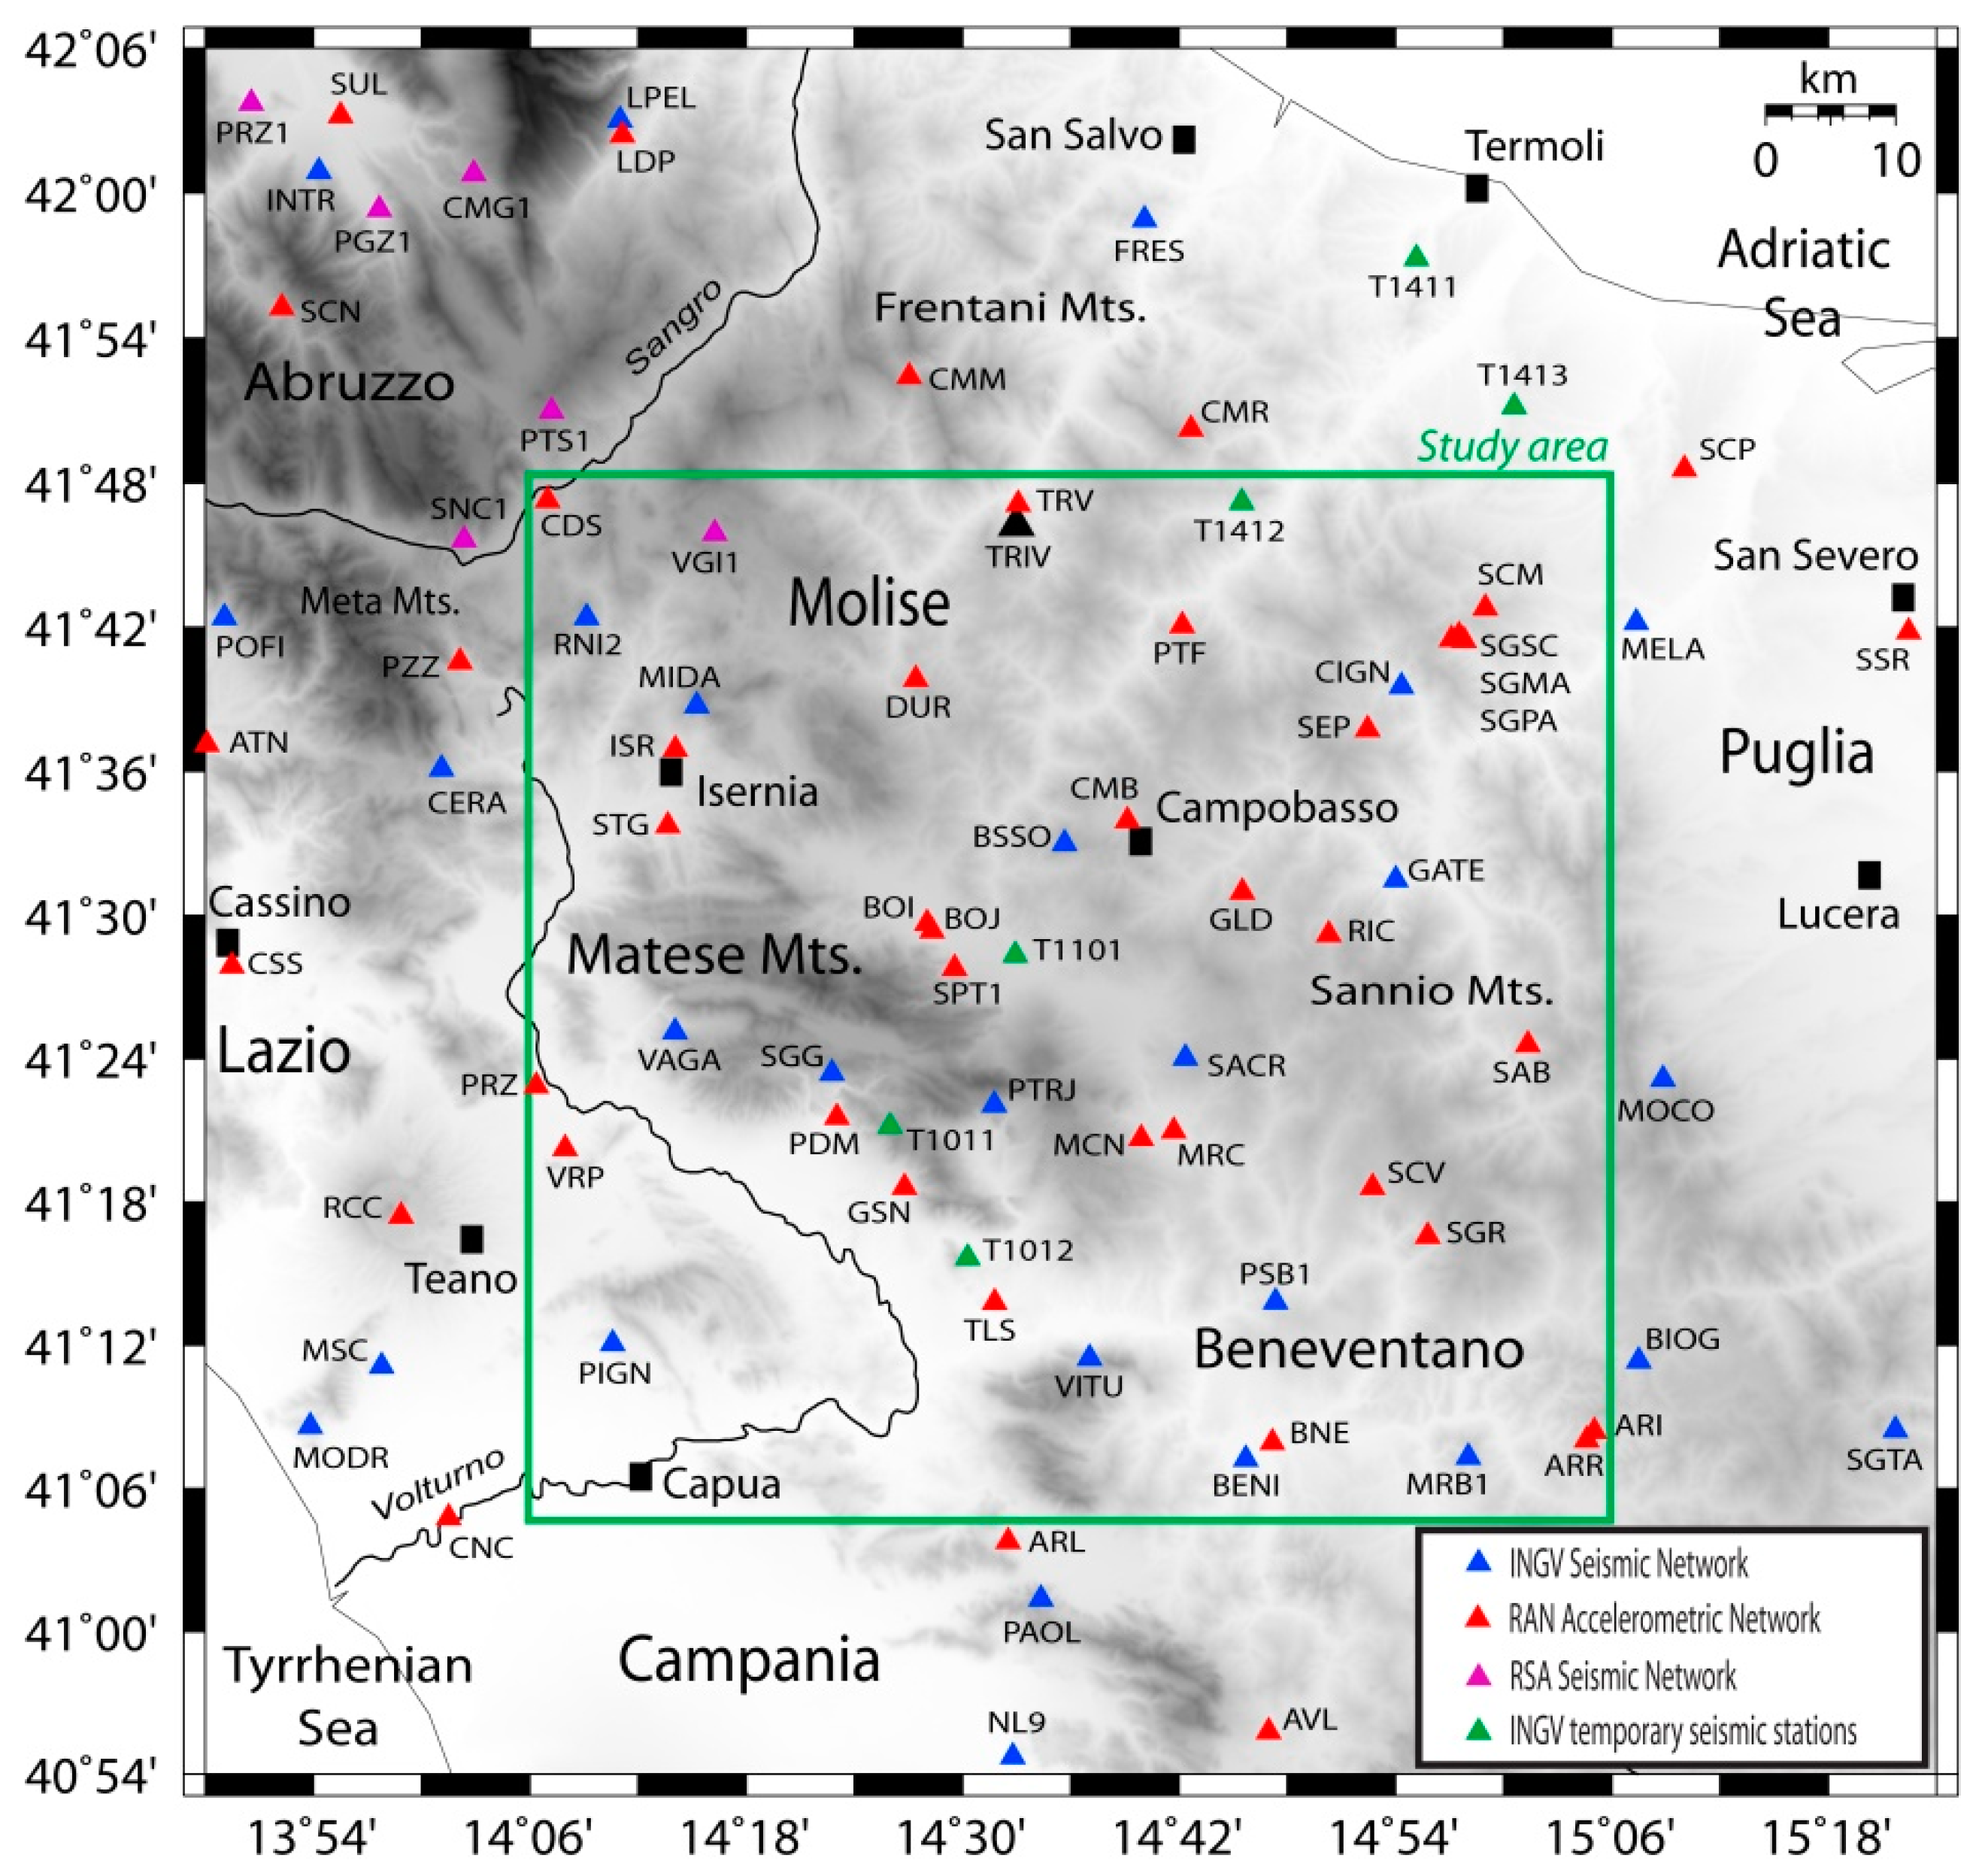
Data Collection and Analysis
3. Results
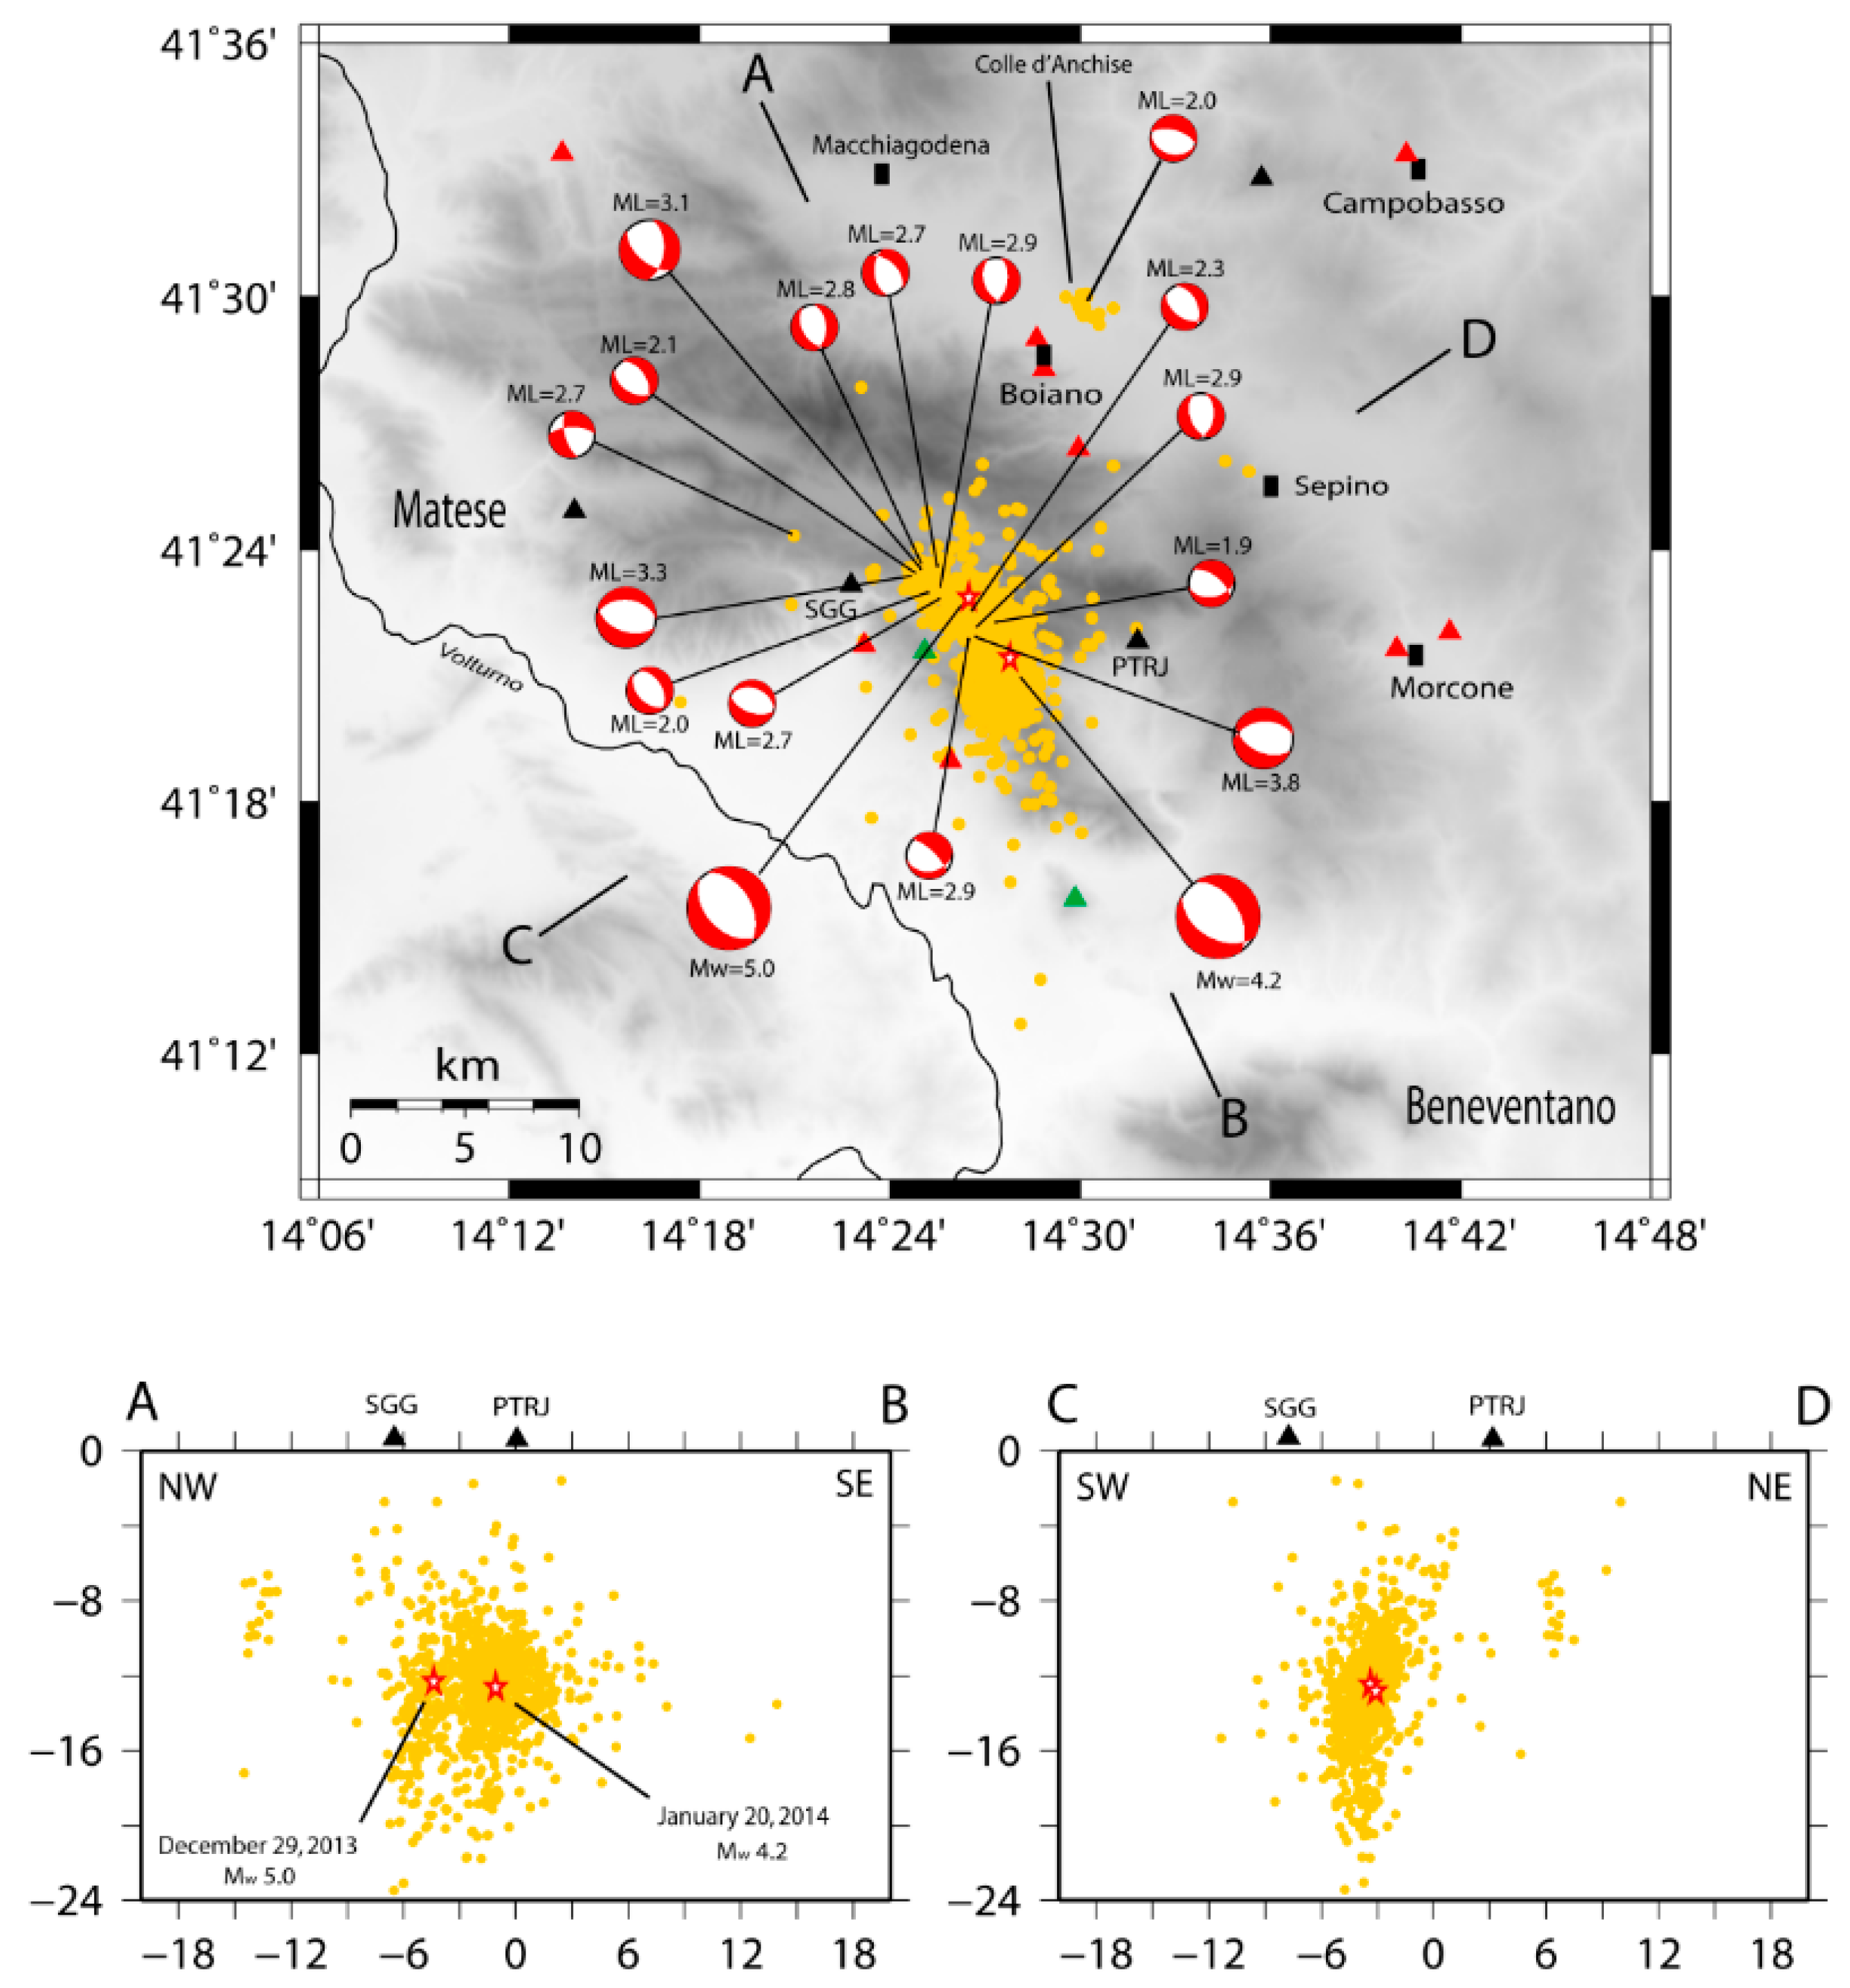
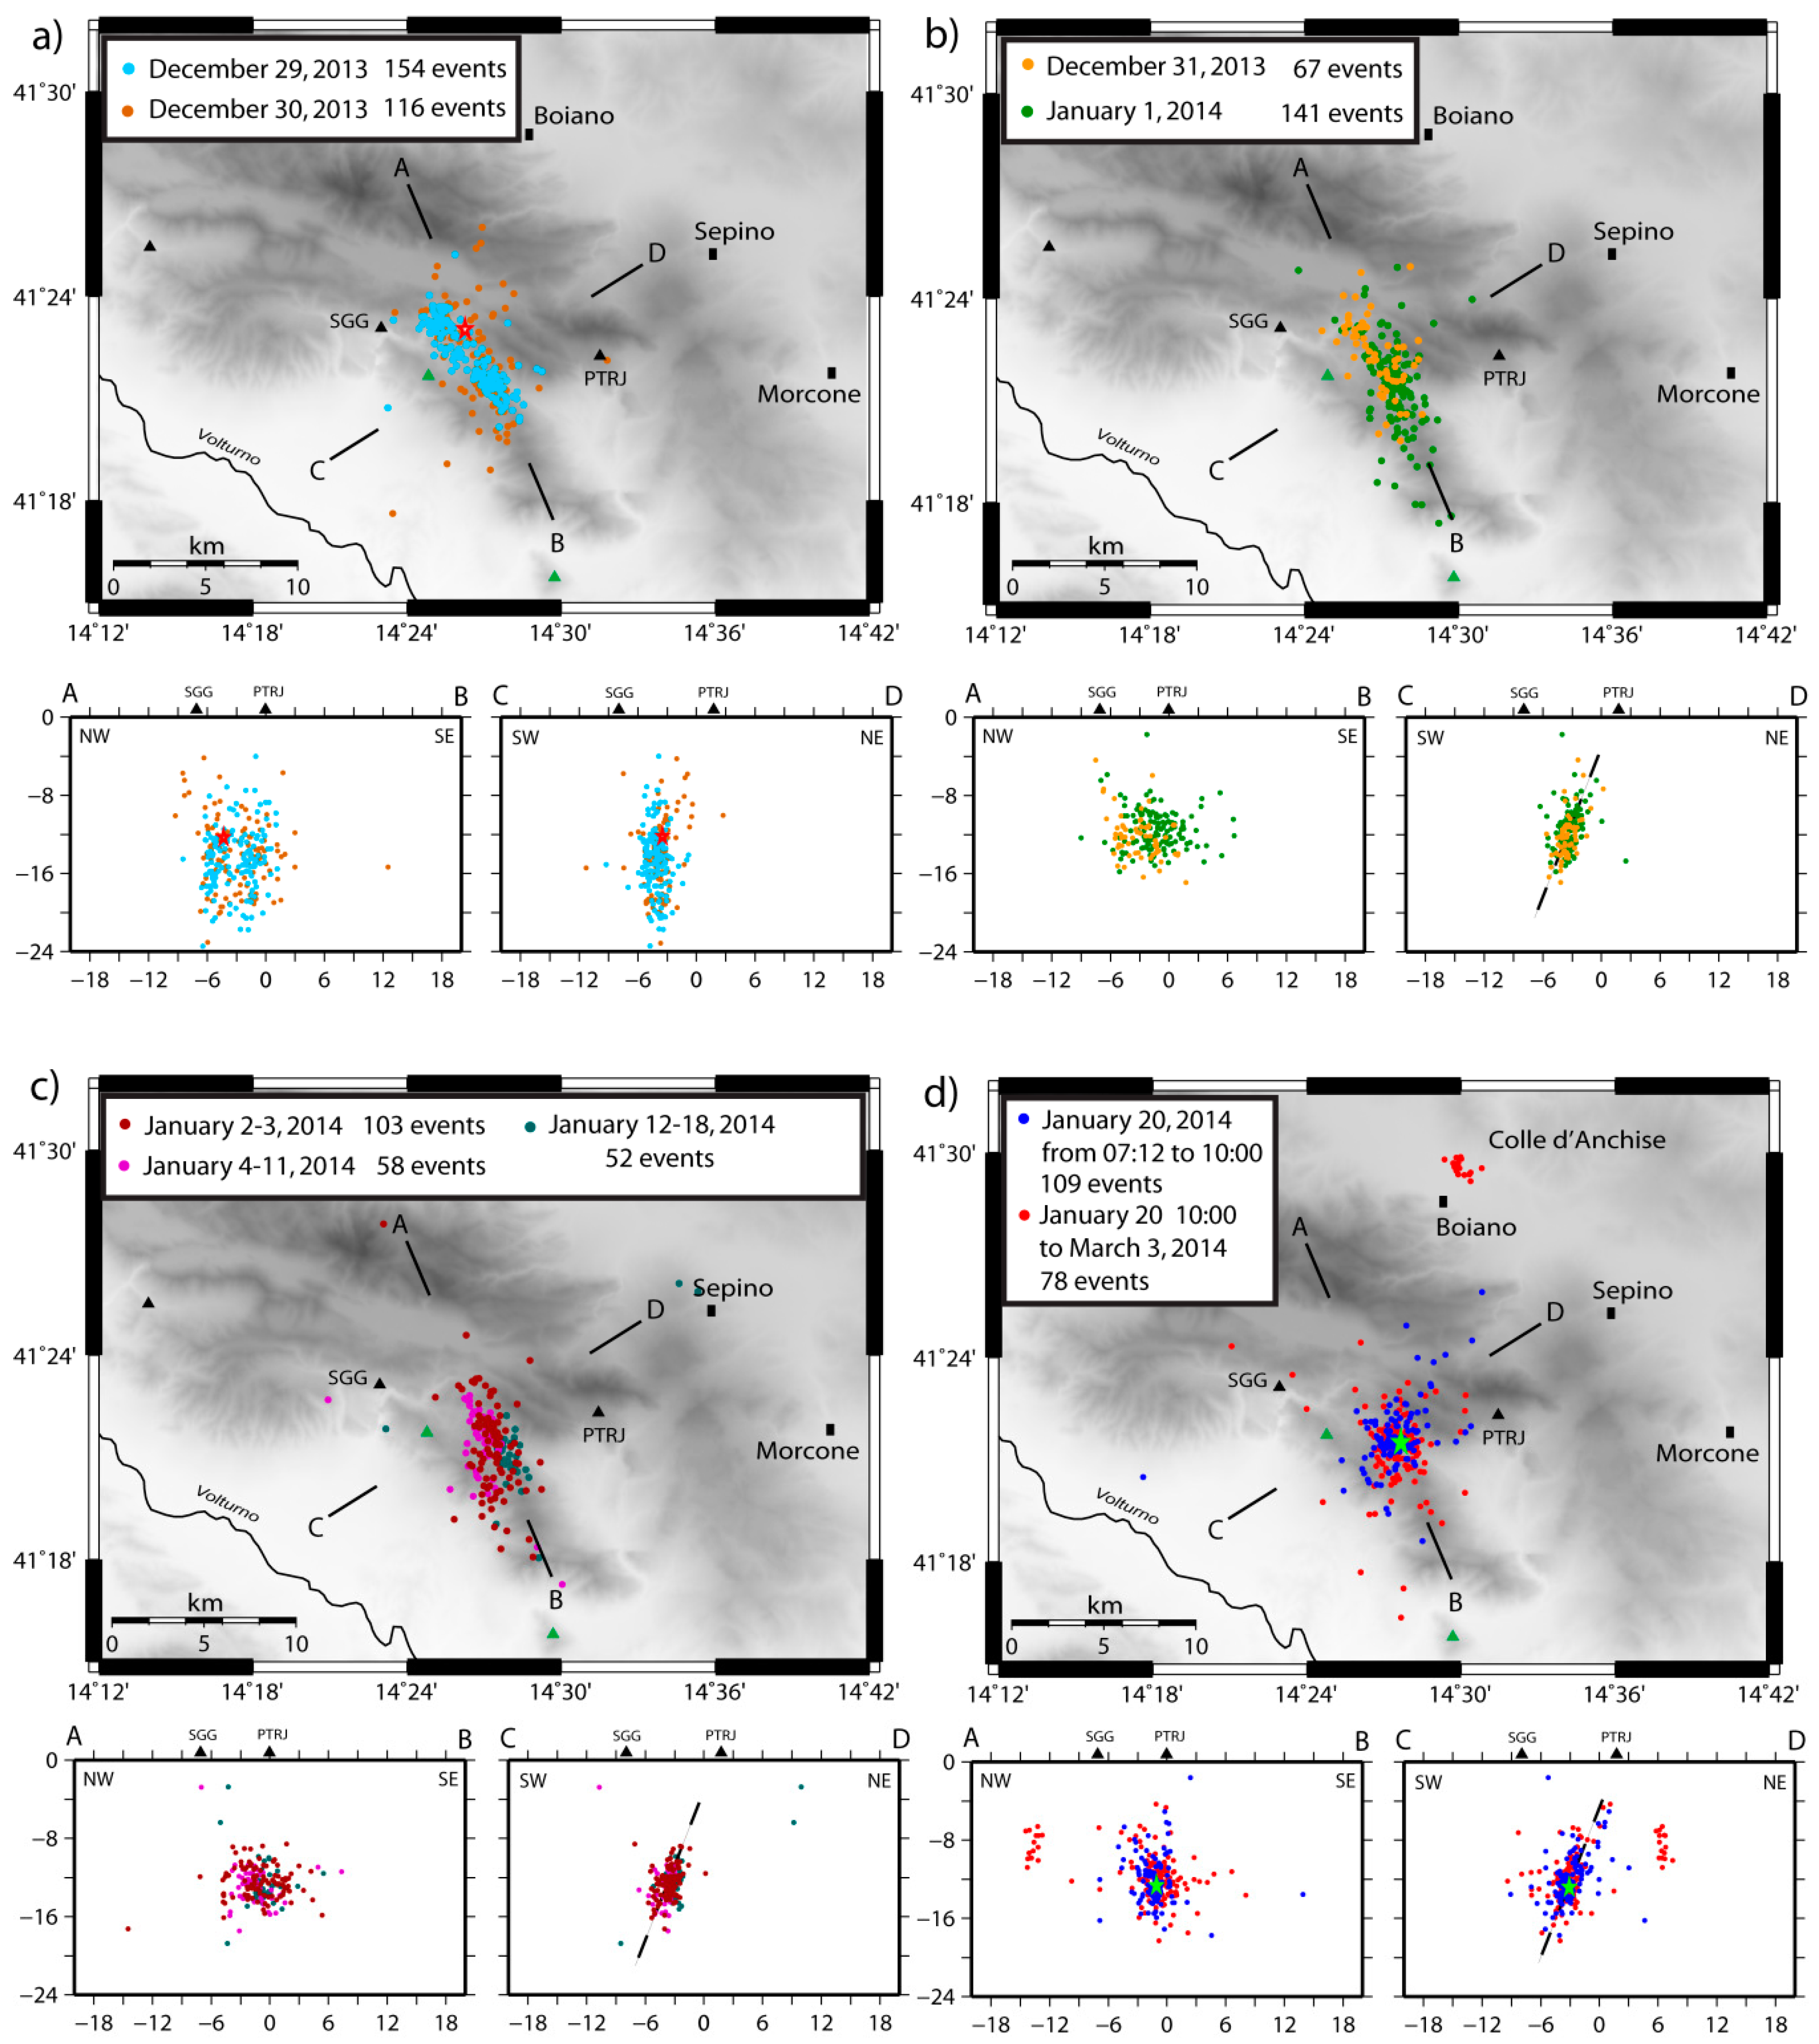
3.1. The Matese Sequence
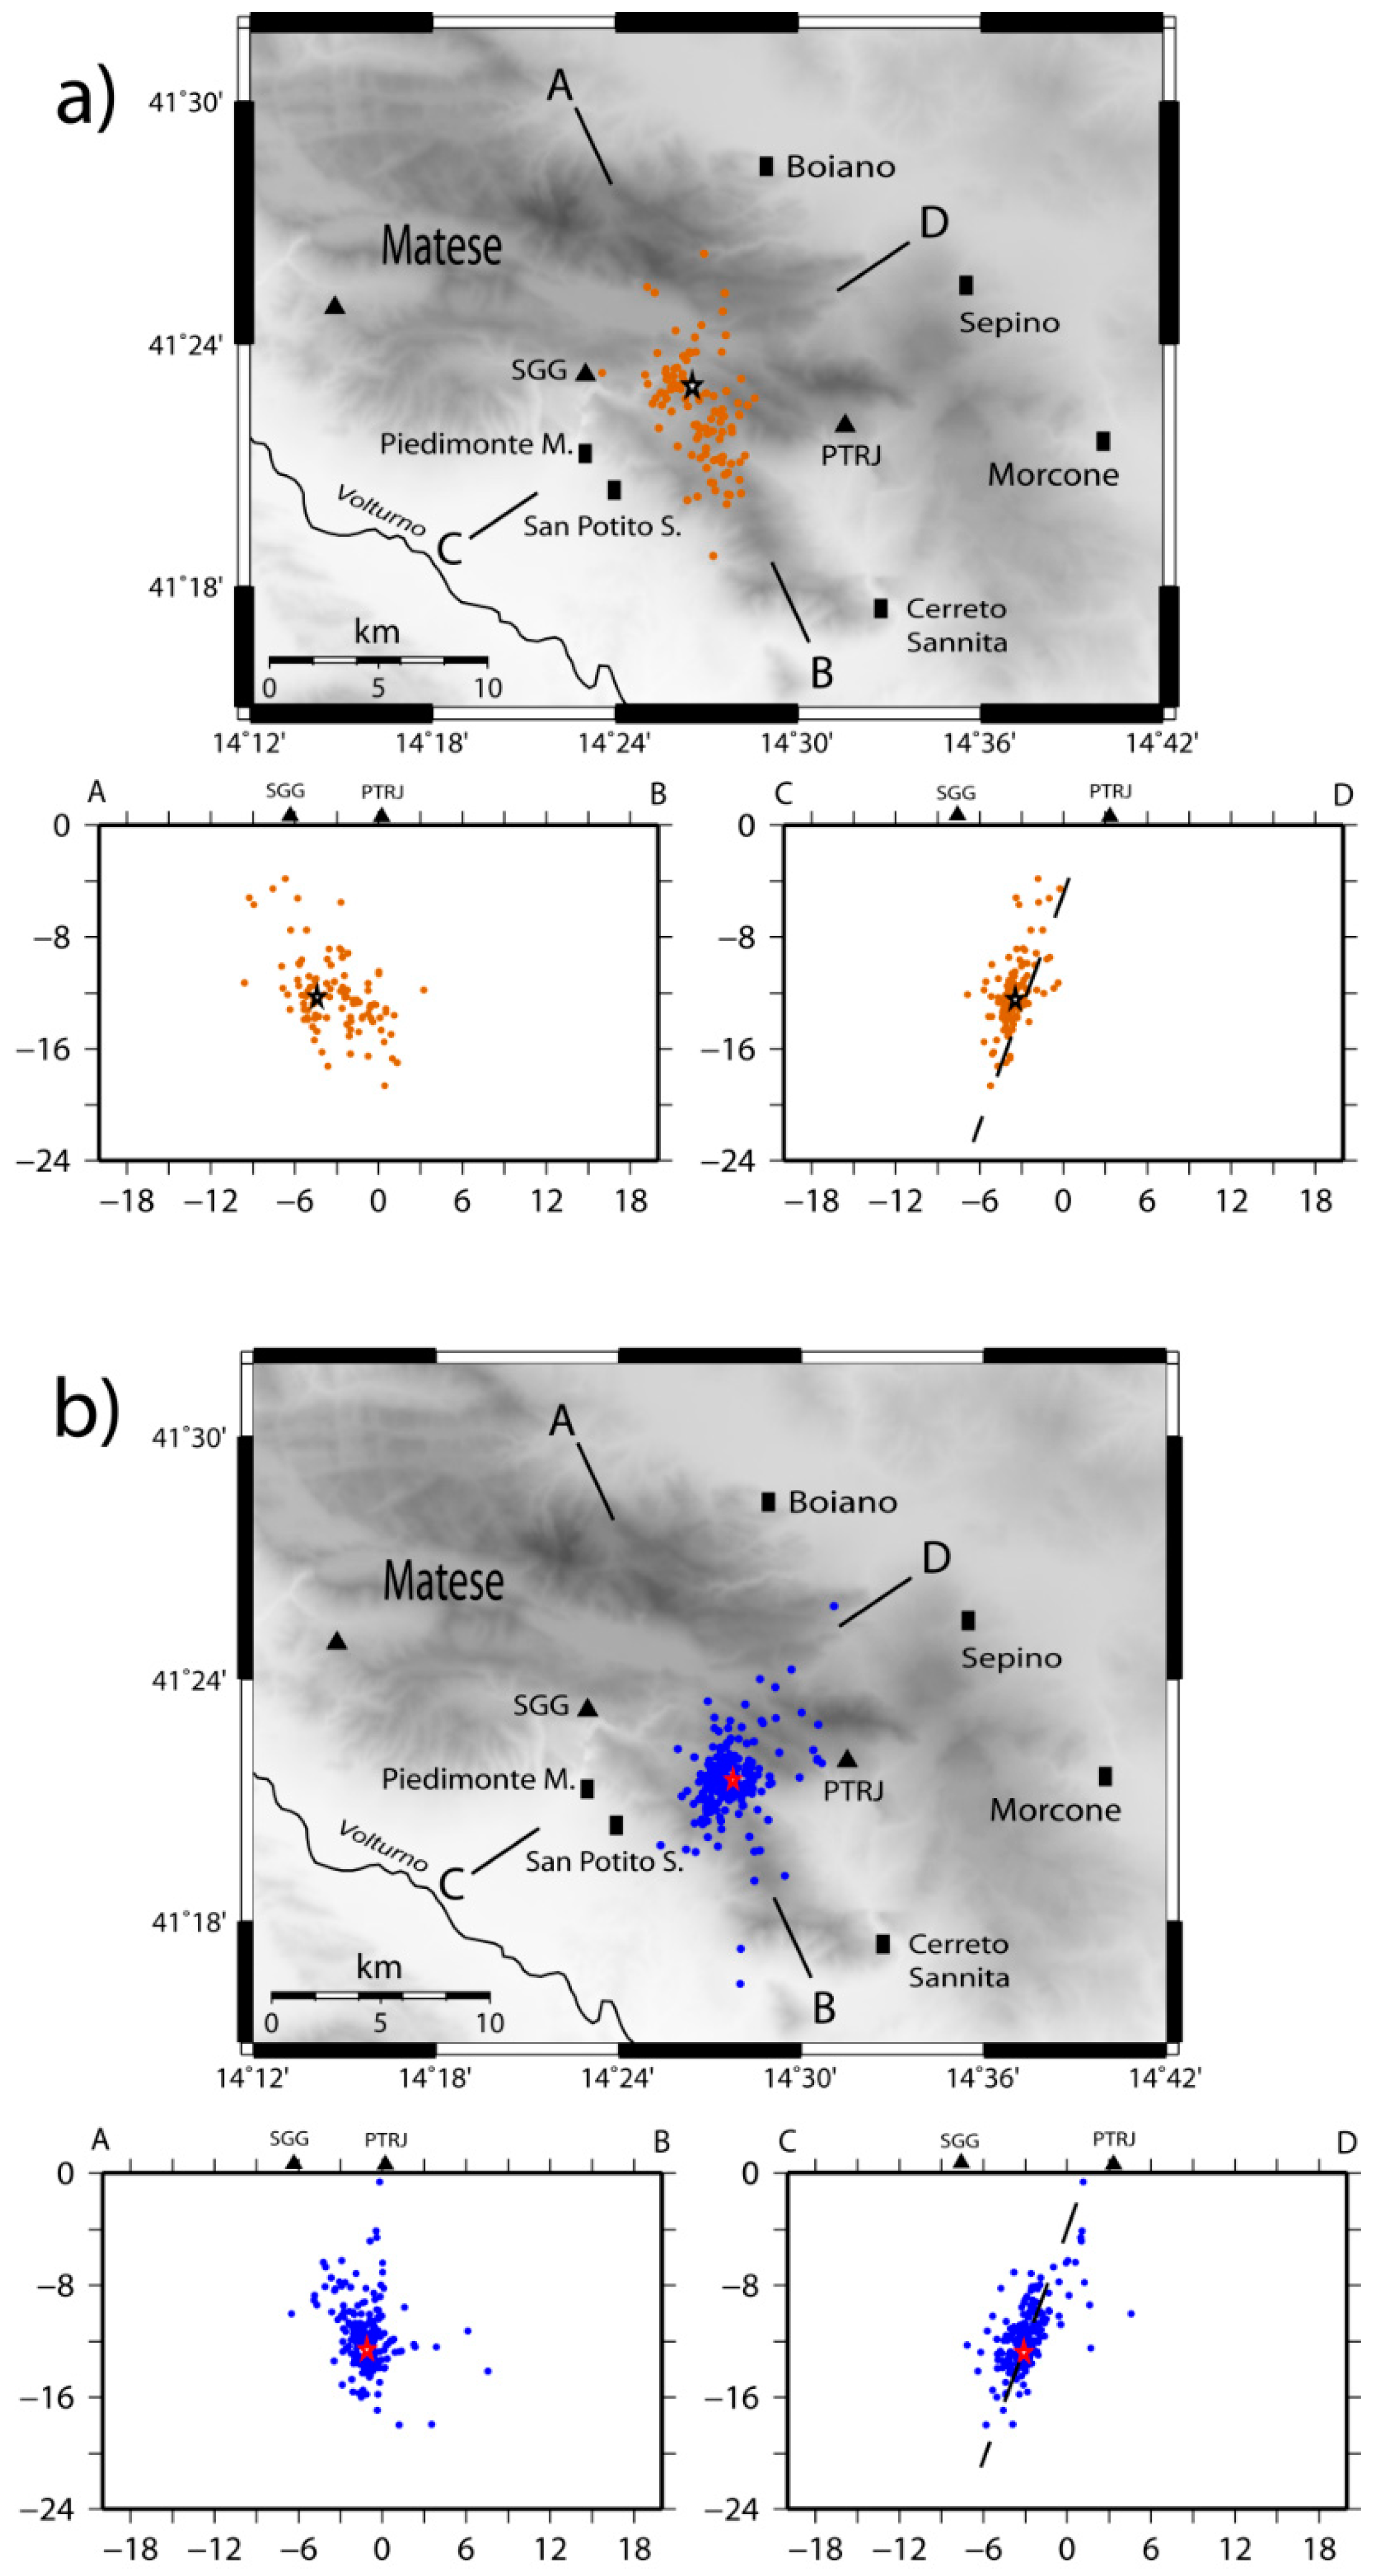
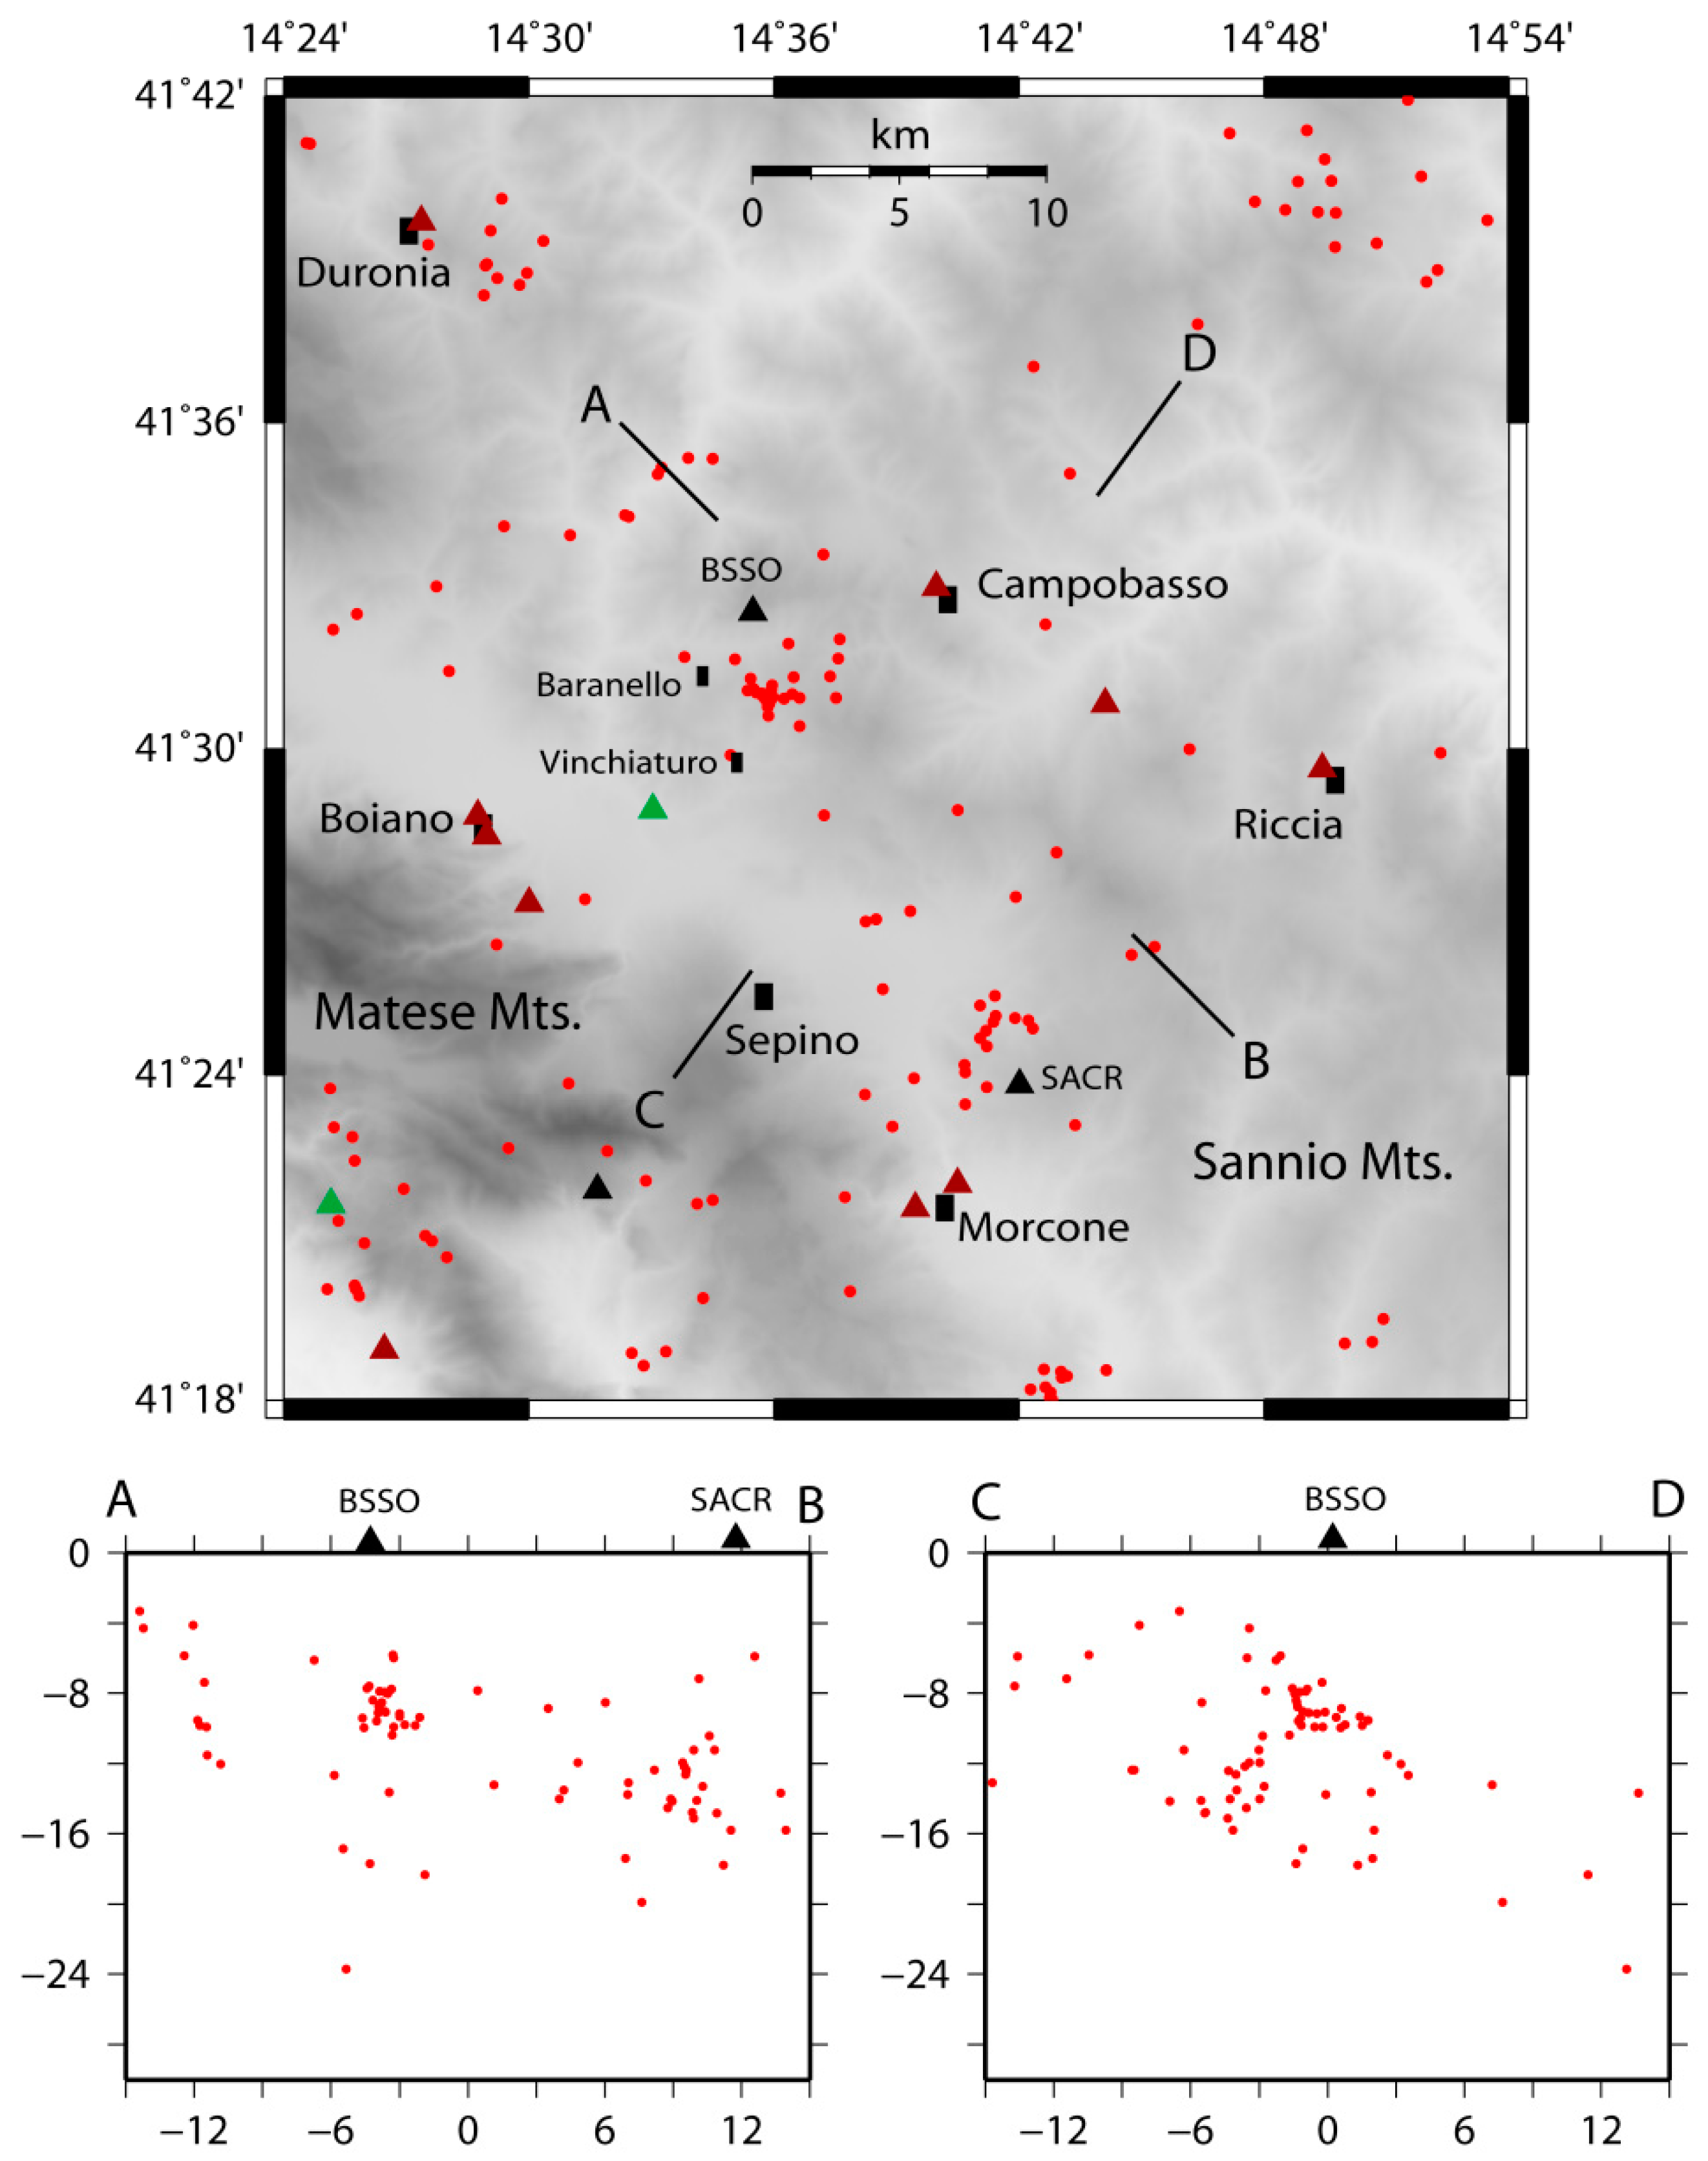
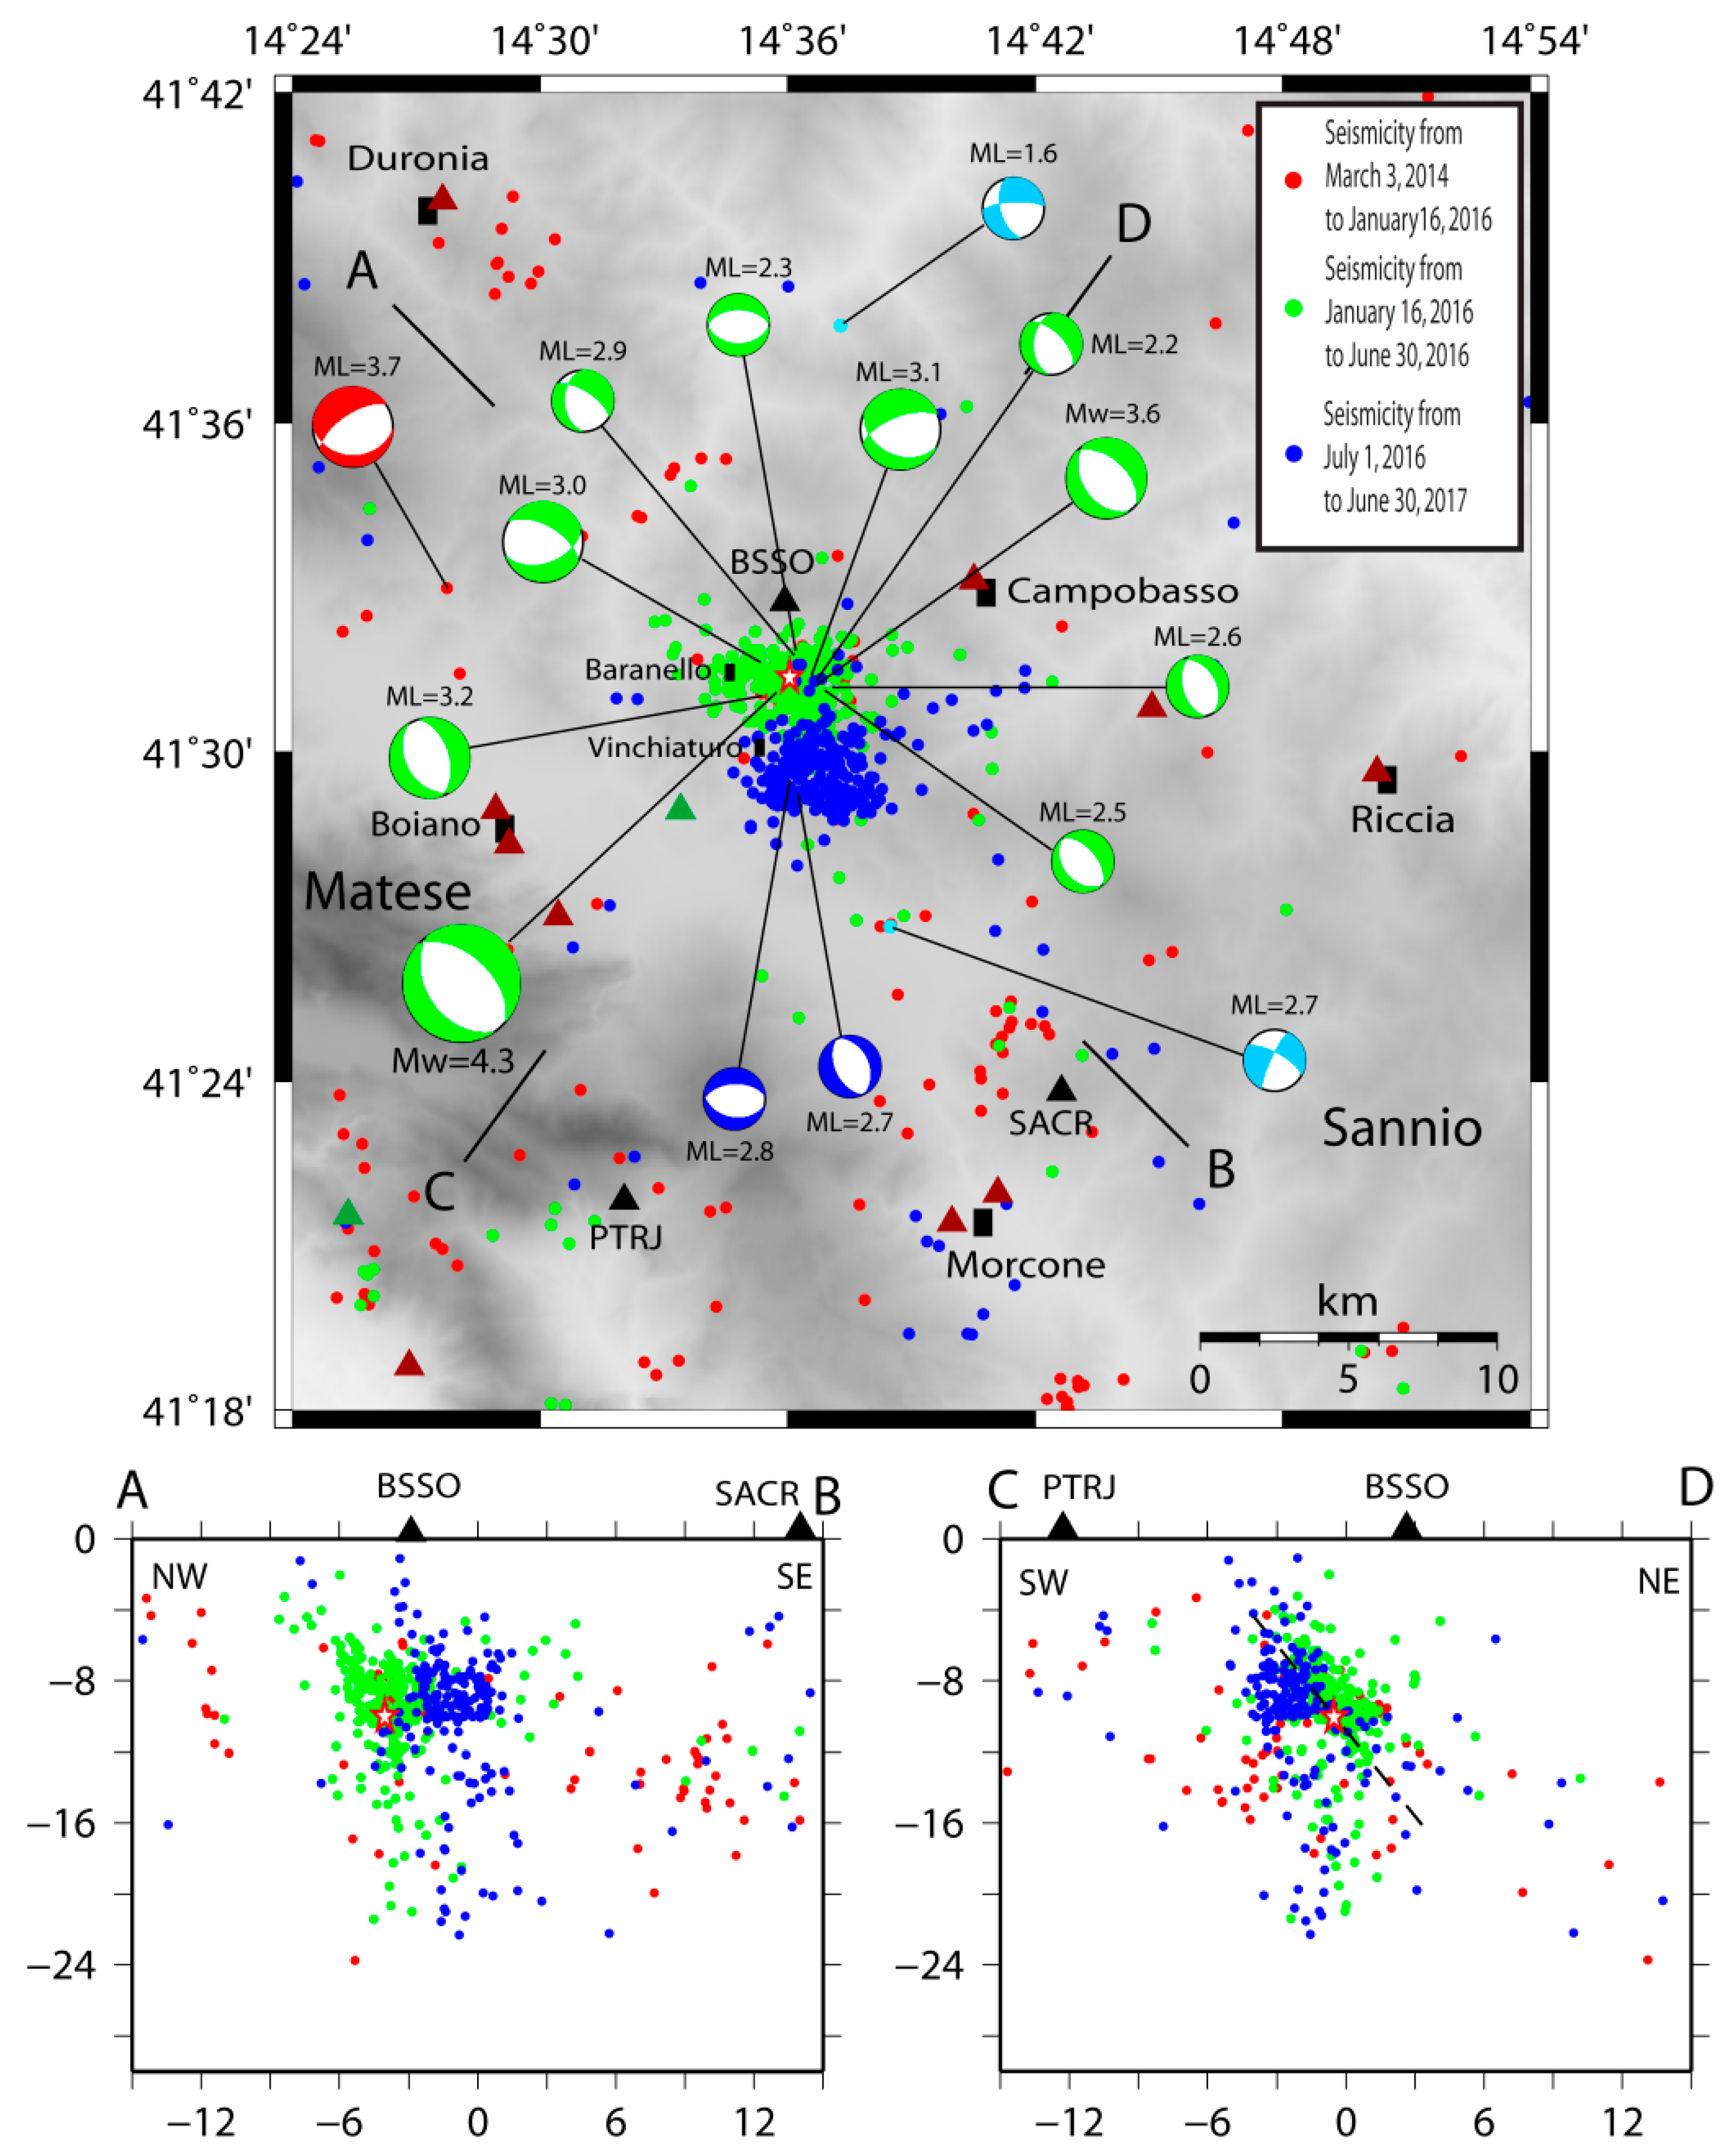
3.2. The Baranello Sequence and the Vinchiaturo Swarm
3.3. The Beneventano and San Marco la Catola Seismicity
4. Discussion
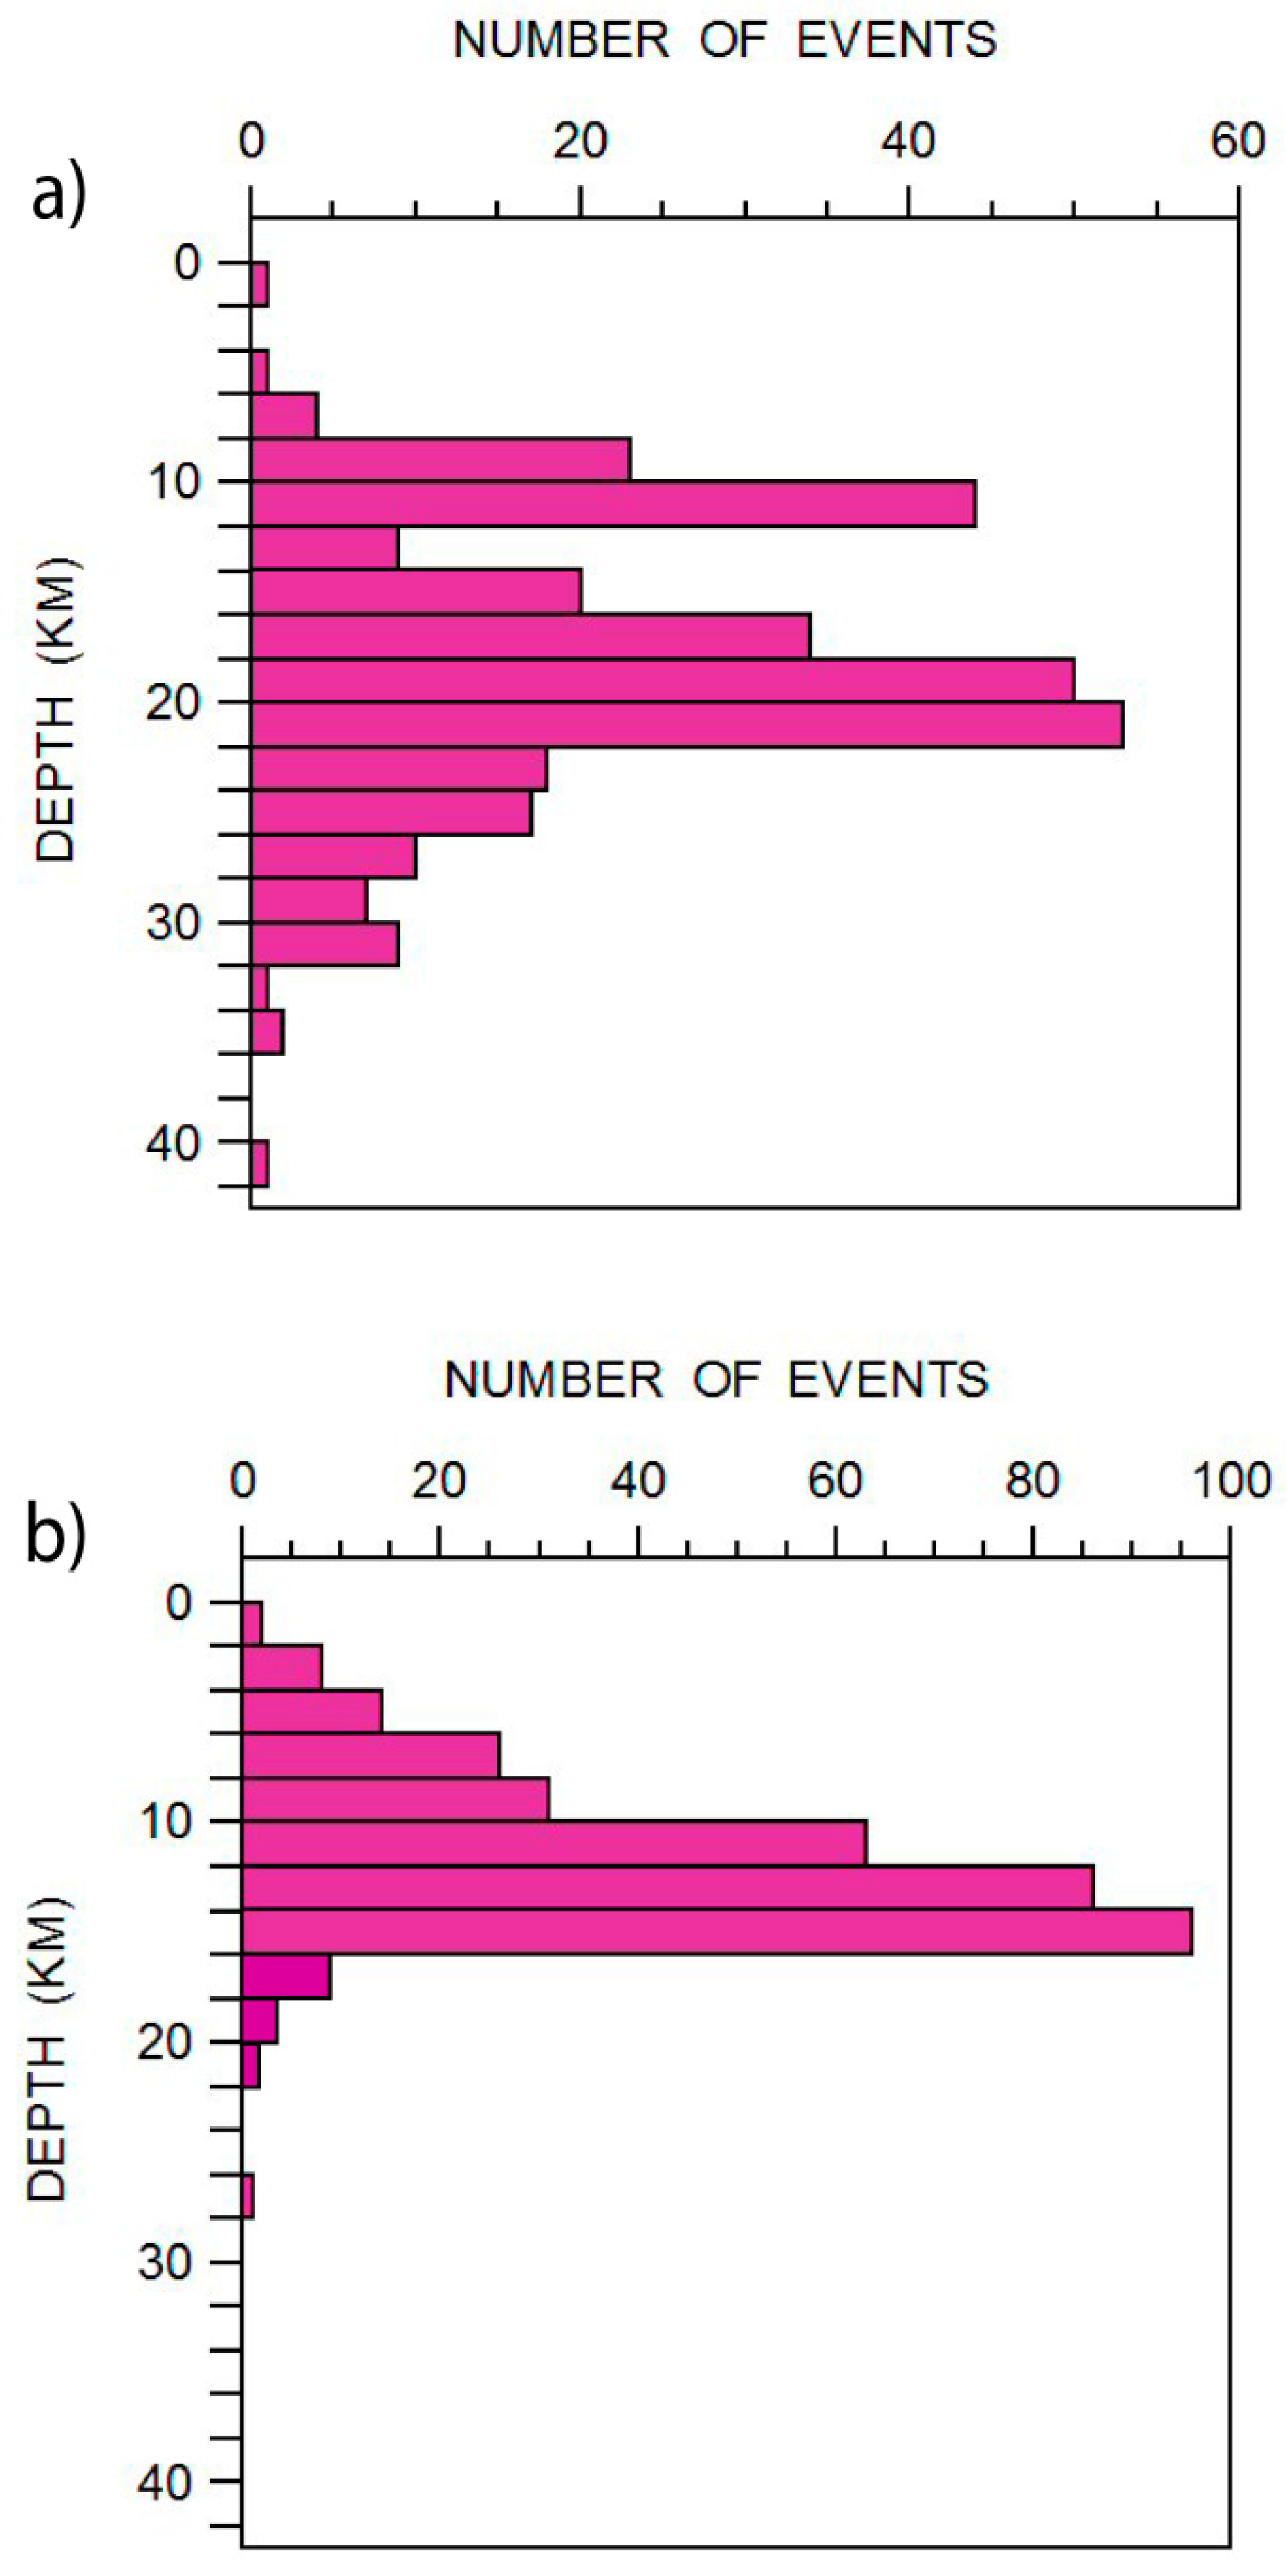
4.1. The Matese Sequence Hypocentral Determination: Seismicity within the Brittle Upper Crust
4.2. The Baranello and Vinchiaturo Seismic Sequences: ANE-Dipping Structure
4.3. San Marco la Catola and Foiano in Val di Fortore Clusters: Evidence of Right-Lateral Strike-Slip Kinematics
5. Conclusions
Author Contributions
Funding
Acknowledgments
Conflicts of Interest
References
- Westaway, R.; Jackson, J.A. The earthquake of 1980 November 23 in Campania-Basilicata (Southern Italy). Geophys. J. R. Astr. Soc. 1987, 90, 375–443. [Google Scholar] [CrossRef]
- Pantosti, D.; Valensise, G. Faulting mechanism and complexity of the November 23, 1980, Campania-Lucania Earthquake, inferred from surface observations. J. Geophys. Res. 1990, 95, 15319–15341. [Google Scholar] [CrossRef]
- Ascione, A.; Mazzoli, S.; Petrosino, P.; Valente, E. A decoupled kinematic model for active normal faults: Insights from the 1980, Ms = 6.9 Irpinia earthquake, southern Italy. GSA Bull. 2013, 125, 1239–1259. [Google Scholar] [CrossRef]
- Boschi, E.; Pantosti, D.; Slejko, D.; Stucchi, M.; Valensise, G. Special Issue on the Meeting “Irpinia Dieci Anni Dopo”; Istituto nazionale di geofisica: Sorrento, Italy, 19–24 November 1990. [Google Scholar]
- Esposito, E.; Luongo, G.; Marturano, A.; Porfido, S. Il terremoto di S. Anna del 26 luglio 1805. Mem. Soc. Geol. Ital. 1987, 37, 171–191. [Google Scholar]
- Cucci, L.; D’Addezio, G.; Valensise, G.; Burrato, P. Investigating seismogenic faults in Central and Southern Apennines (Italy): Modeling of fault-related landscape features. Ann. Geophys. 1996, 39, 603–618. [Google Scholar]
- DISS Working Group. Database of Individual Seismogenic Sources (DISS), Version 3.1.1: A Compilation of Potential Sources for Earthquakes Larger than M 5.5 in Italy and Surrounding Areas. Ist. Naz. Geofis. Vulc. 2010. [Google Scholar] [CrossRef]
- Petricca, P.; Barba, S.; Carminati, E.; Doglioni, C.; Riguzzi, F. Graviquakes in Italy. Tectonophysics 2015, 656, 202–214. [Google Scholar] [CrossRef]
- Frepoli, A.; Cimini, G.B.; De Gori, P.; De Luca, G.; Marchetti, A.; Monna, S.; Montuori, C.; Pagliuca, N.M. Seismic sequences and swarms in the Latium-Abruzzo-Molise Apennines (Central Italy): New observations and analysis from a dense monitoring of the recent activity. Tectonophysics 2017, 712–713, 312–329. [Google Scholar] [CrossRef]
- Galli, P.; Naso, J.A. Unmasking the 1349 earthquake source (southern Italy): Paleoseismological and archeoseismological indications from the AcquaeIuliae fault. J. Struct. Geol. 2009, 31, 128–149. [Google Scholar] [CrossRef]
- D’Agostino, N.; Avallone, A.; Cheloni, D.; D’Anastasio, E.; Mantenuto, S.; Selvaggi, G. Active tectonics of the Adriatic region from GPS and earthquake slip vectors. J. Geophys. Res. 2008, 113, B12413. [Google Scholar] [CrossRef]
- D’Agostino, N. Complete seismic release of tectonic strain and earthquake recurrence in the Apennines (Italy). Geophys. Res. Lett. 2014, 41, 1155–1162. [Google Scholar] [CrossRef]
- Palano, M. On the present-day crustal stress, strain-rate fields and mantle anisotropy pattern of Italy. Geophys. J. Int. 2015, 200, 969–985. [Google Scholar] [CrossRef]
- Devoti, R.; D’Agostino, N.; Serpelloni, E.; Pietrantonio, G.; Riguzzi, F.; Avallone, A.; Cavaliere, A.; Cheloni, D.; Cecere, G.; D’Ambrosio, C.; et al. A combined velocity field of the Mediterranean region. Ann. Geophys. 2017, 60. [Google Scholar] [CrossRef]
- Patacca, E.; Scandone, P. Post-Tortonian mountain building in the Apennines: The role of the passive sinking of a relic lithospheric slab. In The Lithosphere in Italy, 80, Atti Conv. Lincei; Boriano, A., Bonafede, M., Piccardo, G.B., Vai, G.B., Eds.; AccademiaNazionaledeiLincei: Rome, Italy, 1989; pp. 157–176. [Google Scholar]
- Patacca, E.; Sartori, R.; Scandone, P. Tyrrhenian Basin and Apenninic Arcs: Kinematics relations since late Tortonian times. Mem. Soc. Geol. Ital. 1990, 45, 425–451. [Google Scholar]
- Cinque, A.; Patacca, E.; Scandone, P.; Tozzi, M. Quaternary kinematic evolution of the Southern Apennines. Relationships between surface geological features and deep lithospheric structures. Annali di Geofisica 1993, 36, 249–260. [Google Scholar]
- Doglioni, C.; Carminati, E.; Cuffaro, M.; Scrocca, D. Subduction kinematics and dynamic constraints. Earth Sci. Rev. 2007, 83, 125–175. [Google Scholar] [CrossRef]
- Devoti, C.; Riguzzi, F.; Cuffaro, M.; Doglioni, C. New GPS constraints on the kinematics of the Apennines subduction. Earth Planet. Sci. Lett. 2008, 273, 163–174. [Google Scholar] [CrossRef]
- Doglioni, C.; Harabaglia, P.; Martinelli, G.; Mongelli, F.; Zito, G. A geodynamic model of the Southern Apennines accretionary prism. Terra Nova 1996, 8, 540–547. [Google Scholar] [CrossRef]
- Ferranti, L.; Palano, M.; Cannavò, F.; Mazzella, M.E.; Oldow, J.S.; Gueguen, E.; Mattia, M.; Monaco, C. Rates of geodetic deformation across active faults in southern Italy. Tectonophysics 2014, 621, 101–122. [Google Scholar] [CrossRef]
- Ferranti, L. Tettonica tardo Pliocenica-Quaternaria dei Monti del Matese (Appennino Meridionale): Raccorciamenti tardivi e distensione “neotettonica”. Il Quat. 1997, 10, 501–504. [Google Scholar]
- Calabrò, R.A.; Corrado, S.; Di Bucci, D.; Robustini, P.; Tornaghi, M. Tornaghi Thin-skinned vs. tick-skinned tectonics in the Matese massif, Central-Southern Apennines (Italy). Tectonophysics 2003, 377, 269–297. [Google Scholar] [CrossRef]
- Brozzetti, F. The Campania-Lucania Extensional Fault System, southern Italy: A suggestion for a uniform model of active extension in the Italian Apennines. Tectonics 2011, 30, TC5009. [Google Scholar] [CrossRef]
- Della Vedova, B.; Bellani, S.; Pellis, G.; Squarci, P. Deep temperatures and surface heat flow distribution. In Anatomy of an Orogen: The Apennines and Adjacent Mediterranean Basins; Springer: Dordrecht, The Netherlands, 2001; pp. 65–76. [Google Scholar]
- D’Argenio, B.; Pescatore, T.; Scandone, P. Schema geologico dell’Appennino meridionale (Campania e Lucania): Convegno Moderne vedute sulla geologia dell’Appennino. Atti Accad. Lincei 1973, 183, 49–72. [Google Scholar]
- Guerrieri, L.; Scarascia, G.; Vittori, E. Analisi stratigrafica e geomorfologica della conoide tardoquaternaria di Campochiaro ed implicazioni per la conca di Bolano in Molise. Il Quat. 1999, 12, 237–247. [Google Scholar]
- Patacca, E.; Scandone, P. Geological interpretation of the CROP04 seismic line (southern Apennines, Italy). Boll. Soc. Geol. Ital. 2007, 7, 297–315. [Google Scholar]
- Nappi, R.; Alessio, G. Integrated morphometric analysis in GIS environment applied to active tectonic areas. In Earthquake Research and Analysis–Seismology, Seismotectonic and Earthquake Geology; IntechOpen: London, UK, 2012; ISBN 978-953-307-991-2. [Google Scholar]
- Gaudiosi, G.; Nappi, R.; Alessio, G.; Porfido, S.; Cella, F.; Fedi, M.; Florio, G. Integrated analysis of seismological, gravimetric and structural data for identification of active faults geometries in Abruzzo and Molise areas (Italy). Geophy. Res. Abstr. 2015, 17, 13920. [Google Scholar]
- Rovida, A.; Locati, M.; Camassi, R.; Lolli, B.; Gasperini, P. (Eds.) CPTI15, the 2015 Version of the Parametric Catalogue of Italian Earthquakes; Istituto Nazionale di Geofisica e Vulcanologia (INGV): Roma, Italy, 2016; Available online: http://emidius.mi.ingv.it/CPTI) (accessed on 30 December 2019).
- Castello, B.; Selvaggi, G.; Chiarabba, C.; Amato, A. CSI Catalogo della Sismicità Italiana 1981–2002, version 1.1; INGV, Centro Nazionale Terremoti: Rome, Italy, 2006. [Google Scholar]
- Valensise, G.; Pantosti, D.; Basili, R. Seismology and tectonic setting of the 2002 Molise, Italy, earthquake. Earthq. Spectra 2004, 20, S23–S37. [Google Scholar] [CrossRef]
- Fracassi, U.; Milano, G. A soft linkage between major seismogenic fault systems in the central-southern Apennines (Italy): Evidence from low-magnitude seismicity. Tectonophysics 2014. [Google Scholar] [CrossRef]
- Porfido, S.; Esposito, E.; Guerrieri, L.; Vittori, E.; Tranfaglia, G.; Pece, R. Seismically induced ground effects of the 1805, 1930 and 1980 earthquakes in the Southern Apennines (Italy). Boll. Soc. Geol. It. (Ital. J. Geosci.) 2007, 126, 333–346. [Google Scholar]
- Ferrarini, F.; Boncio, P.; De Nardis, R.; Pappone, G.; Cesarano, M.; Aucelli, P.; Lavecchia, G. Segmentation pattern and structural complexities in seismogenic extensional settings: The North Matese fault system (central Italy). J. Struct. Geol. 2017. [Google Scholar] [CrossRef]
- Serva, L. The earthquake of June 5, 1688. In Atlas of Isoseismal Maps of Italian Earthquakes; Postpichl, D., Ed.; Consiglio Nazionale Delle Ricerche: Roma, Italy, 1985; Volume 114. [Google Scholar]
- Di Bucci, D.; Massa, B.; Tornaghi, M.; Zuppetta, A. Structural setting of the 1688 Sannio earthquake epicentral area (Southern Italy) from surface and subsurface data. J. Geodyn. 2005, 40, 294–315. [Google Scholar] [CrossRef]
- Serva, L.; Esposito, E.; Guerrieri, L.; Porfido, S.; Vittori, E.; Comerci, V. Environmental effects from five historical earthquakes in southern Apennines (Italy) and macroseismic intensity assessment: Contribution to INQUA EEE Scale Project. Quatern. Int. 2007, 173–174, 30–44. [Google Scholar] [CrossRef]
- Nappi, R.; Alessio, G.; Bronzino, G.; Terranova, C.; Vilardo, G. Contribution of the SISCam Web-based GIS to the seismotectonic study of Campania (Southern Apennines): An example of application to the Sannio-area. Nat. Hazards 2008, 45, 73–85. [Google Scholar] [CrossRef]
- Valensise, G.; Pantosti, D. Database of potential sources for earthquakes larger than 5.5 in Italy. Ann. Geofis. 2001, 44, 797–964. [Google Scholar]
- Di Luccio, F.; Fukuyama, E.; Pino, N.A. The 2002 Molise earthquake sequence: What can we learn about the tectonics of southern Italy? Tectonophysics 2005, 405, 141–154. [Google Scholar] [CrossRef]
- Di Luccio, F.; Piscini, A.; Pino, N.A.; Ventura, G. Reactivation of deep faults beneath southern Apennines: Evidence from the 1990-1991 Potenza seismic sequences. Terra Nova 2005, 17, 586–590. [Google Scholar] [CrossRef]
- Meletti, C.; Galadini, F.; Valensise, G.; Stucchi, M.; Basili, R.; Barba, S.; Vannucci, G.; Boschi, E. A seismic source zone model for the seismic hazard assessment of the Italian territory. Tectonophysics 2008, 450, 85–108. [Google Scholar] [CrossRef]
- Bosquet, J.C.; Grellet, B.; Sauret, B. Neotectonic setting of the Benevento area: Comparison with the epicentral zone of the Irpinia earthquake. Ann. Geofis. 1993, 36, 245–251. [Google Scholar]
- Galadini, F.; Meletti, C.; Rebez, A. (Eds.) Le Ricerche del GNDT nel Campo Della Pericolosità Sismica (1996–1999); CNR-Gruppo Nazionale per la Difesa dai Terremoti: Roma, Italy, 2000. [Google Scholar]
- De Luca, G. La Rete Sismica Regionale d’Abruzzo e sua Integrazione con la RSN; Da Miscellanea INGV, Riassunti Estesi del I° Workshop Tecnico Monitoraggio Sismico del Territorio Nazionale: Stato Dell’arte e Sviluppo Delle Reti di Monitoraggio Sismico-Roma 20–21 December 2010; INGV: Roma, Italy, 2011; pp. 22–23. [Google Scholar]
- De Gori, P.; Moretti, M.; Margheriti, L.; Cecere, G.; Govoni, A.; Criscuoli, F.; Mazza, S.; Lauciani, V.; D’Ambrosio, C.; Castagnozzi, A.; et al. Le Attività di Pronto Intervento Sismico Dell’ingv a Seguito del Terremoto del 29 Dicembre 2013; Rapporti Tecnici INGV: Roma, Italy, 2014; p. 281. Available online: http://istituto.ingv.it/l-ingv/produzione-scientifica/rapporti-tecnici-ingv/ (accessed on 30 December 2019).
- Moretti, M.; Margheriti, L.; Basili, A.; Baccheschi, P.; Villani, F.; Cecere, G.; D’Ambrosio, C.; Di Stefano, R.; Falco, L.; Memmolo, A.; et al. Il Terremoto a Campobasso del 16 Gennaio 2016. L’evento di Mw 4.3 e la Sequenza Sismica Associata. Quaderni di Geofisica INGV 2017. Available online: https://www.earth-prints.org/handle/2122/10454 (accessed on 30 December 2019).
- Lahr, J.C. HYPOELLIPSE: A Computer Program for Determining Local Earthquake Hypocentral Parameters, Magnitude and First-Motion Pattern; Y2K Compliant Version; US Department of the Interior, US Geological Survey: Reston, VA, USA, 1999.
- Kissling, E.; Ellsworth, W.L.; Eberhart-Phillips, D.; Kradolfer, U. Initial reference models in local earthquake tomography. J. Geophys. Res. 1994, 99, 19635–19646. [Google Scholar] [CrossRef]
- Chiarabba, C.; Amato, A. Upper-crustal structure of the Benevento area (southern Italy): Fault heterogeneities and potential for large earthquakes. Geophys. J. Int. 1997, 130, 229–239. [Google Scholar] [CrossRef]
- Milano, G.; Di Giovambattista, R.; Alessio, G. Earthquake swarms in the Southern Apennines chain (Italy): The 1997 seismic sequence in the Sannio-Matese mountains. Tectonophysics 1999, 306, 57–78. [Google Scholar] [CrossRef]
- Bisio, L.; Di Giovambattista, R.; Milano, G.; Chiarabba, C. Three-dimensional earthquake locations and upper crustal structure of the Sannio-Matese region (southern Italy). Tectonophysics 2004, 121–136. [Google Scholar] [CrossRef]
- Bagh, S.; Chiaraluce, L.; De Gori, P.; Moretti, M.; Govoni, A.; Chiarabba, C.; Di Bartolomeo, P.; Romanelli, M. Background seismicity in the central Apennines of Italy: The Abruzzo region case study. Tectonophysics 2007, 444, 80–92. [Google Scholar] [CrossRef]
- Chiarabba, C.; Bagh, S.; De Gori, P.; Barchi, M. Deep structural heterogeneities and the tectonic evolution of the Abruzzi region (central Apennines, Italy) revealed by microseismicity, seismic tomography and teleseismic receiver functions. Earth Planet. Sci. Lett. 2010, 295, 462–476. [Google Scholar] [CrossRef]
- Improta, L.; De Gori, P.; Chiarabba, C. New insights into crustal structure, Cenozoic magmatism, CO2 degassing, and seismogenesis in the southern Apennines and Irpinia region from local earthquake tomography. J. Geophys. Res. Solid Earth 2014, 119, 8283–8311. [Google Scholar] [CrossRef]
- Chatelain, J.L. Etude Fine de la Sismicité en Zone de Collision Continentale à L’aide d’un Réseau de Stationsportables: La Region Hindu-Kush-Pamir. Ph.D. Thesis, Université, Paul Sabatier, Toulouse, France, 1978. [Google Scholar]
- Chiarabba, C.; Frepoli, A. Minimum 1D velocity models in Central and Southern Italy: A contribution to better constrain hypocentral determination. Annali di Geofisica 1997, 40, 937–954. [Google Scholar]
- Mostardini, F.; Merlini, S. Appennino centro meridionale: Sezioni geologiche e proposta di modello strutturale. Mem. Soc. Geol. Ital. 1986, 35, 177–202. [Google Scholar]
- Improta, L.; Iannaccone, G.; Capuano, P.; Zollo, A.; Scandone, P. Inferences on the upper crustal structure of Southern Apennines (Italy) from seismic refraction investigations and subsurface data. Tectonophysics 2000, 317, 273–297. [Google Scholar] [CrossRef]
- D’Amico, S.; Cammarata, L.; Cangemi, M.; Cavallaro, D.; Di Martino, R.M.; Carlino, M.F. Carlino Seismic moment tensors and regional stress in the area of the December 2013-January 2014, Matese earthquake sequence (Italy). J. Geodyn. 2014, 82, 118–124. [Google Scholar] [CrossRef]
- Herrmann, R.B.; Malagnini, L.; Munafò, I. Regional moment tensor of the 2009 L’Aquila earthquake sequence. Bull. Seism. Soc. Am. 2011, 101, 975–993. [Google Scholar] [CrossRef]
- Waldhauser, F.; Ellsworth, W.L. A double-difference earthquake location algorithm: Method and application to the northern Hayward fault, California. Bull. Seismol. Soc. Am. 2000, 90, 1353–1368. [Google Scholar] [CrossRef]
- Reasenberg, P.A.; Oppenheimer, D. FPFIT, FPPLOT and FPPAGE: Fortran Computer Programs for Calculating and Displaying Earthquake Fault-Plane Solutions, Open File Report; U.S. Geological Survey: Reston, VA, USA, 1985; pp. 85–739.
- Frepoli, A.; Selvaggi, G.; Chiarabba, C.; Amato, A. State of stress in the Southern Tyrrhenian subduction zone from fault-plane solutions. Geophys. J. Int. 1996, 125, 879–891. [Google Scholar] [CrossRef]
- Alessio, G.; Gorini, A.; Vilardo, G.; Iannaccone, G. Low energy sequences in areas with high seismic potential: Benevento (Southern Apennines), April 1990. In Earthquake Hazard and Risk; Schenk, V., Ed.; Kluver Academic Publishers: Berlin/Heidelberg, Germany, 1996; pp. 3–16. [Google Scholar]
- Ekstrom, G. Teleseismic analysis of the 1990 and 1991 earthquakes near Potenza. Ann. Geophys. 1994, 37, 6. [Google Scholar]
- Boncio, P.; Mancini, T.; Lavecchia, G.; Selvaggi, G. Seismotectonics of strike-slip earthquakes within the deep crust of southern Italy: Geometry, kinematics, stress field and crustal rheology of the Potenza 1990–1991 seismic sequences (Mmax 5.7). Tectonophysics 2007, 445, 281–300. [Google Scholar] [CrossRef]
- Ferranti, L.; Milano, G.; Burrato, P.; Palano, M.; Cannavò, F. The seismogenic structure of the 2013-2014 Matese seismic sequences, Souhern Italy: Implication for the geometry of the Apennines active extensional belt. Geophys. J. Int. 2015, 201, 823–837. [Google Scholar] [CrossRef]
- Di Luccio, F.; Chiodini, G.; Caliro, S.; Cardellini, C.; Convertito, V.; Pino, N.A.; Tolomei, C.; Ventura, G. Seismic signature of active intrusions in mountain chains. Sci. Adv. 2018, 4, e1701825. [Google Scholar] [CrossRef]
- Milano, G.; Di Giovambattista, R.; Ventura, G. Seismic activity in the transition zone between Southern and Central Apennines (Italy): Evidences of longitudinal extension inside the Ortona-Roccamonfina tectonic line. Tectonophysics 2008, 457, 102–110. [Google Scholar] [CrossRef]
- Zhao, L.S.; Helmberger, D. Source estimation from broad-band regional seismograms. Bull. Seismol. Soc. Am. 1994, 85, 590–605. [Google Scholar]
- Convertito, V.; Pino, N.A.; Di Luccio, F. Investigating source directivity of moderate earthquakes by multiple approach: The 2013 Matese (southern Italy) Mw 5.0 event. Geophys. J. Int. 2016, 207, 1513–1528. [Google Scholar] [CrossRef]
- Convertito, V.; Cubellis, E.; Marturano, A.; Obrizzo, F.; Petrazzuoli, S.M. Terremoto del Matese (Mw 5.0), Indagine Speditiva Degli Effetti Nell’area Epicentrale ed Analisi Preliminare Della Sequenza Sismica; Rapporti Tecnici INGV: Roma, Italy, 2014; p. 290, ISSN 2039-7941. [Google Scholar]
- Valente, E.; Ascione, A.; Ciotoli, G.; Cozzolino, M.; Porfido, S. Do moderate magnitude earthquakes generate seismically induced ground effects? The case study of the Mw = 5.16, 29th December 2013 Matese earthquake (southern Apennines, Italy). Int. J. Earth Sci. (Geol. Rundsh.) 2017. [Google Scholar] [CrossRef]
- Valente, E.; Ascione, A.; Ciotoli, G.; Porfido, S.; Tavani, S. New data on the late Quaternary tectonics in the epicentral area of the December 2013–January 2014 southern Matese seismic sequence (Southern Apennines). Rend. Online Soc. Geol. Ital. 2015, 36, 79. [Google Scholar]
- Mai, P.M.; Spudich, P.; Boatwright, J. Hypocenter locations in finite-source rupture models. Bull. Seism. Soc. Am. 2005, 95, 365–980. [Google Scholar] [CrossRef]
- Milano, G.; Ventura, G.; Di Giovambattista, R. Seismic evidence of longitudinal extension in the Southern Apennines chain (Italy): The 1997-1998Sannio-Matese seismic sequence. Geophys. Res. Lett. 2002, 29. [Google Scholar] [CrossRef]
- Milano, G.; Di Giovambattista, R.; Ventura, G. Ventura The 2001 seismic activity near Isernia (Italy): Implications for the seismotectonics of the Central-Southern Apennines. Tectonophysics 2005, 401, 167–178. [Google Scholar] [CrossRef]
- Vilardo, G.; Nappi, R.; Petti, P.; Ventura, G. Fault geometries from the space distribution of the 1990-1997 Sannio-Benevento earthquakes: Inferences on the active deformation in Southern Apennines. Tectonophysics 2003, 363, 259–271. [Google Scholar] [CrossRef]
- Milano, G.; Di Giovambattista, R.; Ventura, G. Seismicity at the border between the Southern and Central Apennines (Italy): A review. Bollettino di Geofisica Teorica ed Applicata 2010, 51, 129–142. [Google Scholar]
- Esposito, A.; Galvani, A.; Sepe, V.; Atzori, S.; Brandi, G.; Cubellis, E.; De Martino, P.; Dolce, M.; Massucci, A.; Obrizzo, F.; et al. Concurrent deformation processes in the Matese massif area (Central-Southern Apennines, Italy). Tectonophysics 2019. [Google Scholar] [CrossRef]
- Meletti, C.; Patacca, E.; Scandone, P.; Figliuolo, B. Il Terremoto del 1456 e la Sua Interpretazione nel Quadro Sismotettonico dell’Appennino Meridionale. In Il terremoto del 1456; Figliuolo, B., Ed.; Napoli, Italy, 1988; Volume 1, pp. 71–108. Available online: https://emidius.mi.ingv.it/ASMI/study/MELAL988 (accessed on 30 December 2019).
- Gasparini, C.; Iannaccone, G.; Scarpa, R. Fault-plane solution and seismicity of the Italian peninsula. Tectonophysics 1985, 117, 59–78. [Google Scholar] [CrossRef]
- Adinolfi, G.M.; De Matteis, R.; Orefice, A.; Festa, G.; Zollo, A.; De Nardis, R.; Lavecchia, G. The September 27, 2012, ML 4.1, Benevento earthquake: A case of strike-slip faulting in Southern Apennines (Italy). Tectonophysics 2015, 660, 35–46. [Google Scholar] [CrossRef]
- SISMIKO Working Group. Emergenza Sismica in Molise. Report del Gruppo Operativo SISMIKO. 2018. Available online: https://zenodo.org/record/1405488#.XgnNdvwRXIU (accessed on 30 December 2019).
- Chiarabba, C.P.; De Gori, D.; Latorre, A. Amato Crustal structure in the area of the 2002 Molise earthquake: Clues for the evolution of the southern Apennines. Tectonics 2014, 33. [Google Scholar] [CrossRef]
- Doglioni, C.; Mongelli, F.; Pieri, P. The Puglia uplift (SE-Italy): An anomaly in the foreland of the Apenninicsubduction due to buckling of a thick continental lithosphere. Tectonics 1994, 13, 1309–1321. [Google Scholar] [CrossRef]
- Di Bucci, D.; Mazzoli, S. The October-November 2002 Molise seismic sequence (southern Italy): An expression of Adriaintraplate deformation. J. Geol. Soc. 2003, 160, 503–506. [Google Scholar] [CrossRef]
- Patacca, E.; Scandone, P. The 1627 Gargano earthquake (southern Italy): Identification and characterization of the causative fault. J. Seismol. 2004, 8, 259–273. [Google Scholar] [CrossRef]
- D’Orazio, M.; Innocenti, F.; Tonarini, S.; Doglioni, C. Carbonatites in a subduction system: The Pleistocene alvikites from Mt. Vulture (southern Italy). Lithos 2007, 98, 313–334. [Google Scholar] [CrossRef]


| 1D MATESE | |
|---|---|
| Vp | depth |
| 5.42 | 0.00 |
| 5.52 | 2.00 |
| 5.70 | 4.00 |
| 6.15 | 6.00 |
| 6.31 | 8.00 |
| 6.51 | 10.00 |
| 6.58 | 12.00 |
| 6.63 | 14.00 |
| 6.66 | 16.00 |
| 6.67 | 18.00 |
| 6.70 | 20.00 |
| 6.73 | 24.00 |
| 7.28 | 28.00 |
| 8.10 | 40.00 |
| Quality | Qf | Qp |
|---|---|---|
| A | Fj ≤ 0.025 | Δs, Δd, Δr ≤ 20° |
| B | 0.025 <Fj ≤ 0.1 | 20–40° |
| C | Fj> 0.1 | >40° |
© 2019 by the authors. Licensee MDPI, Basel, Switzerland. This article is an open access article distributed under the terms and conditions of the Creative Commons Attribution (CC BY) license (http://creativecommons.org/licenses/by/4.0/).
Share and Cite
Trionfera, B.; Frepoli, A.; De Luca, G.; De Gori, P.; Doglioni, C. The 2013–2018 Matese and Beneventano Seismic Sequences (Central–Southern Apennines): New Constraints on the Hypocentral Depth Determination. Geosciences 2020, 10, 17. https://doi.org/10.3390/geosciences10010017
Trionfera B, Frepoli A, De Luca G, De Gori P, Doglioni C. The 2013–2018 Matese and Beneventano Seismic Sequences (Central–Southern Apennines): New Constraints on the Hypocentral Depth Determination. Geosciences. 2020; 10(1):17. https://doi.org/10.3390/geosciences10010017
Chicago/Turabian StyleTrionfera, Brando, Alberto Frepoli, Gaetano De Luca, Pasquale De Gori, and Carlo Doglioni. 2020. "The 2013–2018 Matese and Beneventano Seismic Sequences (Central–Southern Apennines): New Constraints on the Hypocentral Depth Determination" Geosciences 10, no. 1: 17. https://doi.org/10.3390/geosciences10010017
APA StyleTrionfera, B., Frepoli, A., De Luca, G., De Gori, P., & Doglioni, C. (2020). The 2013–2018 Matese and Beneventano Seismic Sequences (Central–Southern Apennines): New Constraints on the Hypocentral Depth Determination. Geosciences, 10(1), 17. https://doi.org/10.3390/geosciences10010017