Article

Late Quaternary Tectonic Activity of the Udine-Buttrio Thrust, Friulian Plain, NE Italy

1
Department of Geosciences, Università degli Studi di Padova, 35122 Padova, Italy
2
Institute of Geological Sciences, Friedrich Schiller University Jena, 07749 Jena, Germany
3
Institute for Geology, TU Bergakademie Freiberg, 09599 Freiberg, Germany
4
Institute of Neotectonics and Natural Hazards, RWTH Aachen University, 52064 Aachen, Germany
*
Author to whom correspondence should be addressed.
Geosciences 2020, 10(2), 84; https://doi.org/10.3390/geosciences10020084
Submission received: 9 January 2020 / Revised: 4 February 2020 / Accepted: 15 February 2020 / Published: 23 February 2020
(This article belongs to the Special Issue Seismic Sequence in Mediterranean Region)

Abstract

:
The NW-SE trending Udine-Buttrio Thrust is a partly blind fault that affects the Friulian plain southeast of Udine in NE Italy. It is part of a wider fault system that accommodates the northward motion of the Adriatic plate. Although seismic reflection data and morphological evidence show that the fault was active during the Quaternary, comparably little is known about its tectonic activity. We used high-resolution digital elevation models to investigate the surface expression of the fault. Measured vertical surface offsets show significant changes along strike with uplift rates varying between 0 and 0.5 mm/yr. We then analyze a topographic scarp near the village of Manzano in more detail. Field mapping and geophysical prospections (Georadar and Electrical Resistivity Tomography) were used to image the subsurface geometry of the fault. We found vertical offsets of 1–3 m in Natisone River terraces younger than 20 ka. The geophysical data allowed the identification of deformation of the fluvial sediments, supporting the idea that the topographic scarp is a tectonic feature and that the terraces have been uplifted systematically over time. Our findings fit the long-term behaviour of the Udine-Buttrio Thrust. We estimate a post-glacial vertical uplift rate of 0.08–0.17 mm/yr recorded by the offset terraces. Our results shed light on the Late Quaternary behaviour of this thrust fault in the complicated regional tectonic setting and inform about its hitherto overlooked possible seismic hazard.

1. Introduction

The border area between northeastern Italy and western Slovenia marks the northeastern margin of the undeformed Adriatic microplate, which rotates counter-clockwise and moves north with respect to stable Europe at a rate of 2–3 mm/yr [1,2]. It reveals the highest historical and instrumental seismicity in the entire Alpine region and consequently, a high seismic hazard [3]. The Italian Database of Individual Seismogenic Sources (DISS) identifies 16 active or dormant structures in this area (Figure 1) capable of generating destructive earthquakes [4]. The majority of these structures, west of the Tagliamento River, belong to the eastern Southern Alps, striking in the (S)W–(N)E direction. East of the Tagliamento River, the tectonic framework is more complex. Here, NW–SE oriented right-lateral strike-slip faults accommodate transpressional deformation and interact with the Alpine thrusts [5]. Such structures hamper a straightforward correlation of the main historical earthquakes to their seismic sources in the area between Friuli and western Slovenia. For many strong events, the causative faults are still debated.
Partly blind thrust faults have been identified in the area between Udine and Gorizia in the Friulian plain (Figure 2). Tilted and uplifted surfaces located along the Udine-Buttrio, Pozzuolo, and Medea thrust systems testify to their Late Quaternary tectonic activity. Among these structures, only the Medea Fault is considered capable of M 6 earthquakes, while the potential of the other two needs to be investigated further [7]. Low deformation rates, high sedimentation rates, and the lack of strong instrumental earthquakes have hitherto hampered the assessment of fault activity in this area. By means of high-resolution digital elevation models (DEMs), field mapping, and near-subsurface geophysical surveys, we present evidence for the post-LGM (Last Glacial Maximum) activation of the main Udine-Buttrio Thrust and one of its splay faults. We show that a careful examination of high-resolution DEMs allows the measurement of surface offsets along the entire fault. In the area of the Buttrio Hills near the village of Manzano, vertical offsets in 20–8 ka old river terraces have a tectonic origin and we are able to calculate post-LGM vertical slip rates for this splay fault. Our study helps to better understand the regional tectonic framework and provides important input data for the seismic hazard assessment of the region.

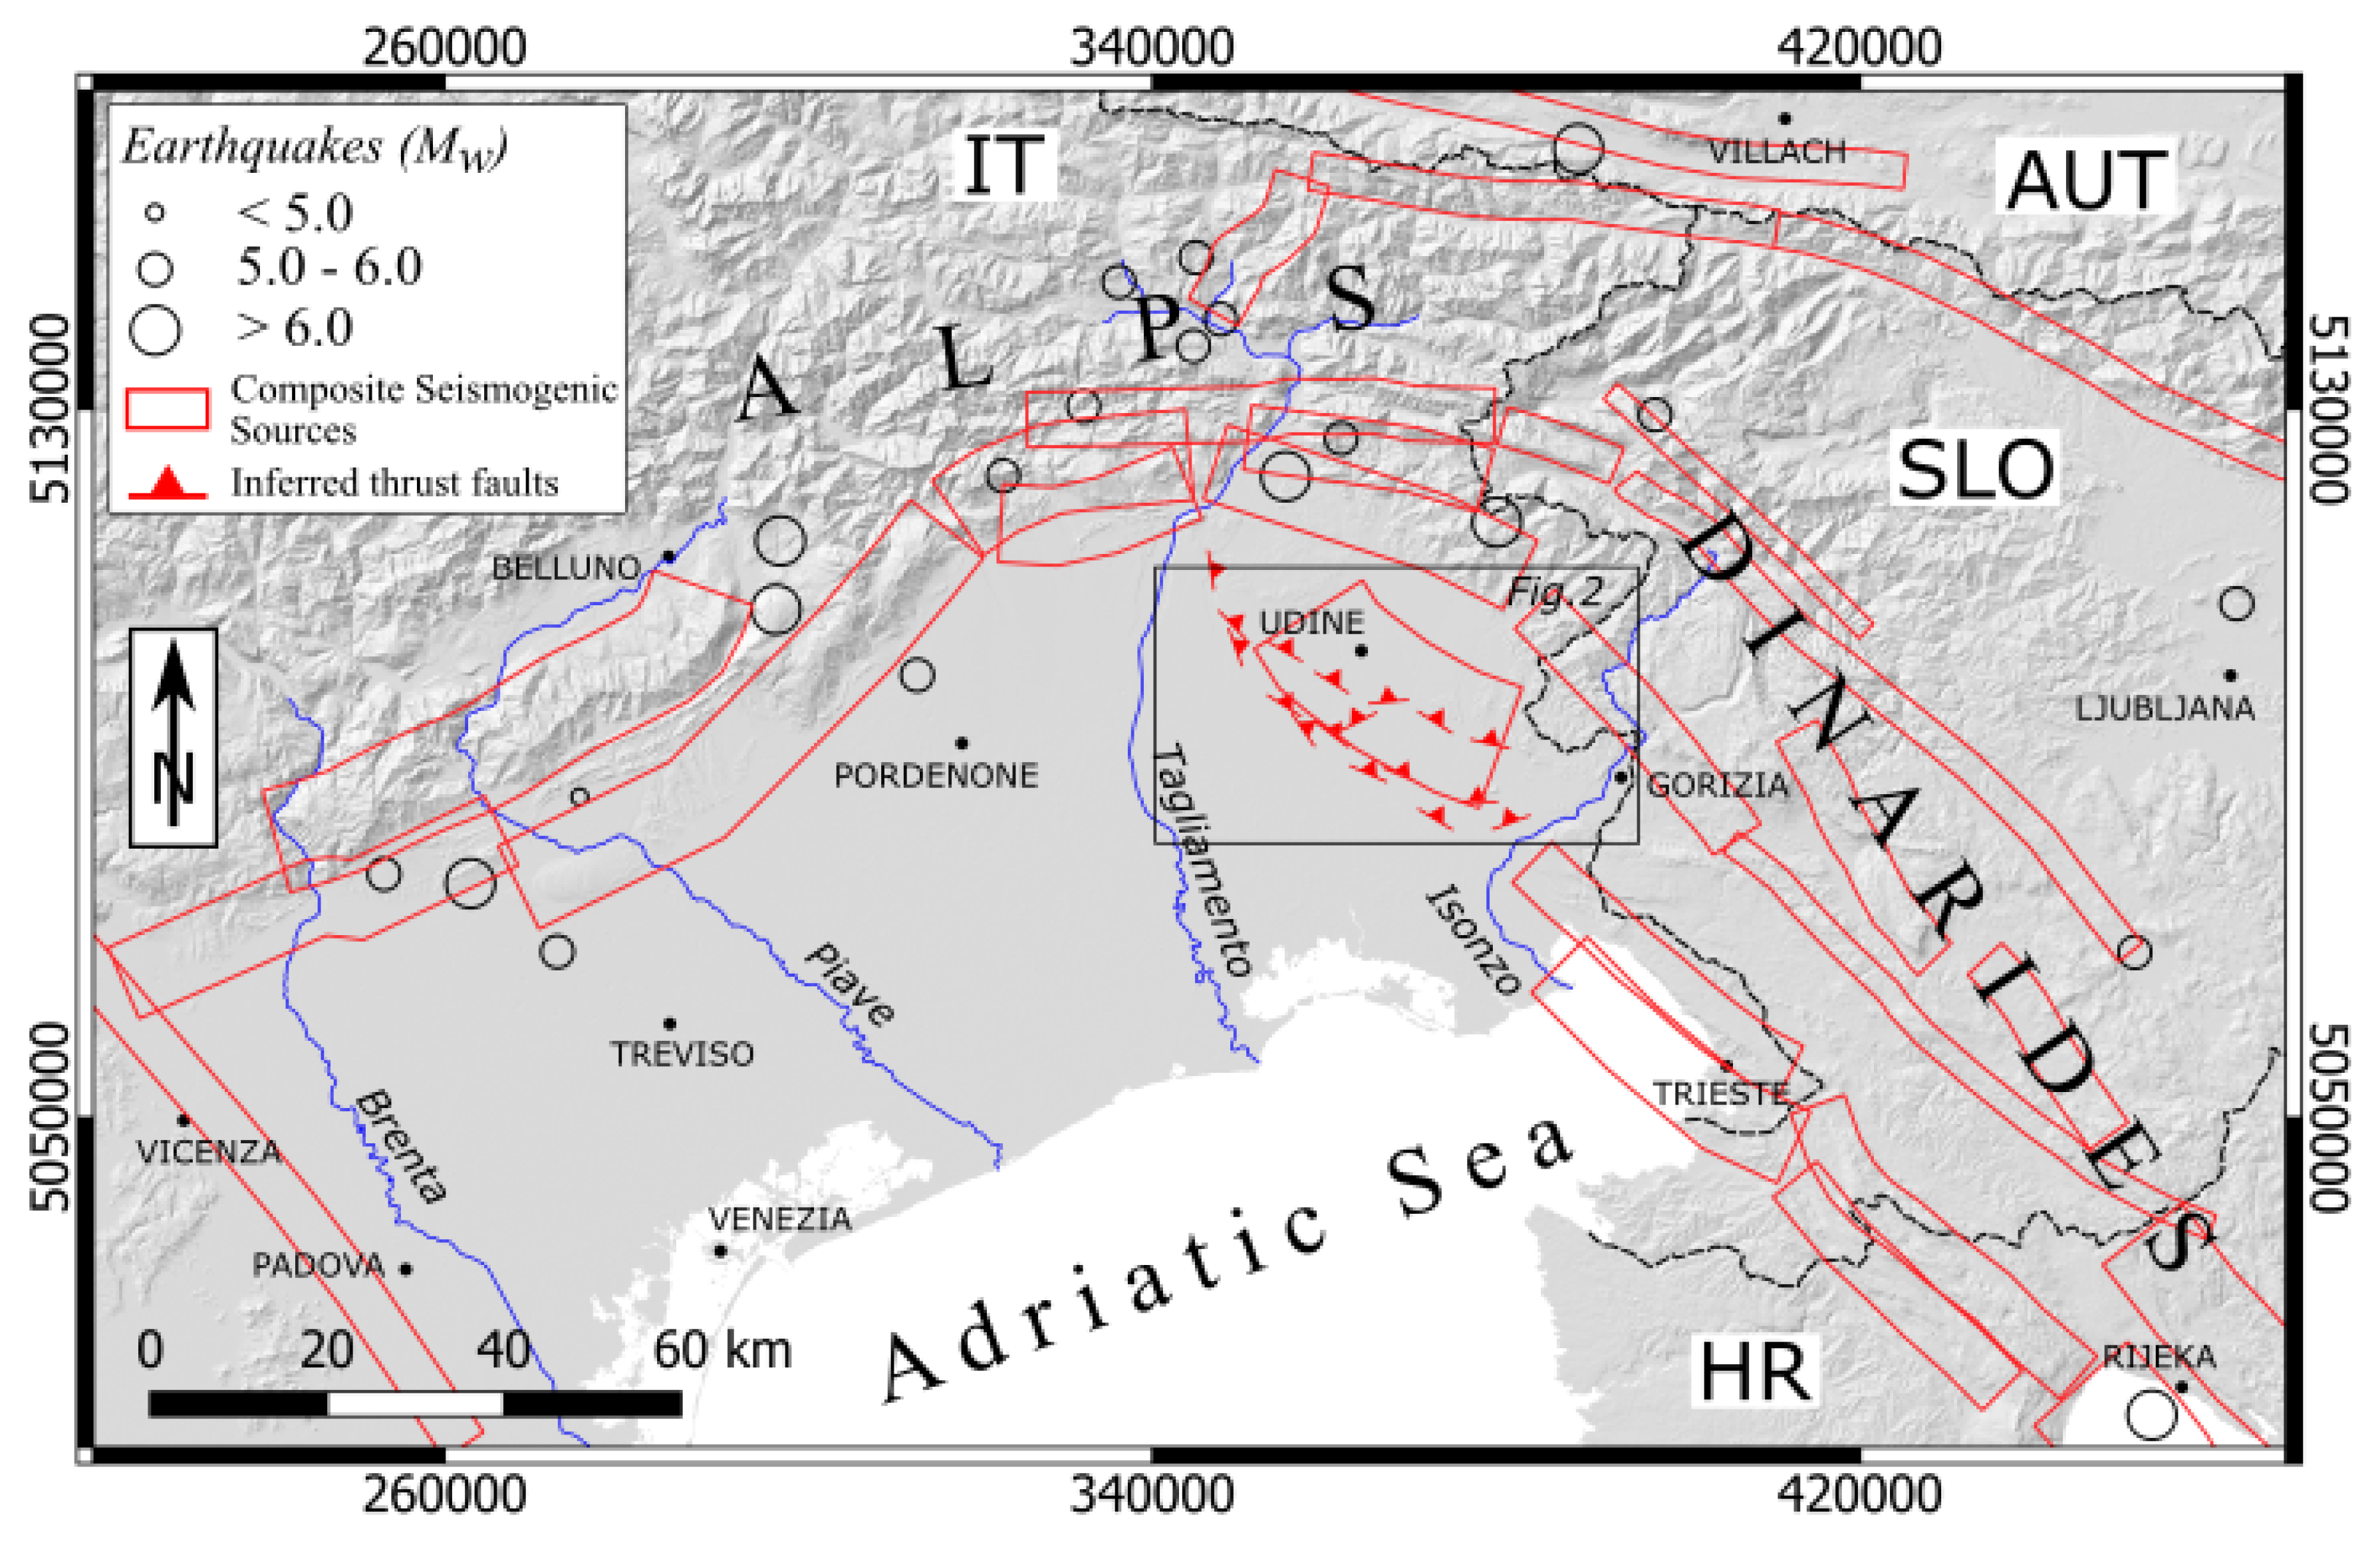
1.1. Tectonic Framework

Adria is generally considered to be an independent rigid microplate, encompassing the Po Plain, the Adriatic Sea, and Apulia [1,8,9,10,11]. After a first tectonic phase in which Adria acted as a promontory of Africa, the two plates decoupled around the late Cretaceous-Paleocene transition [11]. Since then the Africa - Eurasia convergence triggered the rotation of the newly generated rigid microplate [1]. Geodetic data are compatible with a counterclockwise rotation of Adria with a rate between 0.25 ± 0.15 /Myr [12] and 0.297 ± 0.116 /Myr [9], or even up to 0.52 /Myr [13], with respect to Eurasia about an Euler pole located in the Western Alps. The N–S convergence of Adria vs. Europe amounts to ≈2–3 mm/yr at the longitude of the Eastern Alps [14].
The northeastern margin of Adria corresponds to the junction between the S-verging eastern Southalpine Chain (ESC) and the NW–SE trending Dinaric fault system. The Eastern Southern Alps are characterized by low-angle thrusts striking WSW–ENE to WNW–ESE. To the west, they are bounded by the Schio-Vicenza and the Giudicarie faults; the northern boundary is the Pustertal-Gailtal segment of the Periadriatic Fault [15]. The External Dinaric fold and thrust belt consists of Eocene NW-SE trending, SW-verging thrusts [16,17]. During the Pliocene, a new set of NW–SE striking, right-lateral strike-slip faults was activated. These new structures are thought to cut both the Eocene Dinaric and the ESC thrusts [5,16], although it is difficult to determine the cross-cutting relationships in detail. In 1998 and 2004, two moderate earthquakes occurred on the Ravne Fault, one of the NW–SE striking structures in Slovenia. Aftershocks of the 2004 M w 5.2 earthquake showed right-lateral slip in NW–SE direction and oblique right-lateral reverse mechanisms in E–W direction, which may indicate that the older thrust systems and the Pliocene-Recent strike-slip system still interact today [18,19].
In the area between Udine and Gorizia three WNW-ESE trending, blind thrusts show clear evidence of Late Quaternary activity, from North to South: the Udine-Buttrio, Pozzuolo, and Medea thrusts [7] (Figure 2). These segments partly form prominent morphological scarps and are responsible for the uplift of several hills like the Buttrio-Dolegna del Collio and the Pozzuolo-Orgnano systems as well as the Medea hill [20]. Based on the interpreted geological sections reported by Galadini et al. [7], the fault planes of the Udine-Buttrio and the Pozzuolo thrusts have low dip angles and reach down to only 4 km depth before soling out in flat detachments [21]. Therefore, they are considered capable of rupturing in intermediate magnitude earthquakes only. Conversely, the Medea segment displays a deeper frontal ramp reaching 5–8 km depth with a steeper dip. This geometry was used to define it as an independent seismogenic source capable of M 6 events [5]. The Medea Thrust has an estimated vertical slip rate of 0.15–0.22 mm/yr based on geological and seismic data [7].

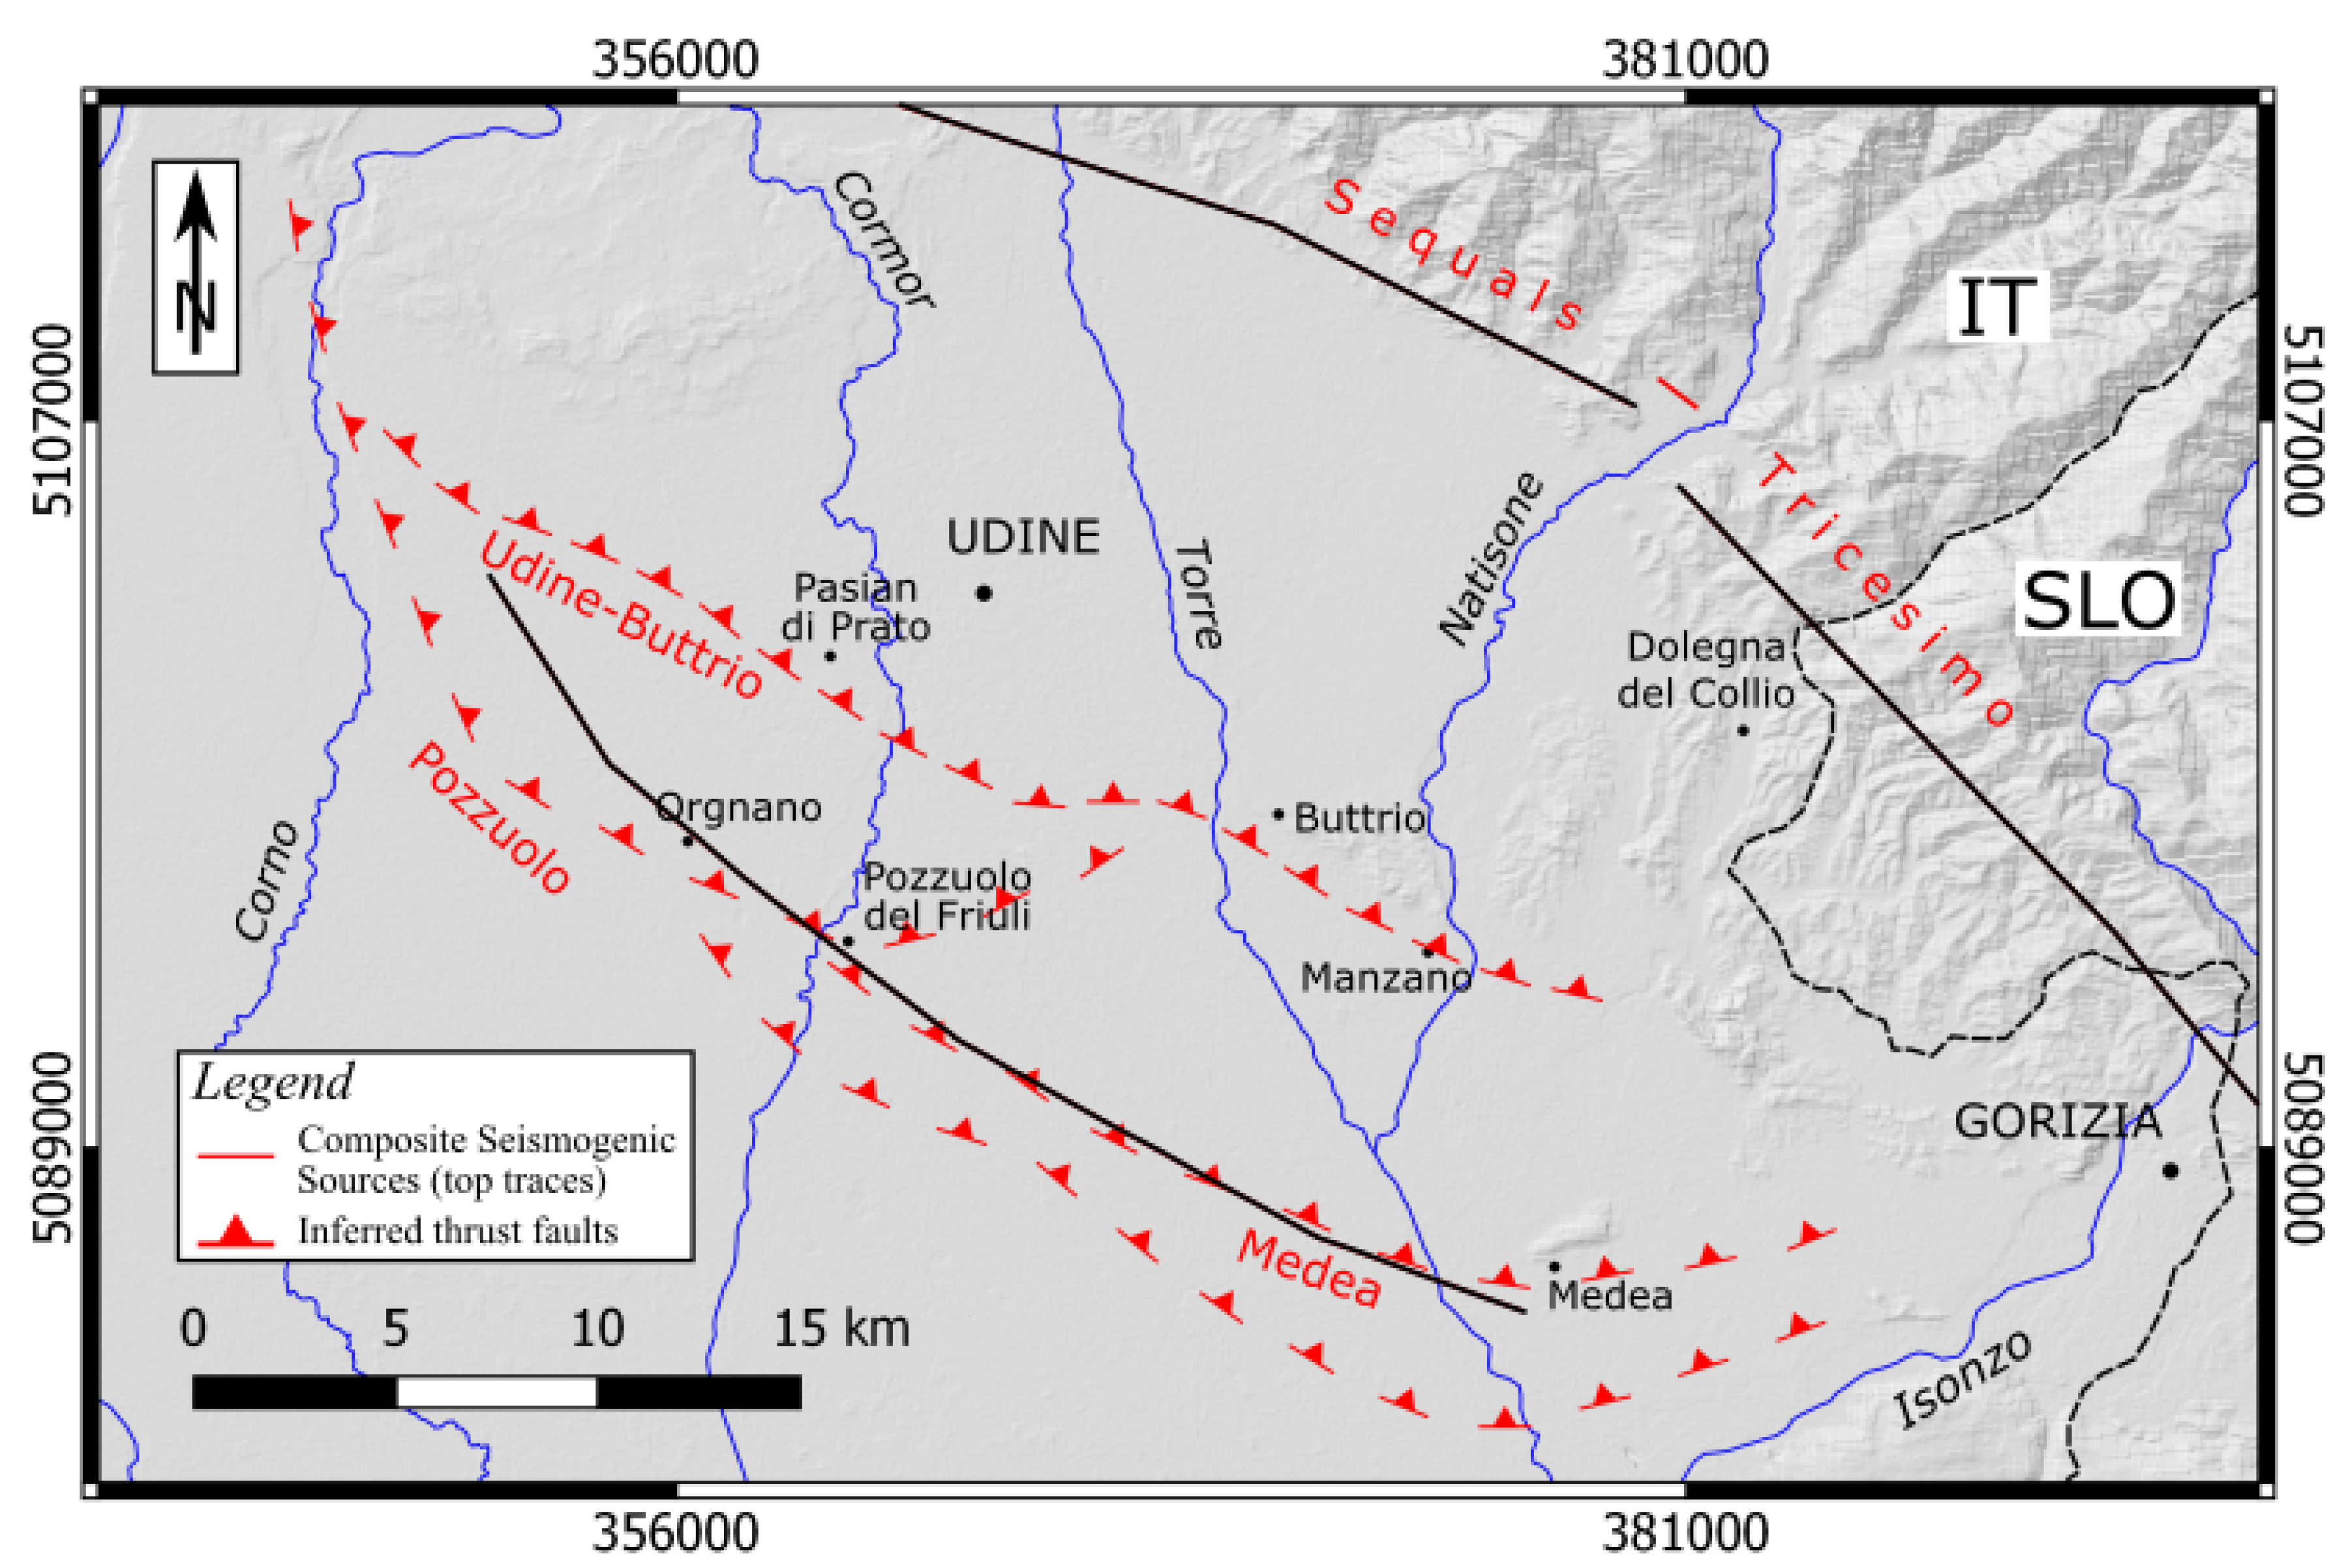
1.2. Geological Setting

The NW–SE trending Udine-Buttrio Thrust shows only little relief along most of its strike in the LGM megafan systems that form the Friulian Plain in this area [7,20,23]. West of Udine, it forms a scarp near the village of Pasian di Prato [7]. The Udine-Buttrio Thrust marks the southern margin of the Buttrio-Dolegna del Collio Hills that are the prominent morphological features in the study area. The thin-skinned fault is 31 km long and forms a decollement layer between the Eocene Flysch and Mesozoic-Paleocene carbonates [7]. The Savorgnano Marls and Sandstones, also known as Cormòns Flysch, are a Middle Ypresian—Early Lutetian basinal deposit made up of sandstones and/or siltstones alternations with calcareous-siliceous marls, and occasionally quartz clasts. It reaches up to 700 m thickness in this area, based on deep borehole data [22]. The top of this unit is vertically offset by the Udine-Buttrio Thrust by at least 80 m and similar offsets have been reported for Pleistocene deposits [7,24]. This implies a vertical uplift rate of at least 0.03 mm/yr in the Quaternary. The Pliocene-Recent activity of the Udine-Buttrio Thrust not only led to the uplift and tilting of the Buttrio-Dolegna hills, but also to a significant variation in the thickness of the Pleistocene successions [20,24].
The NNE–SSW trending valley of the Natisone River separates the hills of Buttrio and Rosazzo (Figure 2). The river system encompasses Late Pleistocene fluvioglacial and alluvial gravels and sandy gravels of the Premariacco Synthem [24]. The Premariacco fan developed during the LGM phase when the Natisone drained the melting waters provided by the high-energy Isonzo glacier system. These deposits involve layers with different consolidation levels from silty-sandy gravels to conglomerates, cropping out along the Natisone River [20,24]. Around the hillslope margins, the fluvioglacial deposits are covered by a thin layer of Late Pleistocene-Recent silty-clayey colluvial and eluvial sediments. These correspond to the degradation material of the turbiditic unit, provided by the erosion of small catchments like that of the Rio di Case [20,24]. During the post-glacial incision, the river developed a terrace system and deposited gravels and sandy-gravels with intervals of silty sands that characterize the Po Synthem in this area. This unit forms the present-day riverbed and the younger terraces along the valley [20,22]. At the outflow of the low relief area, the depositional system of the Natisone merges with the Torre stream system.

1.3. Seismicity

Instrumental data show that most of the earthquakes in the wider study area are concentrated along the Southalpine front. They are characterized by prevailing reverse faulting mechanisms with shallow epicentral depths of less than 12 km [5,21,25,26]. Less seismicity and more widely distributed epicentres of moderate earthquakes characterise the NW-SE trending faults in western Slovenia. The few available fault plane solutions from moderate earthquakes show prevailing right-lateral strike-slip mechanisms [25,27,28,29]. Using relocated microseismicity data, Vičič et al. [30] demonstrated swarm activity for some of these faults, with hypocenters aligned almost vertically down to no more than 20 km depth. No increased instrumental seismicity was observed from the Udine-Buttrio Thrust.
The most important instrumental earthquakes in the study area are the 1976 Friuli sequence with a main shock of M s 6.5 [31], the 1936 Alpago event of M w 6.06 [32], and the 1998 Bovec-Krn mountain earthquake with M s 5.7 [33]. Based on the analysis of historical data (Figure 1), at least six additional earthquakes with M 6 struck the area between Veneto-Friuli and western Slovenia in the last 700 years [32,34,35]. The strongest historical events on the territory of Italy include: the 1348 Carnia-Villach event ( M w 6.63 ), the 1695 Asolano earthquake ( M w 6.4 ), and the 1873 Bellunese earthquake ( M w 6.29 ). Moreover, additional smaller events occurred between 1389 and 1812 and led to damage in the localities of Tolmin, Gemona, Cividale, Tramonti, and Maniago. In Slovenia, the most significant historical event was the 1511 Idrija earthquake. Based on the model outcomes of Fitzko et al. [36], it had a magnitude of M w 6.9 and ruptured 50 km of the right-lateral strike-slip Idrija Fault. However, there is an ongoing debate about the causative fault [26,37]. A recent paleoseismological study [37] in northeastern Italy found a surface-rupturing earthquake that dates back to the 16th century along a fault that may represent the seismogenic source of the 1511 earthquake.

2. Materials and Methods

In order to investigate the active tectonics of the Udine-Buttrio Thrust, we analyzed high-resolution DEMs, conducted near-surface geophysical surveys, and mapped scarps in the field.

2.1. LiDAR Data and DEMs

We analyzed 1 m-resolution LiDAR (light detection and ranging; also referred to as airborne laserscanning) data, collected from the “Protezione Civile” department of the Italian Government in the 2006–2010 survey period. One of the main advantages of the LiDAR technology is the acquisition of multiple signals [38], which allows filtering out the vegetation and calculating the ground surface model [39]. The digital elevation model, available from the Friuli-Venezia Giulia Region website [40], was generated from a point cloud with a mean density of 4 points/m 2 . For larger-scale analyses we used the 10 m TINITALY DEM [41,42]. We used the QGIS software (v. 2.18) to calculate elevation, hillshades, slope, and terrain ruggedness index (TRI) maps (Figure 3) [43]. These different visualizations were then used to detect tectonic signals in the landscape [44].

2.2. Topographic and Swath Profiles

From the DEMs, we extracted a series of linear and swath topographic profiles using the Terrain profile and the Swath QGIS tools. The linear profiles were used to highlight different geomorphological elements, to identify their borders, and to constrain vertical offsets along a fault scarp. The offset estimates were determined by calculating the regression lines of the two surfaces on either side of the scarp, respectively. In cases where the slopes of the two portions were similar, the vertical distance was calculated at the steepest point. Conversely, when significant variations in slope angle occurred, we estimated vertical offsets by running a series of measurements along strike. Swath profiles were extracted in order to analyze the offset along the Udine-Buttrio Thrust (Figure 3) and the general elevation trend of the Buttrio hill (Figure 4).

2.3. Normalized Steepness Index

In order to see if the Udine-Buttrio thrust has left its imprint on the river network, we computed the normalized steepness index ( k s n ) for the main rivers that cross the fault and their tributaries, which are from west to east Tagliamento, Cormor, Torre, Natisone, Corno, and Judrio Rivers (Figure 5). Normalized channel steepness is used as a measure for tectonically driven deviations in river profiles as it varies with spatial differences in rock uplift, climate or substrate lithology [45,46]. Elevated k s n -values correspond to reaches that could have been perturbed by tectonic uplift. We calculated normalized steepness indices as described in Wobus et al. [45], using a reference concavity index of 0.7, which was previously determined from the trunk channels using the integral method [47]. Catchment areas and stream networks were calculated from the 1 m LiDAR DEM [40] resampled to five meter resolution using algorithms provided by TopoToolbox2 [48], an open-source software for DEM analyses.

2.4. Geophysical Surveys

We used Ground-Penetrating Radar (GPR) and Electric Resistivity Tomography (ERT) to image the internal structure of the Natisone River terraces in the Manzano area.
The GPR system manufactured by GSSI consisted of a SIR 3000 controller system, 100 and 270 MHz antennae, and a survey wheel. These frequencies provide a good compromise between a high resolution of up to 0.02–0.08 m [49] and a possible penetration depth of more than 5 m, depending on the subsurface conditions, mainly the electric conductivity of the material. Trace distance was set to 2 cm. We used the ReflexW Software (v.7.2.2 by Sandmeier, Karlsruhe, Germany) and a standard processing including static corrections, background removal, bandpass filtering (Butterworth bandpass, usually using half and double the central instrumental frequency), gain adjustments, and topography corrections based on the 1 m LiDAR DEM. We recorded eleven GPR profiles that crossed the Manzano scarp perpendicularly.
For the ERT survey, we employed the 4-Point Light geoelectric system from Lippmann Geophysical Systems and the software GeoTest. Compared to the GPR method, it reaches greater investigation depths, but in turn, the ERT requires longer acquisition times and has a much lower resolution. Thus, a single profile line was prepared with 47 electrodes separated by a constant distance of 2 m. We used both Dipole–Dipole and Wenner configurations. The former is the most sensitive to vertical resistivity boundaries and presents a good penetration depth. On the other hand, the latter should better detect features with greater lateral continuity, such as depositional layers. Therefore, a comparative analysis of the results obtained with the two configurations could provide a better understanding of the subsurface characteristics. The processing was done with the RES2DINV Software (by Geotomo software, Gelugor, Malaysia) for calculating the resistivity model, applying a Least-Squares inversion algorithm. A series of seven iterations was applied in order to reduce the error estimate to below 5%.

3. Results

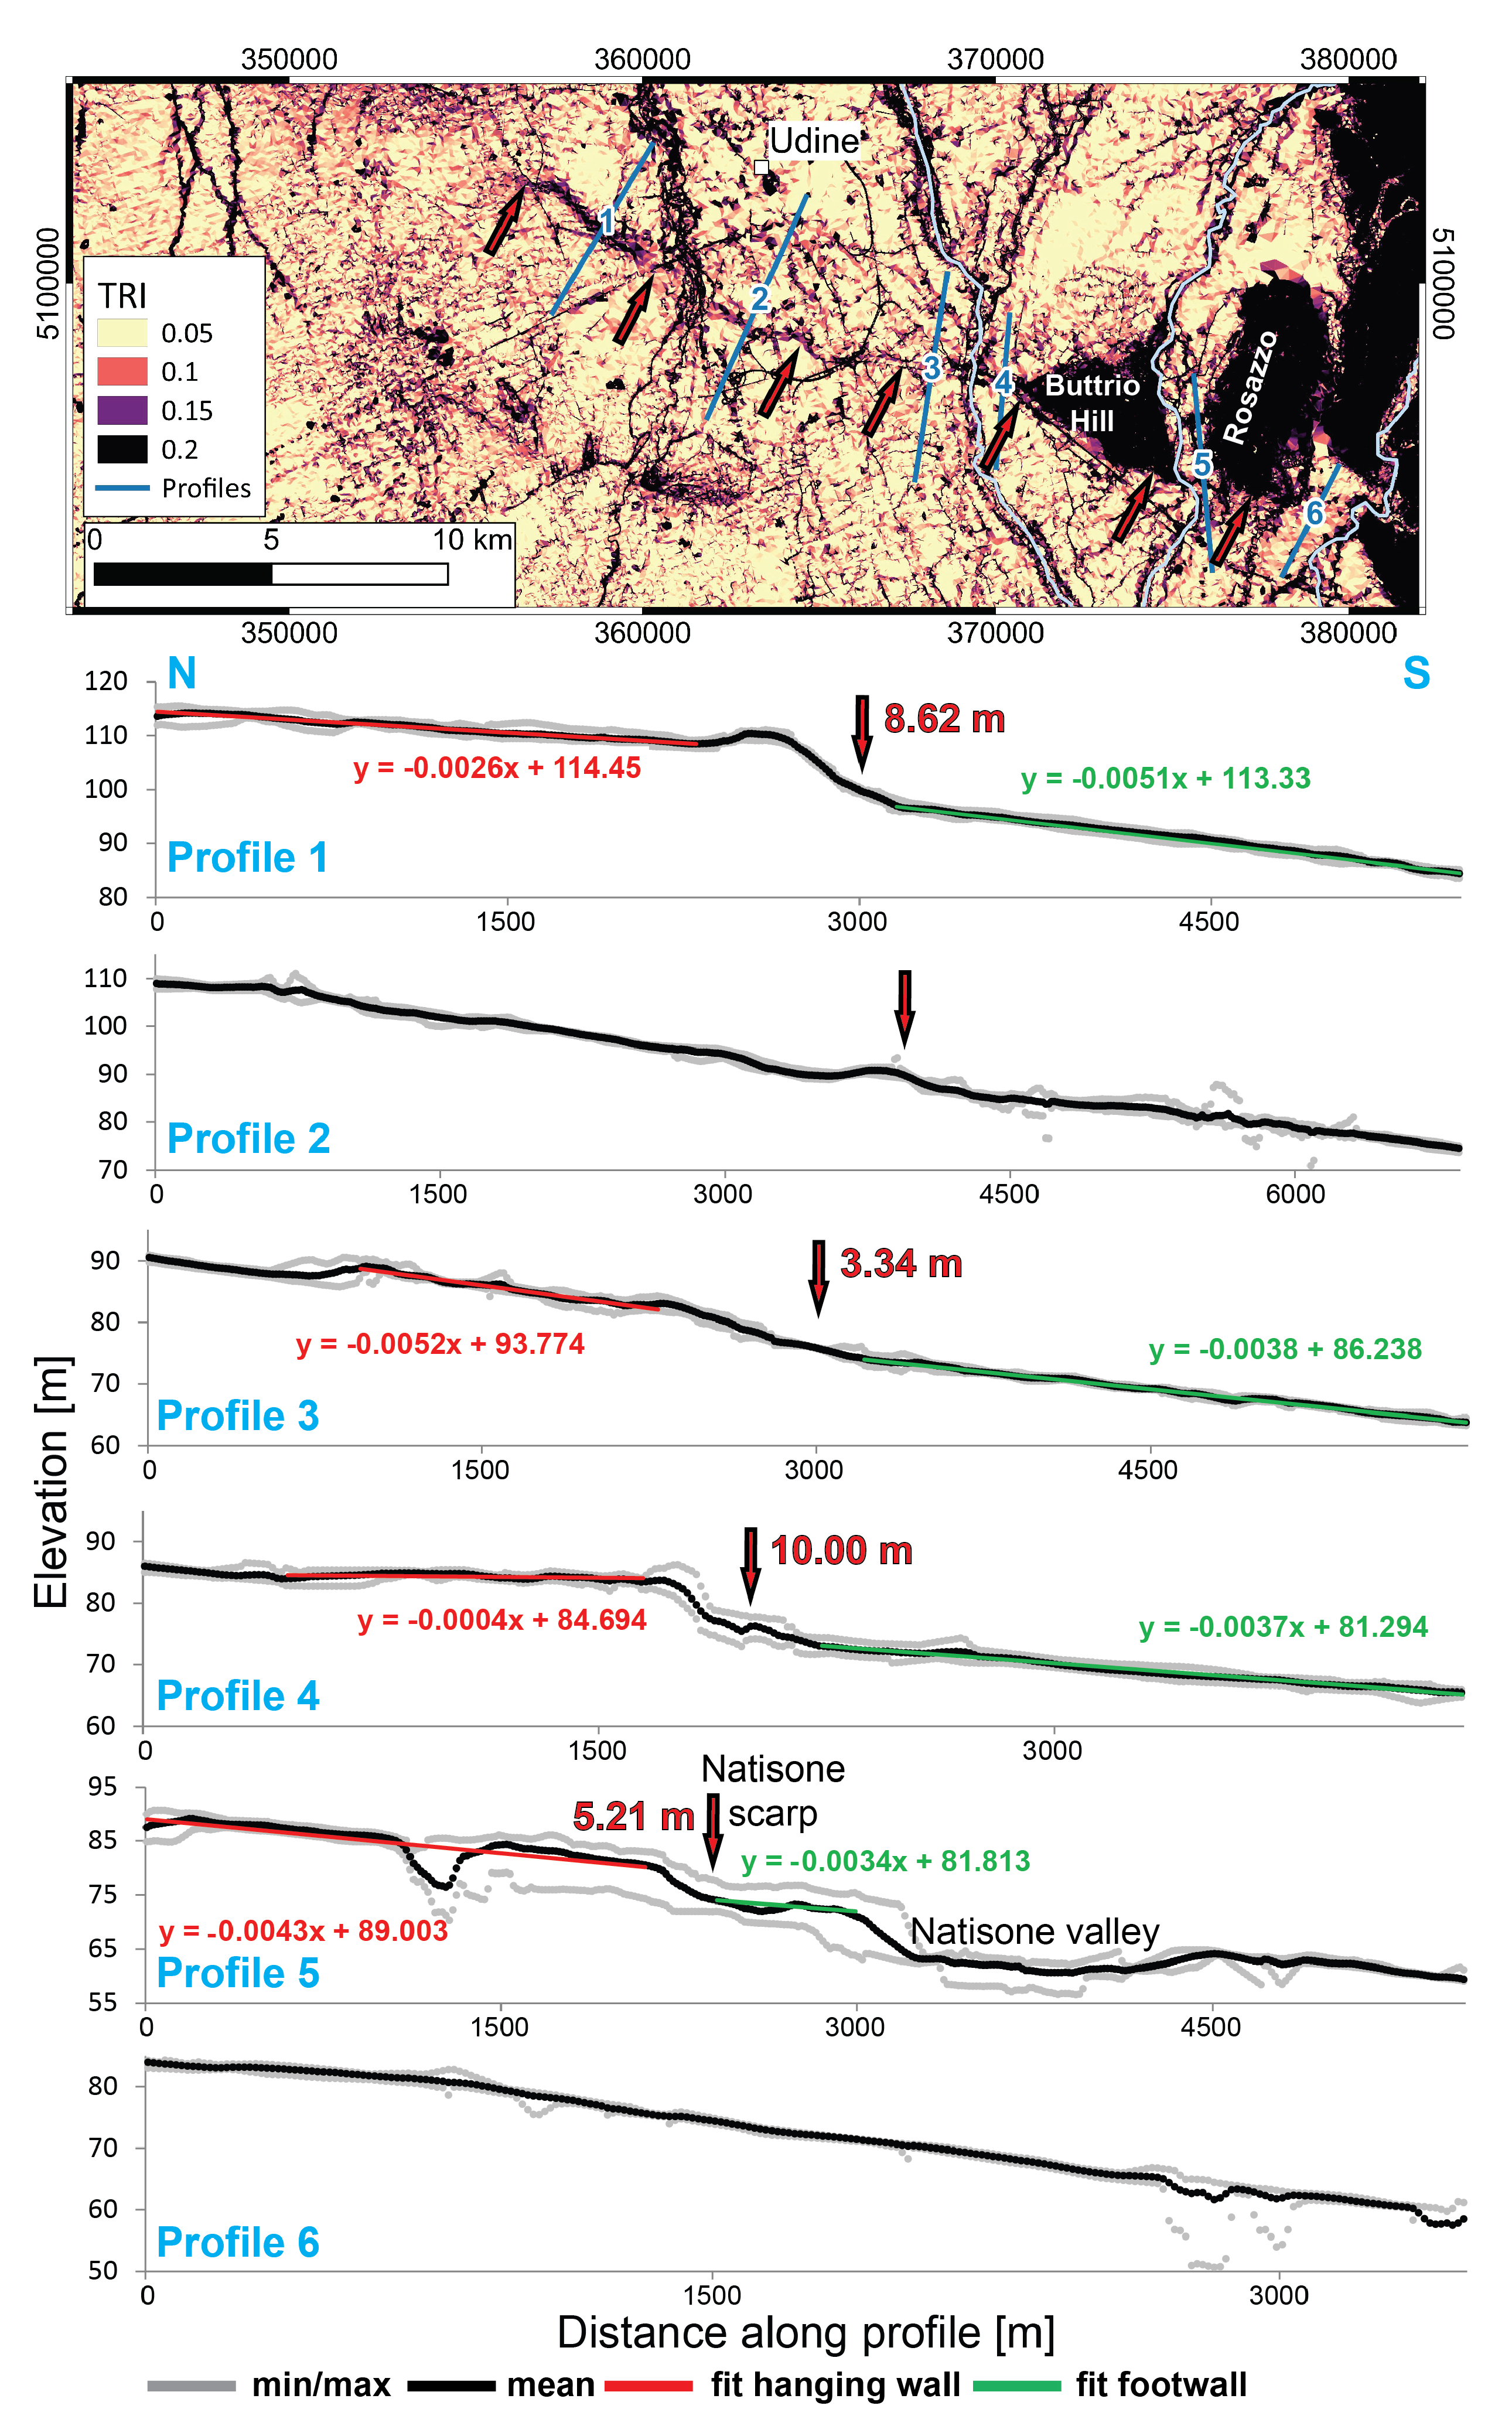
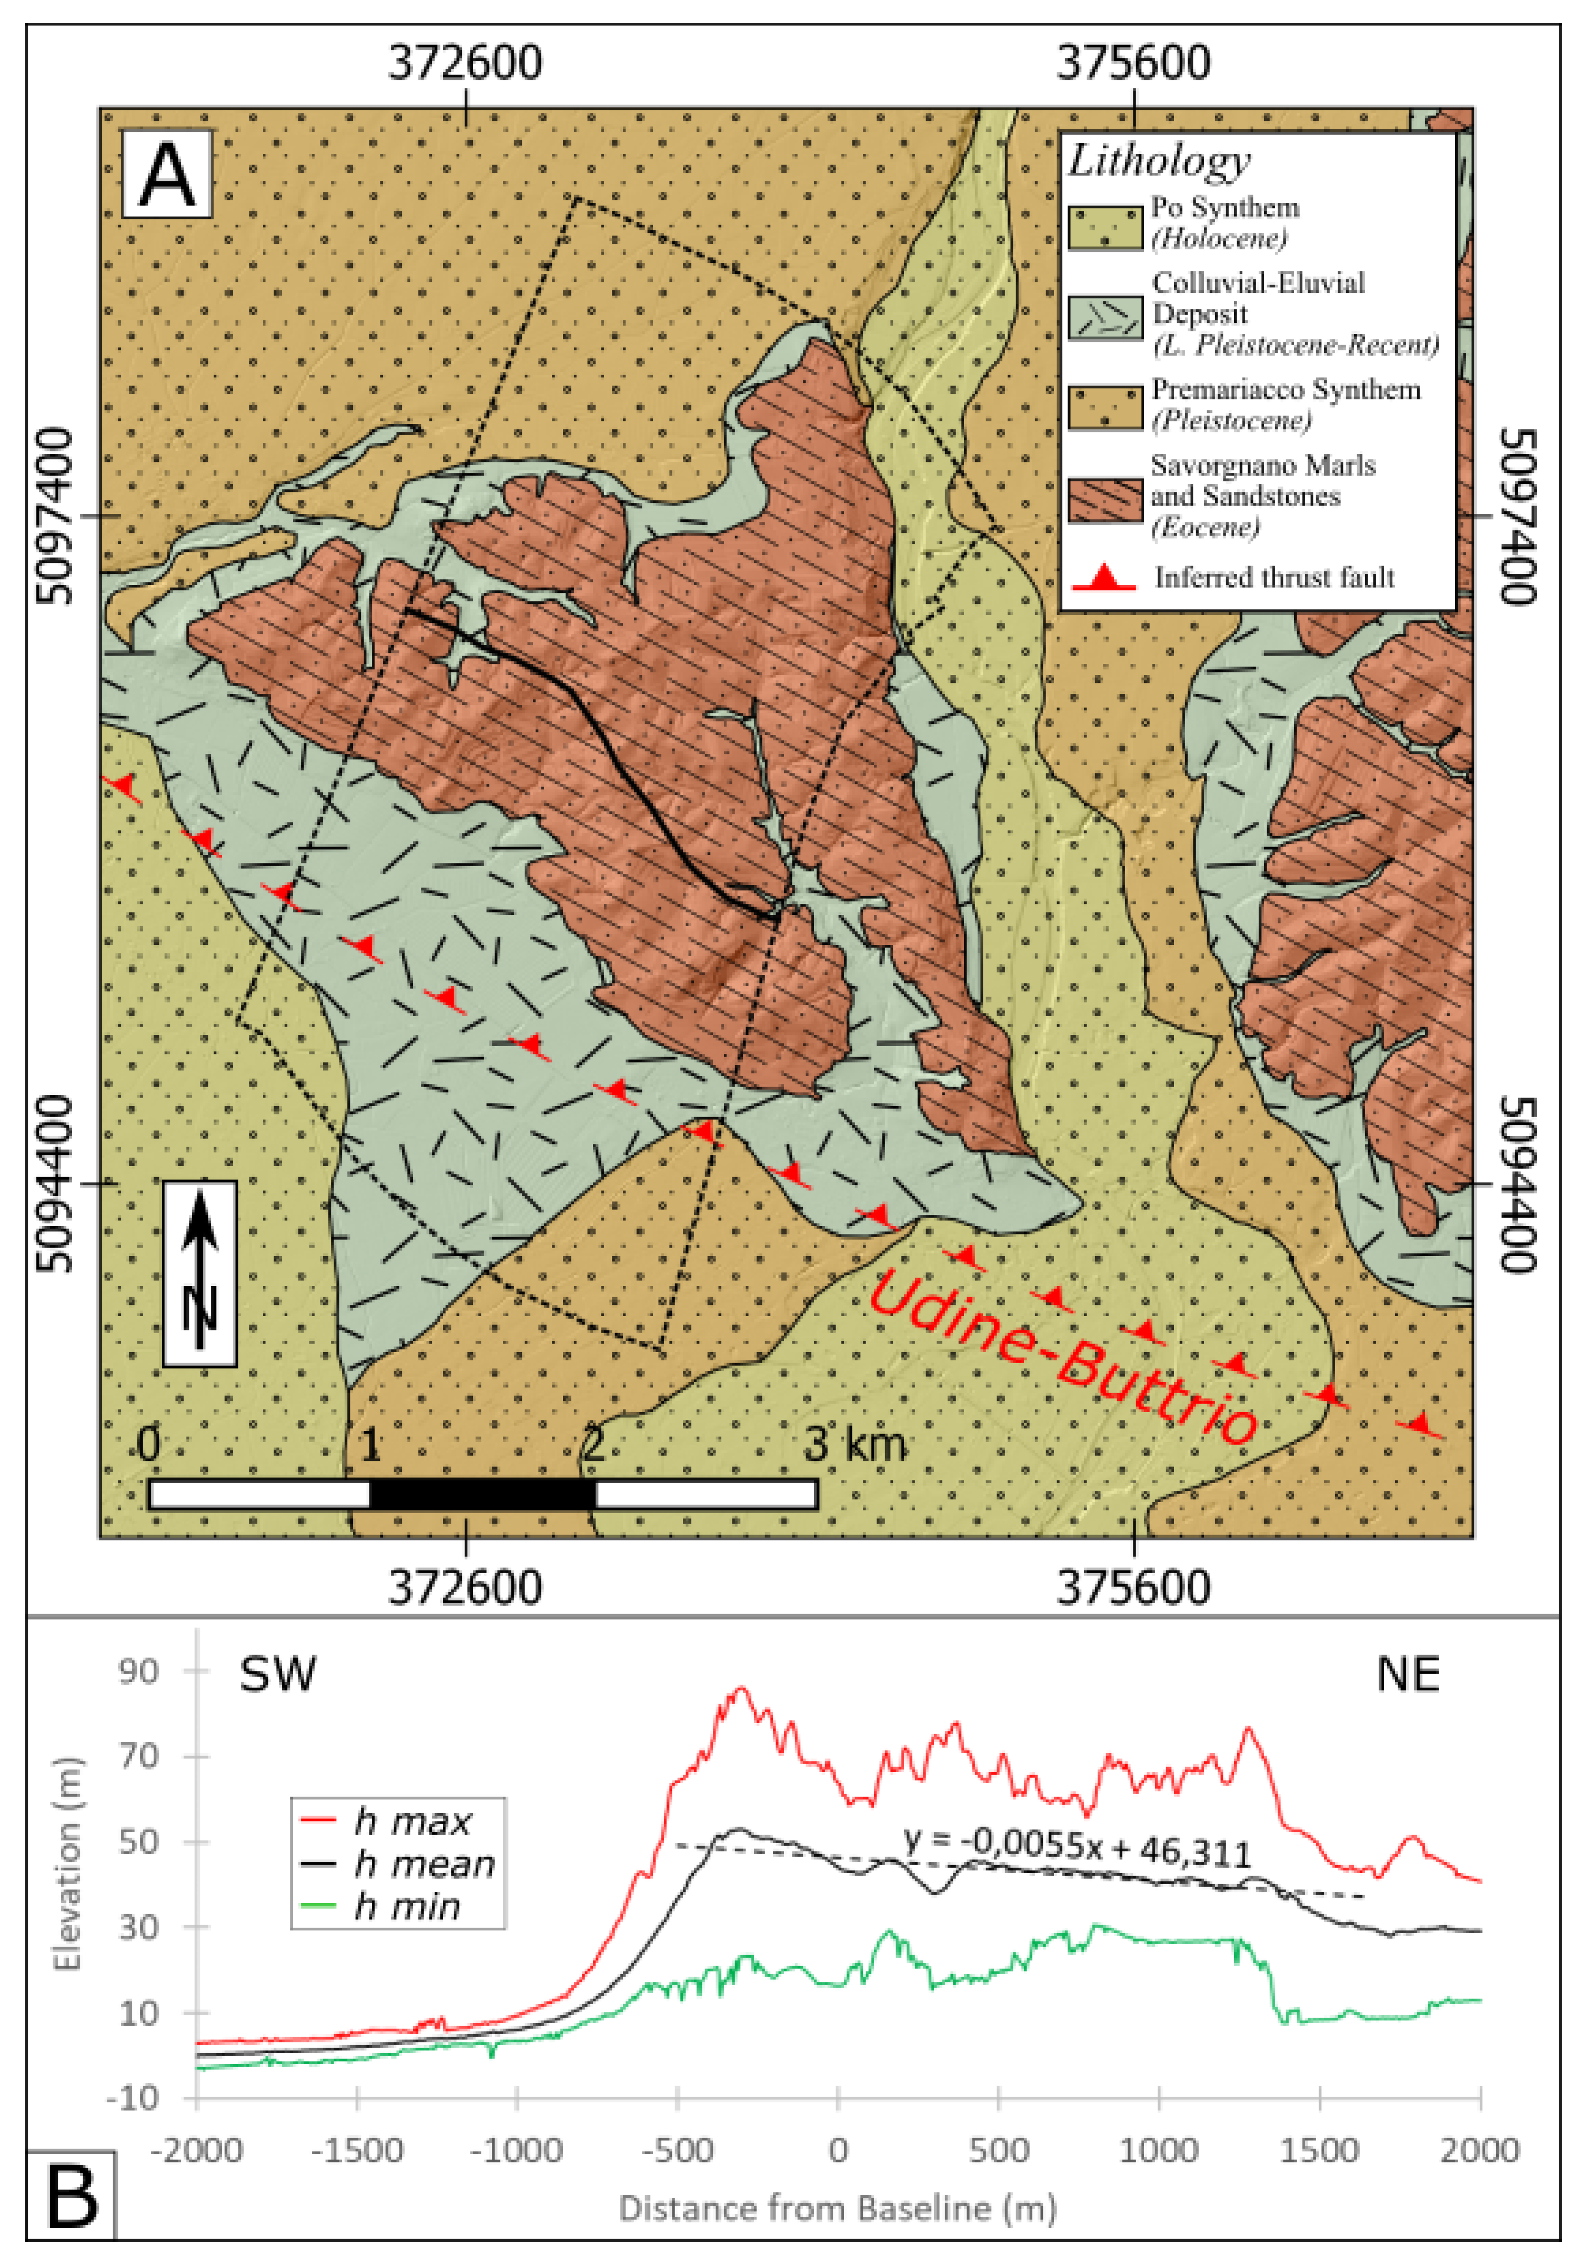
3.1. Swath Profile Analysis

Swath profiles across the trace of the Udine-Buttrio Thrust reveal significant vertical offsets along its strike (Figure 3). At the westernmost tip of the fault, we measured 8.5 m of vertical separation of the correlating hanging wall and footwall surfaces west of the Cormor River (Profile 1 in Figure 3). The scarp is degraded and about 300–400 m wide. In the hanging wall, we observed an up to 2 m-high and 300 m-wide hill right above the scarp, which may hint to incipient folding. Assuming an age of 20 ka for the fluvial deposits around Udine [20,22,23], the fault has a post-LGM vertical uplift rate of 0.43 mm/year here. Profile 2 is located south of Udine (Figure 3) on the eastern side of Cormor River. Although the fault trace is clear on the TRI map, no systematic offset was found in the swath profiles. A hill of a similar size to that in profile 1 produced the anomaly in the TRI values. West of the Torre River and the Buttrio Hill, profile 3 exhibits a 1700 m-wide zone of gentle folding with a flat top and 3 m vertical offset at its southern limb. The scarp is 500 m wide. Combined with an LGM age of the sediments of 20 ka, this height would correspond to a vertical uplift rate of 0.16 mm/yr. However, there are no direct dates for the age of the offset surface. A radiocarbon age of 22.707–21.314 ka calBP was reported by Fontana et al. [23] for the southern part of the Torre megafan. Given the proximity to the Torre River that is not deeply incised, the sediments could be younger than 20 ka, which would lead to a higher uplift rate. Profile 4 covers the scarp east of the Torre River at the western edge of Buttrio Hill. The hanging wall exhibits a flat 1000-m-long, backtilted surface. Here, we measured 10 m of vertical offset, which would correspond to a vertical uplift rate of 0.5 mm/yr if all the deformation were accommodated post-LGM. Between the Buttrio and Rosazzo Hill in the Natisone River valley, a 5 m high scarp is located not at the mountain front, but between the two hills (Profile 5 in Figure 3). This observation led us to run a more detailed study of the valley and the surrounding hills. As we will discuss in more detail later on, this vertical throw is a composite of tectonic deformation and terrace risers. Profile 6 east of the Rosazzo Hill exhibits no distinct scarp, but long-wavelength convexity. This is the opposite of what is to be expected from an alluvial fan or a steady-state river profile. We thus interpret this as the surface expression of anticlinal folding in the hanging wall of the Udine-Buttrio Thrust.
As already noticed by Carobene [50], the relief between Buttrio and Dolegna del Collio is likely related to the tectonic activity of the Udine-Buttrio Thrust, which runs along the southern boundary of the hills. We extracted a 2250 m-wide swath profile of the westernmost Buttrio Hill. The swath profile runs perpendicularly to the fault strike (Figure 4A).
In Figure 4B, we plotted the 4 km-long topographic swath profile with the minimum, maximum, and mean elevation values. From SW to NE, the profiles are characterized by a gentle slope towards SW, representing the upper Friulian plain surface. Then, a sharp SW-dipping scarp is developed at a distance between −700 and −400 m from the baseline position. The mean height of the scarp is 50 m, the maximum height is 80 m. Finally, the profile is characterized by a gentle NE-dipping slope until 1400 m distance. Such a trend was also obtained by Carobene [50], who developed a statistical analysis of the elevation peaks of the whole group of four reliefs. He suggested a rapid uplift process related to the Miocene-Quaternary activity of the Udine-Buttrio Thrust, which affected the southwestern boundary of the hills. We interpret the presence of the sharp, SW-facing scarp and the back-tilted, NE-dipping surface of the hills as caused by the ongoing SW-directed thrust motion of the fault.

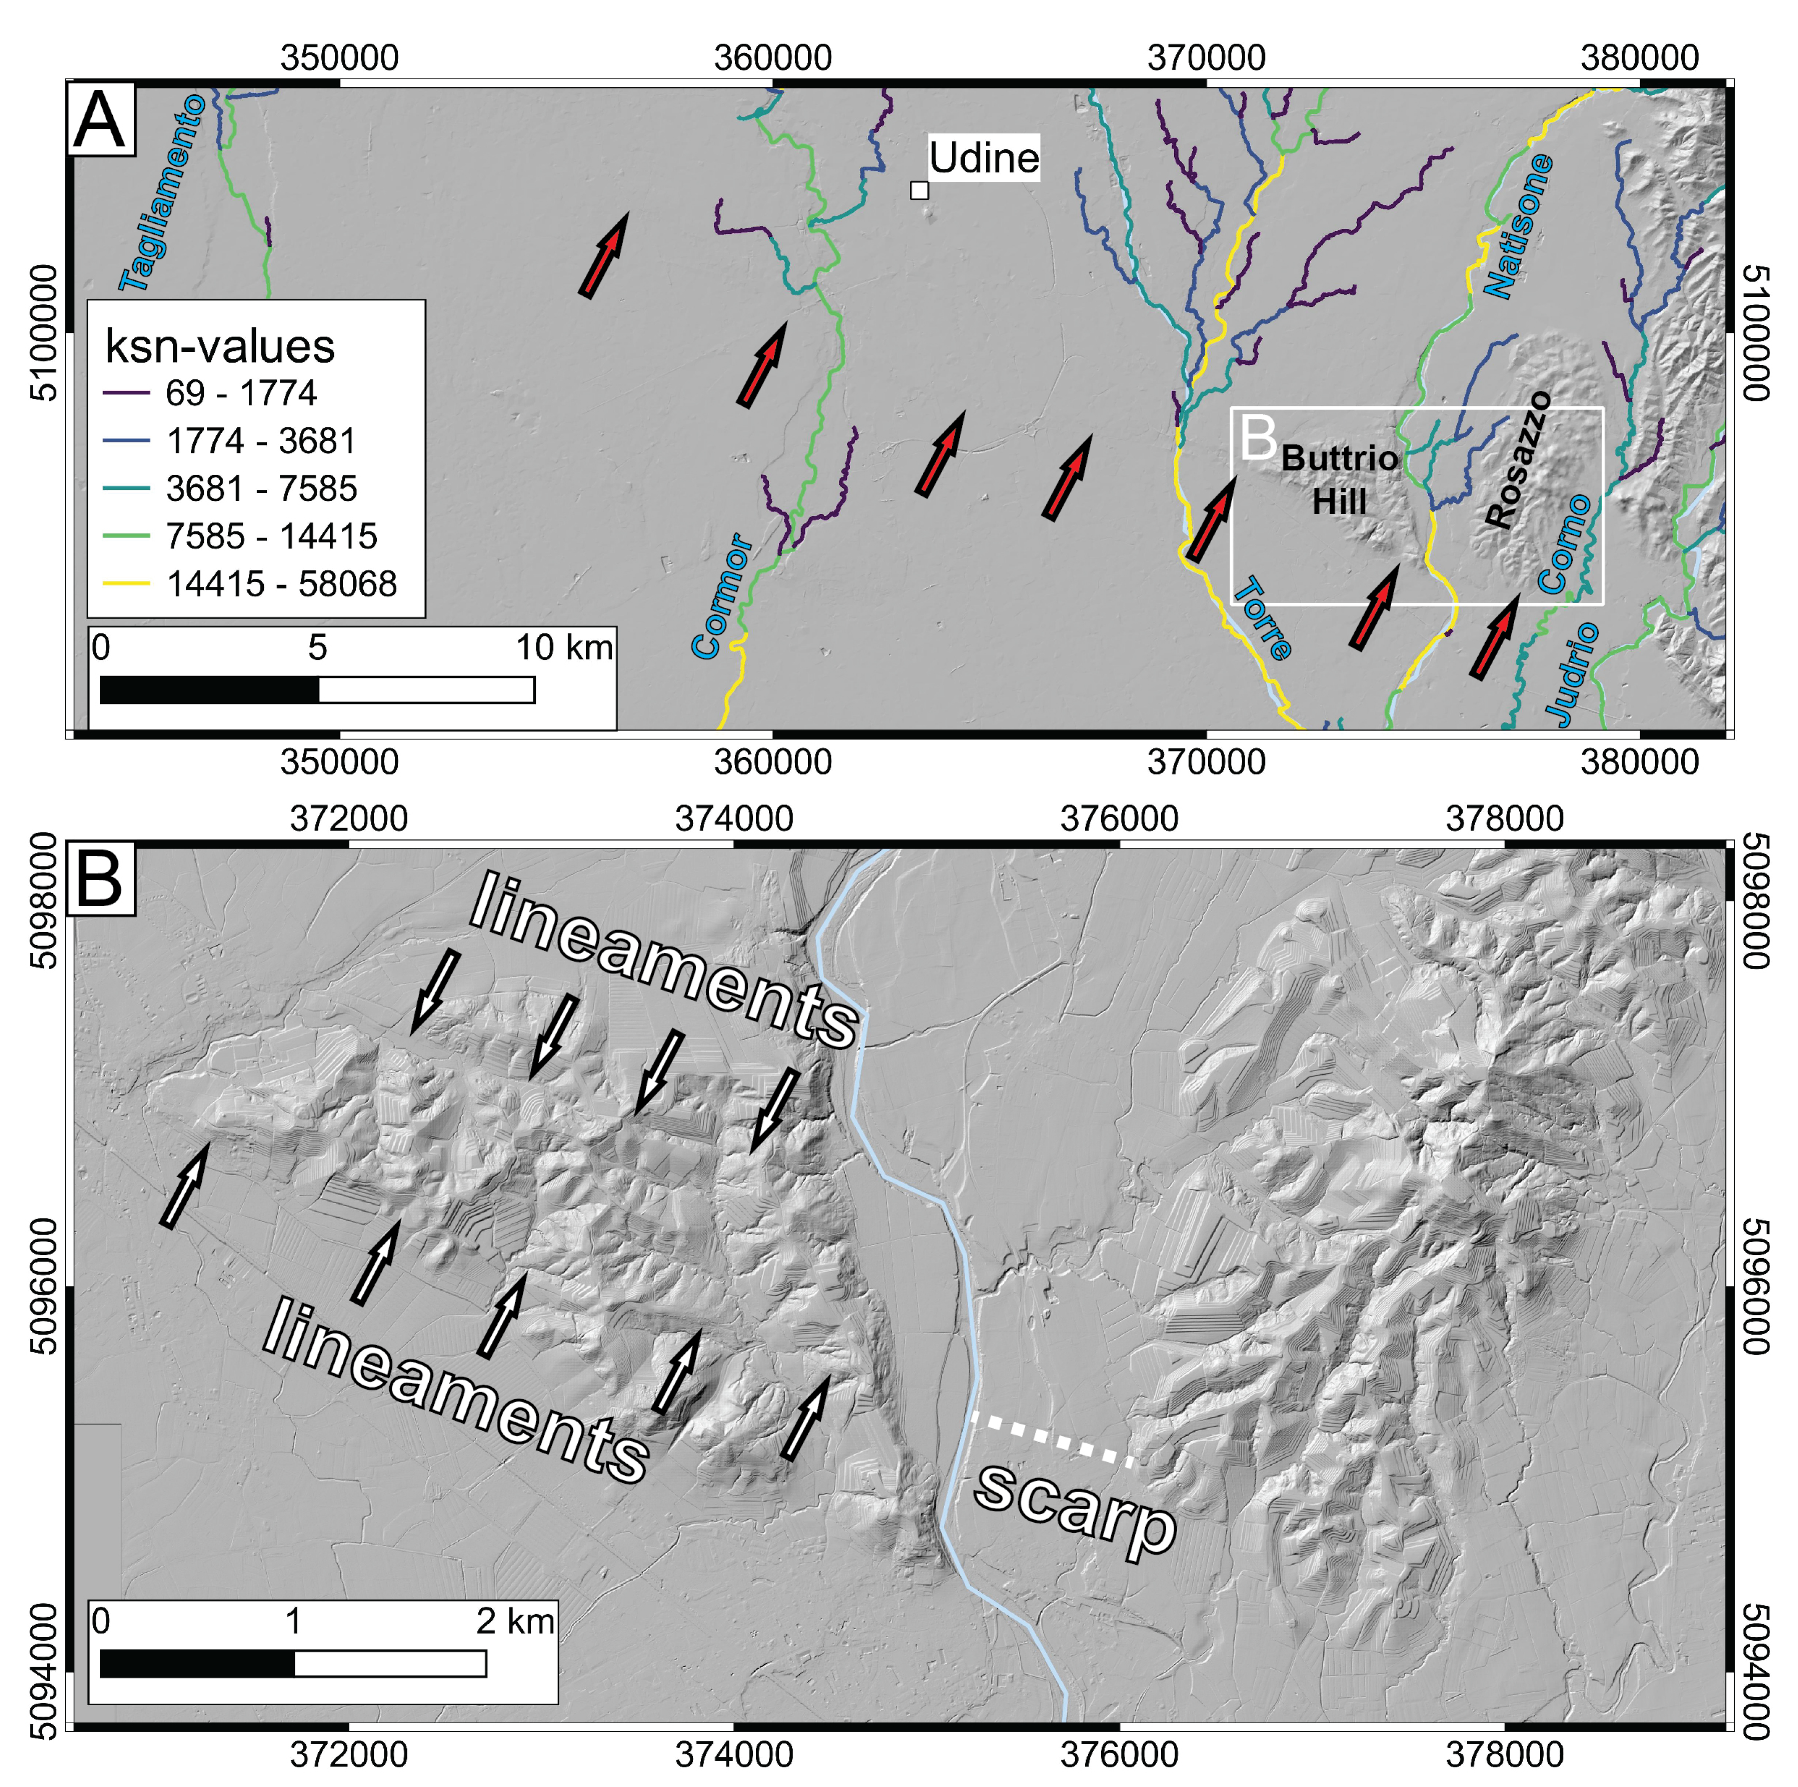
3.2. Normalized Steepness Index

In order to check whether the Udine-Buttrio Thrust also affects the present-day drainage network, we computed normalized steepness indices ( k s n ) of the main rivers and their tributaries in the study area (Figure 5). These values do not show a systematic change across the fault in the main rivers. The tributaries exhibit lower k s n -values than the main rivers and in general, more tributaries are present in the hanging wall than in the footwall of the fault. However, we conclude that the normalized steepness index does not provide additional data to better understand the fault’s activity. The lack of a significant signal may be due to the rather low slip rate of the fault and the very dynamic river system that quickly levels any tectonic perturbation of the landscape.

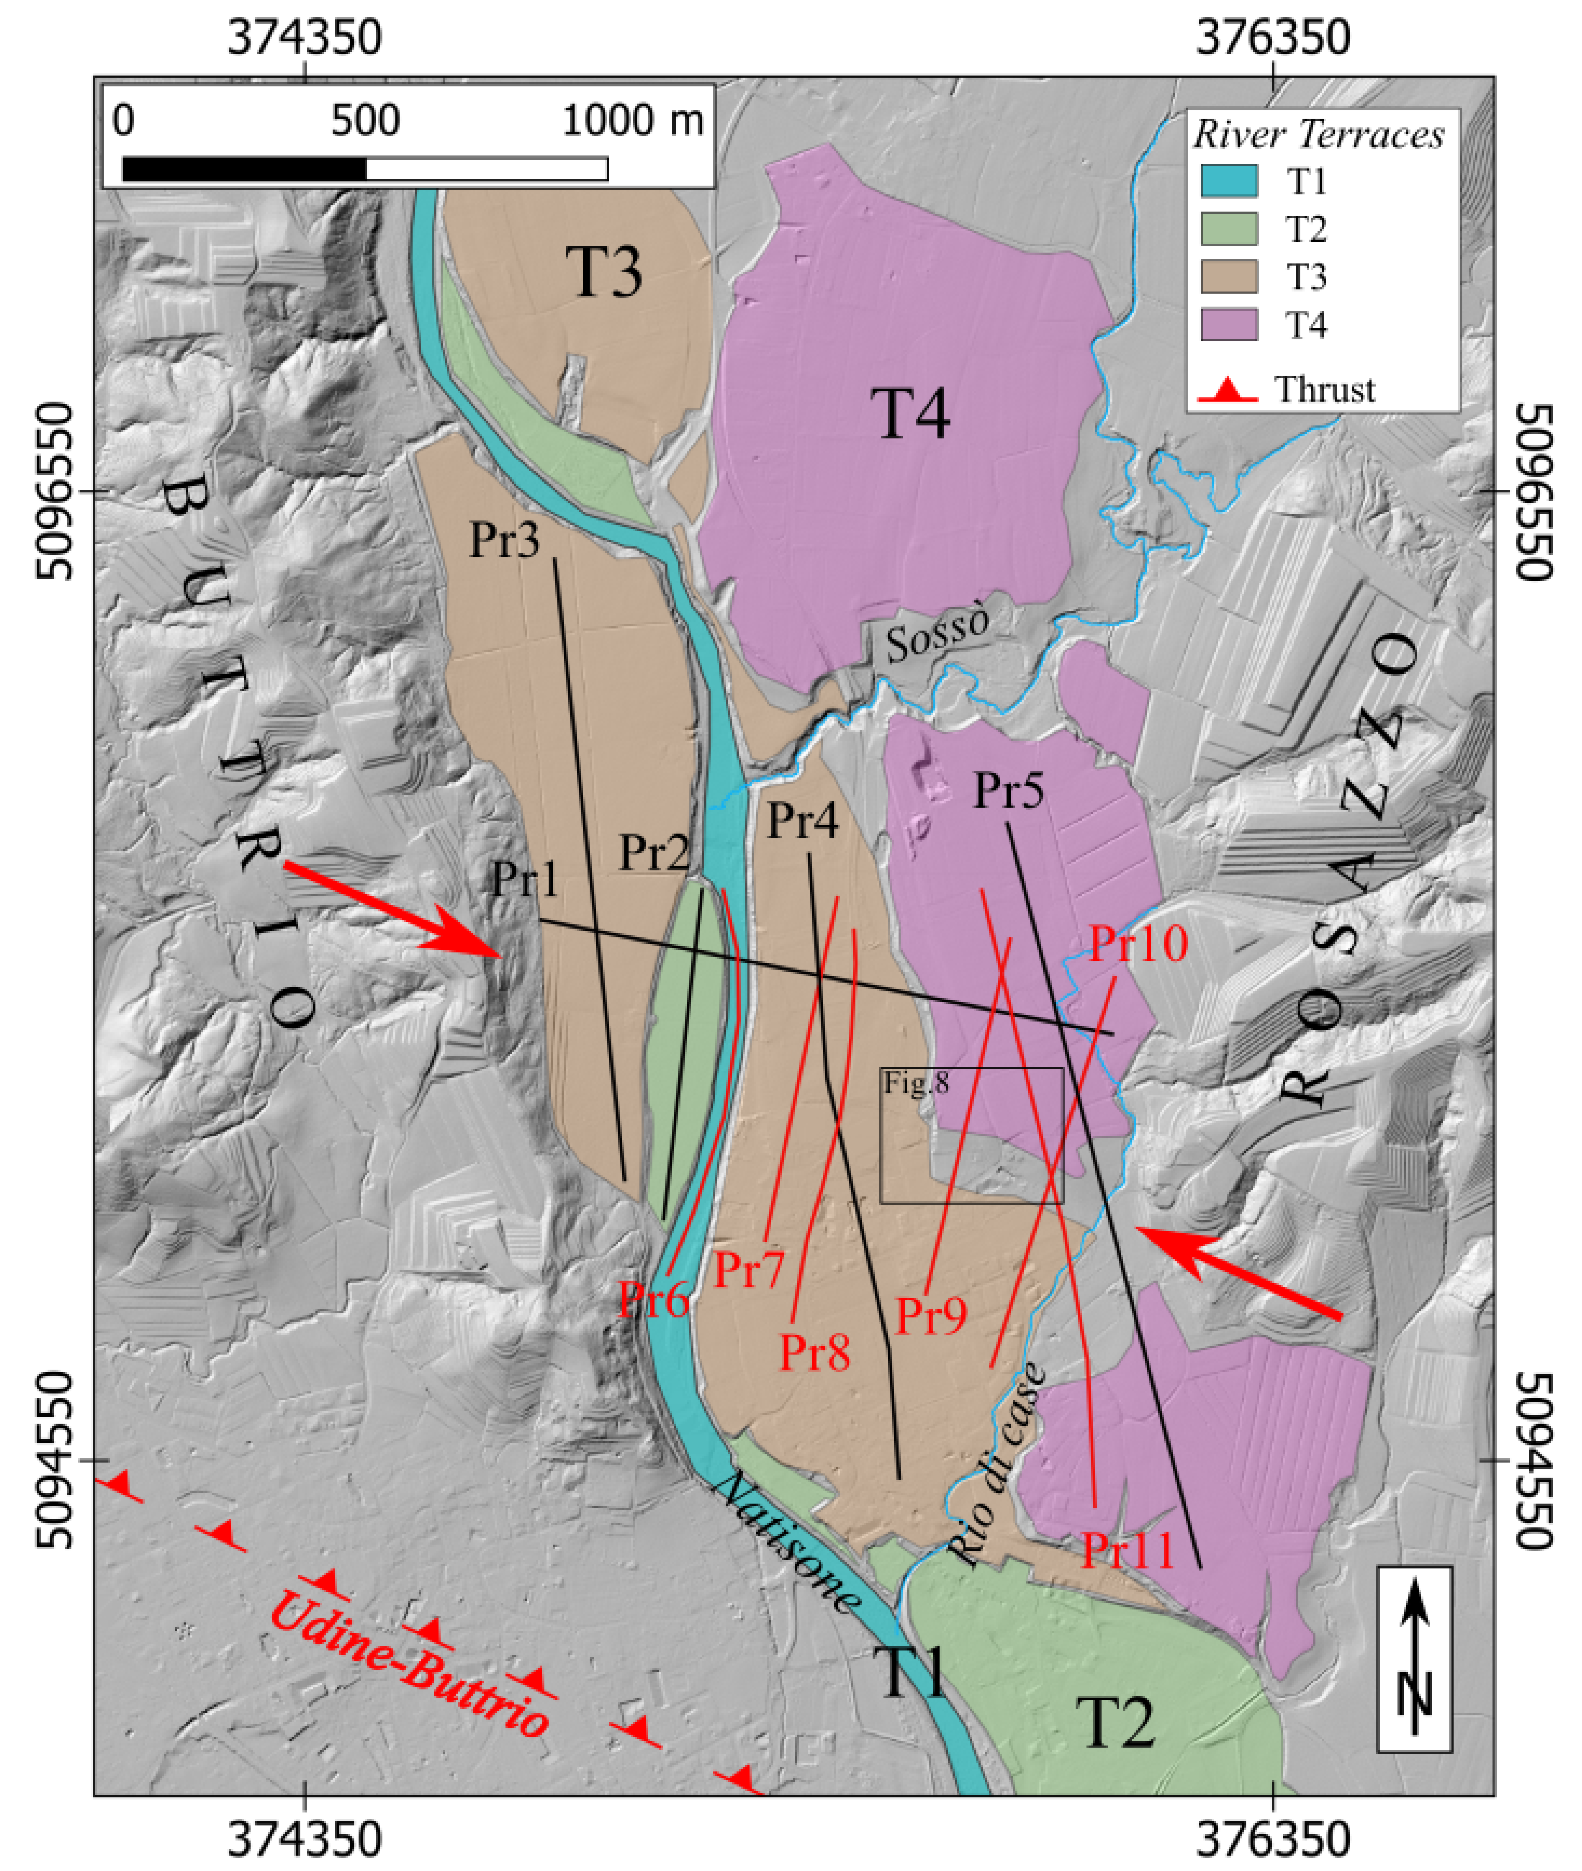
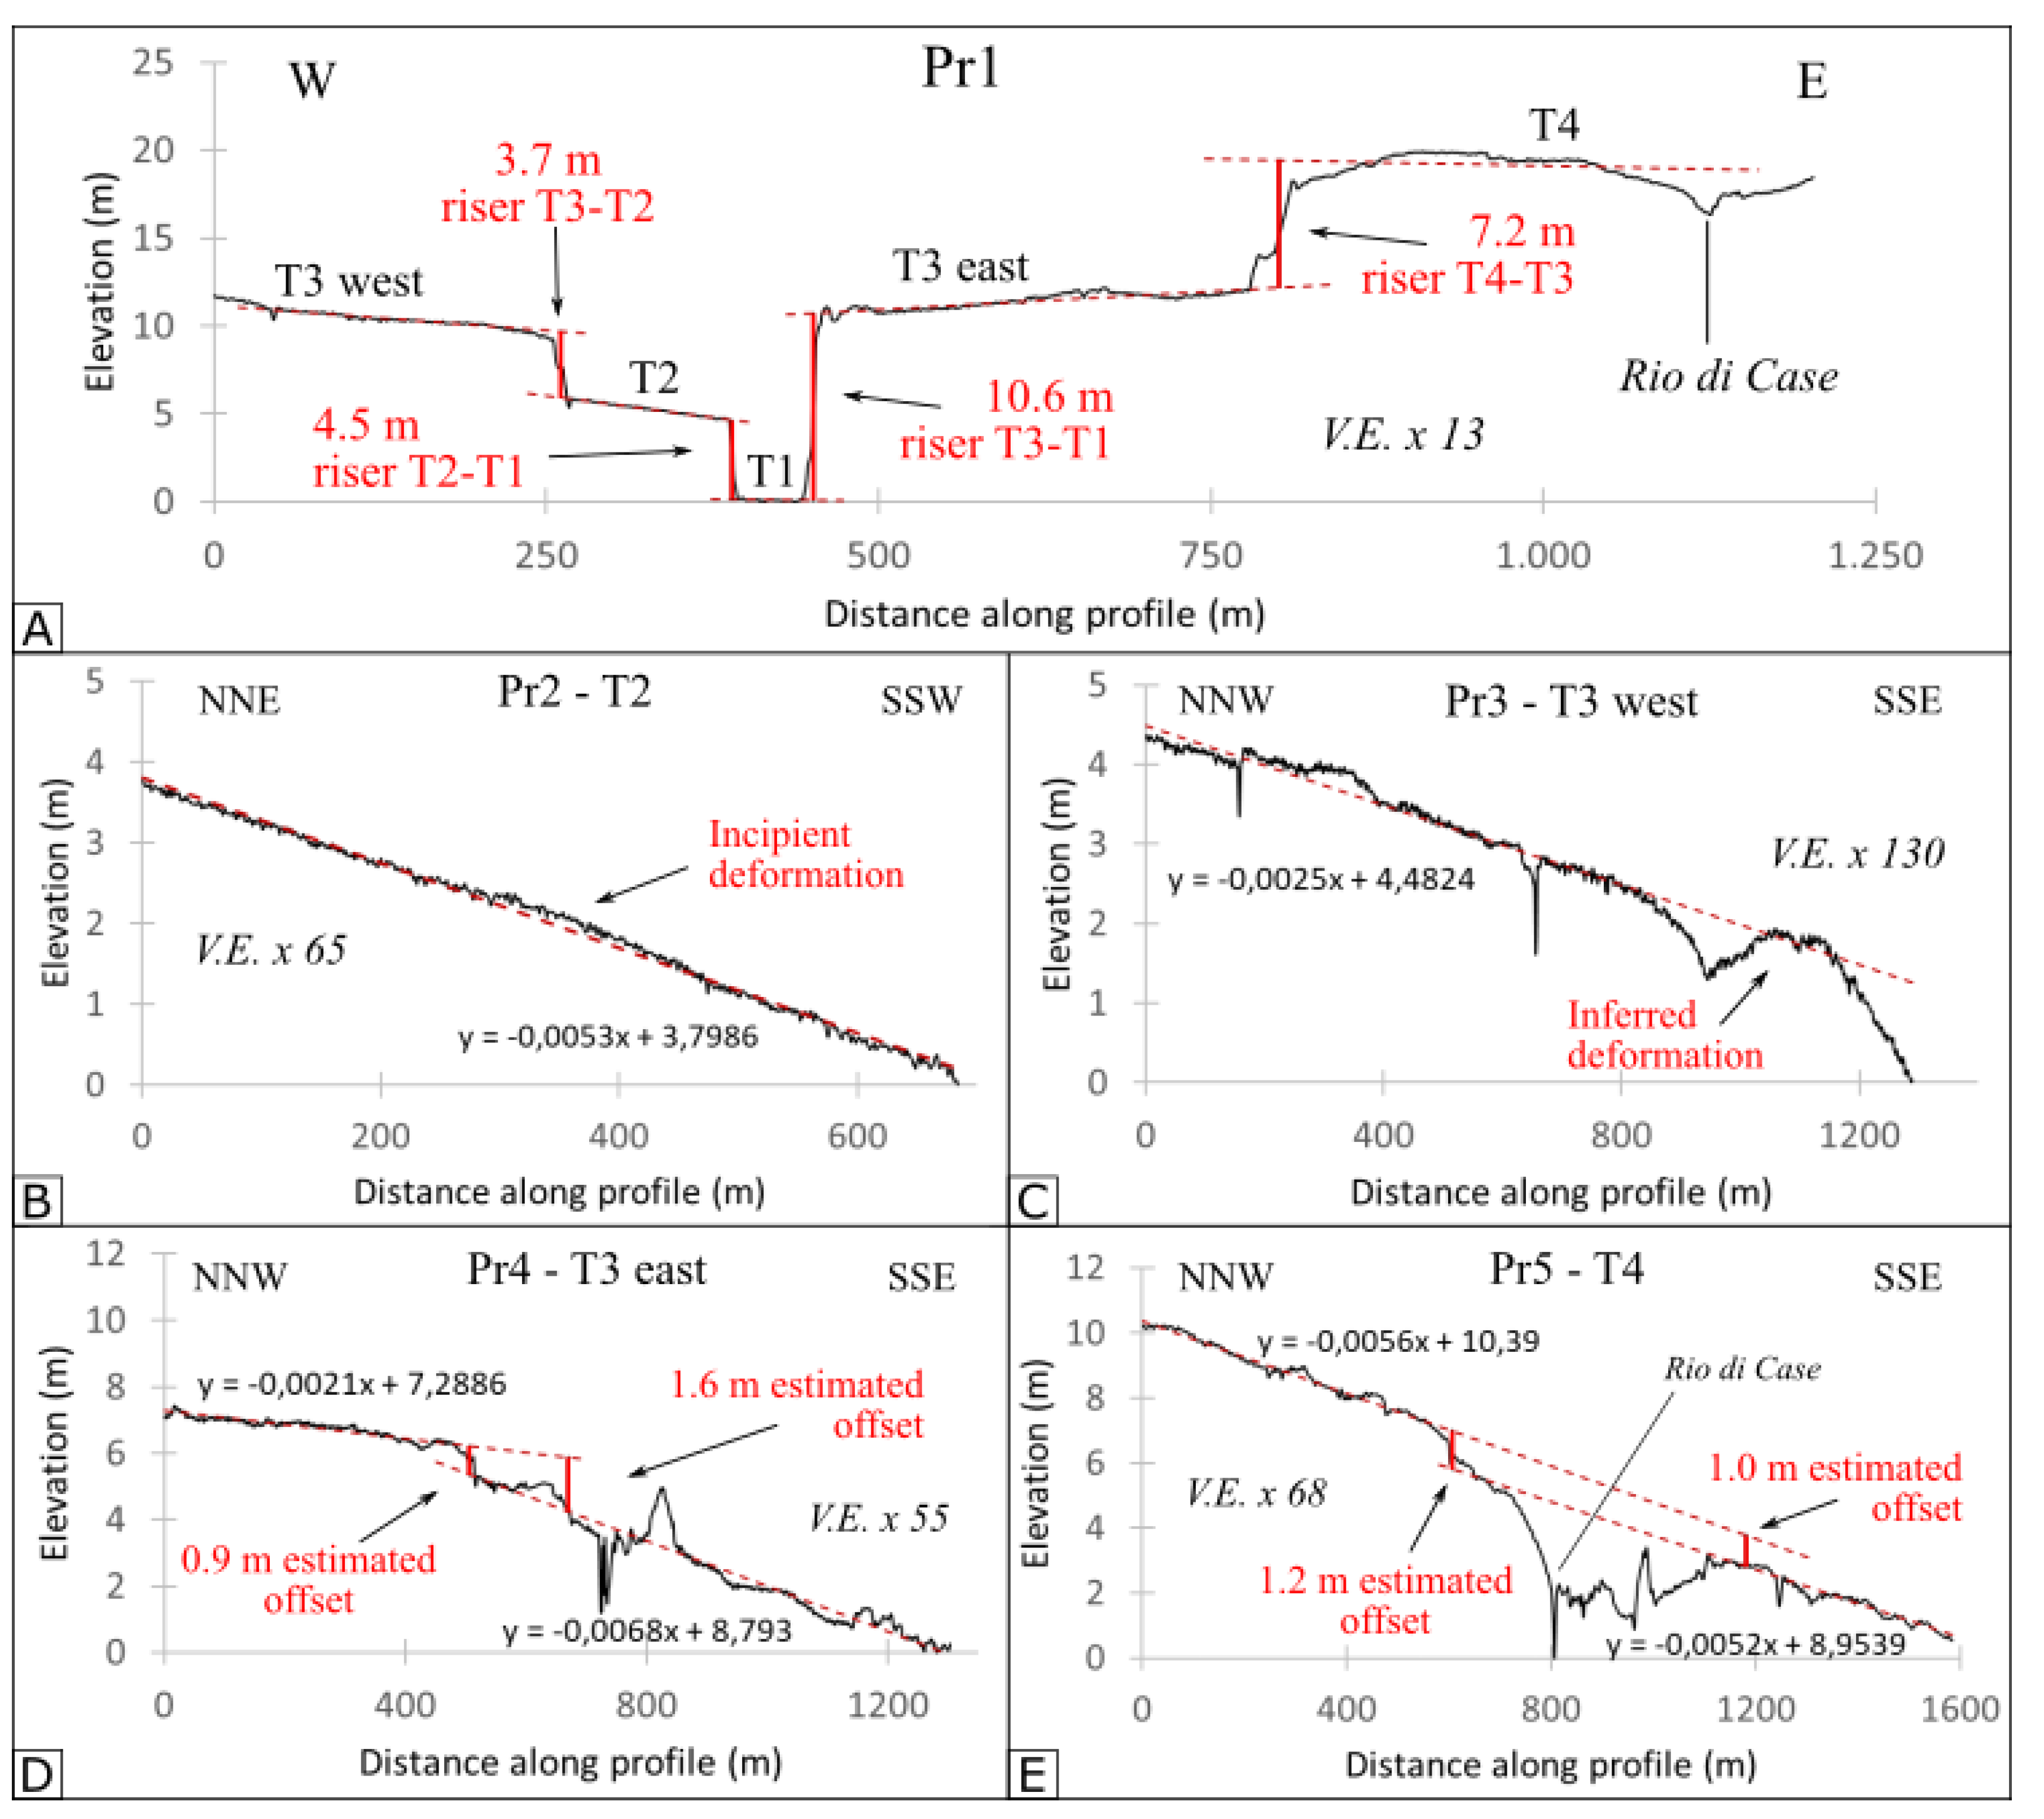
3.3. River Terraces Analysis in the Natisone River Valley

The Natisone valley is located between the hills of Buttrio and Rosazzo, on the western and eastern margins, respectively. By means of slope and elevation maps (Figure 6), we reconstructed the terrace system (Figure 7), developed by the Natisone River during successive, internally stationary phases between aggradation and incision. We identified the flat land areas as terrace surfaces and the sharp erosional escarpments as terrace risers. Then, based on the different elevation levels, we developed a time-hierarchy from the youngest T1, the present-day riverbed, to the oldest T4. The terraces are characterized by a general southward-dipping trend, corresponding to the river’s flow direction.
The oldest T4 terrace is composed of deposits of the Upper Pleistocene Cividale Unit, encompassed in the Premariacco Synthem, which reaches a maximum thickness of almost 20 m in the study area [24,51,52]. The terrace surface is divided into three parts that are preserved only on the eastern side of the riverbed. They share a common slope of around 0.5%–0.6%, dipping towards SSW (Figure 8E). This terrace is located along the western and southern foothills of the Rosazzo relief and is bounded to the west by the terrace riser of the T3 terrace (Figure 8A). The riser has an average height of 7.7 m, as it was measured from a series of W-E profiles. The central surface is disturbed by the incision of the Rio di Case. This gully flows along the foothill in N–S direction and eroded mainly in the southern part of this surface. The effects of this erosion process are represented by the eastward dipping slope, displayed at the eastern edge of profile Pr1, Figure 8A. The southern T4 area is more isolated. It displays no riser along the N–NW margin, just a N-dipping surface, which dips gently towards the Rio di Case, displayed between 900 and 1200 m along Pr5, in Figure 8E.
Terrace T3 is widely preserved on both sides of the Natisone River. Its deposits, as well as those of terrace T2, belong to the Grado Unit, encompassed in the Po Synthem. The deposition period is dated approximately from 8 ka B.P. until the present and the sediment thickness is up to 5–10 m [24,51,52]. In the study area, the T3 terrace encompasses three large surfaces and other smaller isolated areas. On the eastern side of the river, it develops along the riser of T4. On the western side, where T4 is not preserved, it is directly connected to the Buttrio Hill. Towards the centre of the valley, T3 is bounded either by narrow surfaces of the terrace T2, or directly connected to the riverbed level T1 (Figure 7 and Figure 8A). The central part of T3 on the eastern side of the river is described by profile Pr4 (Figure 8D). It runs along the entire surface south of the Sossò channel, with a south-dipping slope changing from 0.2% to 0.7%. A knickpoint is located at around 500 m profile distance. On the western side of the river, the terrace is characterized by a slightly gentler S-dipping trend, around 0.3%, as seen in profile Pr3 (Figure 8C). The smooth shape of the surface is disturbed by a W–E trending warped feature, which can be seen from 900 m profile distance until the southeastern end of the profile.
Terrace T2 is also preserved on both sides of the Natisone River. It is split into three surfaces, two narrow areas developed between the T3 and T1 terraces and a wider region at the southern margin of the map. Profile Pr2, sampling the central N–S elongated portion (Figure 8B), illustrates the SSE-dipping trend of the terrace. The homogeneous slope of around 0.5% is affected by a subtle folding feature at about a 400-m profile distance. This fold is 20 cm-high and 150 m-wide.
According to Zanferrari et al. [51], Tunis et al. [52], and Croce [24], the T1 riverbed surface started to develop around the 4th century AD and its deposits, still modified by the river, belong to the Monastero Subunit, encompassed in the Po Synthem.
On the western side of the river, only two smooth surfaces, T2 and T3, were identified. The eastern side of the river has a more complex system, T1–T4. A first discontinuity is formed by the NE–SW, striking Sossò channel incision, separating terraces T3 and T4 into northern and central parts. Towards the south, a second significant morphological element is represented by a WNW–ESE striking, south-facing scarp. This lineament develops along the southern margin of the central T4 surface. At the scarp location, T3 extends towards the east almost until the Rosazzo Hill. This feature is characterized by a slope of about 7%–10%, measured at its steepest point along profiles Pr9 and 10 (Figure 9D,E). These values are much lower than those of the terrace risers in the study area. The strike of this scarp is perpendicular to the river terrace system.

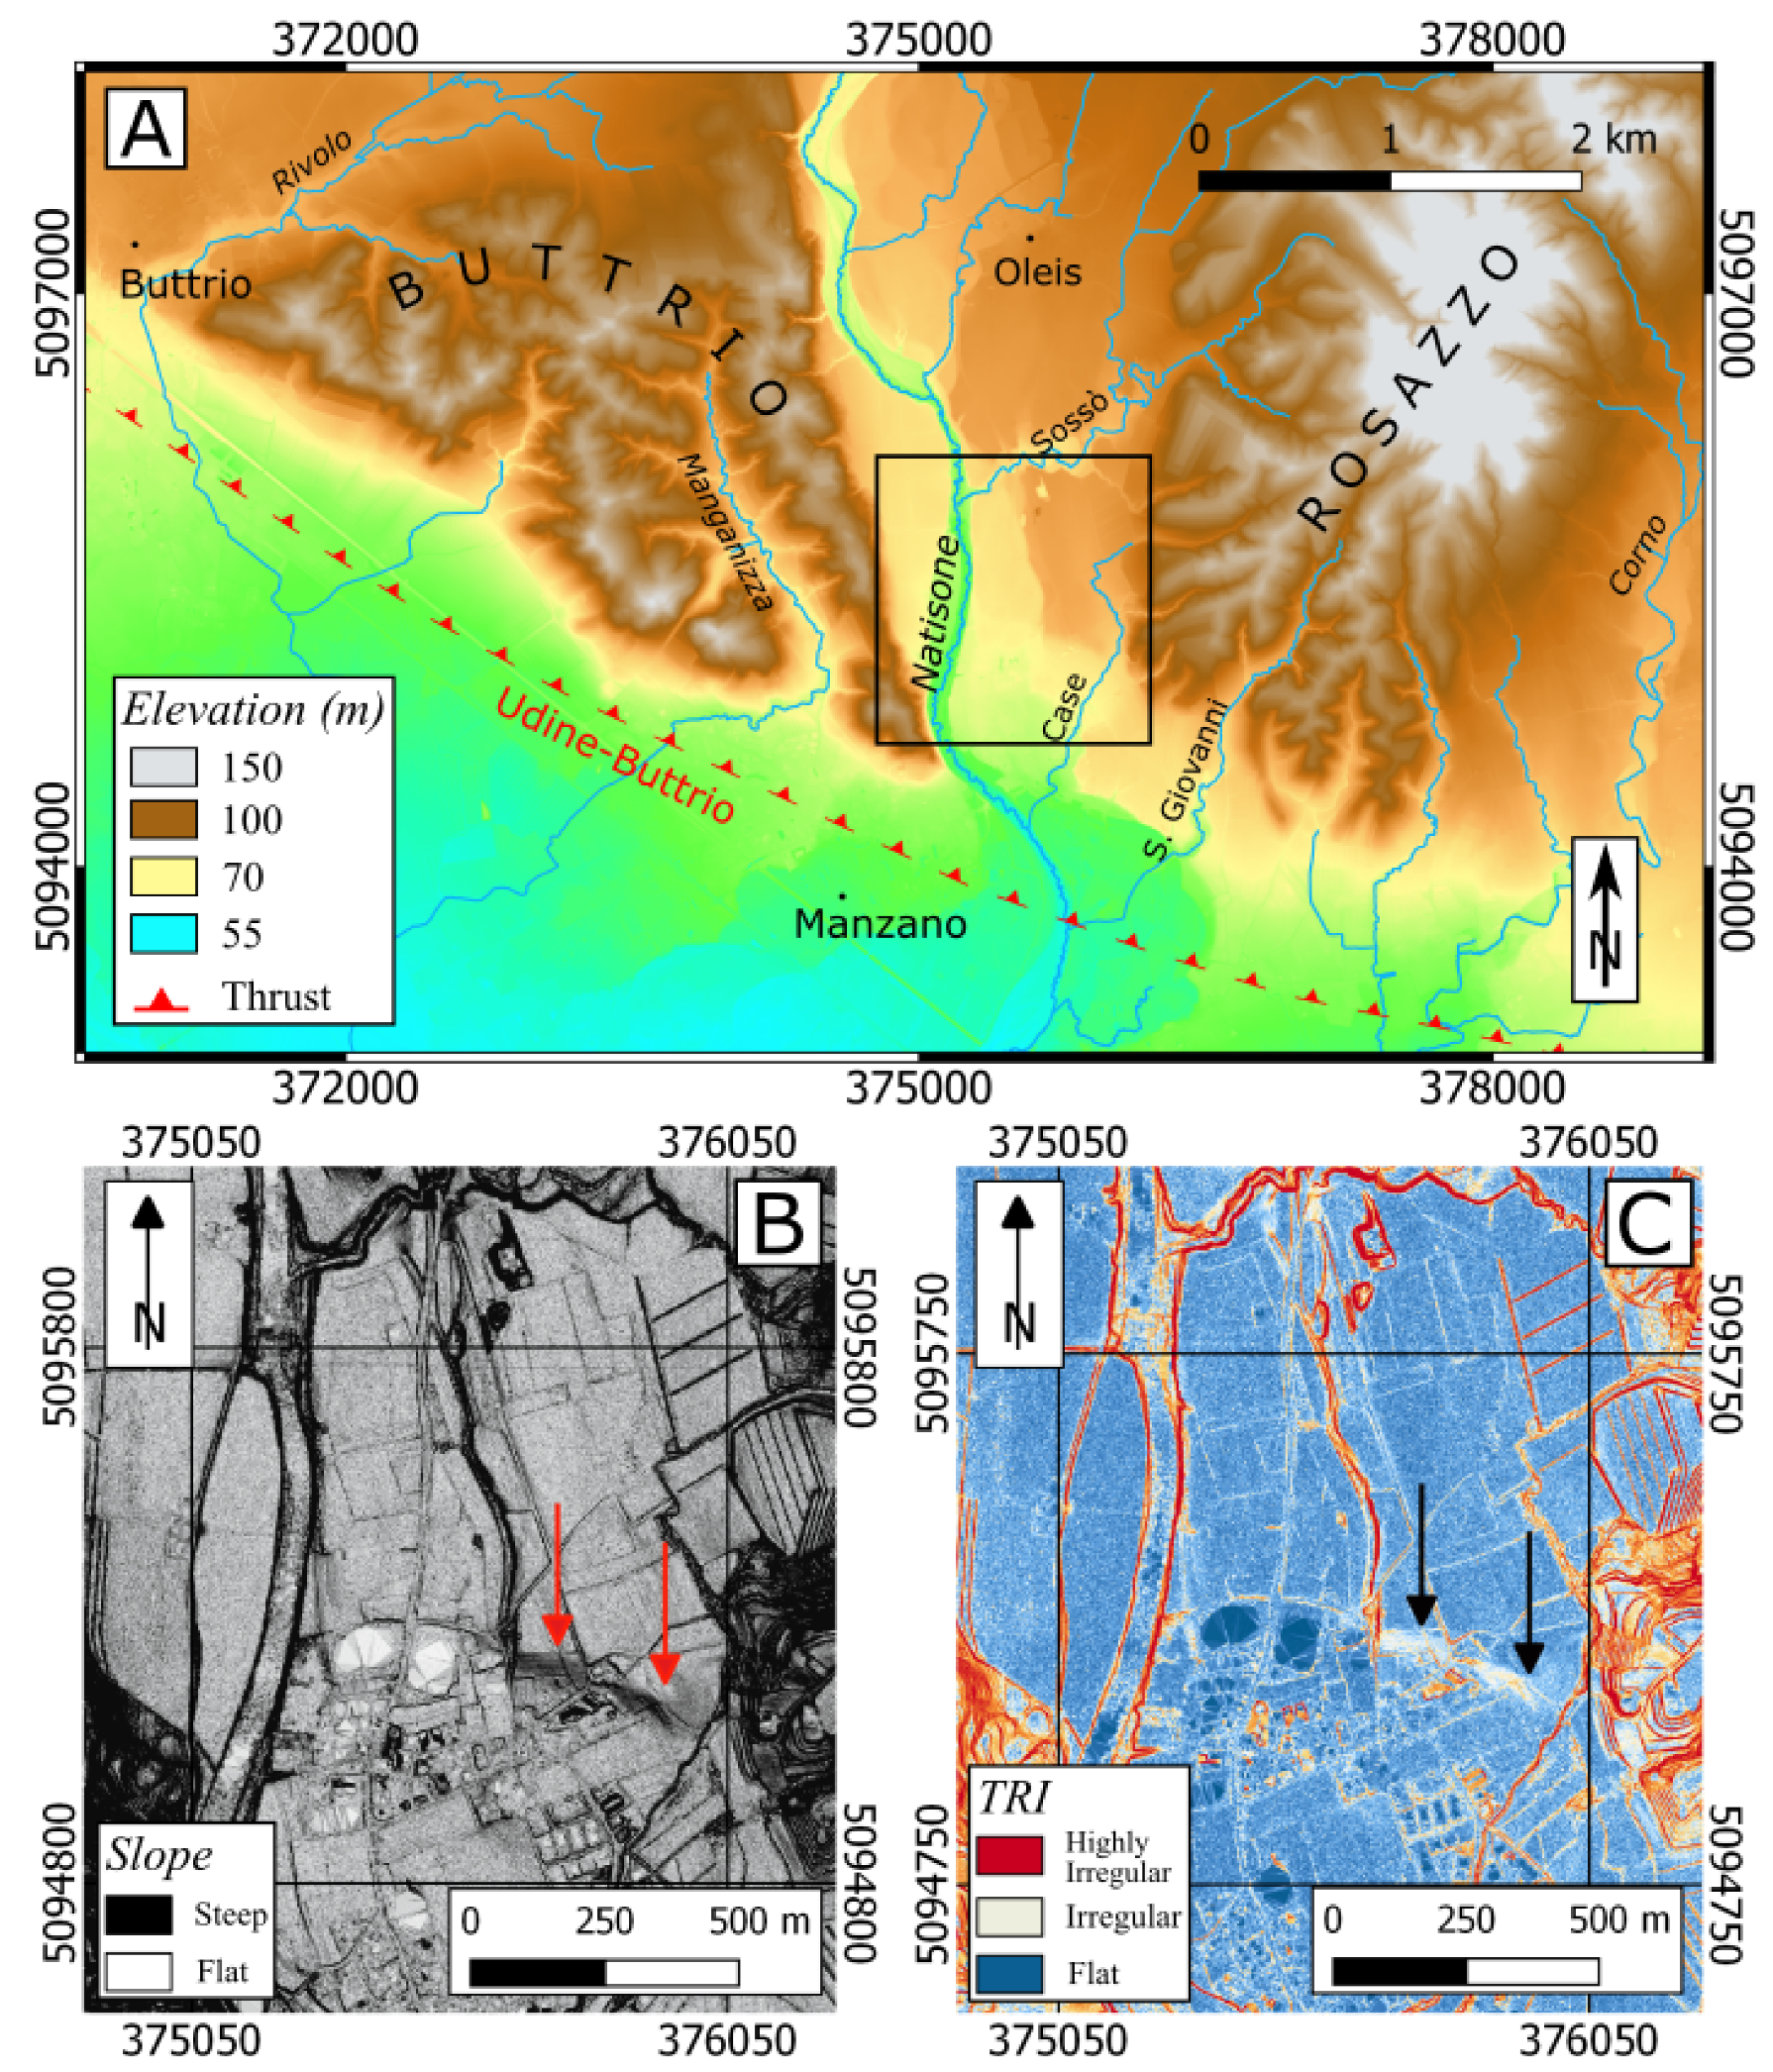
3.4. Tectonic Scarp Analysis

The WNW–ESE striking scarp on the eastern side of the river is a significant perturbation of the flat landscape, highlighted by arrows on the slope and TRI maps in Figure 6B,C. From these maps, it is possible to observe the scarp for ca. 350 m, from the terrace riser between terraces T4 and T3 to the Rio di Case. The strike direction of the scarp is parallel to the Udine-Buttrio Thrust and perpendicular to the Natisone Riverbed, suggesting a tectonic origin. Furthermore, it aligns with lineaments in the hills on either side of the valley (Figure 5B). On the eastern side of the river, terrace T3 is affected by the scarp but it is inhabited and hosts industrial buildings, which limit access to the feature. On the western side of the river, the agricultural land covers terraces T2 and T3, but they do not exhibit significant breaks in slope.

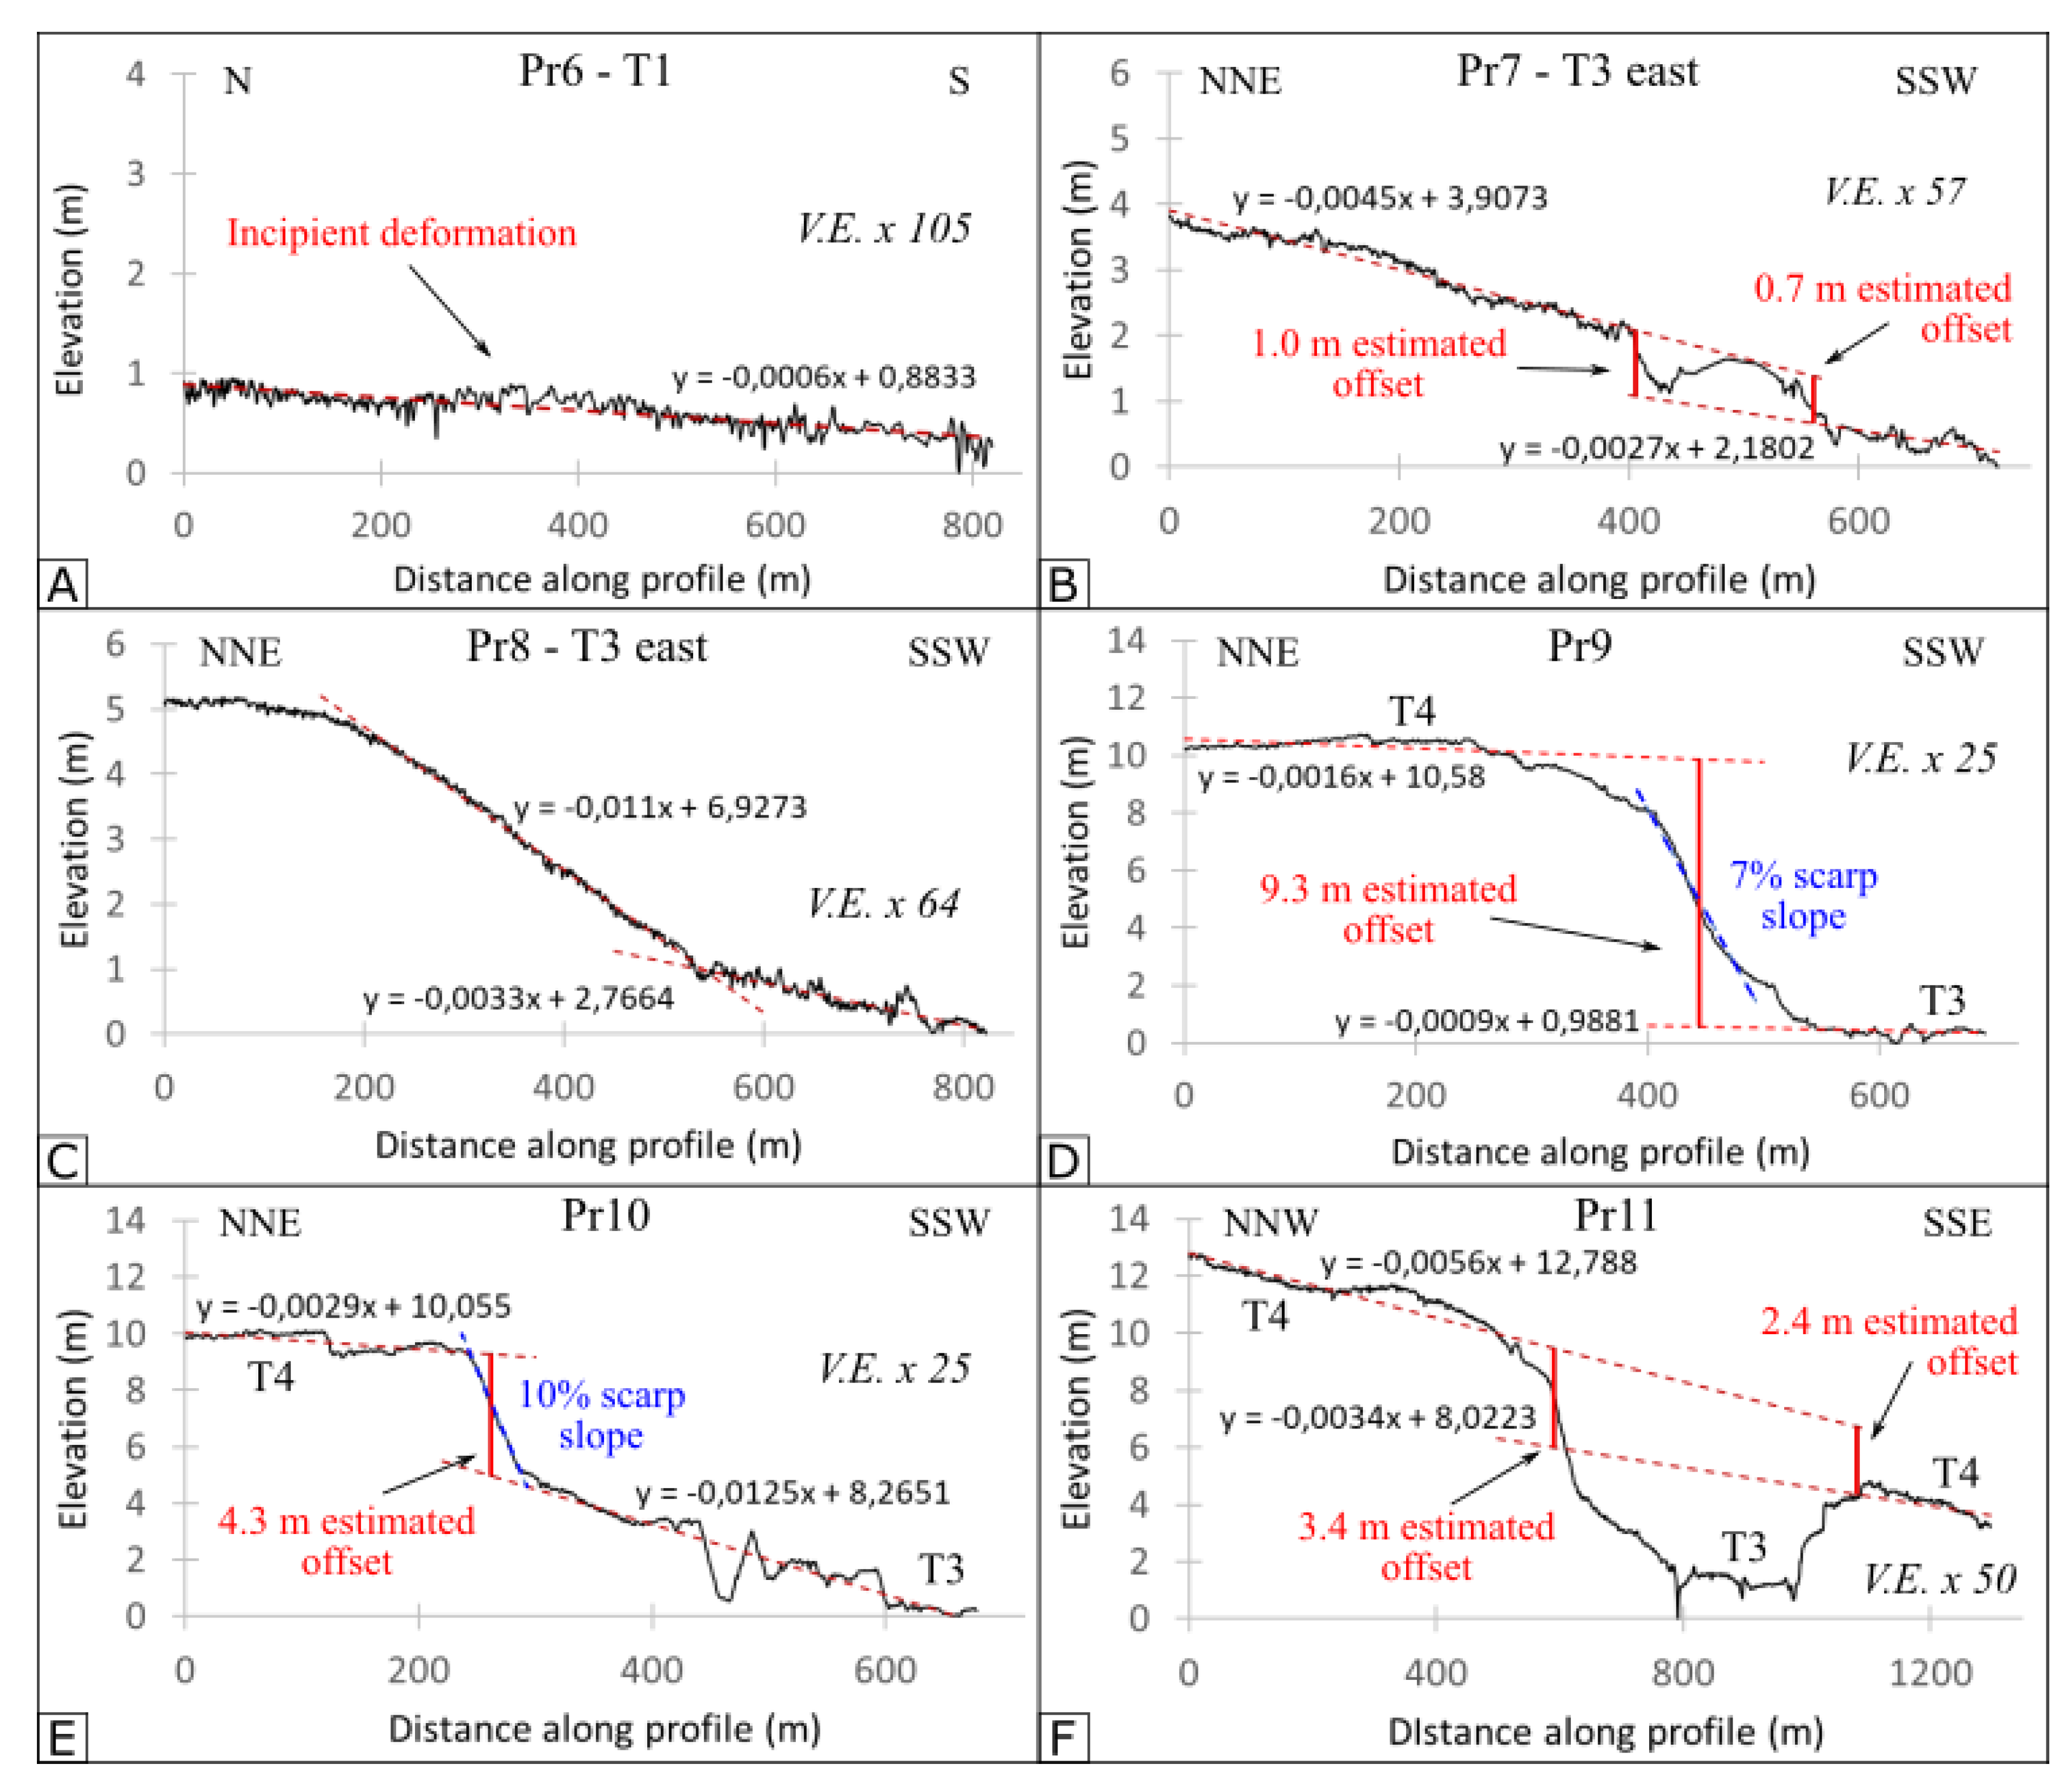
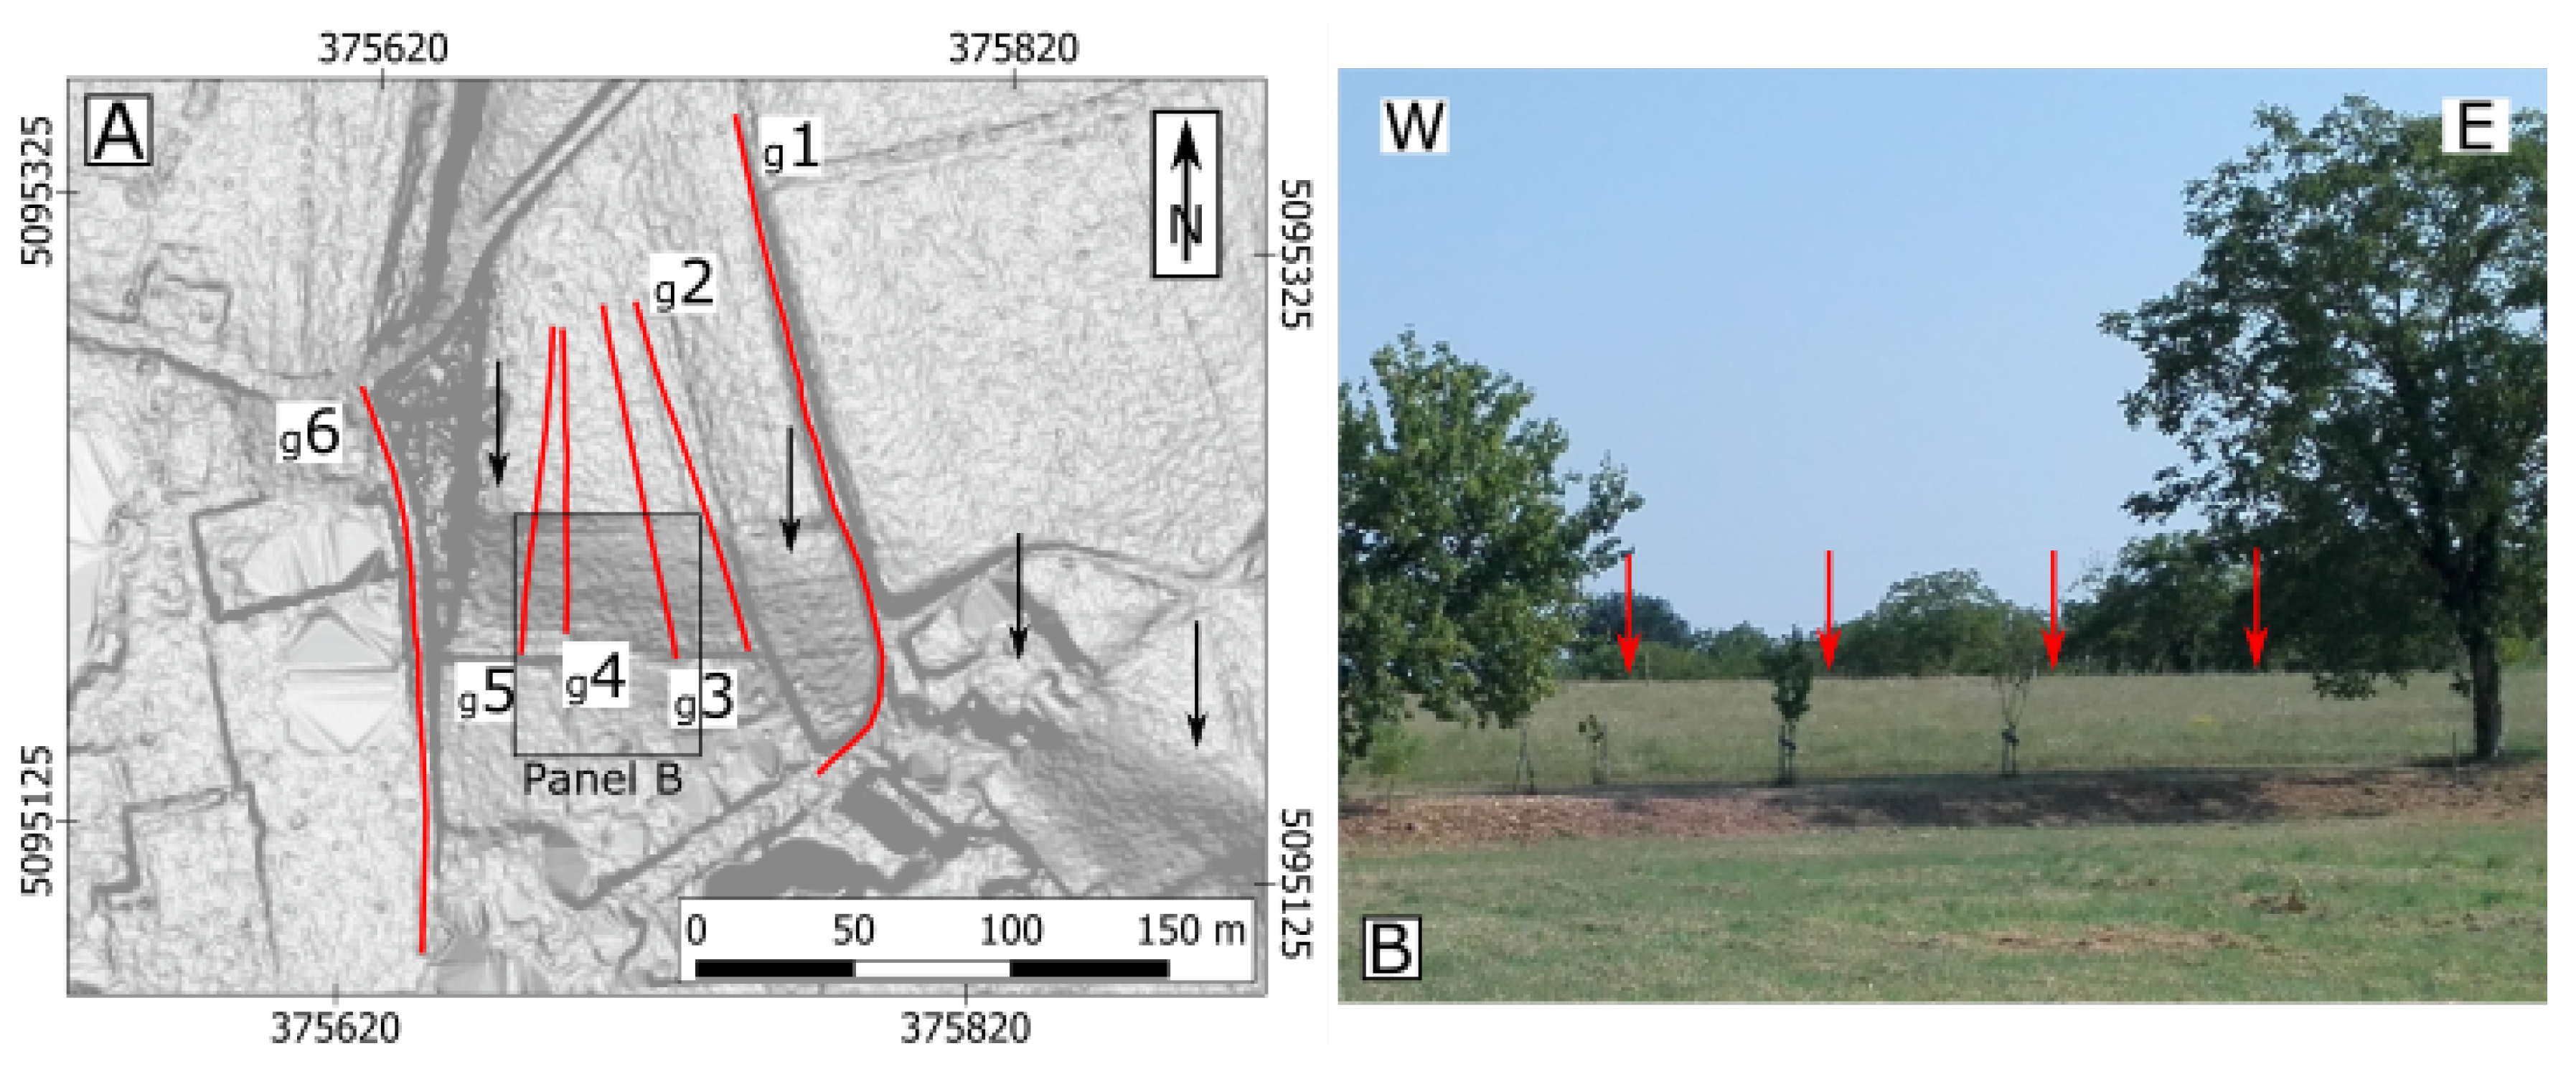
3.4.1. Geomorphological Analysis—Offset Estimates

We used topographic profiles from the high-resolution DEMs to measure the offset across the scarp. As shown in Figure 7, the scarp develops along the southern border of the central T4 river terrace. Its vertical offset decreases from west to east from 9.3 m in profile Pr9 to 4.3 m in profile Pr10 (Figure 9D,E) because of the erosion produced by the Rio di Case. Therefore, we considered the westernmost estimate in order to minimize the effect of the erosion on our calculations. This offset corresponds to the vertical separation between terraces T4 and T3. However, if we consider the 7.7 m-high terrace riser between T4 and T3, averaged among a series of four W–E trending profiles and we subtract it from the total offset estimate, then we can attribute the remaining 1.6 m to tectonic uplift. Further estimates of this deformation were based on profiles Pr5 and 11 by fitting the slope trends of the central and southern T4 portions. We found that the latter is slightly tilted compared to the former, as shown in Figure 8E and Figure 9F. This tilt may be of tectonic origin but apart from the topographic profiles, there is no way to prove this. Thus, the vertical tectonic offset values vary for T4 between 1.0 and 3.4 m (Table 1).
Terrace T3 also displays deformation. On both sides of the Natisone River, the surface presents a break in slope accompanied by a warped pattern, outlined in profiles Pr3, 4, and 7 (Figure 8C,D, and Figure 9B). On the eastern side of T3, such concave-shaped features can be attributed to the presence of industrial buildings. A rather different behaviour is obtained by extracting profile Pr8 along a road. As displayed in Figure 9C, the perturbation is homogenously distributed along a 400 m-long slope, which terminates with a sharp knickpoint. By extracting a series of five profiles, we estimate the vertical offset to 0.7–2.5 m (Table 1). On the western side of the river the bulge pattern, displayed in Figure 8C, cannot be related to man-made structures, since the land is only agriculturally used. Therefore, we ascribed the observed bulge pattern to shortening. Unfortunately, no offset estimates could be obtained from this feature because the southern continuation of the terrace surface is missing.
We detected subtle signs of an incipient contractional deformation also along profiles Pr2 and 6, related to the youngest river terraces T1 and T2, respectively. Both profiles, reported in Figure 8B and Figure 9A, display a 0.15–0.20-m-high fold with 150 m wavelength, similar to the one reported by Grützner et al. [44] from a thrust fault in the Tien Shan. These observations are consistent with the overall deformation pattern. Thus, the younger terraces display less deformation than the older ones.

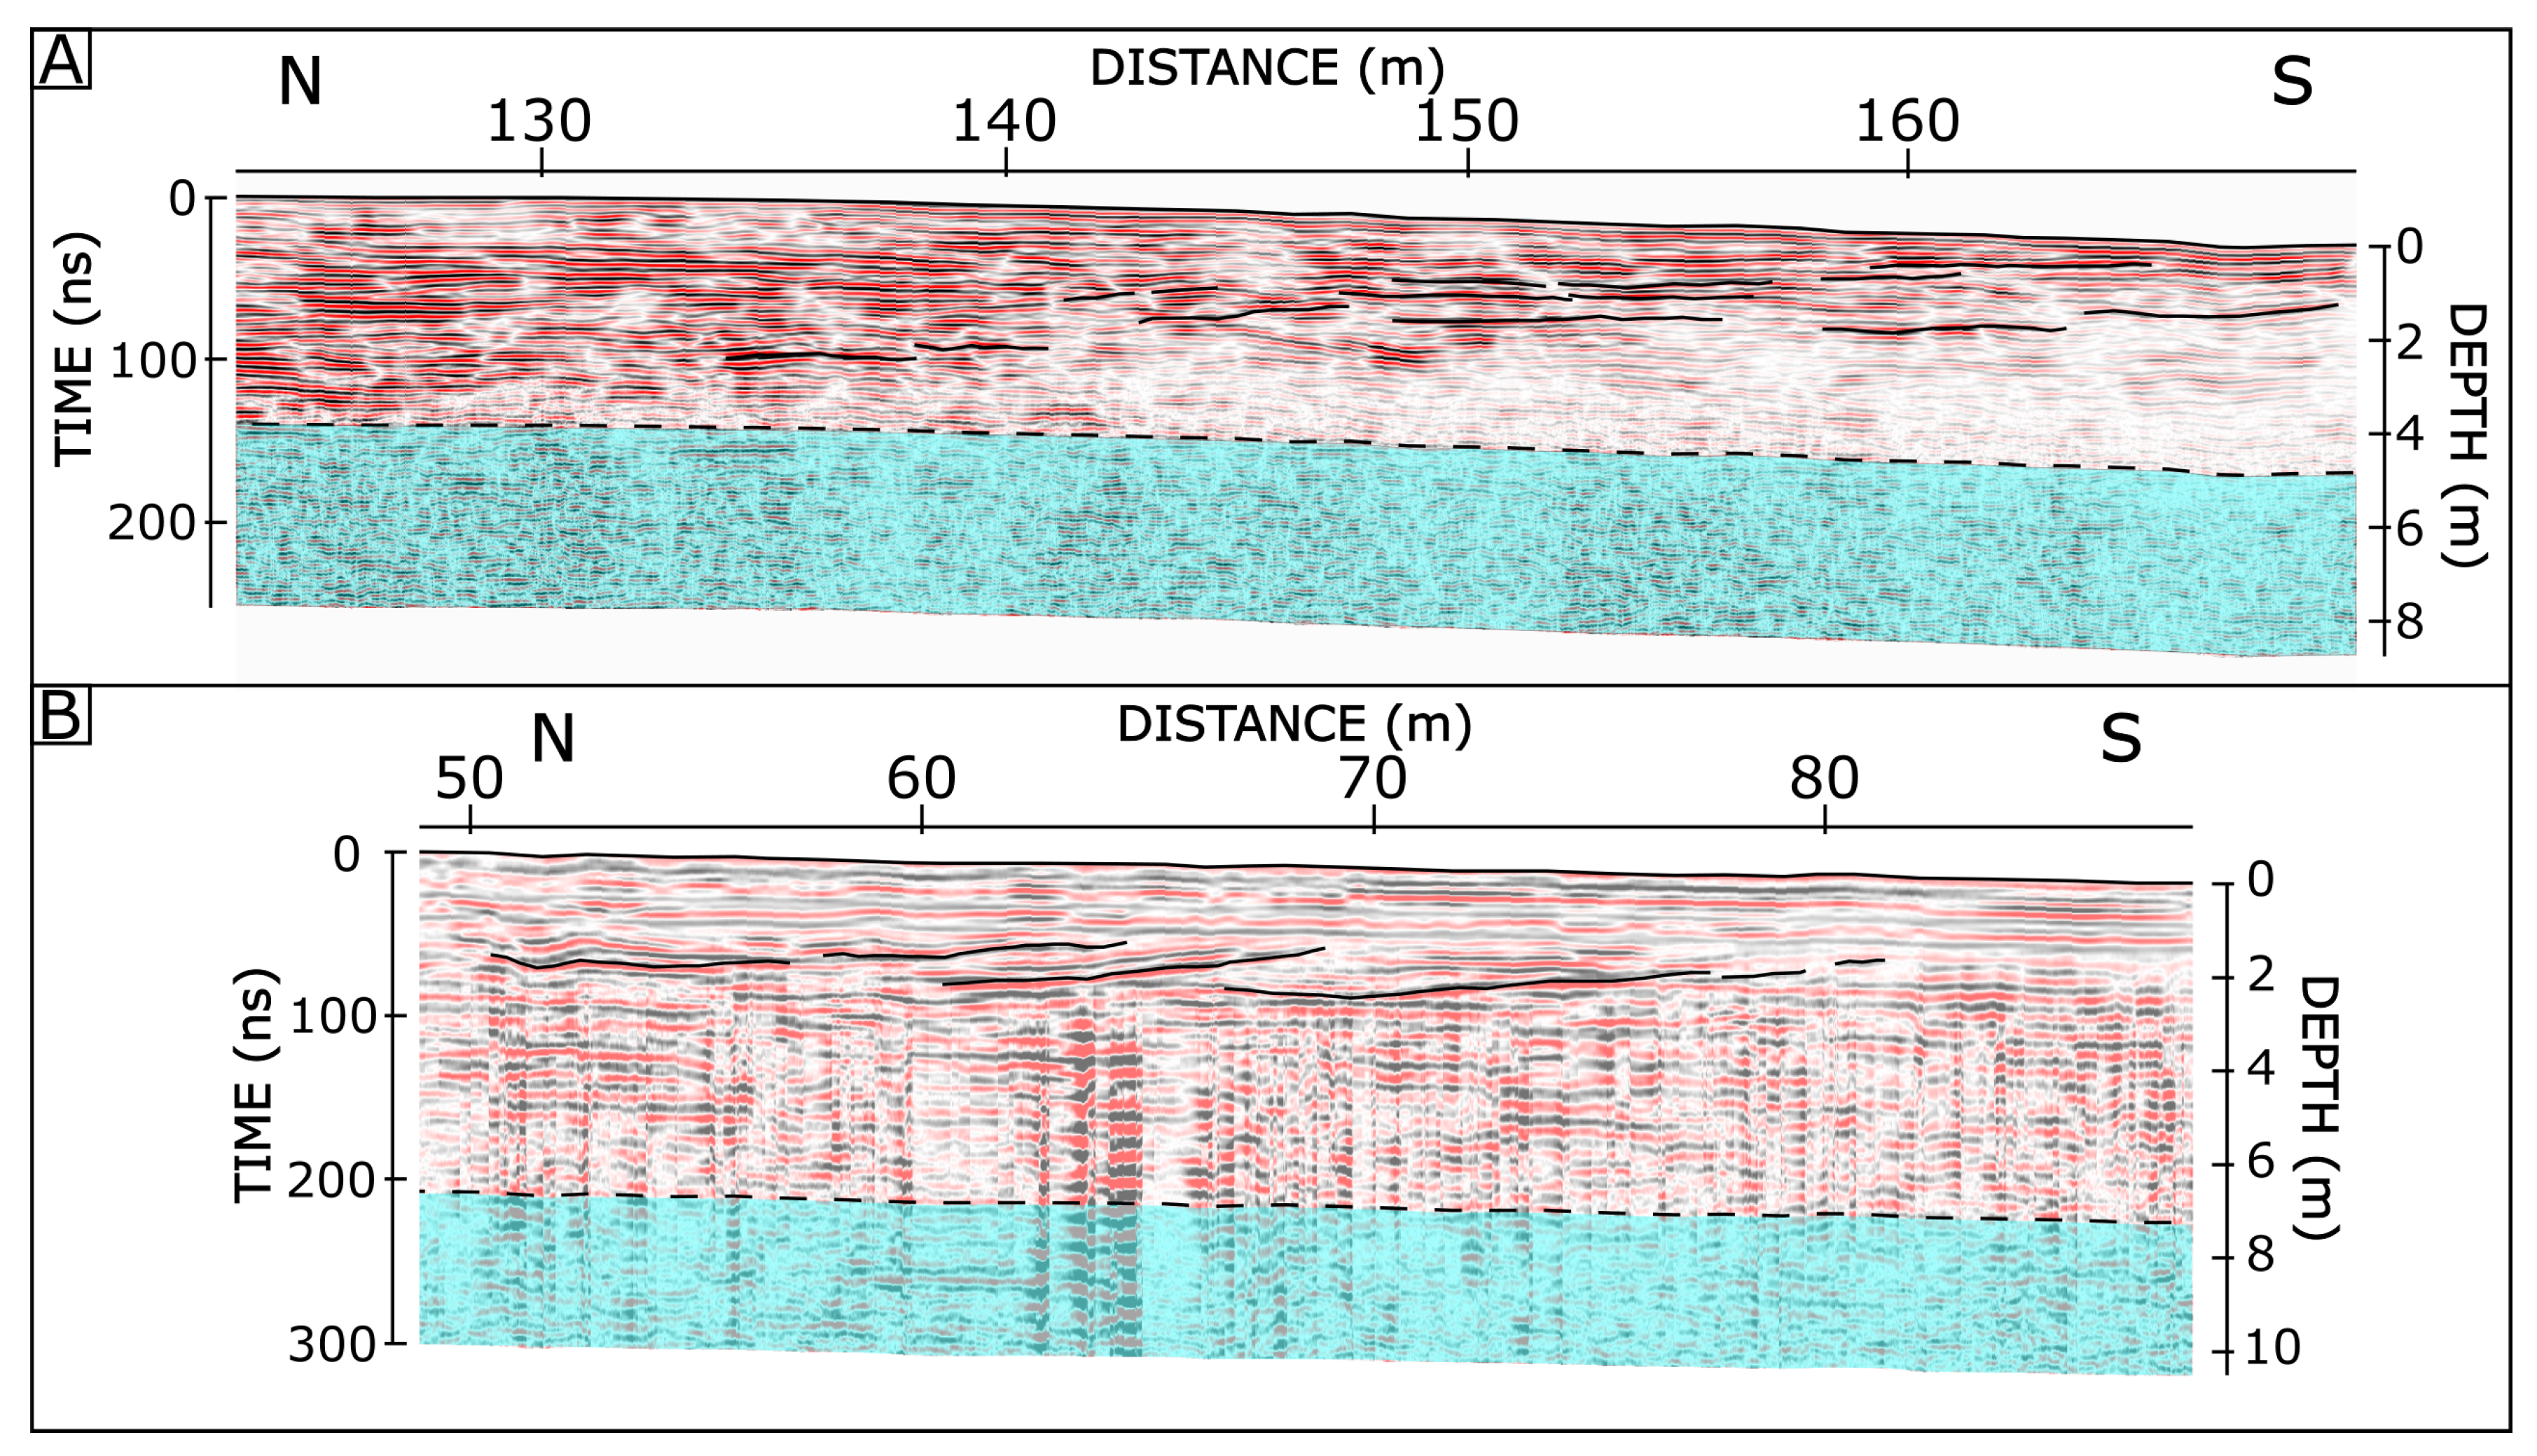
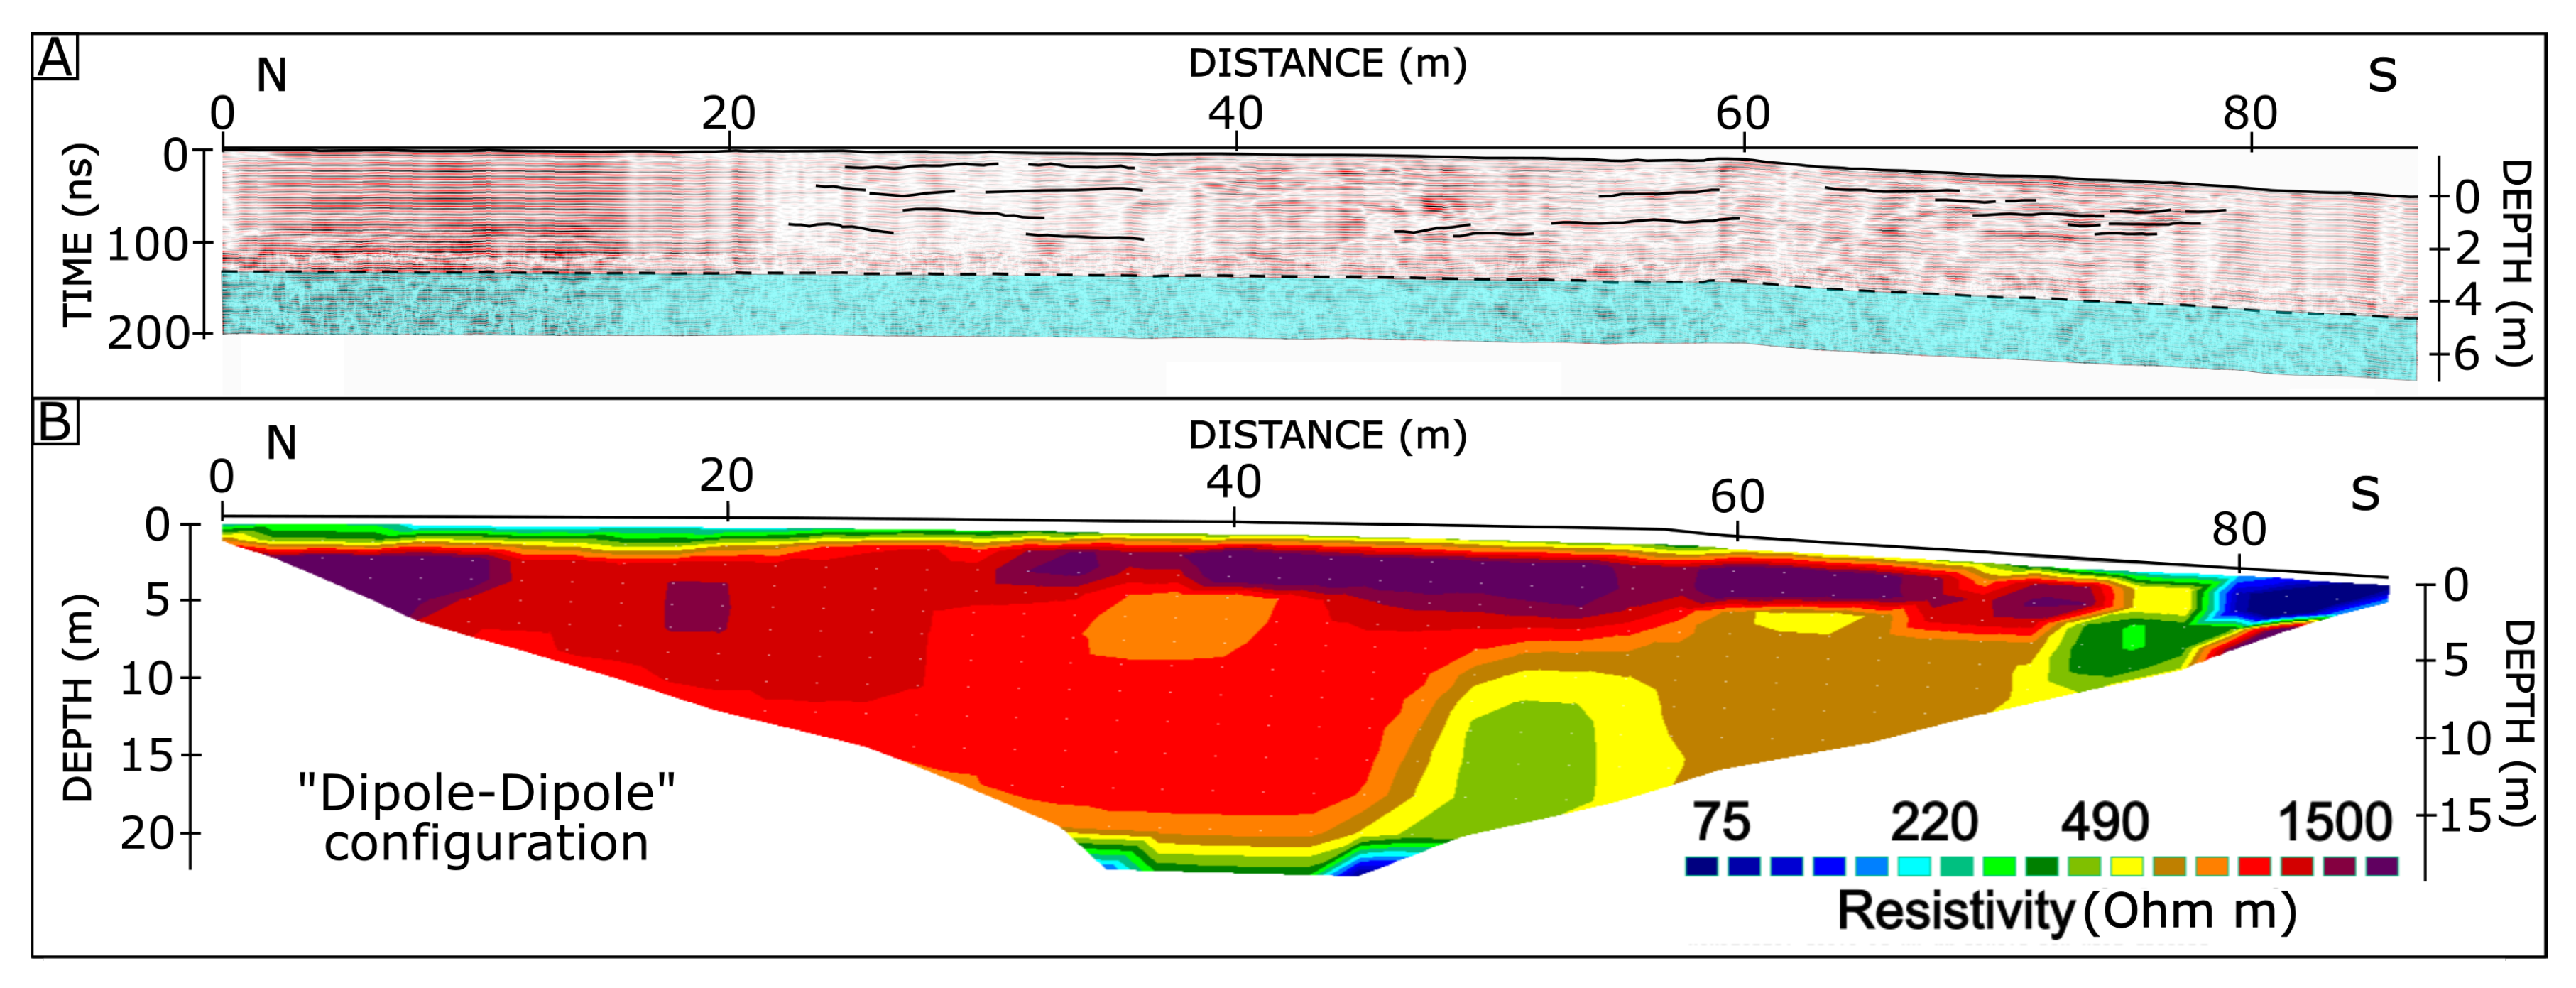
3.4.2. Geophysical Surveys

With the geophysical surveys, we aimed to image deformed or tilted strata that would allow further insights into the active tectonics of the area. Geophysical profiles were recorded across the scarp on a field. Eleven GPR profiles were collected with the 100 MHz and 270 MHz antennae. Two profiles were surveyed with ERT in Wenner and Dipole–Dipole configurations. In total, the geophysical data cover six different tracks (Figure 10A).
Profiles g1 and g6 were recorded with both 100 and 270 MHz antennae. They were 220- and 180-m-long, respectively. In Figure 11A,B we only show the sections that are located around the scarp. The 270 MHz radargram (profile g1) is characterized by a set of north-dipping reflectors that are visible down to 4 m depth. The dip direction is opposite the S-dipping slope and the river course. We interpret these reflectors as back-tilted layers in the hanging-wall of a blind fault. On the other hand, such geometries could also represent a primary depositional pattern of a fluvial system. An effective way to prove this would be to dig a trench and to run a sedimentological analysis, but we did not undertake this yet. Due to high noise, no interpretation was attempted beneath 5 m depth (130 ns). Profile g6, reported in Figure 11B, is characterized between 2 and 4 m depth by a similar north-dipping reflection pattern. Below the scarp location, we observed a set of high-amplitude, north-dipping reflectors in the other GPR profiles as well, with the exception of profile g2. GPR profile g5 is mainly characterized by attenuated reflection patterns, with persistent horizontal layers and sporadic small perturbations (Figure 12A). These characteristics are the same as those that we encountered in profiles g2, g3, and g4.
The electrical resistivity section reported in Figure 12B was recorded along the same profile as GPR profile g5. Both sections, recorded in the Dipole–Dipole and in the Wenner modes, are characterized by a high-resistivity layer that developed in the middle of the section from the surface down to 10–15 m depth. We interpret this layer as a locally developed, well cemented conglomerate in the gravelly fluvio-glacial soft sediments of the Premariacco fan sequence. The high-resistivity layer terminates at around 75 m of profile distance. Another high-resistivity layer then seems to continue at a greater depth. We interpret this as the most likely location of the fault reaching the surface. Around 50 m of profile distance a peculiar low-resistivity, plume-shaped feature determines a second, rather sharp discontinuity. However, there is no evidence that indicates whether the two discontinuities are connected to the same structure or not. Unfortunately, due to limited property access, it was not possible to run a longer profile, which would have enabled a better image of this section.

4. Discussion

The presence of vertically offset LGM and post-LGM surfaces all along the main Udine-Buttrio Thrust proves that the fault is active. The vertical offsets vary between a few and ten metres (Figure 3, Table 1). Folding in the hanging wall of the fault can be identified in some profiles, while at other places no systematic offset can be detected. This may be either caused by changes in fault geometry at depth, e.g., variations in dip angle or depth to decollement, or it is due to different ages of the sediments that record the offset. We assumed an age of 20 ka for the sediments offset along the main Udine-Buttrio Thrust [7,20,22,23,24]. The resulting vertical uplift rates since the LGM are ≈0.16–0.5 mm/yr (Table 1). Instead of rather sharp offsets, we observe at the eastern end of the fault long-wavelength folding (Profile 6 in Figure 3). Profiles 3 and 4 also indicate incipient anticlinal growth in the hanging wall of the thrust.
Several lines of evidence support a post-LGM tectonic origin of the scarp in the Natisone River valley. (i) The morphology and trend of the break in slope is different from that of the many terrace risers found in the area. The slope angle of the scarp is much lower than that of the terrace risers, and the scarp is not parallel to the terrace risers, but runs from WNW to ESE. This direction is parallel to the Udine-Buttrio Thrust. This makes a fluvial origin of the feature unlikely. (ii) We identified vertical offsets varying between 1.0–3.4 m in terrace T4, between 0.7 and 2.5 m in terrace T3, and incipient folds in the younger T2 and T1 surfaces. Therefore, the scarp did not form in a single event, but must have evolved systematically over time. (iii) The scarp is present on surfaces with different land uses (agricultural, industrial, housing, modern riverbed). We can therefore rule out an anthropogenic origin. (iv) The vertical offsets have the same direction as the long-term deformation trend in the area, that is the tilt of the surface of the Buttrio Hills. The presence of long-term uplift processes affecting this area was already suggested by Carobene [50]. (v) GPR data show north-dipping reflectors, which may reflect either a back-tilted hanging-wall or an undisturbed channel depositional pattern. (vi) ERT data show an abrupt termination of a high-resistivity layer that may correspond to the actual fault location. (vii) Lineaments in the projected continuation of the scarp can be seen in the DEMs of the hills on either side of the valley. In conclusion, we can rule out an anthropogenic origin as well as any other geological process that would result in such a feature. We ascribe the scarp to a splay fault of the Udine-Buttrio Thrust that affected the terrace system (see Figure 13). However, such a feature should not be confined to the Natisone River valley only. Although the swath profile across the Buttrio Hill does not exhibit a fault scarp (Figure 4), in the hills on either side of the valley lineaments with a trend parallel to the scarp can be identified in the LiDAR-DEM (Figure 5B). These lineaments align with the scarp in the valley and were also mapped by Carobene [50] as faults, although not necessarily active. We interpret them as the geomorphic expression of the splay fault found in the offset terraces.
Several uncertainties have to be taken into account when analysing the offsets in the river terraces. In the area between the eastern T3 and the central T4 surfaces the scarp neither looks like a typical terrace riser nor like a classical young tectonic scarp (see Figure 8E). We interpret its shape to be the result of the erosion process, which took place along a newly generated tectonic discontinuity that developed on the T4 terrace. Here, the total vertical offset measured at the steepest point of the scarp is the sum of the T3-T4 terrace riser height plus the tectonic component. The back-tilted, NNW-dipping surface between the Rio di Case and the southern part of T4 has a peculiar geometry. We attribute its gentle slope trend to the same compressional tectonic effect that drove the relative subsidence of this southern part. Because of the lowering of the depositional level, the two slopes were further carved by the erosion process, developing a rather wide trough between the central and southern T4 terrace surfaces.
The vertical offsets (Table 1) extracted from the different terraces come along with uncertainties that hamper more precise estimates. Since the vertical accuracy of the LiDAR data is in the order of 15 cm, the uncertainty derived from it is almost negligible. Conversely, a rather large contribution, difficult to quantify, is introduced by the degradation level of the tectonic features. In fact, the offsets were estimated on old surfaces, which do not correspond to the precise extent of the uplifted morphologies as they were generated. Moreover, neither the western T3 surface, nor the GPR radargrams contribute to better constrain the offset estimates, because they did not allow any quantitative deformation measurement.
In order to get an age constraint on the scarp development, we dug a pit into terrace T4. We encountered well-sorted fluvial gravels made of limestone, but no material suitable for radiocarbon (no charcoal or organic sediment) or luminescence dating (too coarse, no quartz or feldspar). The only option for dating would perhaps be a 36 Cl depth profile for cosmogenic nuclide dating, but we did not undertake this. Instead, we used the available stratigraphic information about the units of the area to address the dating issue. The data reported by Zanferrari et al. [51] and Tunis et al. [52] allow to assume a Late Pleistocene and 8 ka—Present age for terraces T4 and T3, respectively. Considering that the entire Veneto-Friulian plain was affected by a drastic peneplanization process during the last glaciation period, we can use this information to better constrain the age of the oldest T4 terrace. According to Fontana et al. [23], the main depositional systems developed from the Alpine valleys recorded the end of the LGM-peak around 20–18 ka B.P. Therefore, we assume 20 ka and 8 ka as maximum ages of the deformations recorded by T4 and T3, respectively.
We used these data to calculate a possible range of vertical uplift rates from the offsets recorded by T3 and T4 (Table 1). The vertical uplift rate ranges between 0.08 and 0.17 mm/yr (Figure 14). These rates fit the lower boundaries of the uplift rates estimated along the swath profiles in the Friuli Plain (Table 1). The vertical uplift rate computed from the swath profile crossing the Buttrio Hill (80 m height) and the offset of the Middle Ypresian - Early Lutetian Cormòns Flysch result in a rate of at least 0.03 mm/yr, assuming that the hill has been forming since the Pleistocene. This is a lower bound because the onset of the backtilt is not precisely known. In general, our values agree well with the estimates reported by Galadini et al. [7] for the main seismogenic sources of the area, which range between 0.15–1 mm/yr.
Our data do not allow us to decide whether the offsets were produced seismically in repeated earthquakes, or if the fault creeps. The occurrence of strong earthquakes on nearby thrust faults and historical evidence for large earthquakes in the region suggest that the faults here slip seismically. Considering a 31 km-long fault, the maximum possible magnitude for an earthquake rupturing the entire fault would be in the order of M 6.8 , based on the empirical relationships of Wells and Coppersmith [53]. The role of the splay fault remains somewhat uncertain. Its short length may mean that it is only a localized feature, although lineaments in the surrounding hills are probably also related to it (Figure 5B). If the scarp formed in an earthquake, two options seem likely. The first one is that the fault rupture trace in the neighbouring hills is removed quickly, for example, by mass wasting processes and erosion. The other option is that very localized surface ruptures occurred. This was observed for example in the 1992 Suusamyr M 7.3 thrust faulting earthquake, which produced an isolated scarp of several metres height and less than one kilometre length [54,55].

5. Conclusions

We present a detailed morphotectonic study of the Udine-Buttrio Thrust in the upper Friulian plain of NE Italy. We identified offset surfaces along the fault in high-resolution DEMs. We measured the vertical offsets from swath profiles and, assuming an age of 20 ka, computed vertical offset rates of up to 0.5 mm/yr. The analysis of high-resolution LiDAR data revealed the presence of a tectonic scarp in the Natisone River valley. This scarp is located on the hanging wall of the Udine-Buttrio Thrust and interpreted as a splay fault of the main structure. Geophysical imaging revealed north-dipping strata, which are likely tilted deposits in the hanging-wall of the fault. We measured vertical offsets in different terrace generations and computed a vertical uplift rate since the LGM of 0.08–0.17 mm/yr. Future paleoseismological investigations should test our estimates providing evidence of single or multiple earthquakes and precise dating of these events.

Author Contributions

Conceptualization, C.G.; methodology, A.V. and C.G.; validation, A.V., C.G., K.R. and K.U.; formal analysis, A.V.; investigation, A.V., C.G., and M.D.; data curation, A.V.; writing—original draft preparation, A.V.; writing—review and editing, C.G. and K.U.; supervision, K.R. and K.U.; project administration, C.G.; funding acquisition, C.G. and K.R. All authors have read and agreed to the published version of the manuscript.

Funding

This research was funded by DFG grant number “GR 4371/1-1”. This project is part of the “SPP2017-Mountain Building Processes in 4D”.

Acknowledgments

We thank Simone Aschenbrenner, Alexander Krämer, Nour Saifelislam, Julian Welte, and Philipp Balling for their help. Two anonymous reviewers helped to improve an earlier version of our manuscript with their thorough reviews.

Conflicts of Interest

The authors declare no conflict of interest.

References

  1. D’Agostino, N.; Avallone, A.; Cheloni, D.; D’Anastasio, E.; Mantenuto, S.; Selvaggi, G. Active tectonics of the Adriatic region from GPS and earthquake slip vectors. J. Geophys. Res. 2008, 113. [Google Scholar] [CrossRef]
  2. Grenerczy, G.; Sella, G.; Stein, S.; Kenyeres, A. Tectonic implications of the GPS velocity field in the northern Adriatic region. Geophys. Res. Lett. 2005, 32, L16311. [Google Scholar] [CrossRef] [Green Version]
  3. Santulin, M.; Tamaro, A.; Rebez, A.; Slejko, D.; Sani, F.; Martelli, L.; Bonini, M.; Corti, G.; Poli, M.E.; Zanferrari, A.; et al. Seismogenic zonation as a branch of the logic tree for the new Italian seismic hazard map—MPS16: A preliminary outline. Bollettino di Geofisica Teorica ed Applicata 2017, 58, 313–342. [Google Scholar] [CrossRef]
  4. DISS Working Group. Database of Individual Seismogenic Sources (DISS), Version 3.2.1: A compilation of potential sources for earthquakes larger than M5.5 in Italy and surrounding areas. Istituto Nazionale di Geofisica e Vulcanologia. 2018. Available online: http://diss.rm.ingv.it/diss/ (accessed on 20 February 2020). [CrossRef]
  5. Burrato, P.; Poli, M.E.; Vannoli, P.; Zanferrari, A.; Basili, R.; Galadini, F. Sources of MW5+ earthquakes in northeastern Italy and western Slovenia: An updated view based on geological and seismological evidence. Tectonophysics 2008, 453, 157–176. [Google Scholar] [CrossRef]
  6. Grünthal, G.; Wahlström, R. The European-Mediterranean Earthquake Catalogue (EMEC) for the last millennium. J. Seismol. 2012, 16, 535–570. [Google Scholar] [CrossRef] [Green Version]
  7. Galadini, F.; Poli, M.E.; Zanferrari, A. Seismogenic sources potentially responsible for earthquakes with M ≥6 in the eastern Southern Alps (Thiene–Udine sector, NE Italy). Geophys. J. Int. 2005, 161, 739–762. [Google Scholar] [CrossRef] [Green Version]
  8. Anderson, H.; Jackson, J. Active tectonics of the Adriatic Region. Geophys. J. R. Astron. Soc. 1987, 91, 937–983. [Google Scholar] [CrossRef]
  9. Weber, J.; Vrabec, M.; Prešeren, P.P.; Dixon, T.; Jiang, Y.; Stopar, B. GPS-derived motion of the Adriatic microplate from Istria Peninsula and Po Plain sites, and geodynamic implications. Tectonophysics 2010, 483, 214–222. [Google Scholar] [CrossRef]
  10. Caporali, A.; Neubauer, F.; Ostini, L.; Stangl, G.; Zuliani, D. Modeling surface GPS velocities in the Southern and Eastern Alps by finite dislocations at crustal depths. Tectonophysics 2013, 590, 136–159. [Google Scholar] [CrossRef]
  11. Márton, E.; Zampieri, D.; Ćosović, V.; Moro, A.; Drobne, K. Apparent polar wonder path for Adria extended by new Jurassic paleomagnetic results from its stable core: Tectonic implications. Tectonophysics 2017, 700–701, 1–8. [Google Scholar] [CrossRef] [Green Version]
  12. Breton, E.L.; Handy, M.R.; Molli, G.; Ustaszewski, K. Post-20 Ma Motion of the Adriatic Plate: New Constraints From Surrounding Orogens and Implications for Crust-Mantle Decoupling. Tectonics 2017, 36, 3135–3154. [Google Scholar] [CrossRef] [Green Version]
  13. Calais, E.; Nocquet, J.M.; Jouanne, F.; Tardy, M. Current strain regime in the Western Alps from continuous Global Positioning System measurements. Geology 2002, 30, 651–654. [Google Scholar] [CrossRef]
  14. D’Agostino, N.; Cheloni, D.; Mantenuto, S.; Selvaggi, G.; Michelini, A.; Zuliani, D. Strain accumulation in the southern Alps (NE Italy) and deformation at the northeastern boundary of Adria observed by CGPS measurements. Geophys. Res. Lett. 2005, 32. [Google Scholar] [CrossRef]
  15. Castellarin, A.; Cantelli, L. Neo-Alpine evolution of the Southern Eastern Alps. J. Geodyn. 2000, 30, 251–274. [Google Scholar] [CrossRef]
  16. Vrabec, M.; Fodor, L. Late Cenozoic tectonics of Slovenia: structural styles at the northeastern corner of the Adriatic microplate. In The Adria Microplate: GPS Geodesy, Tectonics and Hazards; Nato Science Series: IV: Earth and Environmental Sciences; Pinter, N., Gyula, G., Weber, J., Stein, S., Medak, D., Eds.; Springer: Dordrecht, The Netherlands, 2006; Volume 61, pp. 151–168. [Google Scholar] [CrossRef]
  17. Placer, L.; Vrabec, M.; Celarc, B. The bases for understanding of the NW Dinarides and Istria Peninsula tectonics. Geologija 2010, 53, 55–86. [Google Scholar] [CrossRef]
  18. Kastelic, V.; Živčić, M.; Pahor, J.; Gosar, A. Seismotectonic characteristics of the 2004 earthquake in Krn mountains. Potresi v letu 2004, 78–87. [Google Scholar]
  19. Kastelic, V.; Burrato, P.; Vrabec, M. Influence of inherited geometry and fault history on the seismogenic activity and potential of strike-slip fault systems in NW Slovenia: the case study of the Ravne Fault. Rendiconti Online Soc. Geol. It. 2009, 5, 108–110. [Google Scholar]
  20. Zanferrari, A.; Avigliano, R.; Monegato, G.; Paiero, G.; Poli, M. Foglio geologico 066-Udine e Note Illustrative. Carta geologica d’Italia alla scala 1:50000; Graphic Linea: Udine, Italy, 2008. [Google Scholar] [CrossRef]
  21. Poli, M.E.; Zanferrari, A. The seismogenic sources of the 1976 Friuli earthquakes: A new seismotectonic model for the Friuli area. Bollettino di Geofisica Teorica ed Applicata 2018, 59, 463–480. [Google Scholar] [CrossRef]
  22. Carulli, G.B. Carta Geologica del Friuli Venezia Giulia (Scala 1:150000, con Note ill.); SELCA: Firenze, Italy, 2006. [Google Scholar]
  23. Fontana, A.; Monegato, G.; Zavagno, E.; Devoto, S.; Burla, I.; Cucchi, F. Evolution of an Alpine fluvioglacial system at the LGM decay: The Cormor megafan (NE Italy). Geomorphology 2014, 204, 136–153. [Google Scholar] [CrossRef]
  24. Croce, D.; Dott. geologo Daniela Croce, via Lauzacco, 19, 33100 Udine, Italy. Relazione illustrativa di Microzonazione Sismica del Comune di Manzano. Technical Report, Regione A. Friuli Venezia Giulia. Personal communication, 2015. [Google Scholar]
  25. Carulli, G.B.; Slejko, D. The 1976 Friuli (NE Italy) earthquake. Giornale di Geologia Applicata 2005, 1, 147–156. [Google Scholar] [CrossRef]
  26. Camassi, R.; Caracciolo, C.H.; Castelli, V.; Slejko, D. The 1511 Eastern Alps earthquakes: A critical update and comparison of existing macroseismic datasets. J. Seismol. 2011, 15, 191–213. [Google Scholar] [CrossRef] [Green Version]
  27. Herak, M.; Herak, D.; Markušić, S. Fault-plane solutions for earthquakes (1956-1995) in Croatia and neighbouring regions. Geofizika 1995, 12, 43–56. [Google Scholar]
  28. Kastelic, V.; Carafa, M.M.C.; Visini, F. Neotectonic deformation models for probabilistic seismic hazard: a study in the External Dinarides. Geophys. J. Int. 2016, 205, 1694–1709. [Google Scholar] [CrossRef] [Green Version]
  29. Slejko, D. A review of the Eastern Alps - Northern Dinarides seismotectonics. In Recent Evolution and Seismicity of the Mediterranean Region; NATO ASI Series (Series C: Mathematical and Physical Sciences); Boschi, E., Mantovani, E., Morelli, A., Eds.; Springer: Dordrecht, The Netherlands, 1993; Volume 402, pp. 251–260. [Google Scholar] [CrossRef]
  30. Vičič, B.; Aoudia, A.; Javed, F.; Foroutan, M.; Costa, G. Geometry and mechanics of the active fault system in western Slovenia. Geophys. J. Int. 2019, 217, 1755–1766. [Google Scholar] [CrossRef]
  31. Aoudia, A.; Saraò, A.; Bukchin, B.; Suhadolc, P. The 1976 Friuli (NE Italy) thrust faulting earthquake: A reappraisal 23 years later. Geophys. Res. Lett. 2000, 27, 573–576. [Google Scholar] [CrossRef]
  32. Rovida, A.; Locati, M.; Camassi, R.; Lolli, B.; Gasperini, P. Catalogo Parametrico dei Terremoti Italiani (CPTI15), Versione 2.0.; Istituto Nazionale di Geofisica e Vulcanologia (INGV): Rome, Italy, 2019. [Google Scholar] [CrossRef]
  33. Bajc, J.; Aoudia, A.; Saraò, A.; Suhadolc, P. The 1998 Bovec-Krn Mountain (Slovenia) Earthquake Sequence. Geophys. Res. Lett. 2001, 28, 1839–1842. [Google Scholar] [CrossRef]
  34. Guidoboni, E.; Ferrari, G.; Mariotti, D.; Comastri, A.; Tarabusi, G.; Sgattoni, G.; Valensise, G. CFTI5Med, Catalogo dei Forti Terremoti in Italia (461 a.C.-1997) e nell’area Mediterranea (760 a.C.-1500). Istituto Nazionale di Geofisica e Vulcanologia (INGV). 2018. Available online: http://storing.ingv.it/cfti/cfti5/ (accessed on 20 February 2020). [CrossRef]
  35. Guidoboni, E.; Ferrari, G.; Tarabusi, G.; Sgattoni, G.; Comastri, A.; Mariotti, D.; Ciuccarelli, C.; Bianchi, M.; Valensise, G. CFTI5Med, the new release of the catalogue of strong earthquakes in Italy and in the Mediterranean area. Sci. Data 2019, 6. [Google Scholar] [CrossRef]
  36. Fitzko, F.; Suhadolc, P.; Aoudia, A.; Panza, G. Constraints on the location and mechanism of the 1511 Western - Slovenia earthquake from active tectonics and modeling of macroseismic data. Tectonophysics 2005, 404, 77–90. [Google Scholar] [CrossRef]
  37. Falcucci, M.; Poli, M.E.; Galadini, F.; Scardia, G.; Paiero, G.; Zanferrari, A. First evidence of active transpressive surface faulting at the front of the eastern Southern Alps, northeastern Italy: Insight on the 1511 earthquake seismotectonics. Solid Earth 2018, 9, 1–12. [Google Scholar] [CrossRef] [Green Version]
  38. Gomarasca, M.A. Elementi di Geomatica; Associazione Italiana Telerilevamento: Milano, Italy, 2004. [Google Scholar]
  39. Cunningham, D.; Grebby, S.; Tansey, K.; Gosar, A.; Kastelic, V. Application of airborne LiDAR to mapping seismogenic faults in forested mountainous terrain, southeastern Alps, Slovenia. Geophys. Res. Lett. 2006, 33. [Google Scholar] [CrossRef] [Green Version]
  40. Friuli-Venezia Giulia Environmental Department. Available online: www.regione-fvg.it/rafvg/cms/RAFVG/ambiente-territorio/conoscere-ambiente-territorio/ (accessed on 20 June 2018).
  41. Tarquini, S.; Isola, I.; Favalli, M.; Mazzarini, F.; Bisson, M.; Pareschi, M.T.; Boschi, E. TINITALY/01: A new Triangular Irregular Network of Italy. Ann. Geophys. 2007, 50, 407–425. [Google Scholar] [CrossRef]
  42. Tarquini, S.; Vinci, S.; Favalli, M.; Doumaz, F.; Fornaciai, A.; Nannipieri, L. Release of a 10-m-resolution DEM for the Italian territory: Comparison with global-coverage DEMs and anaglyph-mode exploration via the web. Comput. Geosci. 2012, 38, 168–170. [Google Scholar] [CrossRef] [Green Version]
  43. Riley, S.J.; Gloria, S.D.D.; Elliot, R. A Terrain Ruggedness Index that Quantifies Topographic Heterogeneity. Intermt. J. Sci. 1999, 5, 23–27. [Google Scholar]
  44. Grützner, C.; Walker, R.T.; Abdrakhmatov, K.E.; Mukambaev, A.; Elliott, A.J.; Elliott, J.R. Active Tectonics Around Almaty and along the Zailisky Alatau Rangefront. Tectonics 2017, 36, 2192–2226. [Google Scholar] [CrossRef] [Green Version]
  45. Wobus, C.; Whipple, K.X.; Kirby, E.; Snyder, N.; Johnson, J.; Spyropolou, K.; Crosby, B.; Sheehan, D. Tectonics from topography: Procedures, promise, and pitfalls. Spec. Pap. Geol. Soc. Am. 2006, 398, 55–74. [Google Scholar] [CrossRef] [Green Version]
  46. Kirby, E.; Whipple, K.X. Expression of active tectonics in erosional landscapes. J. Struct. Geol. 2012, 44, 54–75. [Google Scholar] [CrossRef]
  47. Perron, J.T.; Royden, L. An integral approach to bedrock river profile analysis. Earth Surf. Process. Landf. 2013, 38, 570–576. [Google Scholar] [CrossRef] [Green Version]
  48. Schwanghart, W.; Scherler, D. TopoToolbox 2 – MATLAB-based software for topographic analysis and modeling in Earth surface sciences. Earth Surf. Dyn. 2014, 2, 1–7. [Google Scholar] [CrossRef] [Green Version]
  49. Neal, A. Ground-penetrating radar and its use in sedimentology: Principles, problems and progress. Earth-Sci. Rev. 2004, 66, 261–330. [Google Scholar] [CrossRef]
  50. Carobene, L. Morfologia, geologia ed evoluzione neotettonica dei rilievi collinari di Buttrio-Dolegna del Collio. Geografia Fisica e Dinamica Quaternaria 1984, 7, 17–35. [Google Scholar]
  51. Zanferrari, A.; Carraro, F.; Tunis, G.; Poli, M.; Avigliano, R.; Russo, S.; Barsanti, S.; Mereu, A. Carta di Sintesi Geologica (GEO-CGT) Alla Scala 1:10000. Foglio 067 Cividale; Servizio geologico, Dir. Cen. Ambiente ed energia: Regione Autonoma Friuli Venezia Giulia, Italy, 2008. [Google Scholar]
  52. Tunis, G.; Carraro, F.; Marocco, R.; Pugliese, N.; Poli, M.; Ponton, M.; Avigliano, R.; Monegato, G.; Paiero, G.; Andrian, L.; et al. Carta di Sintesi Geologica (GEO-CGT) Alla Scala 1:10000. Foglio 068 Gemona; Servizio geologico, Dir. Cen. Ambiente ed energia: Regione Autonoma Friuli Venezia Giulia, Italy, 2008. [Google Scholar]
  53. Wells, D.L.; Coppersmith, K. New Empirical Relationships among Magnitude, Rupture Length, Rupture Width, Rupture Area and Surface Displacement. Bull. Seismol. Soc. Am. 1994, 84, 974–1002. [Google Scholar]
  54. Ghose, S.; Mellors, R.J.; Korjenkov, A.M.; Hamburger, M.W.; Pavlis, T.L.; Pavlis, G.L.; Omuraliev, M.; Mamyrov, E.; Muraliev, A.R. The MS = 7.3 1992 Suusamyr, Kyrgyzstan, earthquake in the Tien Shan: 2. Aftershock focal mechanisms and surface deformation. Bull. Seismol. Soc. Am. 1997, 87, 23–38. [Google Scholar]
  55. Ainscoe, E.A.; Abdrakhmatov, K.E.; Baikulov, S.; Carr, A.S.; Elliott, A.J.; Grützner, C.; Walker, R.T. Variability in surface rupture between successive earthquakes on the Suusamyr Fault, Kyrgyz Tien Shan: implications for palaeoseismology. Geophys. J. Int. 2019, 216, 703–725. [Google Scholar] [CrossRef]
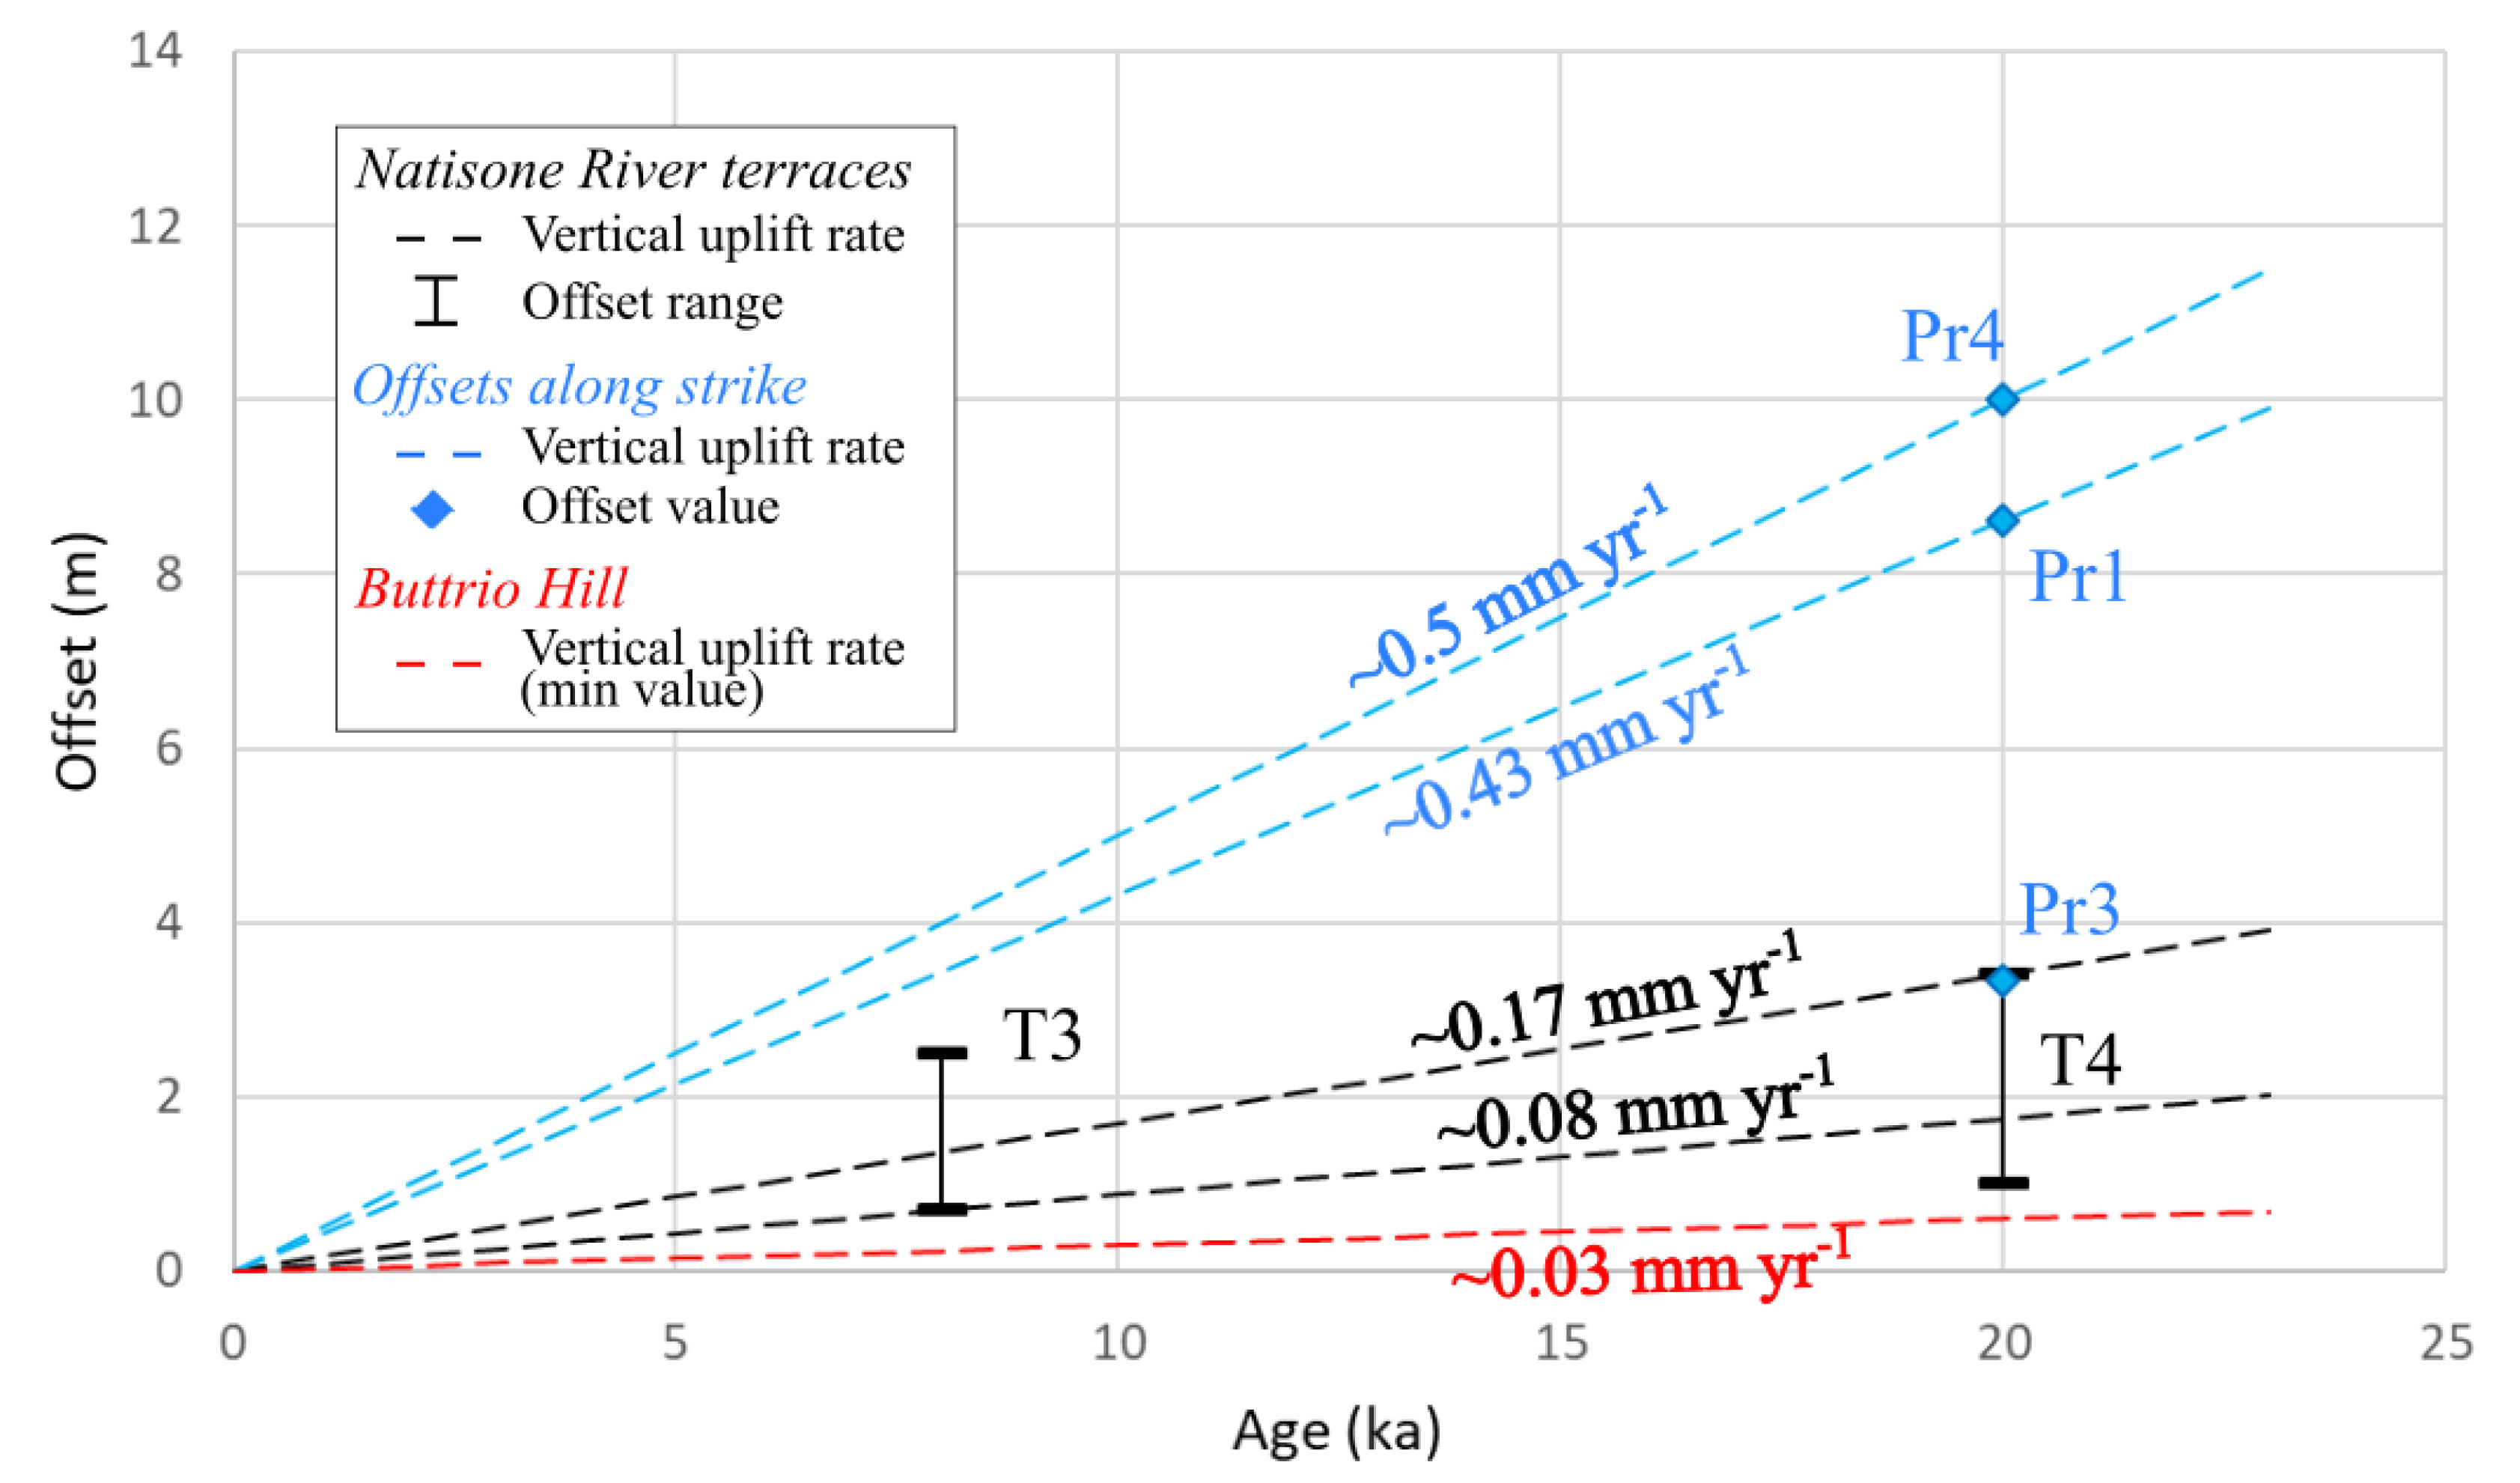
Figure 1. Seismotectonic setting of the northeastern corner of Adria. IT = Italy, AUT = Austria, SLO = Slovenia, HR = Croatia. Red polygons represent the fault plane projections of the Composite Seismogenic Sources, the unsegmented fault systems of the region capable of M 6 earthquakes. The black circles represent the largest historical earthquakes that occurred in this region, data taken from EMEC 2012 [6]. The black rectangle indicates the area shown in Figure 2, which encompasses the Udine-Buttrio Thrust (UB), main subject of this study and not included in the DISS. The hillshaded DEM was taken from the SRTM1 data from NASA. Coordinates here and in all following figures are in WGS 84/UTM zone 33N.
Geosciences 10 00084 g001
Figure 2. Structural sketch of the area between Udine and Gorizia. Locations of the inferred thrust faults are taken from the geologic map of the Friuli-Venezia Giulia region [22]. The black segments represent the composite seismogenic sources.
Geosciences 10 00084 g002
Figure 3. Terrain ruggedness index (TRI) map of the study area based on the 10 m TINITALY DEM. The trace of the Udine-Buttrio Thrust is visible as a band of elevated TRI values. The triangular artefacts are due to the used DEM. Note that the colour scale of the TRI values saturates at a value of 0.2 in order to visualize faint geomorphic features. The red arrows mark the fault scarp and the blue numbered lines refer to the topographic profiles shown below. The six swath profiles sample a 500 m-wide band of the DEM (250 m on either side of the profile trace) with 50 parallel tracks. The grey lines mark the minimum and maximum elevations extracted and the thick black line represents the mean. The red and green lines are linear trends fitted to subsets of the mean data in the hanging wall and the footwall of the fault, respectively, with their equations. The red arrows indicate the location of the fault scarp as visible in the TRI map and the red numbers next to the arrows are the vertical offsets calculated at that profile distance using the equations of the linear fits. The vertical offsets vary significantly along strike from 0 m to 10 m, and profiles 3 and 4 show folding of the hanging wall. All the profiles are vertically exaggerated.
Geosciences 10 00084 g003
Figure 4. (A): Geological sketch of the study area. The black dashed polygon represents the boundary of the swath profile analyzed with QGIS. The black full line represents the baseline of the same profile. (B): Outcome of the swath profile extraction. The green, black and red lines are the minimum, mean and maximum elevation values, respectively. The regression line is calculated assuming the origin of the coordinate system at the baseline. Vertical exaggeration 13 : 1.
Geosciences 10 00084 g004
Figure 5. (A): Normalized steepness index ( k s n ) map of the main rivers and their tributaries in the study area. The red arrows indicate the fault as in Figure 3. Note the logarithmic scale of the k s n -values. Although the fault clearly offsets the LGM deposits, the k s n -values do not change systematically from the hanging wall to the footwall. This is probably due to the low rate of tectonic deformation and the dynamic river system. Hillshade is from the 10 m TINITALY DEM. (B): Close-up view of the area marked in (A). Lineaments in the Buttrio Hill are parallel to the scarp we investigated in detail in the Natisone terrace system. One of the lineaments aligns with the scarp. Note the terracing on the hill that hosts vineyards. Hillshade is from the 1 m LiDAR DEM.
Geosciences 10 00084 g005
Figure 6. (A): Elevation map of the study area encompassing the Buttrio Hill in the west and the Rosazzo Hill in the east. The black rectangle indicates the area shown in panels (B,C). (B): Slope map calculated from the LiDAR DEM [40]. The red arrows highlight the scarp. (C): Terrain ruggedness index (TRI) map calculated from the LiDAR DEM. The black arrows indicate the location of the scarp.
Geosciences 10 00084 g006
Figure 7. Hillshaded DEM of the area between the hills of Buttrio and Rosazzo. The coloured areas represent the different river terrace generations. The two red arrows highlight the scarp. The black and red segments indicate the two sets of topographic profiles shown in Figure 8 and Figure 9, respectively. The black rectangle marks the area shown in Figure 10A.
Geosciences 10 00084 g007
Figure 8. Topographic profiles extracted from the DEM (see Figure 7 for location of the black profiles). The black arrows highlight the points where the terrace surfaces are disturbed either by terrace risers or by scarps. The offset estimates are displayed by red vertical segments. The red dashed lines represent the slope trends of the terrace surfaces. On the y-axis, we plotted the relative elevations instead of the absolute values. “V.E.” stands for “Vertical Exaggeration”. (A): W-E topographic profile across the Natisone valley. (B): Topographic profile along the central part of river terrace T2. (C): Topographic profile along terrace T3, on the western side of the river. (D): Topographic profile of the central part of terrace T3, on the eastern side of the river. (E): Topographic profile that crosses the scarp on terrace T4.
Geosciences 10 00084 g008
Figure 9. Topographic profiles from the DEM, drawn through the WNW–ESE striking scarp on different terraces (see Figure 7 for location of the red profiles). The black arrows indicate the locations of the maximum vertical offsets. The offset estimates are displayed by red vertical segments. The red dashed lines indicate the slope trends of the terrace surfaces. Relative elevations are plotted on the y-axis. (A): The topographic profile along the T1 riverbed surface shows a bulge which deviates from the main slope trend. (B): Topographic profile along the terrace T3 on the eastern side of the river. The warped feature around 450 m and 600 m is probably related to industrial buildings crossed by the profile. (C): Topographic profile along terrace T3, almost 100 m east of Pr7. Pr8 is drawn along a road of the village. Therefore, the scarp is smoothed out. (D): Topographic profile from central T4 to eastern T3 passing through the scarp. The blue dashed line represents the slope trend of the scarp. The offset estimate is located at the steepest point. (E): Topographic profile drawn parallel to Pr9, ca. 200 m further east. (F): Topographic profile through the central and southern T4 surfaces. The offsets were estimated at the projected contact of the two terrace remains. The topographic trough between 600 and 1000 m results from erosion and deposition of terrace T3.
Geosciences 10 00084 g009
Figure 10. (A): Geophysical profiles (red lines) with the slope map displayed as background image (see Figure 7 for location of the area). The black arrows indicate the scarp. The black rectangle marks the area shown in panel (B). (B): Field photos of the scarp (from south). The red arrows indicate the uplifted T4 terrace surface.
Geosciences 10 00084 g010
Figure 11. Processed and interpreted radargrams, recorded along the profiles g1 and g6 (see Figure 10A for location). The figure only shows the section that covers the scarp. Depths were calculated assuming a constant velocity of 0.07 m ns 1 . (A): Radargram recorded along profile g1 with the 270 MHz antenna. The black lines highlight the north-dipping trend of the high amplitude reflections. The black dashed line represents the limit of penetration beyond which no interpretation was possible. (B): Radargram recorded along profile g6 with the 100 MHz antenna. North-dipping reflectors were detected, but the noise level is high.
Geosciences 10 00084 g011
Figure 12. Processed and interpreted GPR radargram and ERT section, recorded along profile g5 (see Figure 10A for location of the profile). (A): Radargram recorded with the 270 MHz antenna. The black segments highlight two sets of north-dipping reflectors, one between 50–60 m and the second between 65–80 m. Noise becomes dominant beyond 4 m depth. The depths are calculated assuming a constant velocity of 0.07 m ns 1 . (B): ERT section recorded in the Dipole–Dipole configuration. The high resistivity layer terminates rather sharply around 75–80 m. This vertical discontinuity was interpreted as the fault reaching the surface. At greater depth, between 40–60 m, the profile is characterized by a plume-shaped feature. The model was computed with seven iterations in the inversion. Vertical exaggeration is 1 : 0.6.
Geosciences 10 00084 g012
Figure 13. Conceptual sketch of the study site encompassing the Buttrio Hill, outcome of the Quaternary activity of the Udine-Buttrio Thrust, and the Natisone River terraces, affected by the activity of the splay fault. The sketch is not to scale and the topography is exaggerated. Geology is adapted from Galadini et al. [7].
Geosciences 10 00084 g013
Figure 14. Diagram of computed vertical uplift rates related to the Udine-Buttrio Thrust. The black dashed lines define the vertical uplift rate range, which matches both offset intervals of T3 and T4 (reported in Table 1) displayed by black vertical segments. The blue dashed lines indicate the vertical uplift rate values measured by the swath profiles 1, 3 and 4 along the Udine-Buttrio strike (see Figure 3). The blue diamonds represent the corresponding offset measurements (reported in Table 1). The blue line corresponding to the offset of Pr3 was not reported since it overlaps the black one of terrace T4. The red dashed line defines the vertical uplift rate related to the 80 m geological offset measured by the swath profile crossing the Buttrio Hill (Figure 4). This value represents a minimum estimate based on a conservative age of the deformation.
Geosciences 10 00084 g014
Table 1. Estimated vertical offsets along the Udine-Buttrio Thrust and at the river terraces in the Natisone River valley. The values were obtained by extracting a series of topographic profiles perpendicular to the scarp (see Figure 3, Figure 7, Figure 8 and Figure 9).
Profile/R. Terrace Estimated Offset Age Vertical Uplift
(m) (mm/yr)
Profile 1 8.62 post-LGM 0.43
Profile 3 3.34 post-LGM 0.16
Profile 4 10.00 post-LGM 0.5
Profile 6 Long-wavelength folding - -
Buttrio Hill swath 80 Pleistocene-Recent ≥ 0.03
T1Incipient folding post-8 ka -
T2Incipient folding post-8 ka -
T30.7–2.5 post-8 ka 0.08–0.31
T41.0–3.4 post-LGM 0.05–0.17

