Former Foodstuff Products in Tenebrio Molitor Rearing: Effects on Growth, Chemical Composition, Microbiological Load, and Antioxidant Status

 ,
, 
 ,
, 
 ,
,
Abstract
Simple Summary
Abstract
1. Introduction
2. Materials and Methods
2.1. Diet Preparation
2.2. Insect Rearing and Growth Performances
2.3. Proximate Composition of Feed and Larvae
2.4. Microbiological Analyses
2.5. Antioxidant Status
2.6. Statistical Analysis
3. Results and Discussion
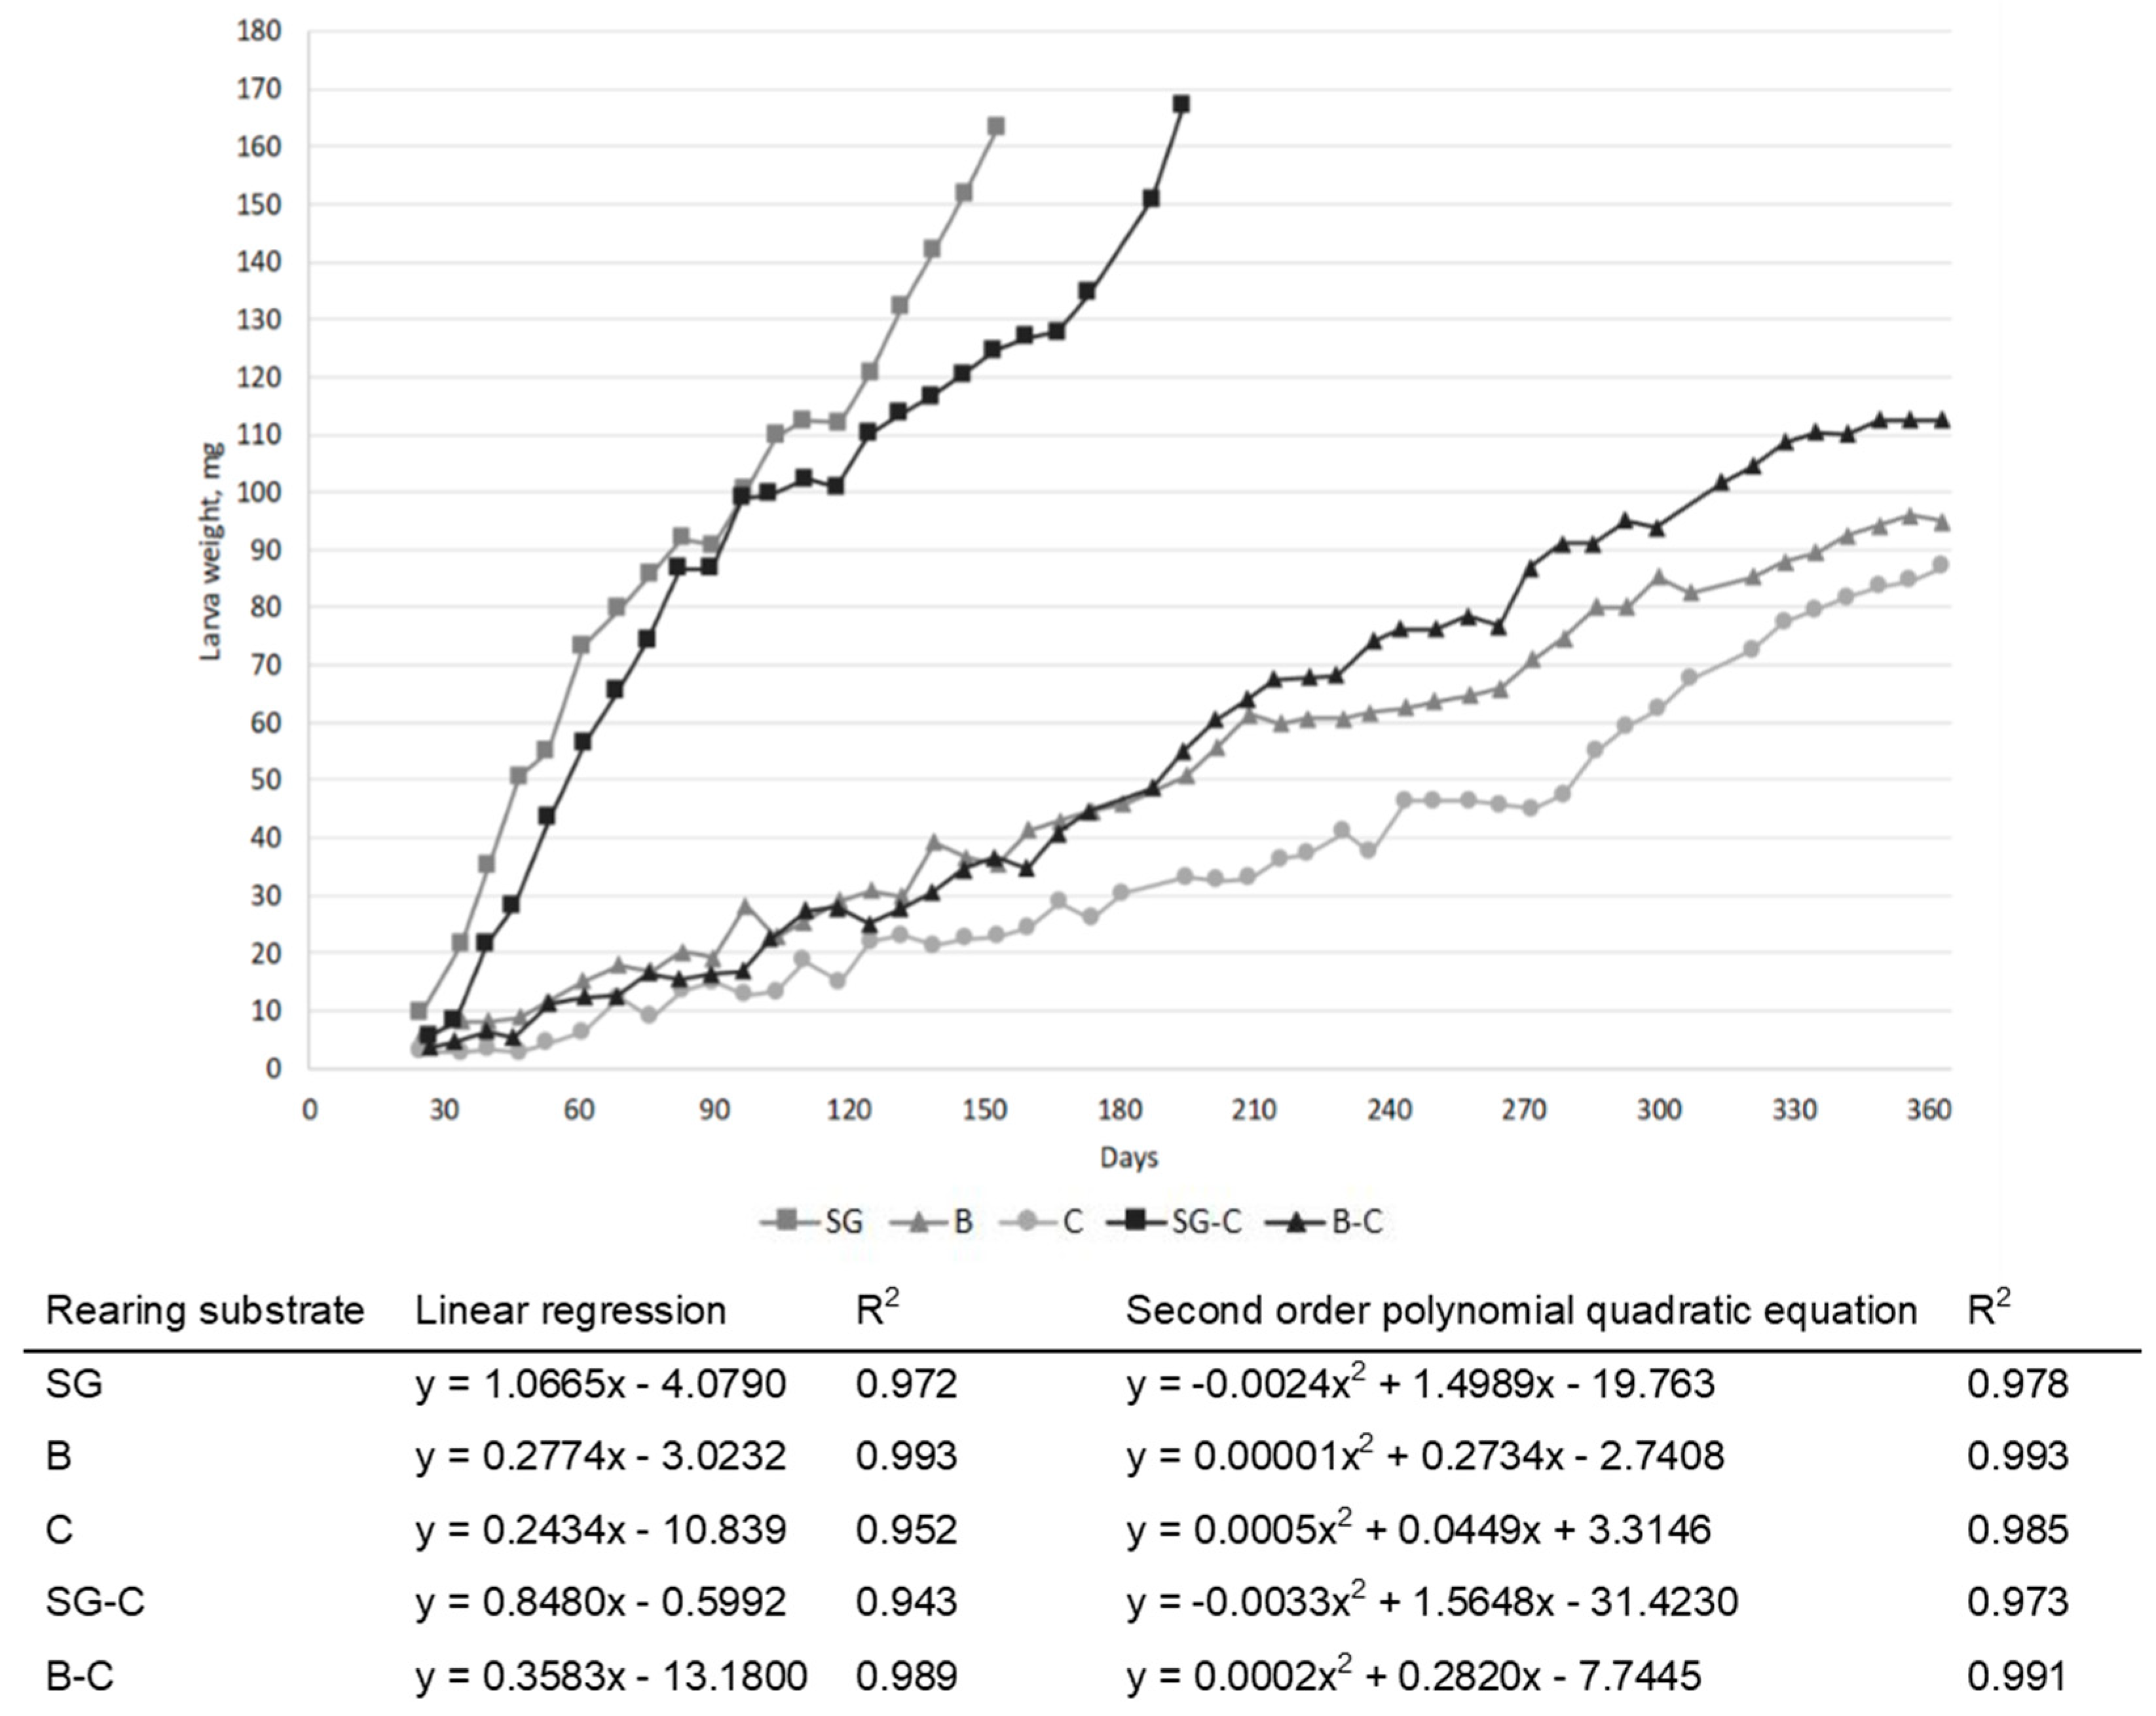
3.1. Growth Performances and Proximate Compositions
3.2. Microbiological Analyses
3.3. Antioxidant Status
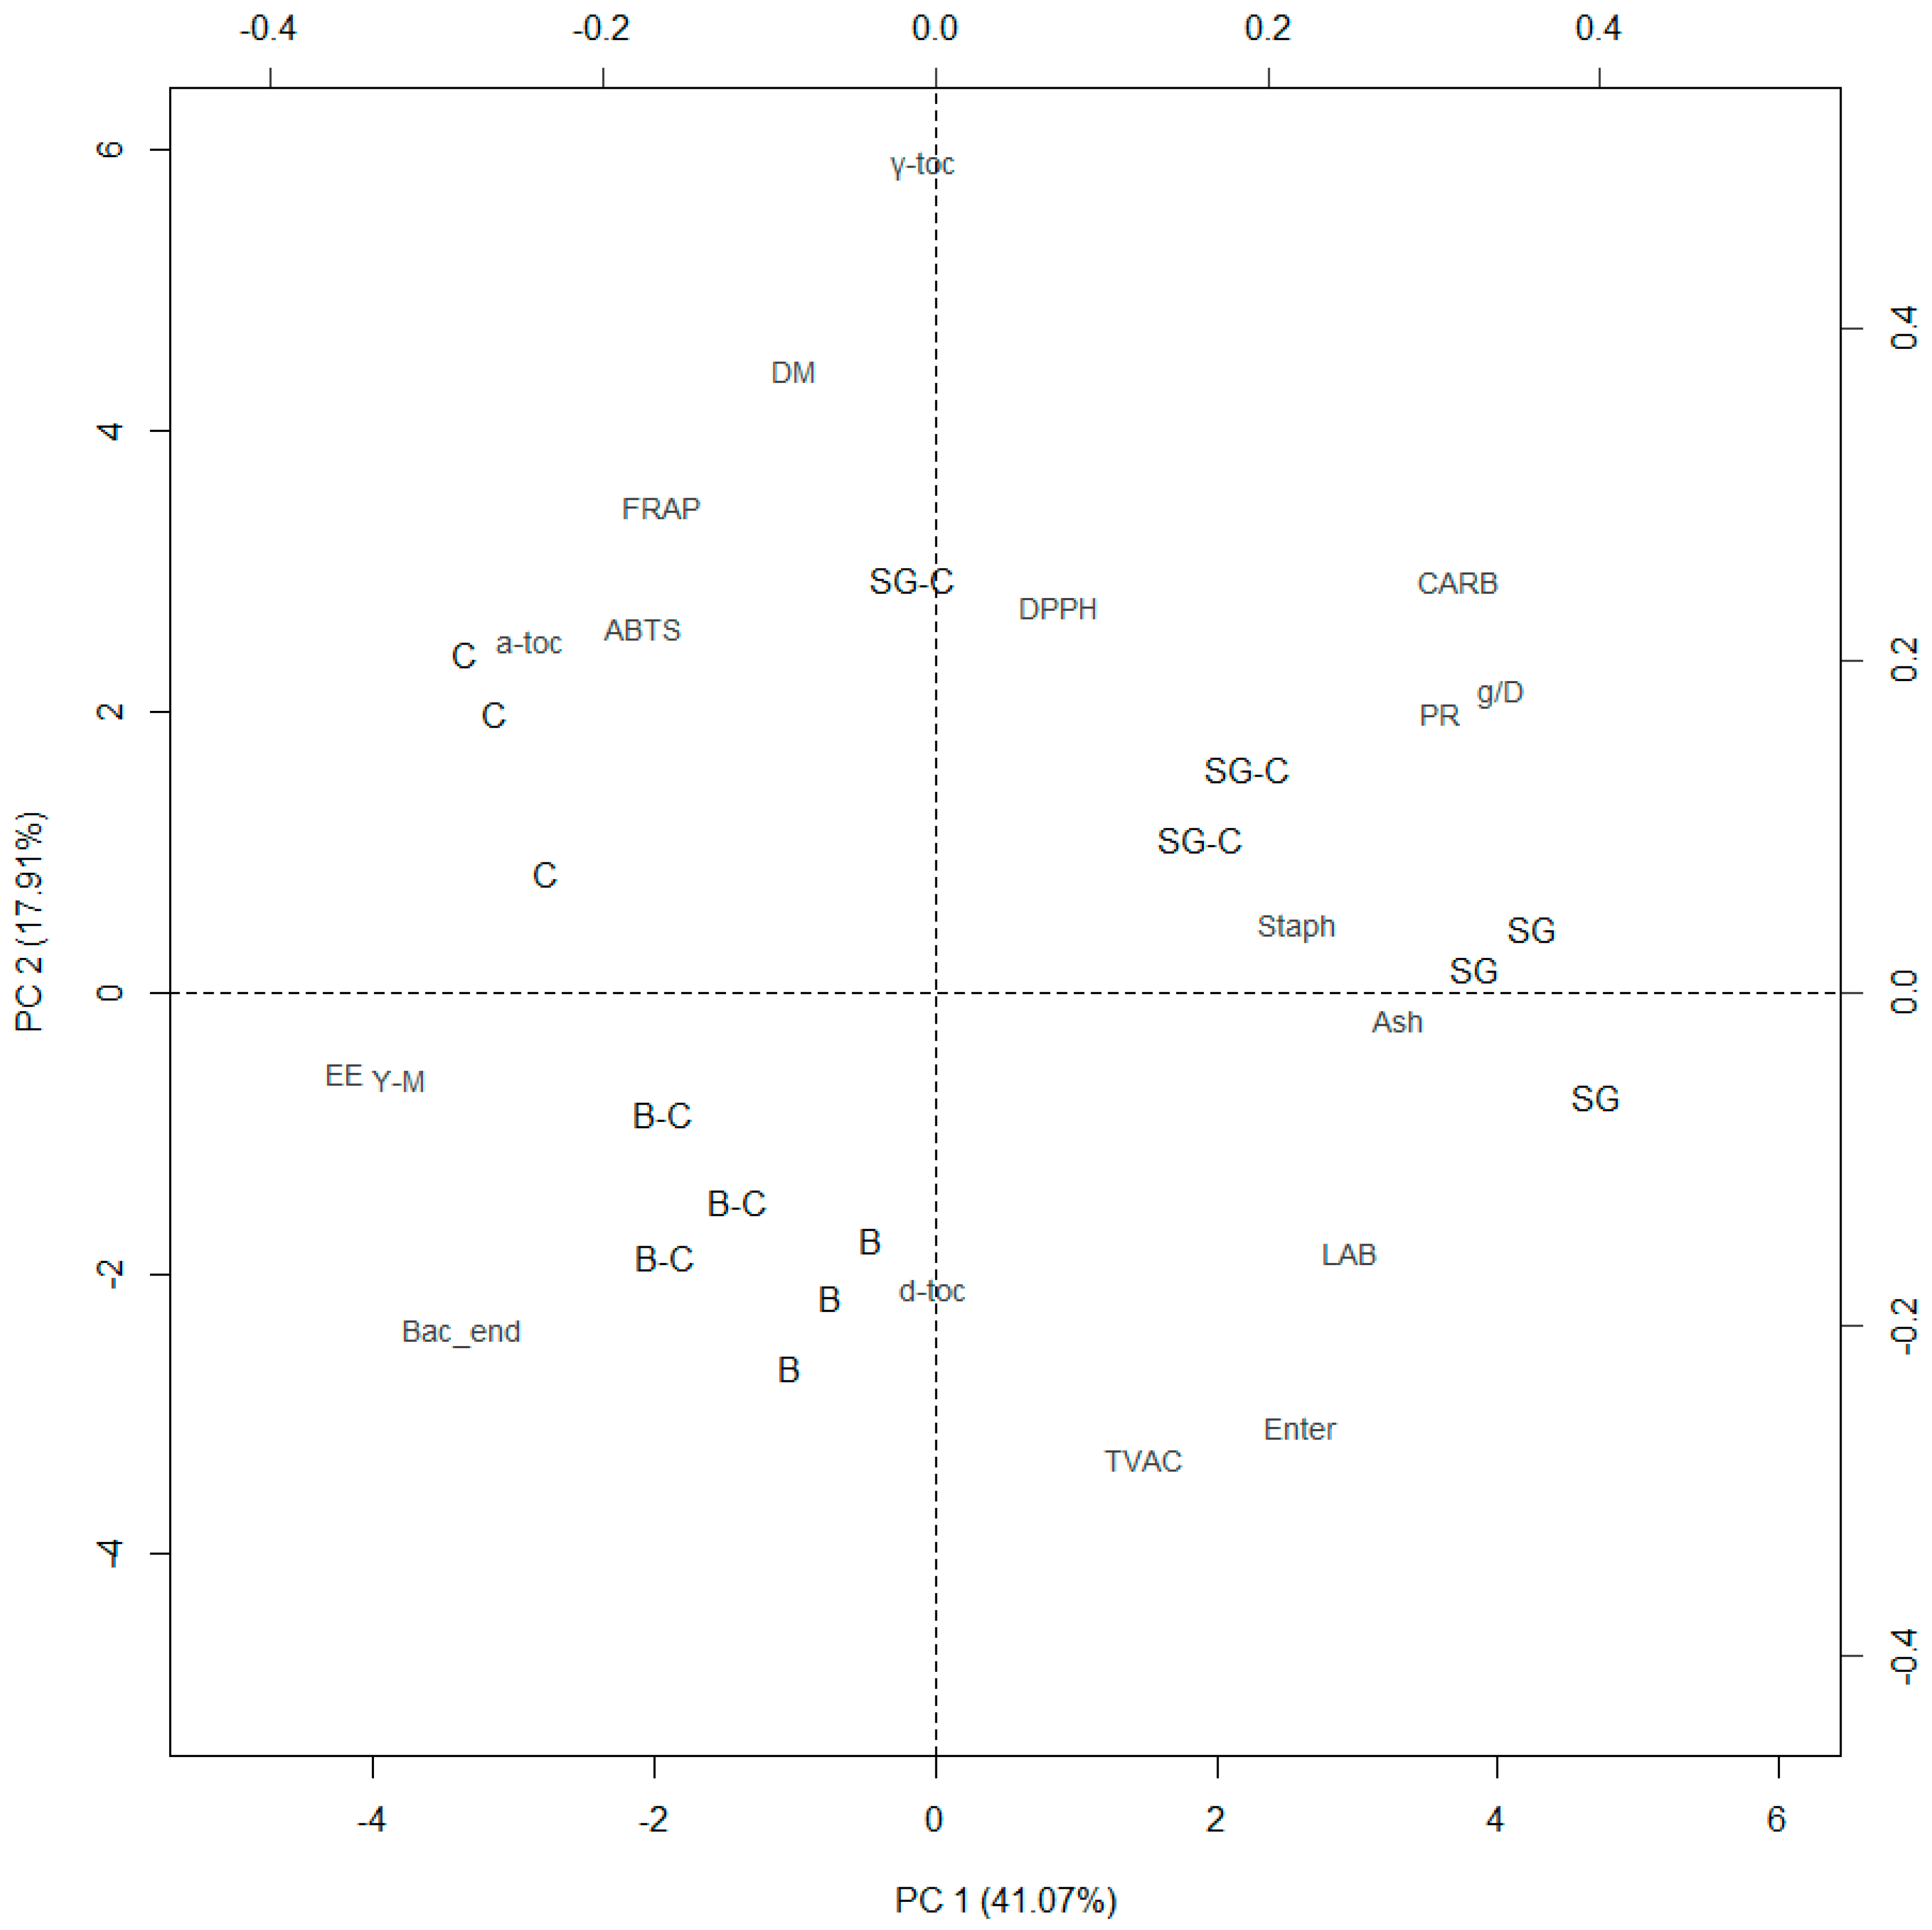
3.4. Principal Component Analysis
4. Conclusions
Author Contributions
Funding
Conflicts of Interest
References
- Van Huis, A.; Van Itterbeeck, J.; Klunder, H.; Mertens, E.; Halloran, A.; Muir, G.; Vantomme, P. Edible Insects: Future Prospects for Food and Feed Security; Food and Agriculture Organization of the United Nations (FAO): Rome, Italy, 2013; Volume 171, ISBN 978-92-5-107595-1. [Google Scholar]
- Anankware, J.P.; Fening, K.; Obeng-Ofori, D. Insects as food and feed: A review. Int. J. Agric. Res. Rev. 2015, 3, 143–151. [Google Scholar]
- Verbeke, W. Profiling consumers who are ready to adopt insects as a meat substitute in a Western society. Food Qual. Prefer. 2015, 39, 147–155. [Google Scholar] [CrossRef]
- Tan, H.S.G.; van Berg, E.V.; Stieger, M. The influence of product preparation, familiarity and individual traits on the consumer acceptance of insects as food. Food Qual. Prefer. 2016, 52, 222–231. [Google Scholar] [CrossRef]
- Hartmann, C.; Ruby, M.B.; Schmidt, P.; Siegrist, M. Brave, health-conscious, and environmentally friendly: Positive impressions of insect food product consumers. Food Qual. Prefer. 2018, 68, 64–71. [Google Scholar] [CrossRef]
- Mancini, S.; Moruzzo, R.; Riccioli, F.; Paci, G. European consumers’ readiness to adopt insects as food. A review. Food Res. Int. 2019, 122, 661–678. [Google Scholar] [CrossRef] [PubMed]
- Oonincx, D.G.A.B.; van Broekhoven, S.; van Huis, A.; van Loon, J.J.A. Feed Conversion, Survival and Development, and Composition of Four Insect Species on Diets Composed of Food By-Products. PLoS One 2015, 10, e0144601. [Google Scholar] [CrossRef]
- Pinotti, L.; Giromini, C.; Ottoboni, M.; Tretola, M.; Marchis, D. Review: Insects and former foodstuffs for upgrading food waste biomasses/streams to feed ingredients for farm animals. Animal 2019, 13, 1365–1375. [Google Scholar] [CrossRef] [PubMed]
- Wilkinson, J.M. Re-defining efficiency of feed use by livestock. Animal 2011, 5, 1014–1022. [Google Scholar] [CrossRef]
- Van Broekhoven, S.; Oonincx, D.G.A.B.; van Huis, A.; van Loon, J.J.A. Growth performance and feed conversion efficiency of three edible mealworm species (Coleoptera: Tenebrionidae) on diets composed of organic by-products. J. Insect Physiol. 2015, 73, 1–10. [Google Scholar] [CrossRef]
- Azagoh, C.; Ducept, F.; Garcia, R.; Rakotozafy, L.; Cuvelier, M.-E.; Keller, S.; Lewandowski, R.; Mezdour, S. Extraction and physicochemical characterization of Tenebrio molitor proteins. Food Res. Int. 2016, 88, 24–31. [Google Scholar] [CrossRef]
- Osimani, A.; Garofalo, C.; Milanović, V.; Taccari, M.; Cardinali, F.; Aquilanti, L.; Pasquini, M.; Mozzon, M.; Raffaelli, N.; Ruschioni, S.; et al. Insight into the proximate composition and microbial diversity of edible insects marketed in the European Union. Eur. Food Res. Technol. 2017, 243, 1157–1171. [Google Scholar] [CrossRef]
- Dreassi, E.; Cito, A.; Zanfini, A.; Materozzi, L.; Botta, M.; Francardi, V. Dietary fatty acids influence the growth and fatty acid composition of the yellow mealworm Tenebrio molitor (Coleoptera: Tenebrionidae). Lipids 2017, 52, 285–294. [Google Scholar] [CrossRef] [PubMed]
- Fasel, N.J.; Mene-Saffrane, L.; Ruczynski, I.; Komar, E.; Christe, P. Diet induced modifications of fatty-acid composition in mealworm larvae (Tenebrio molitor). J. Food Res. 2017, 6, 22. [Google Scholar] [CrossRef]
- Finke, M.D. Complete nutrient content of four species of commercially available feeder insects fed enhanced diets during growth. Zoo Biol. 2015, 34, 554–564. [Google Scholar] [CrossRef] [PubMed]
- Ramos-Elorduy, J.; González, E.A.; Hernández, A.R.; Pino, J.M. Use of Tenebrio molito (Coleoptera: Tenebrionidae) to Recycle Organic Wastes and as Feed for Broiler Chickens. J. Econ. Entomol. 2002, 95, 214–220. [Google Scholar] [CrossRef] [PubMed]
- Oonincx, D.G.A.B.; de Boer, I.J.M. Environmental impact of the production of mealworms as a protein source for humans A Life Cycle Assessment. PLoS One 2012, 7, e51145. [Google Scholar] [CrossRef] [PubMed]
- Merrill, A.L.; Watt, B.K. Energy value of food: Basis and derivation. USDA. United States Dep. Agric. 1973. [Google Scholar]
- Association of Official Analytical Chemists (AOAC). Official Methods of Analysis, 19th ed.; Association of Official Analytical Chemists: Washington, DC, USA, 2012; ISBN 9783642312410. [Google Scholar]
- Janssen, R.H.; Vincken, J.-P.; van den Broek, L.A.M.; Fogliano, V.; Lakemond, C.M.M. Nitrogen-to-protein conversion factors for three edible insects: Tenebrio molitor, Alphitobius diaperinus, and Hermetia illucens. J. Agric. Food Chem. 2017, 65, 2275–2278. [Google Scholar] [CrossRef]
- Stoops, J.; Vandeweyer, D.; Crauwels, S.; Verreth, C.; Boeckx, H.; Van Der Borght, M.; Claes, J.; Lievens, B.; Van Campenhout, L. Minced meat-like products from mealworm larvae (Tenebrio molitor and Alphitobius diaperinus): microbial dynamics during production and storage. Innov. Food Sci. Emerg. Technol. 2017, 41, 1–9. [Google Scholar] [CrossRef]
- Mancini, S.; Preziuso, G.; Dal Bosco, A.; Roscini, V.; Szendro, Z.; Fratini, F.; Paci, G.; Szendrő, Z.; Fratini, F.; Paci, G. Effect of turmeric powder (Curcuma longa L.) and ascorbic acid on physical characteristics and oxidative status of fresh and stored rabbit burgers. Meat Sci. 2015, 110, 93–100. [Google Scholar] [CrossRef]
- Zaspel, B.J.; Csallany, A.S. Determination of alpha-tocopherol in tissues and plasma by high-performance liquid chromatography. Anal. Biochem. 1983, 130, 146–150. [Google Scholar] [CrossRef]
- R Core Team. R: A Language and Environment for Statistical Computing; R Foundation for Statistical Computing: Vienna, Austria. Available online: https://www.r-project.org/ (accessed on 24 July 2019).
- Herrero, M.; Thornton, P.K. Livestock and global change: Emerging issues for sustainable food systems. Proc. Natl. Acad. Sci. 2013, 110, 20878–20881. [Google Scholar] [CrossRef] [PubMed]
- Grabowski, N.T.; Klein, G. Microbiology of processed edible insect products – Results of a preliminary survey. Int. J. Food Microbiol. 2017, 243, 103–107. [Google Scholar] [CrossRef] [PubMed]
- Grabowski, N.T.; Klein, G. Microbiological analysis of raw edible insects. J. Insects as Food Feed 2017, 3, 7–14. [Google Scholar] [CrossRef]
- Wynants, E.; Crauwels, S.; Verreth, C.; Gianotten, N.; Lievens, B.; Claes, J.; Van Campenhout, L. Microbial dynamics during production of lesser mealworms (Alphitobius diaperinus) for human consumption at industrial scale. Food Microbiol. 2018, 70, 181–191. [Google Scholar] [CrossRef] [PubMed]
- Vandeweyer, D.; Crauwels, S.; Lievens, B.; Van Campenhout, L. Microbial counts of mealworm larvae (Tenebrio molitor) and crickets (Acheta domesticus and Gryllodes sigillatus) from different rearing companies and different production batches. Int. J. Food Microbiol. 2017, 242, 13–18. [Google Scholar] [CrossRef] [PubMed]
- Wynants, E.; Crauwels, S.; Lievens, B.; Luca, S.; Claes, J.; Borremans, A.; Bruyninckx, L.; Van Campenhout, L. Effect of post-harvest starvation and rinsing on the microbial numbers and the bacterial community composition of mealworm larvae (Tenebrio molitor). Innov. Food Sci. Emerg. Technol. 2017, 42, 8–15. [Google Scholar] [CrossRef]
- Mancini, S.; Fratini, F.; Tuccinardi, T.; Turchi, B.; Nuvoloni, R.; Paci, G. Effects of different blanching treatments on microbiological profile and quality of the mealworm (Tenebrio molitor). J. Insects as Food Feed 2019, 5, 225–234. [Google Scholar] [CrossRef]
- Wynants, E.; Frooninckx, L.; Van Miert, S.; Geeraerd, A.; Claes, J.; Van Campenhout, L. Risks related to the presence of Salmonella sp. during rearing of mealworms (Tenebrio molitor) for food or feed: Survival in the substrate and transmission to the larvae. Food Control. 2019, 100, 227–234. [Google Scholar] [CrossRef]
- Mancini, S.; Paci, G.; Ciardelli, V.; Turchi, B.; Pedonese, F.; Fratini, F. Listeria monocytogenes contamination of Tenebrio molitor larvae rearing substrate: Preliminary evaluations. Food Microbiol. 2019, 83, 104–108. [Google Scholar] [CrossRef]
- Arnold, K.E.; Ramsay, S.L.; Henderson, L.; Larcombe, S.D. Seasonal variation in diet quality: antioxidants, invertebrates and blue tits Cyanistes caeruleus. Biol. J. Linn. Soc. 2010, 99, 708–717. [Google Scholar] [CrossRef]


| Item | Unit | SG | B | C |
|---|---|---|---|---|
| Dry matter (DM) | % | 94.81 | 97.09 | 99.99 |
| Ether extract | % | 3.29 | 0.31 | 10.44 |
| Crude protein 1 | % | 17.98 | 11.15 | 6.55 |
| Ash | % | 3.43 | 1.88 | 0.70 |
| Carbohydrates | % | 70.10 | 83.75 | 82.29 |
| Ether extract | % on DM | 3.47 | 0.32 | 10.45 |
| Crude protein 1 | % on DM | 18.97 | 11.49 | 6.55 |
| Ash | % on DM | 3.62 | 1.93 | 0.70 |
| Carbohydrates | % on DM | 73.94 | 86.26 | 82.30 |
| Item | Unit | Rearing Substrates | RMSE | p-Value | ||||
|---|---|---|---|---|---|---|---|---|
| SG | B | C | SG-C | B-C | ||||
| Dry matter (DM) | % | 33.33 c | 32.62 c | 35.55 b | 37.53 a | 35.33 b | 0.733 | <0.001 |
| Ether extract | % | 6.46 d | 14.82 b | 17.77 a | 11.77 c | 17.48 a | 1.189 | <0.001 |
| Crude protein 1 | % | 17.36 a | 14.09 ab | 13.33 b | 17.65 a | 14.07 ab | 1.392 | 0.020 |
| Crude protein 2 | % | 13.22 a | 10.73 ab | 10.15 b | 13.44 a | 10.72 ab | 1.392 | 0.020 |
| Ash | % | 1.10 | 0.98 | 0.95 | 1.07 | 1.01 | 0.097 | 0.371 |
| Carbohydrates 1 | % | 8.40 a | 2.73 b | 3.50 b | 7.05 a | 2.76 b | 1.620 | <0.001 |
| Carbohydrates 2 | % | 12.54 a | 6.09 b | 6.72 b | 11.26 a | 6.12 b | 1.523 | <0.001 |
| Ether extract | % on DM | 19.38 c | 45.43 a | 50.00 a | 31.35 b | 49.48 a | 3.389 | <0.001 |
| Crude protein 1 | % on DM | 51.34 a | 42.28 ab | 37.31 b | 46.40 ab | 40.96 ab | 3.898 | 0.022 |
| Crude protein 2 | % on DM | 39.10 a | 32.20 ab | 28.41 b | 35.33 ab | 31.20 ab | 3.898 | 0.022 |
| Ash | % on DM | 3.36 | 3.05 | 2.69 | 2.88 | 2.81 | 0.268 | 0.084 |
| Carbohydrates 1 | % on DM | 25.15 a | 8.28 b | 9.83 b | 18.76 a | 7.81 b | 4.523 | <0.001 |
| Carbohydrates 2 | % on DM | 37.58 a | 18.58 c | 18.77 c | 29.97 b | 17.31 c | 4.123 | <0.001 |
| Item | Rearing Substrates | RMSE | p-Value | ||||
|---|---|---|---|---|---|---|---|
| SG | B | C | SG-C | B-C | |||
| No starvation | |||||||
| Total viable aerobic counts | 7.08 | 7.63 | 6.46 | 6.84 | 7.77 | 0.776 | 0.266 |
| Enterobacteriaceae | 6.31 | 6.44 | 6.33 | 5.87 | 6.30 | 0.502 | 0.688 |
| Staphylococci | 3.85 c | 5.96 a | 5.29 ab | 4.38 b | 5.19 ab | 0.579 | 0.005 |
| Yeast and molds | 3.30 b | 5.60 a | 6.31 a | 3.13 b | 5.34 ab | 0.944 | 0.001 |
| Lactic acid bacteria | 6.20 | 5.18 | 5.57 | 5.44 | 5.31 | 0.685 | 0.343 |
| Bacterial endospores | 0.00 d | 4.44 ab | 3.44 b | 2.05 c | 5.32 a | 0.240 | <0.001 |
| Starvation, 24 h | |||||||
| Total viable aerobic counts | 7.04 | 7.63 | 6.41 | 7.17 | 6.91 | 0.689 | 0.295 |
| Enterobacteriaceae | 6.36 | 6.01 | 4.96 | 5.52 | 5.55 | 0.744 | 0.211 |
| Staphylococci | 4.87 | 4.20 | 3.92 | 4.40 | 3.73 | 0.705 | 0.370 |
| Yeast and molds | 2.56 b | 4.45 a | 5.11 a | 3.54 ab | 4.44 a | 0.561 | 0.002 |
| Lactic acid bacteria | 6.10 | 5.91 | 4.91 | 5.73 | 5.13 | 0.666 | 0.168 |
| Bacterial endospores | 0.00 c | 3.62 a | 2.44 b | 2.36 b | 3.60 a | 0.243 | 0.038 |
| Effect of starvation, p-Value | |||||||
| Total viable aerobic counts | 0.954 | 0.988 | 0.915 | 0.658 | 0.187 | ||
| Enterobacteriaceae | 0.913 | 0.364 | 0.006 | 0.639 | 0.285 | ||
| Staphylococci | 0.115 | 0.031 | 0.012 | 0.968 | 0.039 | ||
| Yeast and molds | 0.506 | 0.014 | < 0.001 | 0.598 | 0.021 | ||
| Lactic acid bacteria | 0.835 | 0.271 | 0.250 | 0.653 | 0.629 | ||
| Bacterial endospores | - | 0.120 | 0.003 | 0.312 | 0.009 | ||
| Item | Rearing Substrates | RMSE | p-Value | ||||
|---|---|---|---|---|---|---|---|
| SG | B | C | SG-C | B-C | |||
| Antioxidant Capacity | |||||||
| ABTS | 1.73 | 2.17 | 2.45 | 2.01 | 1.70 | 0.407 | 0.415 |
| DPPH | 0.35 | 0.30 | 0.34 | 0.30 | 0.28 | 0.042 | 0.504 |
| FRAP | 0.75 | 0.80 | 1.04 | 0.86 | 0.75 | 0.139 | 0.332 |
| Antioxidant Compounds | |||||||
| δ-tocopherol | 0.12 c | 0.13 c | 0.18 c | 0.24 b | 0.33 a | 0.018 | <0.001 |
| γ-tocopherol | 0.07 b | 0.02 b | 0.15 a | 0.17 a | 0.04 b | 0.017 | <0.001 |
| α-tocopherol | 0.48 c | 0.35 c | 4.95 a | 2.86 b | 4.59 a | 0.055 | <0.001 |
| Total tocopherols | 0.79 c | 0.51 c | 5.28 a | 3.16 b | 4.96 ab | 0.601 | <0.001 |
| Item | PC | ||
|---|---|---|---|
| PC 1 | PC 2 | PC 3 | |
| Eigenvalues | 7.392 | 3.223 | 2.341 |
| Eigenvectors | |||
| Dry matter | −0.085 | 0.377 | −0.269 |
| Ether extract | −0.356 | −0.049 | −0.052 |
| Crude protein | 0.304 | 0.170 | −0.133 |
| Ash | 0.279 | −0.016 | −0.204 |
| Carbohydrates | 0.314 | 0.250 | −0.020 |
| Weight gain (g/D) | 0.340 | 0.182 | −0.093 |
| Total viable aerobic counts | 0.127 | −0.279 | 0.198 |
| Enterobacteriaceae | 0.220 | −0.260 | 0.117 |
| Staphylococci | 0.219 | 0.042 | 0.156 |
| Yeast and molds | −0.321 | −0.053 | 0.117 |
| Lactic acid bacteria | 0.250 | −0.154 | 0.221 |
| Bacterial endospores | −0.284 | −0.205 | −0.041 |
| ABTS | −0.176 | 0.220 | 0.451 |
| DPPH | 0.075 | 0.233 | 0.389 |
| FRAP | −0.165 | 0.294 | 0.312 |
| δ-tocopherol | −0.002 | −0.180 | −0.389 |
| γ-tocopherol | −0.010 | 0.499 | −0.064 |
| α-tocopherol | −0.244 | 0.212 | −0.329 |
| Cumulative % | 41.07 | 58.97 | 71.98 |
© 2019 by the authors. Licensee MDPI, Basel, Switzerland. This article is an open access article distributed under the terms and conditions of the Creative Commons Attribution (CC BY) license (http://creativecommons.org/licenses/by/4.0/).
Share and Cite
Mancini, S.; Fratini, F.; Turchi, B.; Mattioli, S.; Dal Bosco, A.; Tuccinardi, T.; Nozic, S.; Paci, G. Former Foodstuff Products in Tenebrio Molitor Rearing: Effects on Growth, Chemical Composition, Microbiological Load, and Antioxidant Status. Animals 2019, 9, 484. https://doi.org/10.3390/ani9080484
Mancini S, Fratini F, Turchi B, Mattioli S, Dal Bosco A, Tuccinardi T, Nozic S, Paci G. Former Foodstuff Products in Tenebrio Molitor Rearing: Effects on Growth, Chemical Composition, Microbiological Load, and Antioxidant Status. Animals. 2019; 9(8):484. https://doi.org/10.3390/ani9080484
Chicago/Turabian StyleMancini, Simone, Filippo Fratini, Barbara Turchi, Simona Mattioli, Alessandro Dal Bosco, Tiziano Tuccinardi, Sanjin Nozic, and Gisella Paci. 2019. "Former Foodstuff Products in Tenebrio Molitor Rearing: Effects on Growth, Chemical Composition, Microbiological Load, and Antioxidant Status" Animals 9, no. 8: 484. https://doi.org/10.3390/ani9080484
APA StyleMancini, S., Fratini, F., Turchi, B., Mattioli, S., Dal Bosco, A., Tuccinardi, T., Nozic, S., & Paci, G. (2019). Former Foodstuff Products in Tenebrio Molitor Rearing: Effects on Growth, Chemical Composition, Microbiological Load, and Antioxidant Status. Animals, 9(8), 484. https://doi.org/10.3390/ani9080484