Elucidating Patterns in the Occurrence of Threatened Ground-Dwelling Marsupials Using Camera-Traps

Simple Summary
Abstract
1. Introduction
2. Materials and Methods
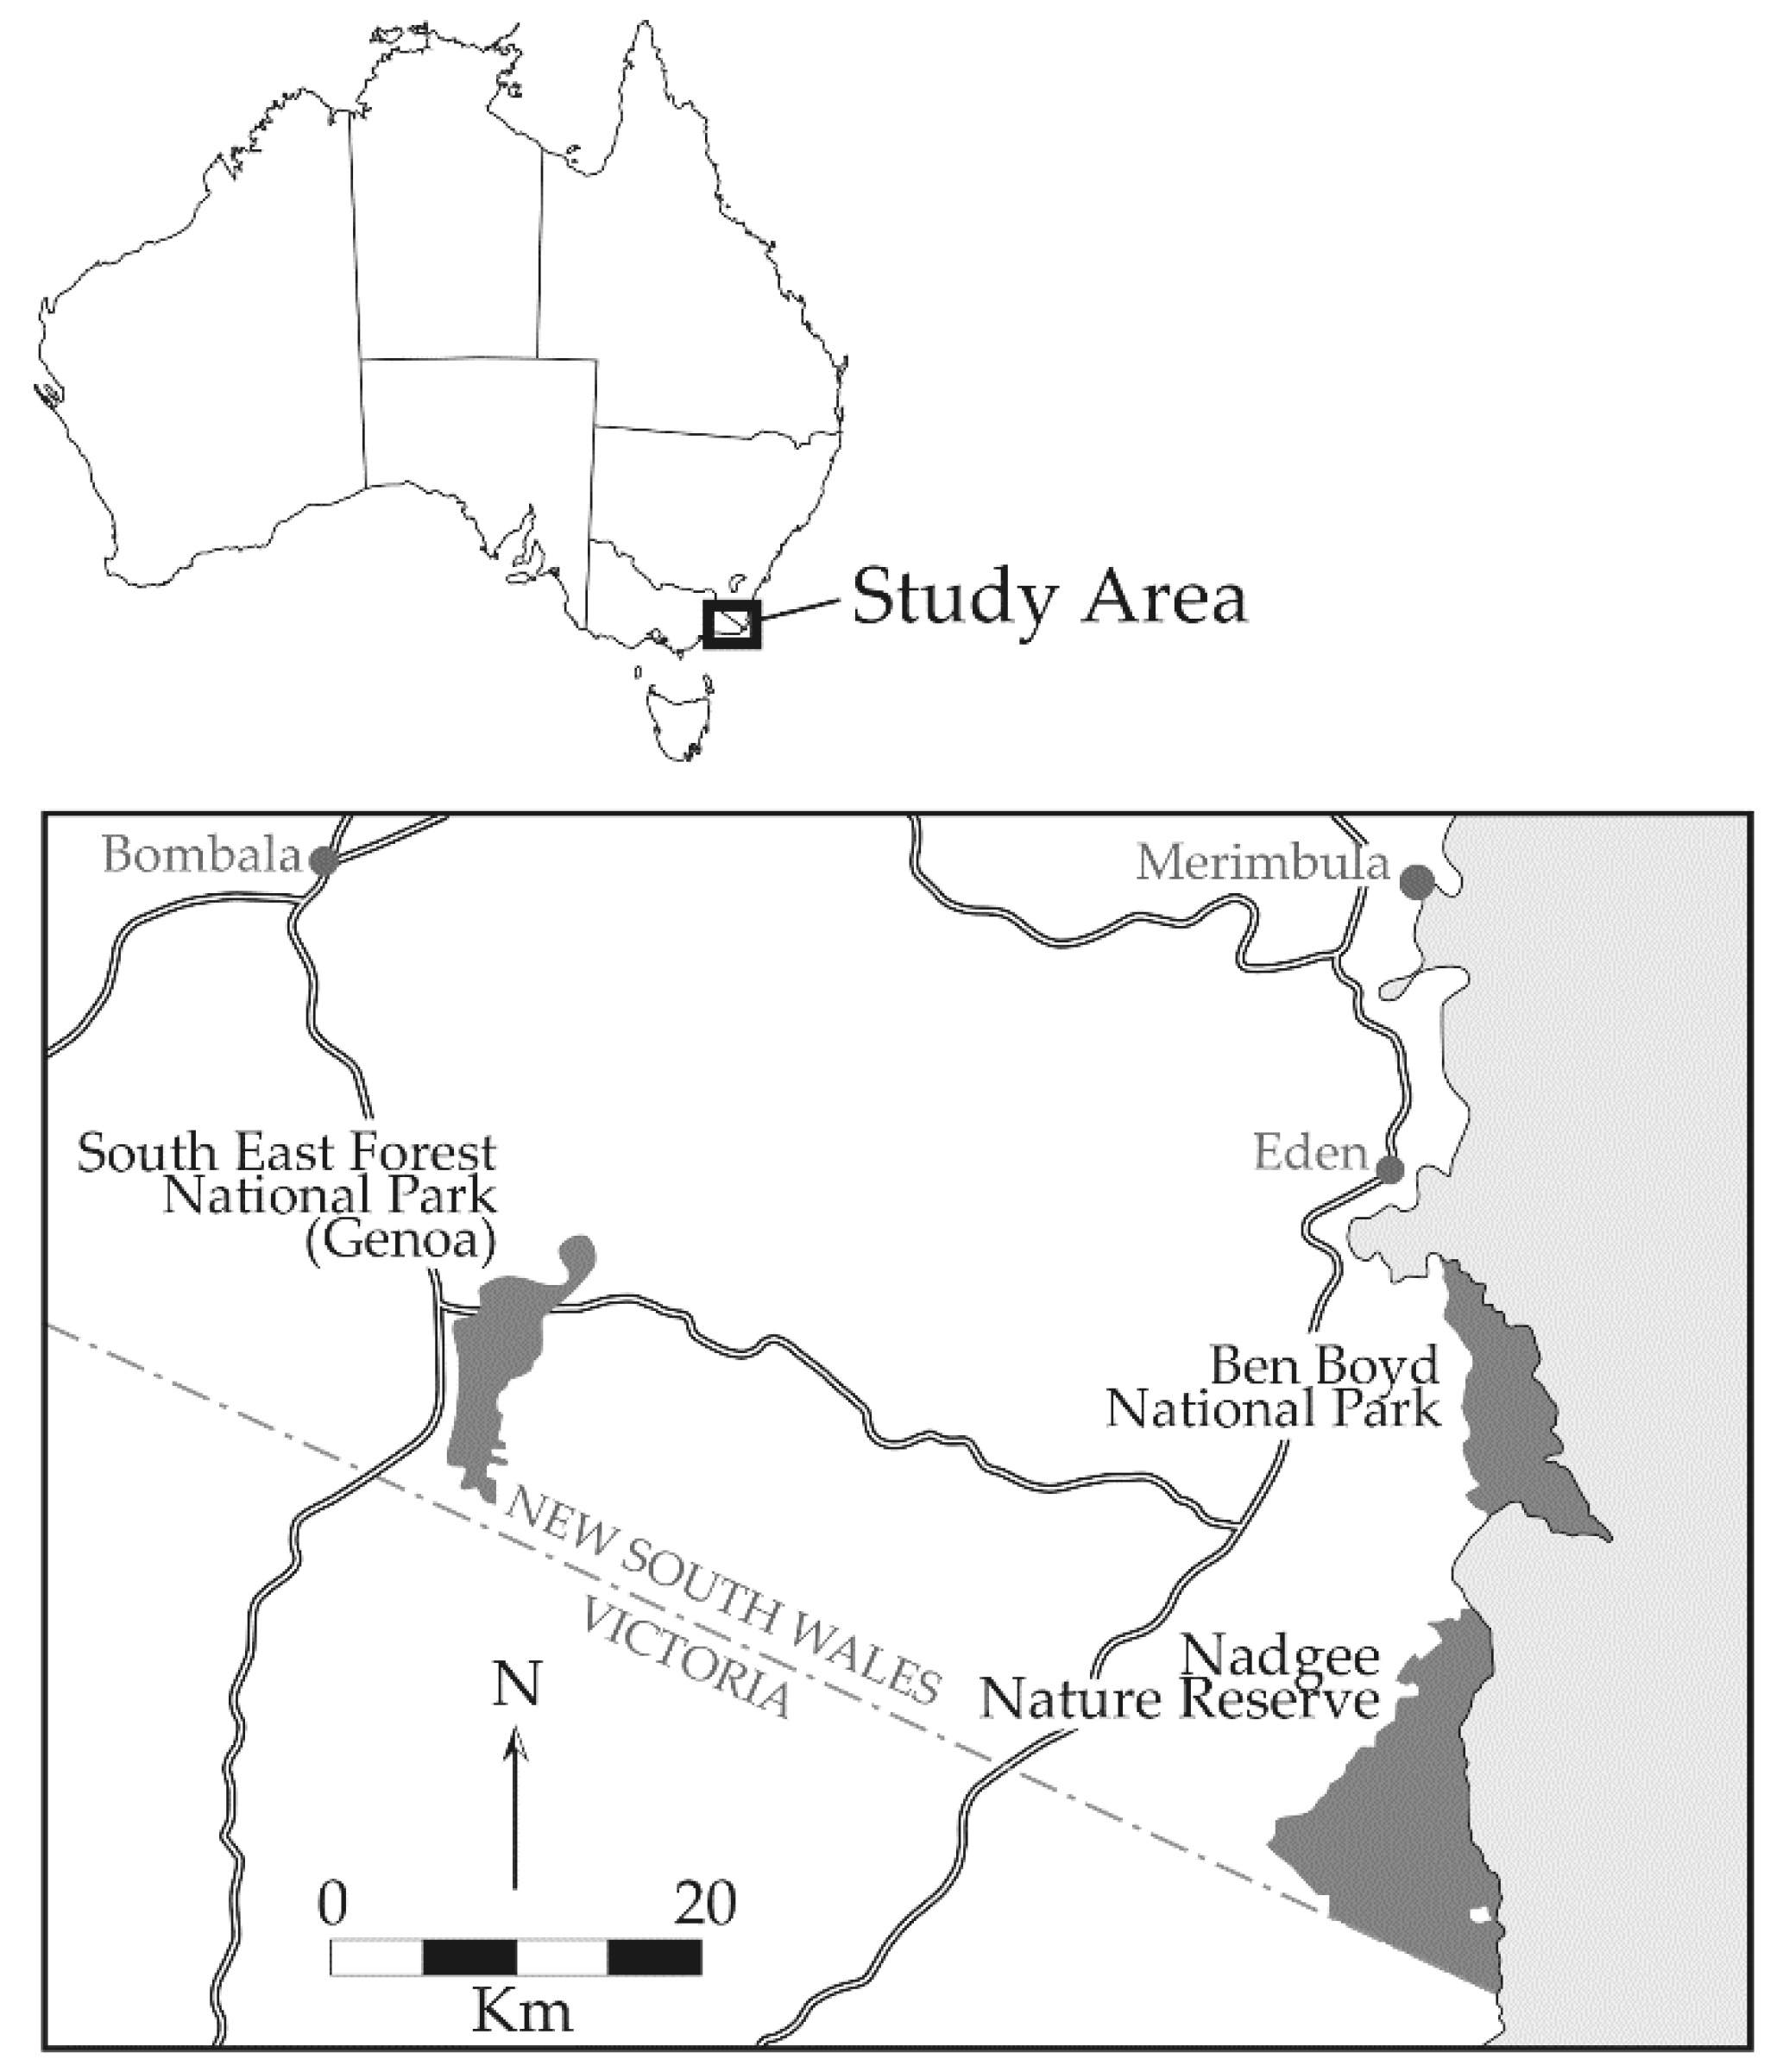
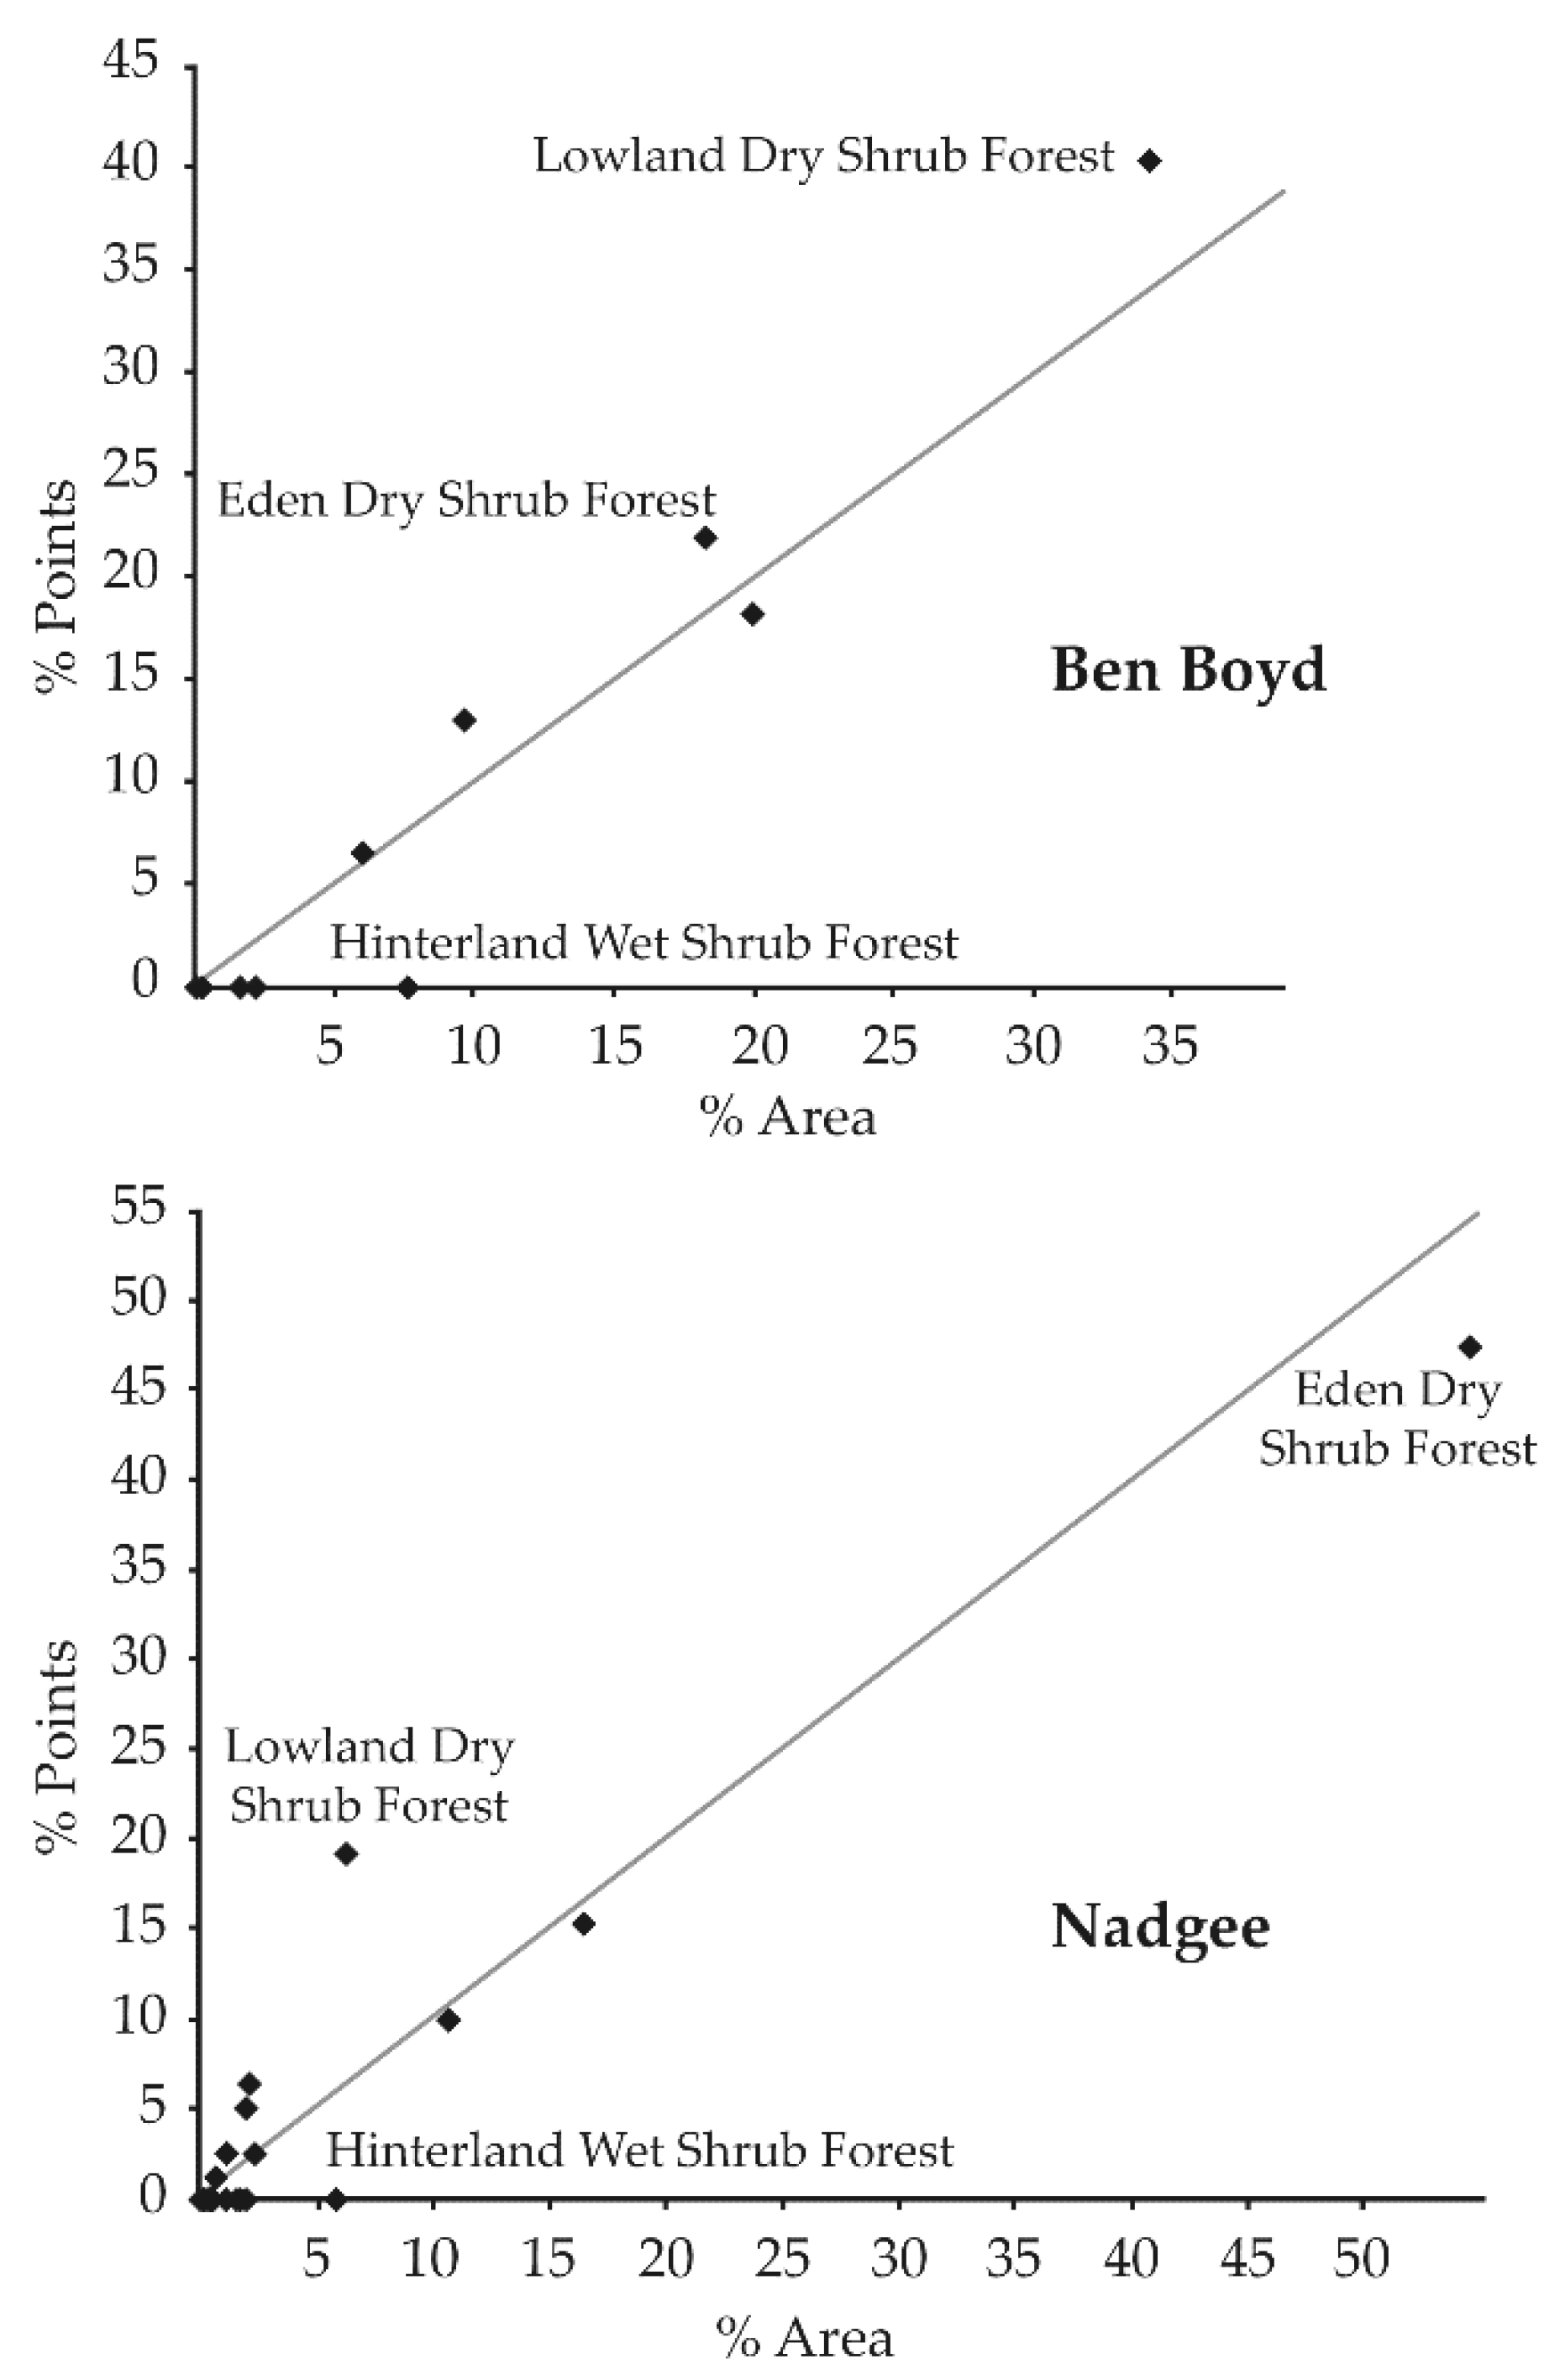
2.1. Study Area
2.2. Camera-Trap System
2.3. Camera-Trap Layout
2.4. Habitat Complexity Scoring
2.5. Data Analyses
2.6. Ethics and Wildlife Licensing Permits
3. Results
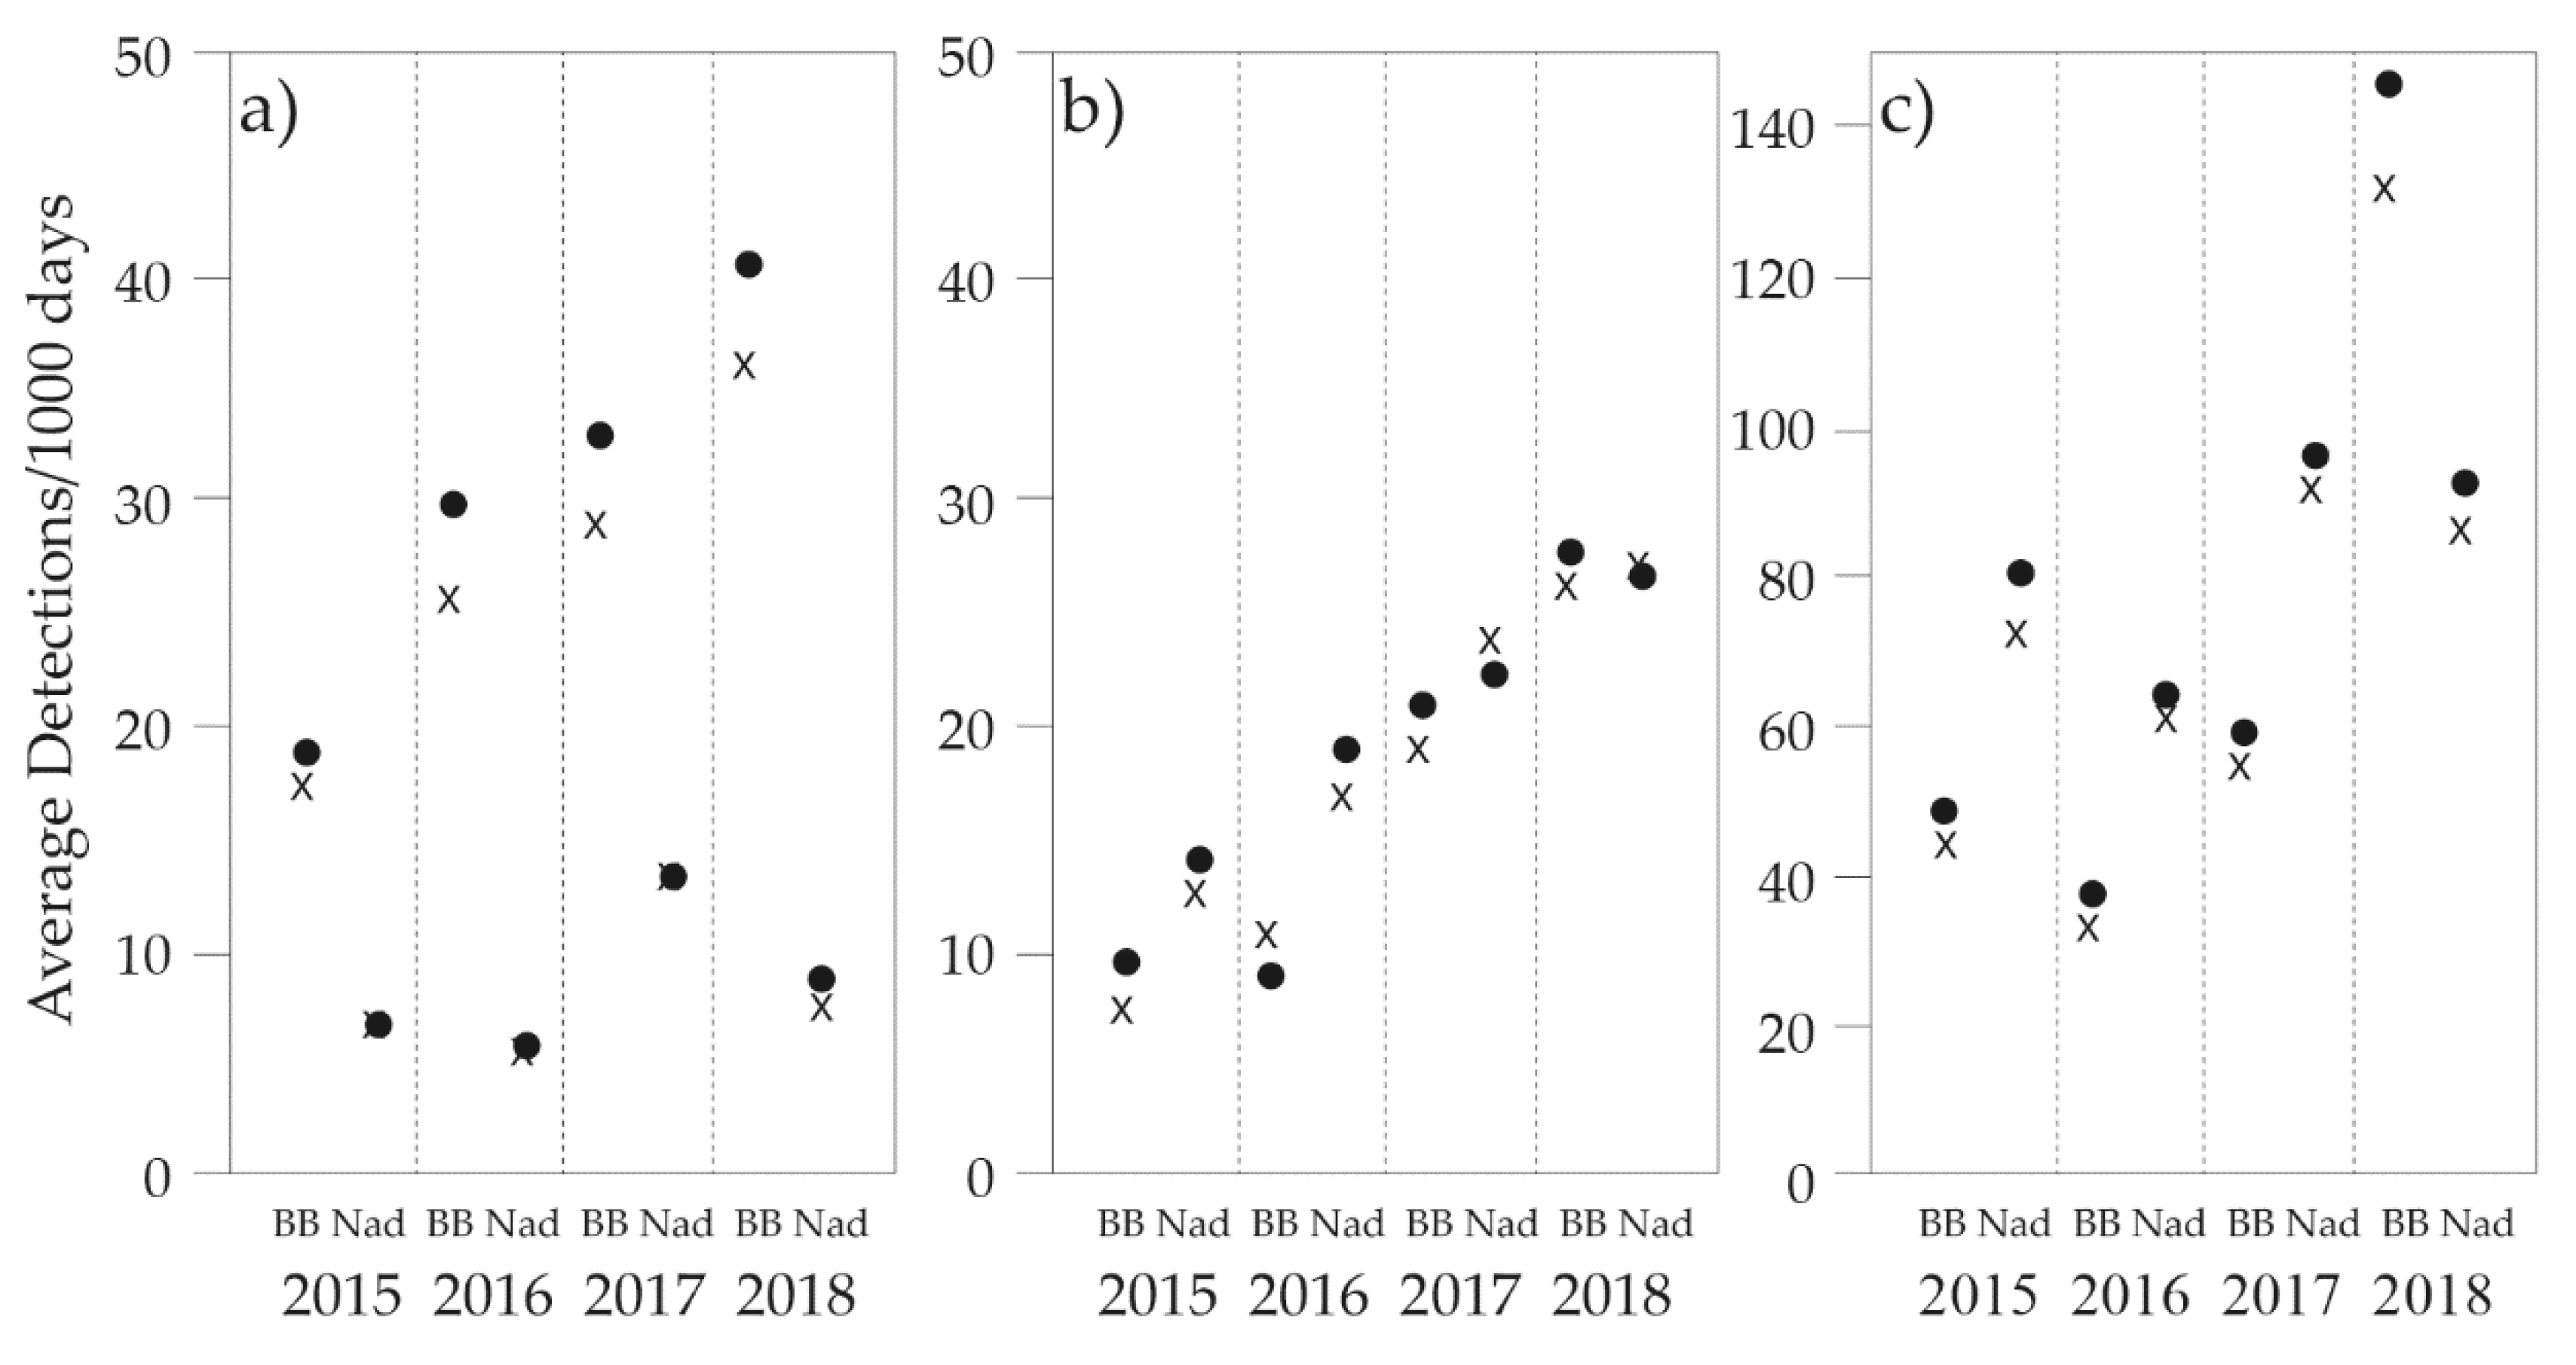
3.1. General Trends
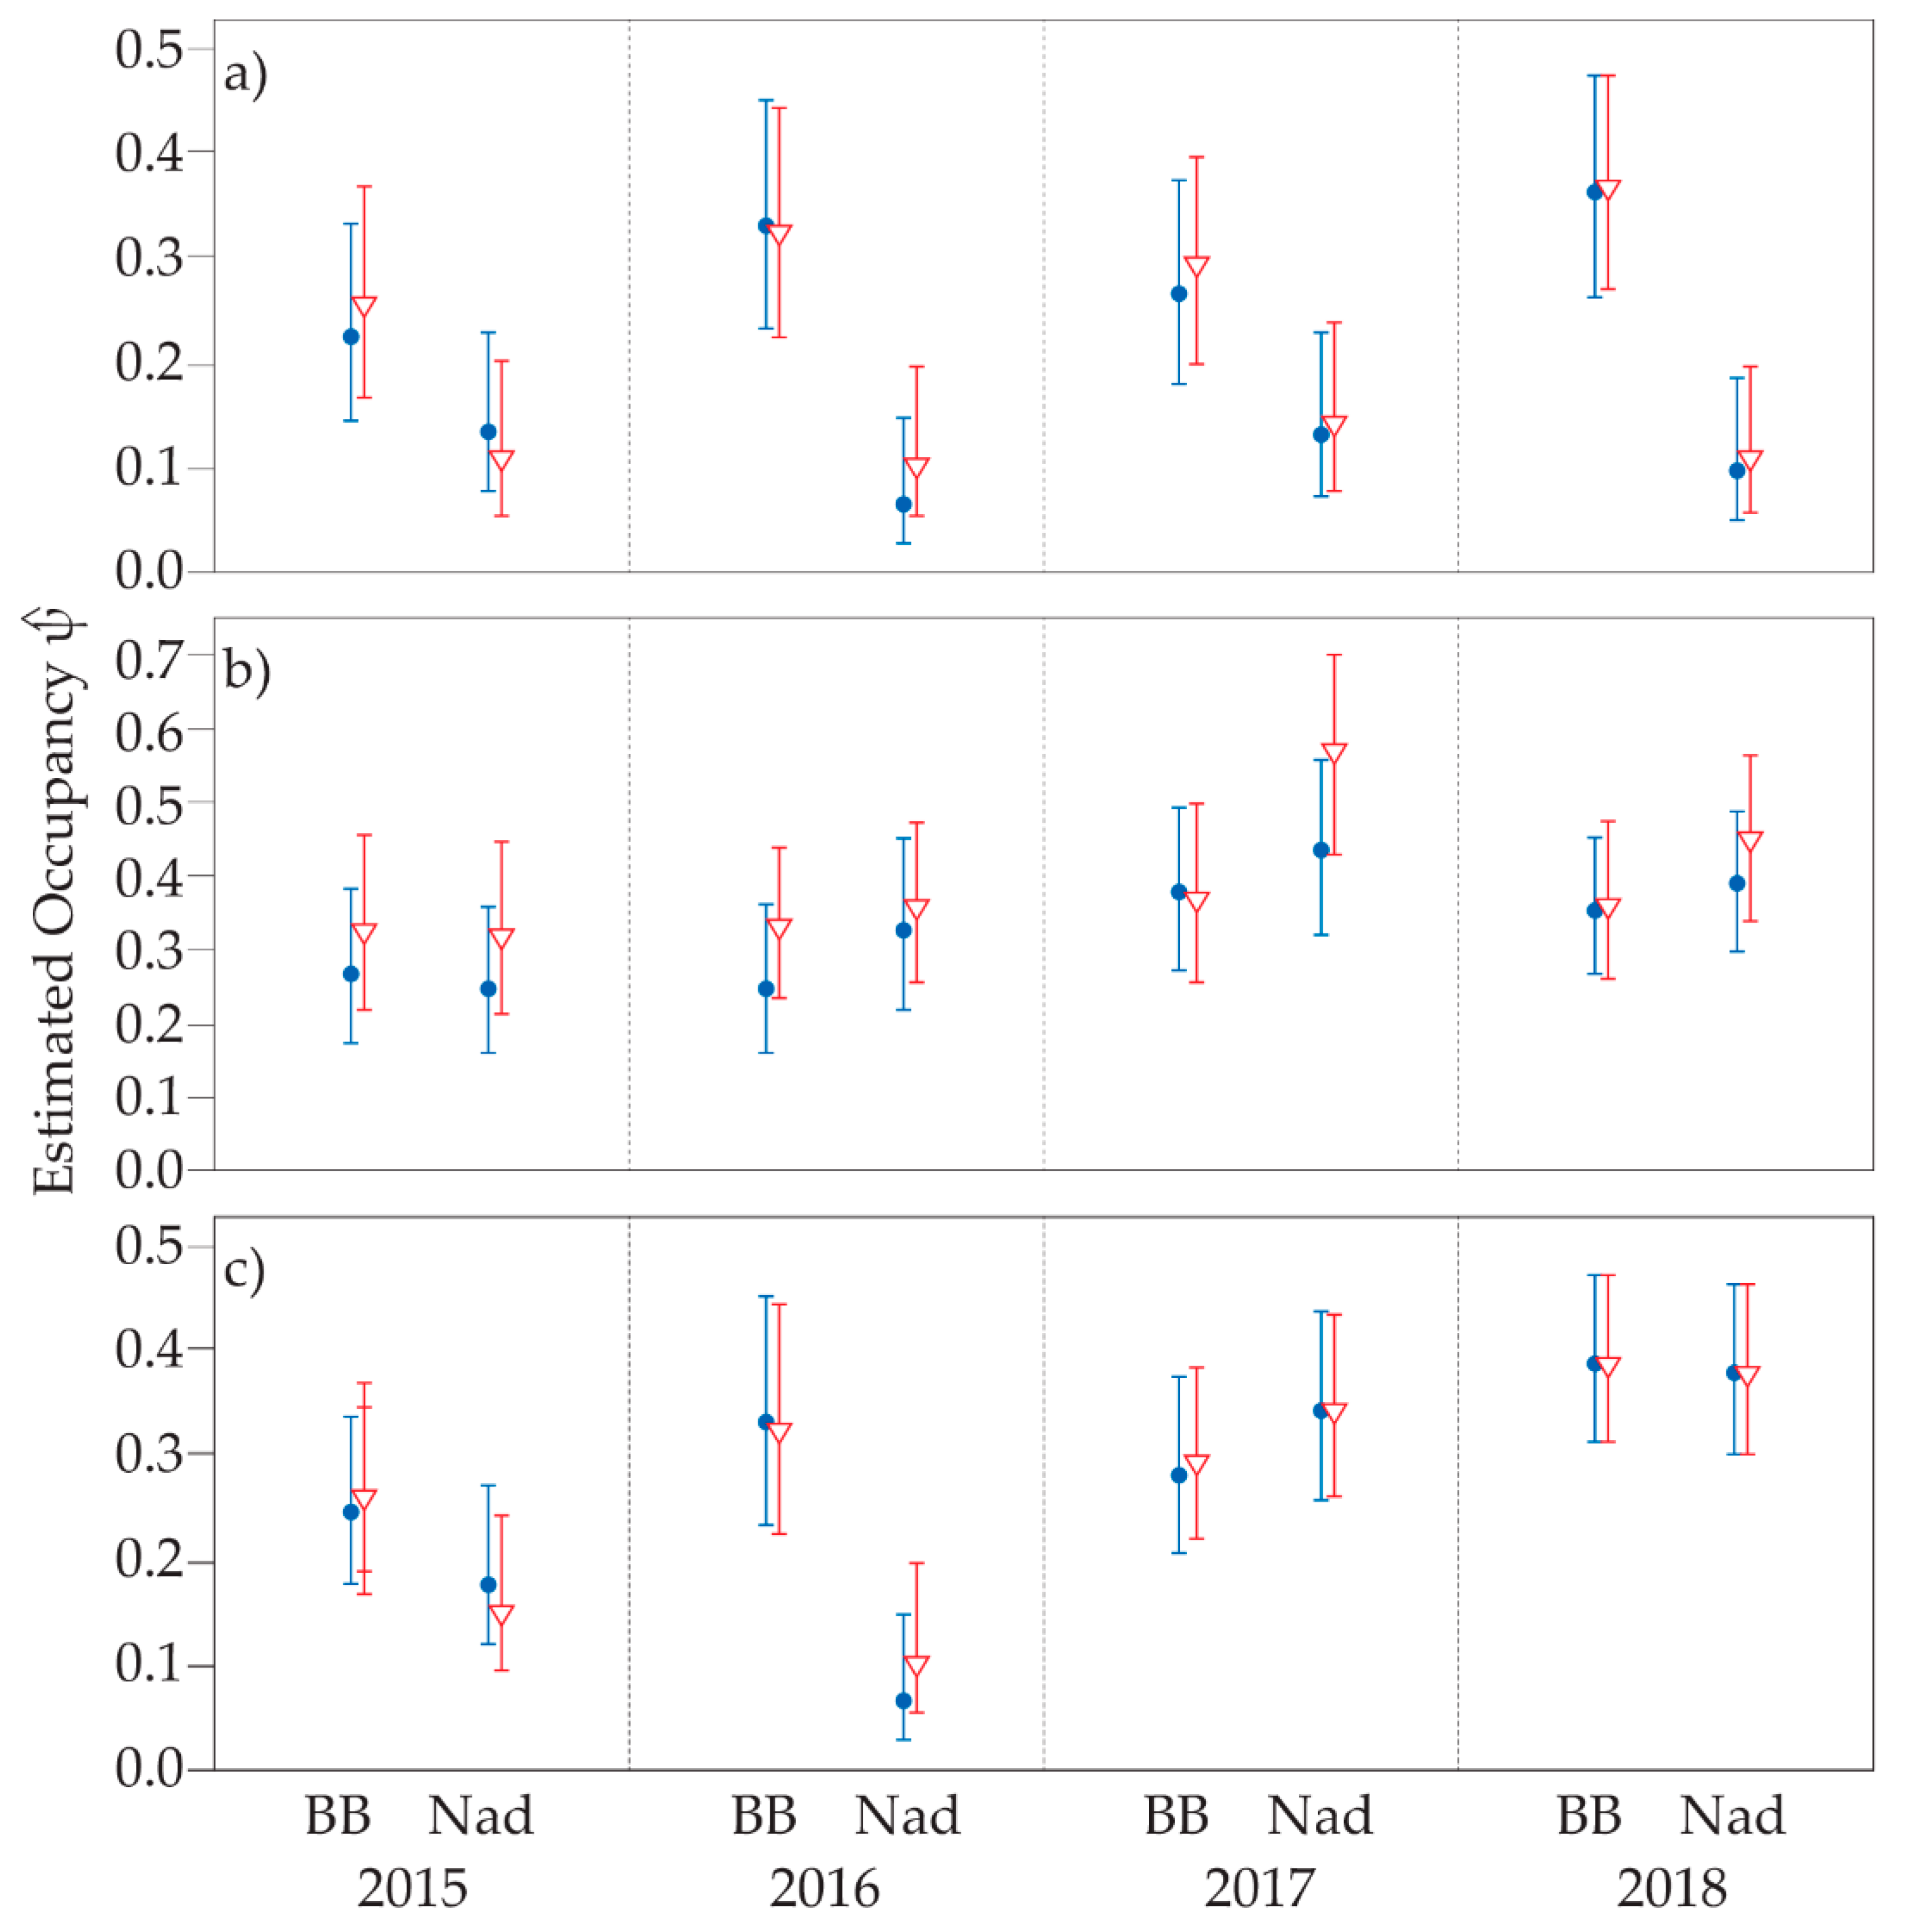
3.2. Single Season Occupancy
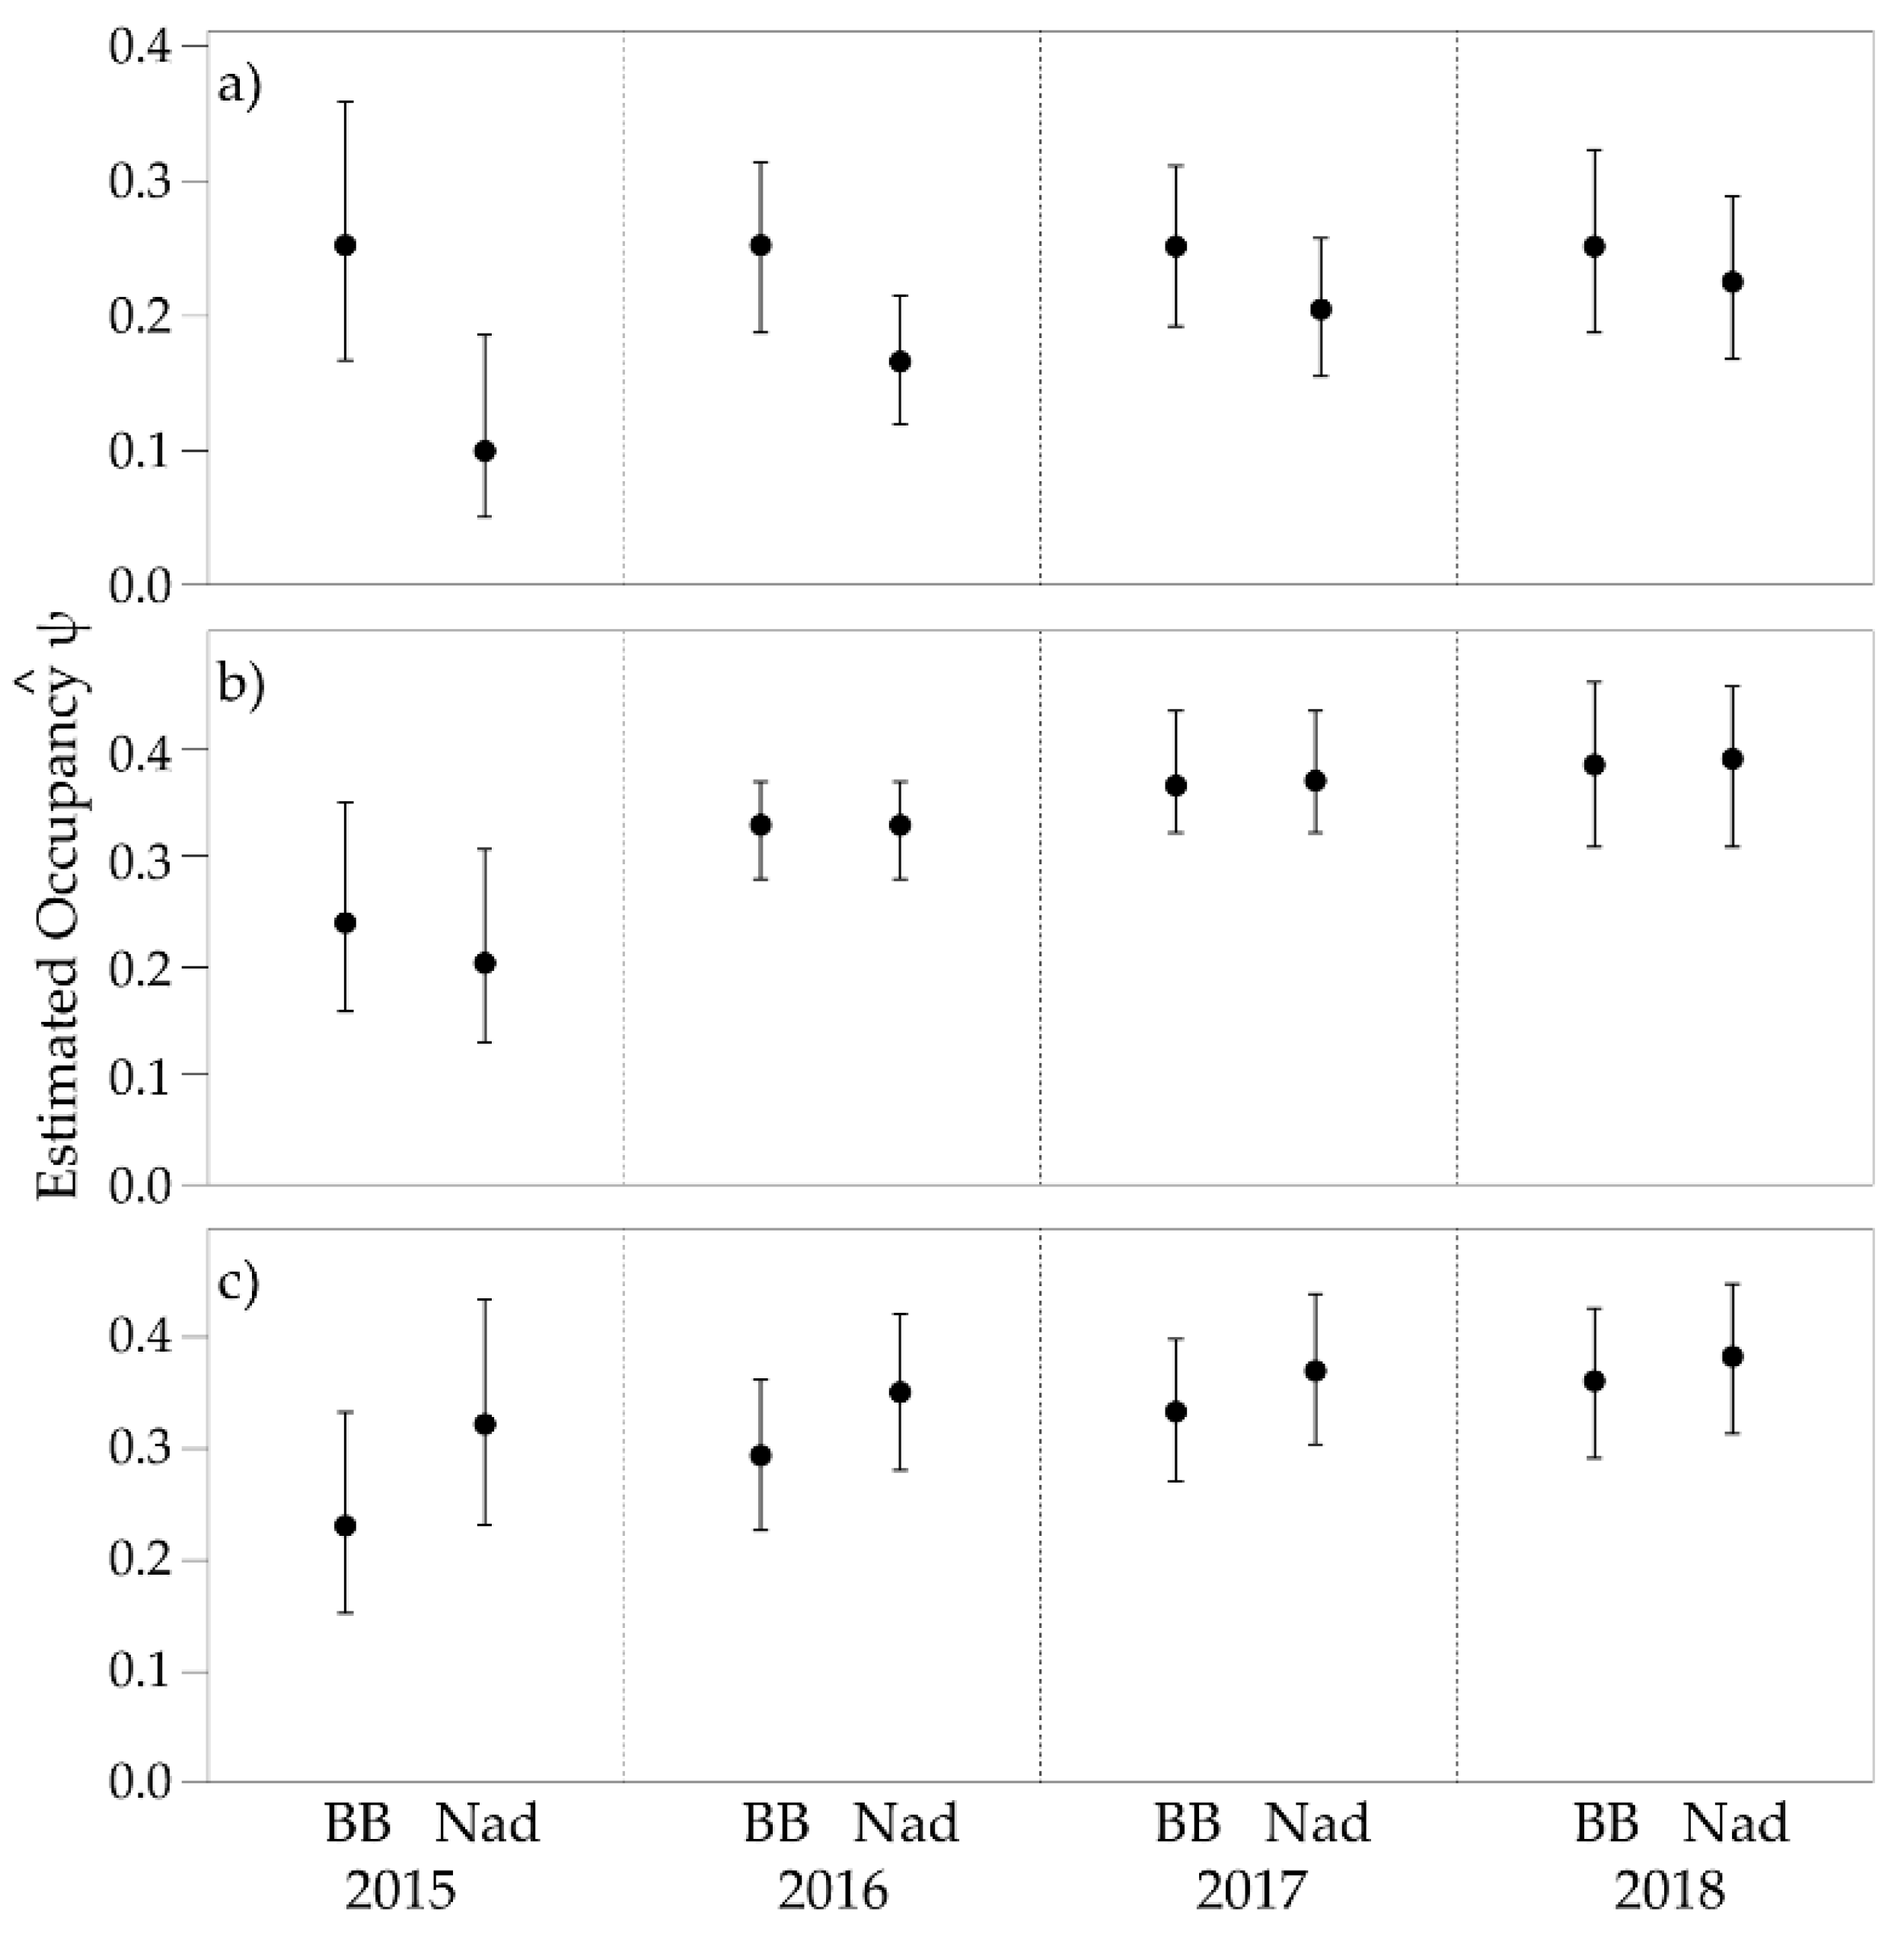
3.3. Multi-Season Occupancy
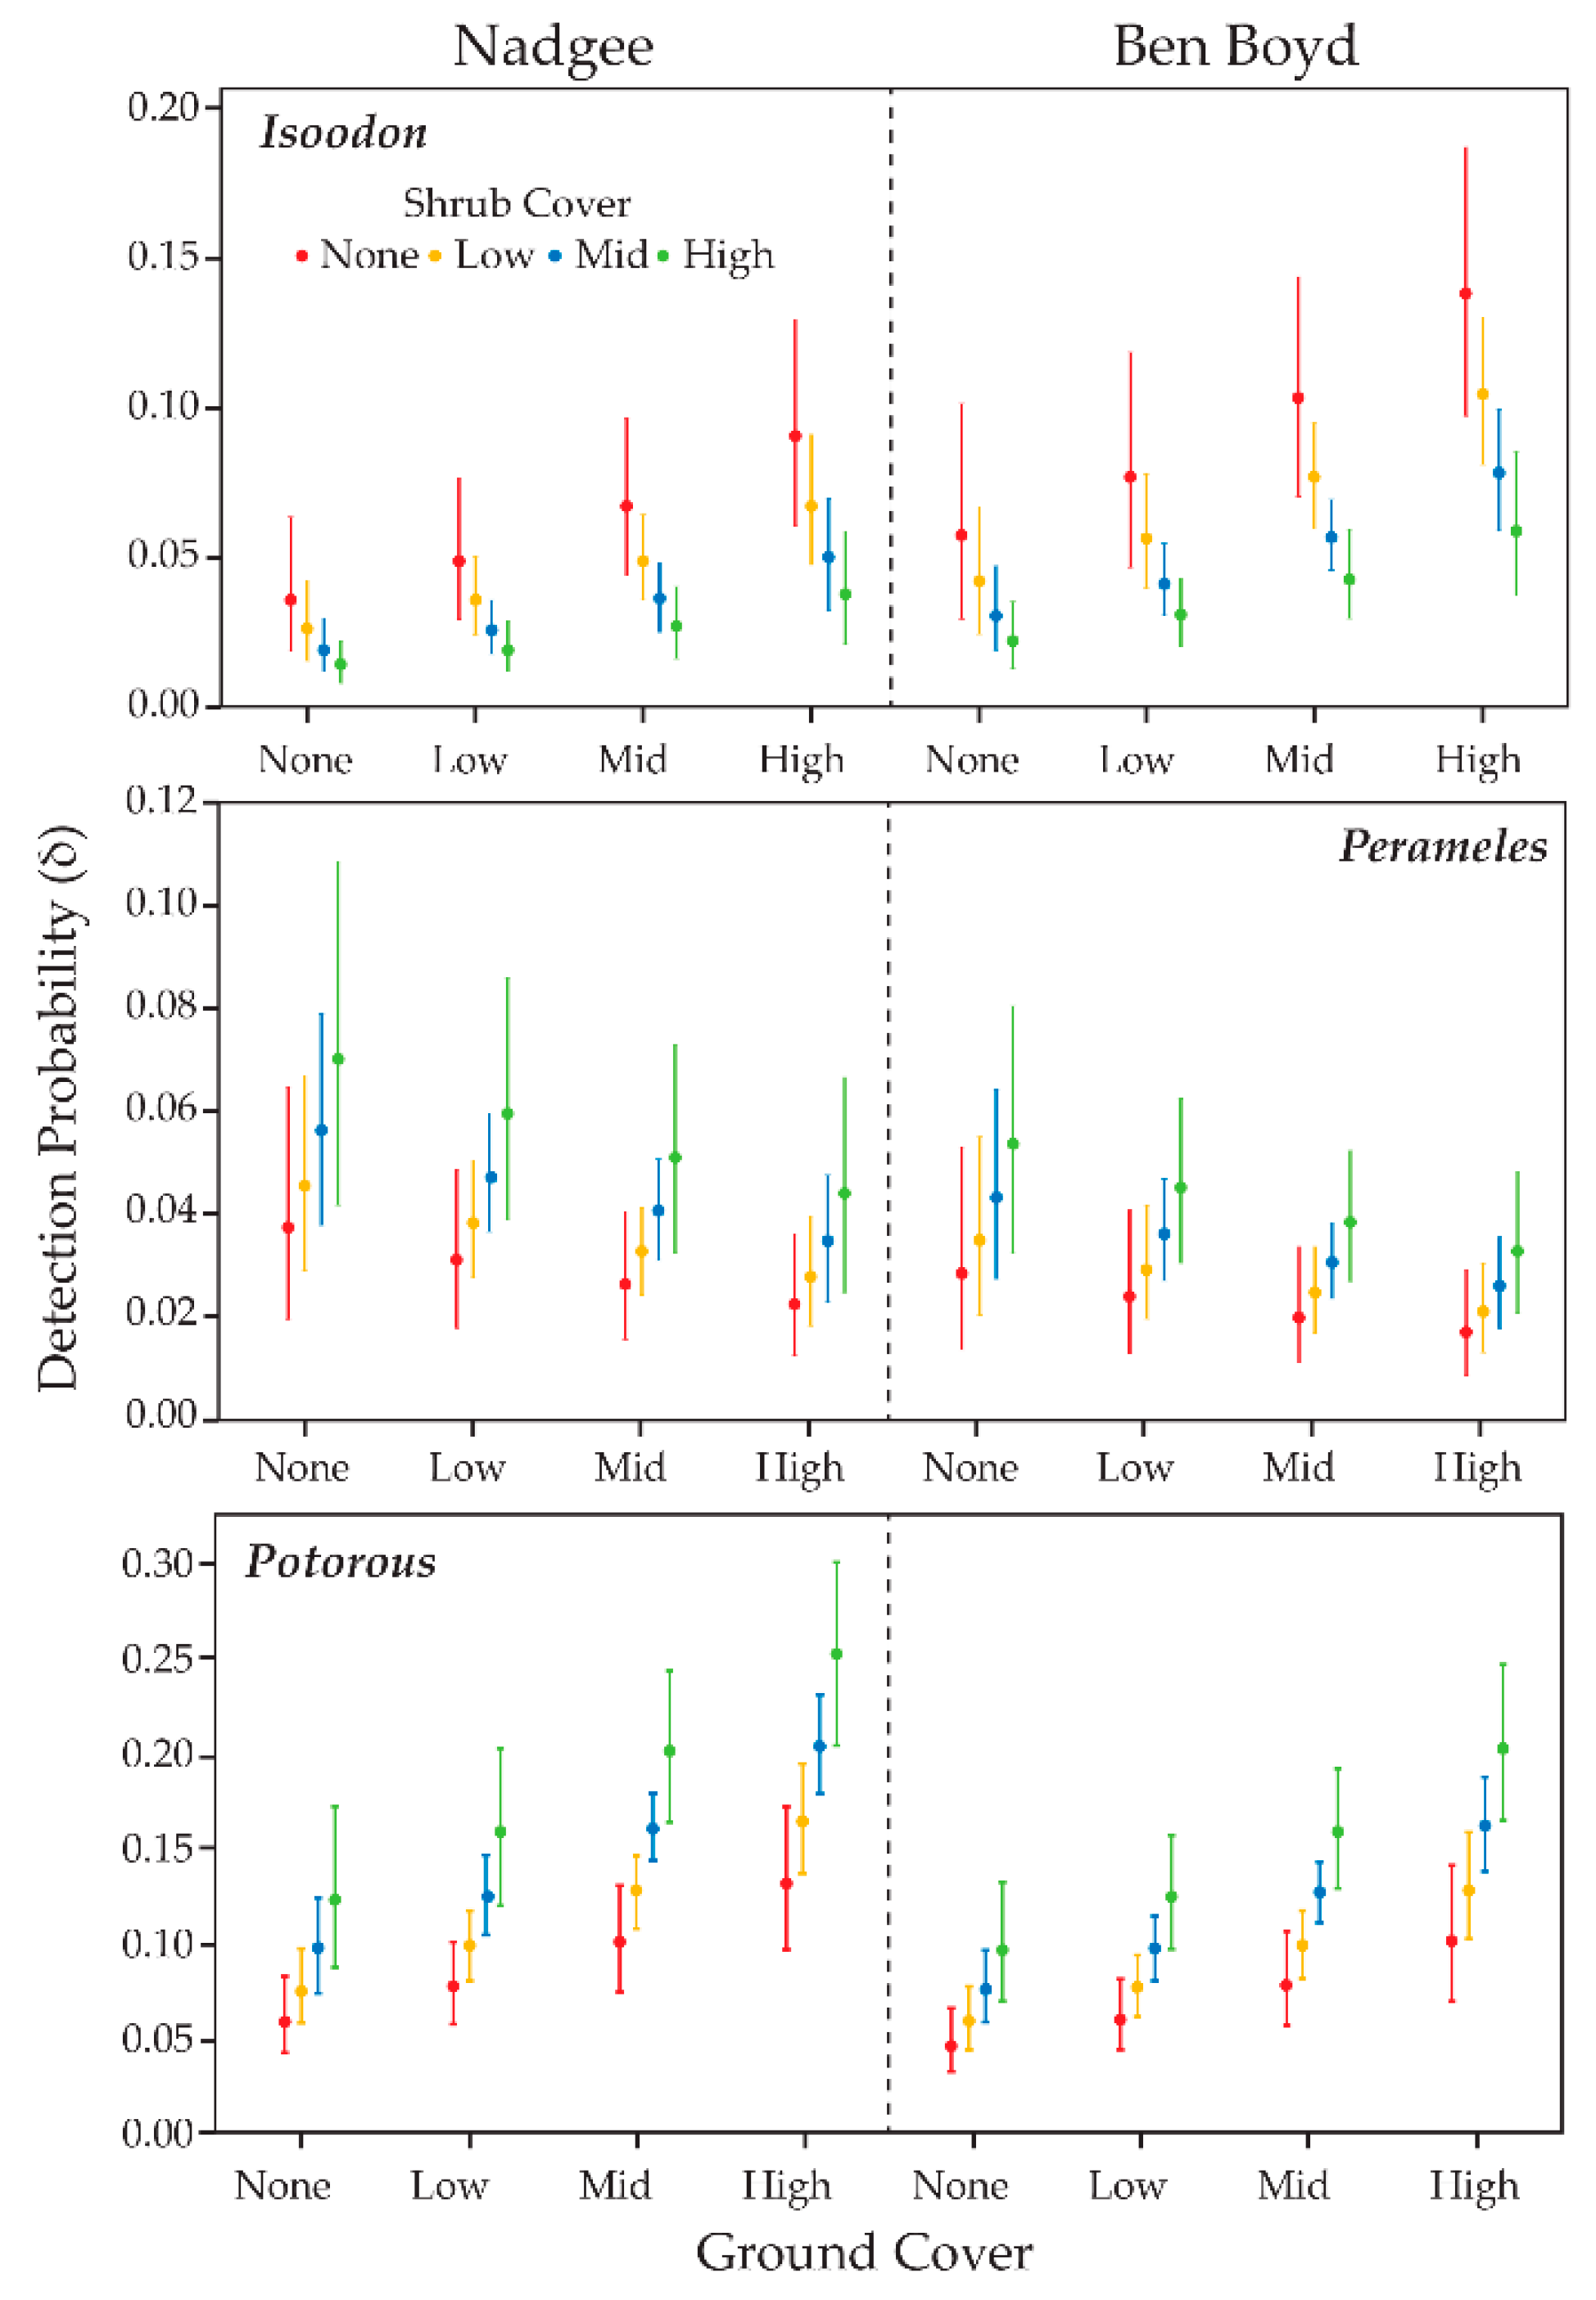
3.4. Detection Probability & Habitat Complexity
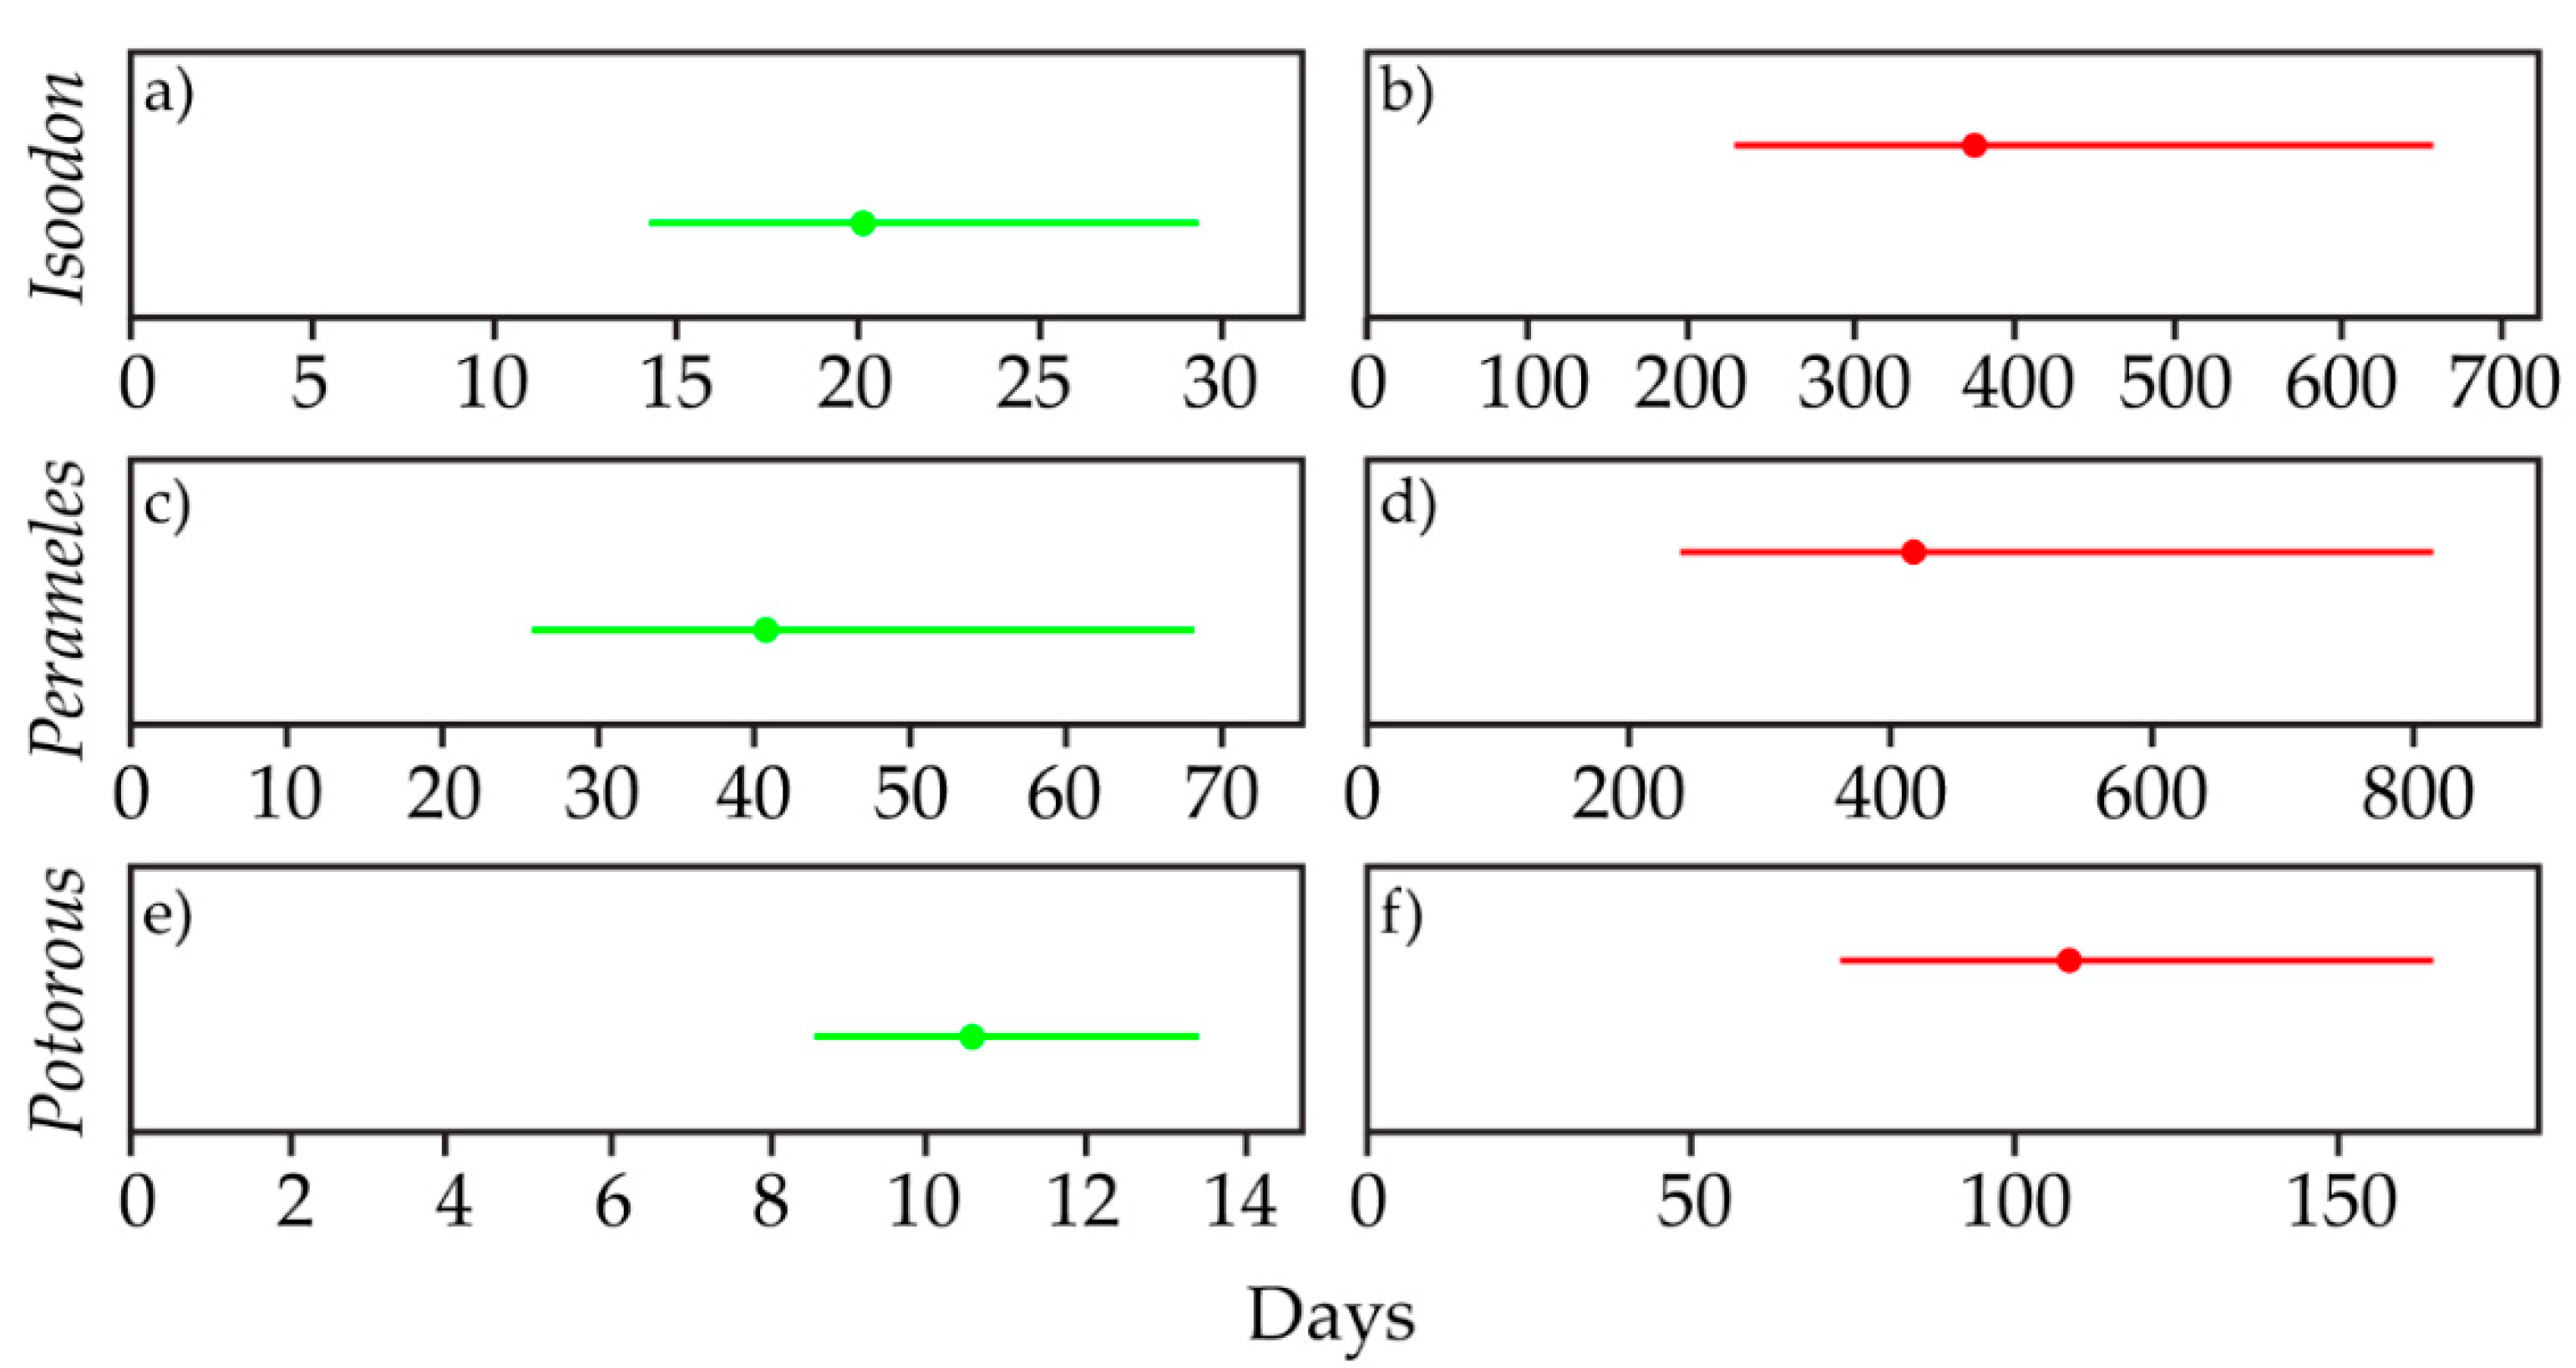
3.5. Survey Effort
4. Discussion
4.1. Utility of Camera-Traps
4.2. Habitat Complexity and Detectability
5. Conclusions
Author Contributions
Funding
Acknowledgments
Conflicts of Interest
References
- Burns, P.A.; Parrott, M.L.; Rowe, K.; Phillips, B.L. Identification of threatened rodent species using infrared and white-flash camera traps. Aust. Mamm. 2018, 40, 188–197. [Google Scholar] [CrossRef]
- Claridge, A.W.; Mifsud, G.; Dawson, J.; Saxon, M.J. Use of infrared digital cameras to investigate the behavior of cryptic species. Wildl. Res. 2004, 31, 645–650. [Google Scholar] [CrossRef]
- Jackson, R.M.; Rose, J.D.; Wangchuk, R.; Hunter, D.O. Estimating snow leopard population abundance using photography and capture-recapture techniques. Wildl. Soc. Bull. 2006, 34, 772–781. [Google Scholar] [CrossRef]
- Karanth, K.U.; Nichols, J.D. Estimation of tiger densities in India using photographic captures and recaptures. Ecology 1998, 79, 2852–2862. [Google Scholar] [CrossRef]
- McDonald, P.J.; Griffiths, A.D.; Nano, C.E.M.; Dickman, C.R.; Ward, S.J.; Luck, G.W. Landscape-scale factors determine occupancy of the critically endangered central rock-rat in arid Australia: the utility of camera trapping. Biol. Cons. 2015, 191, 93–100. [Google Scholar] [CrossRef]
- Cutler, T.L.; Swann, D.E. Using remote photography in wildlife ecology: A review. Wildl. Soc. Bull. 1999, 27, 571–581. [Google Scholar] [CrossRef]
- Dajun, W.; Sheng, L.; McShea, W.J.; Ming Fu, L. Use of remote-trip cameras for wildlife survey and evaluating the effectiveness of conservation activities at a nature reserve in Sichuan Province, China. Environ. Manag. 2006, 38, 942–951. [Google Scholar] [CrossRef]
- Ferreras, P.; Diaz-Ruiz, F.; Monterroso, P. Improving mesocarnivore detectability with lures in camera-trapping studies. Wildl. Res. 2018, 45, 505–517. [Google Scholar] [CrossRef]
- Lyra-Jorge, M.C.; Ciocheti, G.; Pivello, V.R.; Meirelles, S.T. Comparing methods for sampling large- and medium-sized mammals: Camera traps and track plots. Eur. J. Wildl. Res. 2008, 54, 739–744. [Google Scholar] [CrossRef]
- Rosellini, S.; Osorio, E.; Ruiz-González, A.; Piñeiro, A.; Barja, I. Monitoring the small-scale distribution of sympatric European pine martens (Martes martes) and stone martens (Martes foina): A multi-evidence approach using faecal DNA and camera-traps. Wildl. Res. 2008, 35, 434–440. [Google Scholar] [CrossRef]
- Meek, P.D.; Ballard, G-A.; Vernes, K.; Fleming, P.J.S. The history of wildlife camera trapping as a survey tool in Australia. Aust. Mammal. 2015, 37, 1–12. [Google Scholar] [CrossRef]
- Meek, P.D.; Ballard, G-A.; Fleming, P.J.S. The pitfalls of wildlife camera trapping as a survey tool in Australia. Aust. Mammal. 2015, 37, 13–22. [Google Scholar] [CrossRef]
- Welbourne, D.J.; Paull, D.J.; Claridge, A.W.; Ford, F.A. A frontier in the use of camera traps: surveying terrestrial squamate assemblages. Remote Sens. Ecol. Conserv. 2017, 3, 133–145. [Google Scholar] [CrossRef]
- Welbourne, D.J.; Claridge, A.W.; Paull, D.J.; Ford, F.A. Improving terrestrial squamate surveys with camera-trap programming and hardware modifications. Animals. 2019, 9, 388. [Google Scholar] [CrossRef]
- Johnson, C.N. Australia’s Mammal Extinctions: A 50,000 Year History; Cambridge University Press: Melbourne, Australia, 1996; p. 278. [Google Scholar]
- Wayne, A.F.; Wilson, B.A.; Woinarski, J.C.Z. Falling apart? Insights and lessons from three recent studies documenting rapid and severe decline in terrestrial mammal assemblages of northern, south-eastern and south-western Australia. Wildl. Res. 2017, 44, 114–126. [Google Scholar] [CrossRef]
- Johnson, C.N.; Isaac, J.L. Body mass and extinction risk in Australian maruspials: The “critical weight range” revisited. Austral Ecol. 2009, 34, 35–40. [Google Scholar] [CrossRef]
- Woinarski, J.C.Z.; Armstrong, M.; Brennan, K.; Fisher, A.; Griffiths, A.D.; Hills, B.; Milne, D.J.; Palmer, C.; Ward, S.; Watson, M.; et al. Monitoring indicates rapid and severe decline of native small mammals in Kakadu National Park, northern Australia. Wildl. Res. 2010, 37, 116–126. [Google Scholar] [CrossRef]
- Claridge, A.W.; Barry, S.C. Factors influencing the distribution of medium-sized ground-dwelling mammals in south-eastern mainland Australia. Austral Ecol. 2000, 25, 676–688. [Google Scholar] [CrossRef]
- Garden, J.G.; McAlpine, C.A.; Possingham, H.P.; Jones, D.N. Using multiple survey methods to detect terrestrial reptiles and mammals: What are the most successful and cost-efficient methods? Wildl. Res. 2007, 34, 218–227. [Google Scholar] [CrossRef]
- Scotts, D.J.; Craig, S.A. Improved hair-sampling tube for the detection of rare mammals. Aust. Wildl. Res. 1988, 15, 469–472. [Google Scholar] [CrossRef]
- Lindenmayer, D.B.; Incoll, R.; Cunningham, R.B.; Pope, M.L.; Donnelly, C.F.; MacGregor, C.I.; Tribolet, C.R.; Triggs, B.E. Comparison of hairtube types for the detection of mammals. Wildl. Res. 1999, 26, 745–753. [Google Scholar] [CrossRef]
- Mills, D.J.; Harris, B.; Claridge, A.W.; Barry, S.C. Efficacy of hair-sampling techniques for the detection of medium-sized terrestrial mammals. I. A comparison between hair-funnels, hair-tubes and indirect signs. Wildl. Res. 2002, 29, 379–387. [Google Scholar] [CrossRef]
- Paull, D.J.; Claridge, A.W.; Cunningham, R.B. Effective detection methods for medium-sized ground-dwelling mammals: A comparison between infrared digital cameras and hair tunnels. Wildl. Res. 2012, 39, 546–553. [Google Scholar] [CrossRef]
- Claridge, A.W.; Cunningham, R.B.; Catling, P.C.; Reid, A.M. Trends in the activity levels of forest-dwelling vertebrate fauna against a background of intensive baiting for foxes. For. Ecol. Manag. 2010, 260, 822–832. [Google Scholar] [CrossRef]
- Arthur, A.D.; Catling, P.C.; Reid, A.M. Relative influence of habitat structure, species interactions and rainfall on the post-fire population dynamics of ground-dwelling vertebrates. Austral Ecol. 2010, 37, 958–970. [Google Scholar] [CrossRef]
- Claridge, A.W.; Paull, D.J.; Barry, S.C. Detection of medium-sized ground-dwelling mammals using infrared digital cameras: An alternative way forward? Aust. Mammal. 2010, 32, 165–171. [Google Scholar] [CrossRef]
- New South Wales National Parks and Wildlife Service. Nadgee Nature Reserve Plan of Management; New South Wales National Parks and Wildlife Service: Sydney, Australia, 2003; p. 53.
- Newsome, A.E.; Catling, P.C. Habitat preferences of mammals inhabiting heathlands of warm temperate coastal, montane and alpine regions of southeastern Australia. In Ecosystems of The World 9A: Heathlands and Shrublands; Specht, R., Ed.; Elsevier Scientific Publishing Company: New York, NY, USA, 1979; pp. 301–316. [Google Scholar]
- Mackenzie, D.I.; Nichols, J.D.; Royle, J.A.; Pollock, K.H.; Bailey, L.L.; Hines, J.E. Occupancy Estimation and Modeling Inferring Patterns and Dynamics of Species Occurrence; Academic Press: Massachusetts, MA, USA, 2006; p. 344. [Google Scholar]
- Burnham, K.P.; Anderson, D.R. Model Selection and Multi-Model Inference, Second Edition; Springer: New York, NY, USA, 2002; p. 488. [Google Scholar]
- Spiegelhalter, D.; Thomas, A.; Nest, N.; Lunn, D. OpenBUGS User Manual (Version 3.2.3); MRC Biostatistics Unit: Cambridge, UK, 2014. [Google Scholar]
- McCarthy, M.A. Bayesian Methods for Ecology; Cambridge University Press: New York, NY, USA, 2012; p. 312. [Google Scholar]
- R Core Team. R: A Language and Environment for Statistical Computing (Version 3.5.3); R Foundation for Statistical Computing: Vienna, Austria, 2019. [Google Scholar]
- Fiske, I.; Chandler, R. Unmarked: An R package for fitting hierarchical models of wildlife occurrence and abundance. J. Stat. Softw. 2011, 43, 1–23. [Google Scholar] [CrossRef]
- Thomas, N. R2OpenBUGS. R CRAN: R Core Team. 2015. Available online: http://cran.r-project.org/web/packages/R2OpenBUGS/R2OpenBUGS.pdf (accessed on 19 May 2019).
- Plummer, M. coda R CRAN: R Core Team. 2015. Available online: http://cran.r-project.org/web/packages/coda/coda.pdf (accessed on 19 May 2019).
- Yau, C. R Tutorial with Bayesian Statistics Using OpenBUGS. 2015. Available online: http://www.r-tutor.com/bayesian-statistics/openbugs (accessed on 19 May 2019).
- Garnett, S.; Latch, P.; Lindenmayer, D.B.; Woinarski, J. Recovering Australian Threatened Species; CSIRO Publishing: Collingwood, Victoria, Australia, 2018; p. 360. [Google Scholar]
- Dexter, N.; Murray, A.J. The impact of fox control on the relative abundance of forest mammals in East Gippsland, Victoria. Wildl. Res. 2009, 36, 252–261. [Google Scholar] [CrossRef]
- Catling, P.C.; Burt, R.J. Studies of the ground-dwelling mammals of eucalypt forests in south-eastern New South Wales: the effect of habitat variables on distribution and abundance. Wildl. Res. 1995, 22, 271–288. [Google Scholar] [CrossRef]
- Catling, P.C.; Coops, N.C.; Burt, R.J. The distribution and abundance of ground-dwelling mammals in relation to time since wildfire and vegetation structure in south-eastern Australia. Wildl. Res. 2001, 28, 555–565. [Google Scholar] [CrossRef]
- Davis, N.E.; Forsyth, D.M.; Triggs, B.; Pascoe, C.; Benshemesh, J.; Robley, A.; Lawrence, J.; Ritchie, E.G.; Nimmo, D.G.; Lumsden, L.F. Interspecific and geographic variation in the diets of sympatric carnivores: dingoes/wild dogs and red foxes in south-eastern Australia. PLoS ONE 2016, 10, e0120975. [Google Scholar] [CrossRef]
- Norton, M.A.; French, K.; Claridge, A.W. Habitat associations of the long-nosed potoroo (Potorous tridactylus) at multiple spatial scales. Aust. J. Zool 2011, 58, 303–316. [Google Scholar] [CrossRef]
- Pease, B.S.; Nielsen, C.K.; Holzmueller, E.J. Single-camera trap survey designs miss detections: Impacts on estimates of occupancy and community metrics. PLoS ONE 2016, 11, e0166689. [Google Scholar] [CrossRef]
- O’Connor, K.M.; Nathan, L.R.; Liberati, M.R.; Tingley, M.W.; Vokoun, J.C.; Rittenhouse, T.A.G. Camera trap arrays improve detection probability of wildlife: Investigating study design considerations using an empirical dataset. PLoS ONE 2017, 12, e0175684. [Google Scholar] [CrossRef]
- Paull, D.J.; Claridge, A.W.; Barry, S.C. There’s no accounting for taste: Bait attractants and infrared digital cameras for detecting small to medium ground-dwelling mammals. Wildl. Res. 2011, 38, 188–195. [Google Scholar] [CrossRef]
- Claridge, A.W.; Paull, D.J.; Cunningham, R.B. Oils ain’t oils: Can truffle-infused food additives improve detection of rare and cryptic mycophagous mammals? Aust. Mammal. 2016, 38, 12–20. [Google Scholar] [CrossRef]
- Fancourt, B.A.; Sweaney, M.; Fletcher, D. More haste, less speed: Pilot study suggests camera trap detection zone could be more important than trigger speed to maximize species detections. Aust. Mammal. 2018, 40, 118–121. [Google Scholar] [CrossRef]
- Meek, P.D.; Ballard, G.A.; Fleming, P.J.S.; Schaefer, M.; Williams, W.; Falzon, G. Camera traps can be heard and seen by animals. PLoS ONE 2014, 9, e0110832. [Google Scholar] [CrossRef]


| Habitat Attribute | Score | |||
|---|---|---|---|---|
| 0 | 1 | 2 | 3 | |
| Tree Cover (>10 m) (%) | 0 | <30 | 30–70 | >70 |
| Shrub Cover (1–10 m) (%) | 0 | <30 | 30–70 | >70 |
| Ground (0–1 m) Cover (%) | 0 | <30 | 30–70 | >70 |
| Woody Debris (%) | 0 | <30 | 30–70 | >70 |
| Rocks (%) | 0 | <30 | 30–70 | >70 |
| Leaf Litter (%) | 0 | <30 | 30–70 | >70 |
| Moisture | Dry | Moist | Water Nearby | Water-Logged |
| ΔAIC/ΔDIC | Degree of Support |
|---|---|
| 0–2 | Substantial |
| 4–7 | Considerably Less |
| >10 | Essentially None |
| Year | Isoodon | Perameles | Potorous |
|---|---|---|---|
| 2015 | 61 (78) | 56 (65) | 307 (374) |
| 2016 | 84 (98) | 67 (89) | 243 (304) |
| 2017 | 111 (136) | 103 (136) | 368 (374) |
| 2018 | 124 (148) | 137 (180) | 599 (735) |
| Total | 380 (460) | 363 (470) | 1517 (1880) |
| Year | Model | K | ΔAIC | AIC Weight |
|---|---|---|---|---|
| Isoodon | ||||
| 2015 | ψ(area) p(.) | 3 | 0.00 | 0.71 |
| ψ(.) p(.) | 2 | 1.79 | 0.29 | |
| 2016 | ψ(area) p(.) | 3 | 0.00 | 0.99 |
| ψ(.) p(.) | 2 | 15.22 | <0.01 | |
| 2017 | ψ(area) p(.) | 3 | 0.00 | 0.77 |
| ψ(.) p(.) | 2 | 2.43 | 0.23 | |
| 2018 | ψ(area) p(.) | 3 | 0.00 | 0.99 |
| ψ(.) p(.) | 2 | 14.04 | <0.01 | |
| Perameles | ||||
| 2015 | ψ(.) p(.) | 2 | 0.00 | 0.67 |
| ψ(area) p(.) | 3 | 1.40 | 0.33 | |
| 2016 | ψ(.) p(.) | 2 | 0.00 | 0.57 |
| ψ(area) p(.) | 3 | 0.57 | 0.43 | |
| 2017 | ψ(area) p(.) | 3 | 0.00 | 0.52 |
| ψ(.) p(.) | 2 | 0.17 | 0.48 | |
| 2018 | ψ(area) p(.) | 3 | 0.00 | 0.58 |
| ψ(.) p(.) | 2 | 0.67 | 0.42 | |
| Potorous | ||||
| 2015 | ψ(.) p(.) | 2 | 0.00 | 0.52 |
| ψ(area) p(.) | 3 | 0.16 | 0.48 | |
| 2016 | ψ(area) p(.) | 3 | 0.00 | 0.84 |
| ψ(.) p(.) | 2 | 3.35 | 0.16 | |
| 2017 | ψ(.) p(.) | 2 | 0.00 | 0.54 |
| ψ(area) p(.) | 3 | 0.34 | 0.46 | |
| 2018 | ψ(.) p(.) | 2 | 0.00 | 0.71 |
| ψ(area) p(.) | 3 | 1.77 | 0.29 |
| Year | Model | K | ΔAIC | AIC Weight |
|---|---|---|---|---|
| Isoodon | ||||
| 2015 | ψ(area) p(.) | 3 | 0.00 | 0.84 |
| ψ(.) p(.) | 2 | 3.37 | 0.16 | |
| 2016 | ψ(area) p(.) | 3 | 0.00 | 0.99 |
| ψ(.) p(.) | 2 | 9.17 | 0.01 | |
| 2017 | ψ(area) p(.) | 3 | 0.00 | 0.81 |
| ψ(.) p(.) | 2 | 2.92 | 0.19 | |
| 2018 | ψ(area) p(.) | 3 | 0.00 | 0.99 |
| ψ(.) p(.) | 2 | 13.36 | <0.01 | |
| Perameles | ||||
| 2015 | ψ(.) p(.) | 2 | 0.00 | 0.72 |
| ψ(area) p(.) | 3 | 1.89 | 0.28 | |
| 2016 | ψ(.) p(.) | 2 | 0.00 | 0.64 |
| ψ(area) p(.) | 3 | 1.16 | 0.36 | |
| 2017 | ψ(area) p(.) | 3 | 0.00 | 1.00 |
| ψ(.) p(.) | 2 | 57.55 | 0.00 | |
| 2018 | ψ(area) p(.) | 3 | 0.00 | 1.00 |
| ψ(.) p(.) | 2 | 124.84 | 0.00 | |
| Potorous | ||||
| 2015 | ψ(.) p(.) | 2 | 0.00 | 0.54 |
| ψ(area) p(.) | 3 | 0.35 | 0.46 | |
| 2016 | ψ(area) p(.) | 3 | 0.00 | 0.70 |
| ψ(.) p(.) | 2 | 1.71 | 0.30 | |
| 2017 | ψ(.) p(.) | 2 | 0.00 | 0.52 |
| ψ(area) p(.) | 3 | 0.17 | 0.48 | |
| 2018 | ψ(.) p(.) | 2 | 0.00 | 0.71 |
| ψ(area) p(.) | 3 | 1.77 | 0.29 |
| Model | K | ΔAIC | AIC Weight |
|---|---|---|---|
| Isoodon | |||
| ψ(area) γ(.) ε(.) p(.) | 5 | 0.00 | 0.87 |
| ψ(.) γ(.) ε(.) p(.) | 4 | 4.26 | 0.10 |
| ψ(area) γ(year) ε(year) p(.) | 9 | 7.26 | 0.02 |
| ψ(.) γ(year) ε(year) p(.) | 8 | 52.14 | 0.01 |
| Perameles | |||
| ψ(.) γ(.) ε(.) p(.) | 4 | 0.00 | 0.33 |
| ψ(.) γ(year) ε(year) p(.) | 8 | 0.53 | 0.25 |
| ψ(area) γ(.) ε(.) p(.) | 5 | 0.62 | 0.24 |
| ψ(area) γ(year) ε(year) p(.) | 9 | 1.11 | 0.19 |
| Potorous | |||
| ψ(.) γ(.) ε(.) p(.) | 4 | 0.00 | 0.48 |
| ψ(area) γ(.) ε(.) p(.) | 5 | 0.23 | 0.43 |
| ψ(.) γ(year) ε(year) p(.) | 8 | 4.49 | 0.05 |
| ψ(area) γ(year) ε(year) p(.) | 9 | 4.71 | 0.04 |
| Model | DIC | ΔDIC | Iterations |
|---|---|---|---|
| Isoodon | |||
| Baiting + Habitat + Year | 2158 | 0 | 2500 |
| Baiting + Habitat | 2169 | 11 | 2500 |
| Habitat | 2178 | 20 | 2500 |
| Baiting | 2189 | 31 | 2500 |
| Null | 2199 | 41 | 2500 |
| Perameles | |||
| Baiting + Habitat + Year | 2233 | 0 | 2500 |
| Baiting + Habitat | 2262 | 29 | 2500 |
| Baiting | 2263 | 30 | 2500 |
| Habitat | 2264 | 31 | 2500 |
| Null | 2265 | 32 | 2500 |
| Potorous | |||
| Baiting + Habitat + Year | 5429 | 0 | 2500 |
| Baiting + Habitat | 5453 | 24 | 2500 |
| Habitat | 5466 | 37 | 2500 |
| Baiting | 5491 | 62 | 2500 |
| Null | 5499 | 70 | 2500 |
© 2019 by the authors. Licensee MDPI, Basel, Switzerland. This article is an open access article distributed under the terms and conditions of the Creative Commons Attribution (CC BY) license (http://creativecommons.org/licenses/by/4.0/).
Share and Cite
Claridge, A.W.; Paull, D.J.; Welbourne, D.J. Elucidating Patterns in the Occurrence of Threatened Ground-Dwelling Marsupials Using Camera-Traps. Animals 2019, 9, 913. https://doi.org/10.3390/ani9110913
Claridge AW, Paull DJ, Welbourne DJ. Elucidating Patterns in the Occurrence of Threatened Ground-Dwelling Marsupials Using Camera-Traps. Animals. 2019; 9(11):913. https://doi.org/10.3390/ani9110913
Chicago/Turabian StyleClaridge, Andrew W., David J. Paull, and Dustin J. Welbourne. 2019. "Elucidating Patterns in the Occurrence of Threatened Ground-Dwelling Marsupials Using Camera-Traps" Animals 9, no. 11: 913. https://doi.org/10.3390/ani9110913
APA StyleClaridge, A. W., Paull, D. J., & Welbourne, D. J. (2019). Elucidating Patterns in the Occurrence of Threatened Ground-Dwelling Marsupials Using Camera-Traps. Animals, 9(11), 913. https://doi.org/10.3390/ani9110913