1. Introduction
Phytogenic nutritional additives (PNAs) have gained widespread acceptance in broiler nutrition as functional additives. Under commercial feeding conditions, they are primarily utilized to support intestinal physiology and optimize nutrient utilization [
1,
2]. Furthermore, recent investigations highlight their critical potential in modulating microbial balance and overall gut health [
3,
4,
5]. Specifically, essential oil- and phytobiotic-based products have been reported to influence growth performance, nutrient-related responses [
6,
7], intestinal morphology, immune responses [
8,
9], and barrier-related functions [
10]. Despite these documented benefits, the magnitude and direction of broiler responses to these additives are not always consistent. These variations are often highly dependent on the diet composition, the specific formulation of the additive, and the environmental or health challenge status of the flock.
In commercial practice, the evaluation of functional additives is further complicated by the routine application of dietary matrix credits. Assigning a matrix credit to an additive accounts for its presumed nutrient contribution, resulting in intentional reductions in the basal formulation of energy-yielding ingredients, crude protein, standardized ileal digestible amino acids, calcium, and phosphorus. These baseline nutrient adjustments are biologically significant. For instance, altered protein and amino acid dynamics directly impact nutrient utilization and overall production efficiency in broilers [
11,
12], whereas shifts in calcium and non-phytate phosphorus supply heavily influence skeletal development and intestinal physiology [
13]. Furthermore, studies utilizing reduced-energy or reduced-amino-acid diets demonstrate that broiler performance and carcass traits are highly sensitive to both the magnitude and type of nutrient restriction [
14,
15]. Consequently, the ultimate gut health and production outcomes are driven not solely by the inclusion of functional additives but by their complex interplay with the specific matrix-adjusted diet [
16].
The PNA evaluated in the present study is a botanical-based feed additive derived from star anise (
Illicium verum Hook.f.) essential oil, thyme (
Thymus vulgaris L.) essential oil, and
Quillaja saponaria Molina stem and leaf powder. Star anise and thyme are aromatic plants that are widely used as sources of essential oils in animal nutrition due to their bioactive compounds, including trans-anethole and thymol, which have been associated with antimicrobial, antioxidant, and digestive-supporting activities. Previous studies have indicated that star anise-derived compounds can improve nutrient utilization and intestinal barrier function in broilers [
17,
18], while thyme-derived phytochemicals may contribute to the modulation of intestinal microbial balance and inflammatory responses [
19]. In addition, quillaja saponins have attracted attention as natural feed additives because of their potential effects on intestinal health, nutrient absorption, and immune regulation. However, biological responses to botanical mixtures may depend on the composition, inclusion level, and dietary context, and the combined effects of these plant-derived components under different nutrient matrix formulation strategies remain insufficiently understood. Similarly, thymol exhibits potent antimicrobial and antioxidant capacities that promote intestinal health in poultry [
20,
21]. Crucially, rather than acting in isolation, these volatile components often interact synergistically. For example, p-cymene is known to potentiate phenolic monoterpenes via membrane-level effects [
22], leading to enhanced antibacterial activity [
23,
24]. Furthermore, the broader spice-derived and phytogenic compounds (such as chlorogenic acid and esterified derivatives) provide additional regulatory support by modulating antioxidant, inflammatory, and microbial responses [
25,
26]. Because this PNA functions as a complex, multi-targeted network rather than a single molecule, its overall efficacy in vivo may be particularly sensitive to the nutritional baseline provided by different matrix credit formulations.
Currently, limited information is available regarding broiler responses to PNAs when applied under different nutrient matrix credit strategies. In commercial poultry production, practical formulation strategies often compare a standard control diet with additive-containing diets formulated using different matrix credits, rather than using a complete factorial arrangement of additive and matrix levels. Because PNA-free full matrix and protein matrix control diets were not included, the present design did not allow the formal testing of independent PNA effects, independent nutrient matrix effects, or PNA × nutrient matrix interactions. The present study was therefore conducted to compare a control diet without PNA with three complete PNA-containing dietary formulation strategies: full nutrient matrix credit, protein matrix credit, and no matrix credit. The objective was to evaluate treatment-dependent responses in growth performance, carcass traits, meat quality, intestinal barrier-related indices, ileal morphology, epithelial ultrastructure, and excreta nutrient composition. Because corresponding PNA-free matrix control diets were not included, differences among PNA-containing strategies were interpreted as matrix-dependent response patterns rather than formal statistical interactions.
2. Materials and Methods
2.1. Phytogenic Nutritional Additive
A phytogenic nutritional additive (PNA; Delacon Biotechnik GmbH, Engerwitzdorf, Austria), consisting mainly of star anise essential oil, thyme essential oil, and Quillaja saponaria Molina stem and leaf powder, was used in this study. The characterized essential oil fraction contained trans-anethole (25 mg/g), p-cymene (4 mg/g), and thymol (2 mg/g) as the main active components. The inclusion level was fixed at 0.015% (150 mg/kg) across all feeding phases.
2.2. Experimental Design and Diets
A total of 384 one-day-old male Arbor Acres broilers with an initial body weight of 42.16 ± 0.60 g were obtained from Shandong Dingli Agricultural and Animal Husbandry Technology Co., Ltd. (Yantai, China). Birds were randomly allocated to four dietary treatments, with eight replicate cages per treatment and 12 birds per cage. The treatments consisted of a control diet without PNA (CON), PNA with a full nutrient matrix credit (PNA-FM), PNA with a protein matrix credit (PNA-PM), and PNA without a matrix credit (PNA-NM). In this study, matrix credit refers to a pre-assigned nutrient value attributed to the additive during diet formulation. When a matrix credit was applied, selected nutrients or ingredients in the basal formulation were adjusted according to the expected nutritional contribution or functional effect of the additive. Thus, the matrix credit strategies represented practical feed formulation approaches rather than independent nutrient restriction treatments.
The PNA-FM diet represented a full-nutrient-matrix credit strategy. Compared with CON, this strategy applied the broader nutrient matrix attributed to the PNA and reduced the ether extract by approximately 8.0 to 9.3%, calcium and phosphorus by approximately 3%, and selected indispensable amino acids, such as lysine and methionine, by approximately 1.9% and 3.9%, respectively, while maintaining crude protein and metabolizable energy at similar levels. The PNA-PM diet represented a protein-matrix-credit strategy, in which the crude protein and standardized ileal digestible amino acid balance were adjusted, whereas the broader full matrix credit for ether extract and minerals was not fully applied. The PNA-NM diet represented a no-matrix-credit strategy, in which the PNA was added at the same inclusion level to the control nutrient specification without nutrient matrix deductions.
The matrix credit adjustments were intentionally conservative and were designed to reflect practical formulation margins rather than severe nutrient restriction. Because the study did not include PNA-free full matrix or protein matrix diets, treatment differences in PNA-FM and PNA-PM were interpreted as responses associated with complete PNA-containing formulation strategies, not as independent effects of the PNA alone or as formal PNA × nutrient matrix interactions. The basal diets followed current broiler nutritional recommendations and were formulated using raw materials from the Zhuozhou Experimental Base of China Agricultural University (Zhuozhou, China) with technical optimization from Cargill. The ingredient compositions and nutrient levels of the basal diets are shown in
Table 1. Birds had ad libitum access to feed and water during the 43-day experiment, and the temperature and lighting were managed according to the Arbor Acres broiler management guide.
2.3. Diet Preparation and Chemical Analysis
The corn–soybean meal basal diet was used in all feeding phases. Ingredients and additives were weighed according to the diet formulas and premixed stepwise before final mixing in a horizontal ribbon-blade mixer and pelleting. Diet samples were ground and analyzed in duplicate. Dry matter, crude protein, ether extract, and ash were determined according to AOAC procedures [
27]. Metabolizable energy, total calcium, total phosphorus, and tryptophan were calculated based on ingredient nutrient composition tables and formulation specifications. Nutrient levels are expressed on an as-fed basis.
2.4. Growth Performance
Body weight (BW), average daily gain (ADG), average daily feed intake (ADFI), and the feed conversion ratio (FCR) were recorded on a cage basis for each feeding phase and for the overall experimental period. Mortality and culled birds were recorded daily for each replicate cage.
2.5. Sample Collection
At day 14, six birds per treatment were sampled, with one bird selected from each of six different replicate cages among the eight replicate cages per treatment. Three hours before sampling, birds received 4.16 mg fluorescein isothiocyanate–dextran (FITC-d)/kg body weight by oral gavage. Birds were electrically stunned and euthanized by exsanguination. Blood was collected from the jugular vein into additive-free dry vacuum tubes, allowed to clot for 3 h at room temperature, and centrifuged at 1500× g for 15 min. Serum was stored at −80 °C for the analysis of FITC-d, D-lactic acid (D-LA), and diamine oxidase (DAO). Ileal tissue and mucosal samples were collected between Meckel’s diverticulum and the ileocecal junction, frozen in liquid nitrogen, and stored at −80 °C.
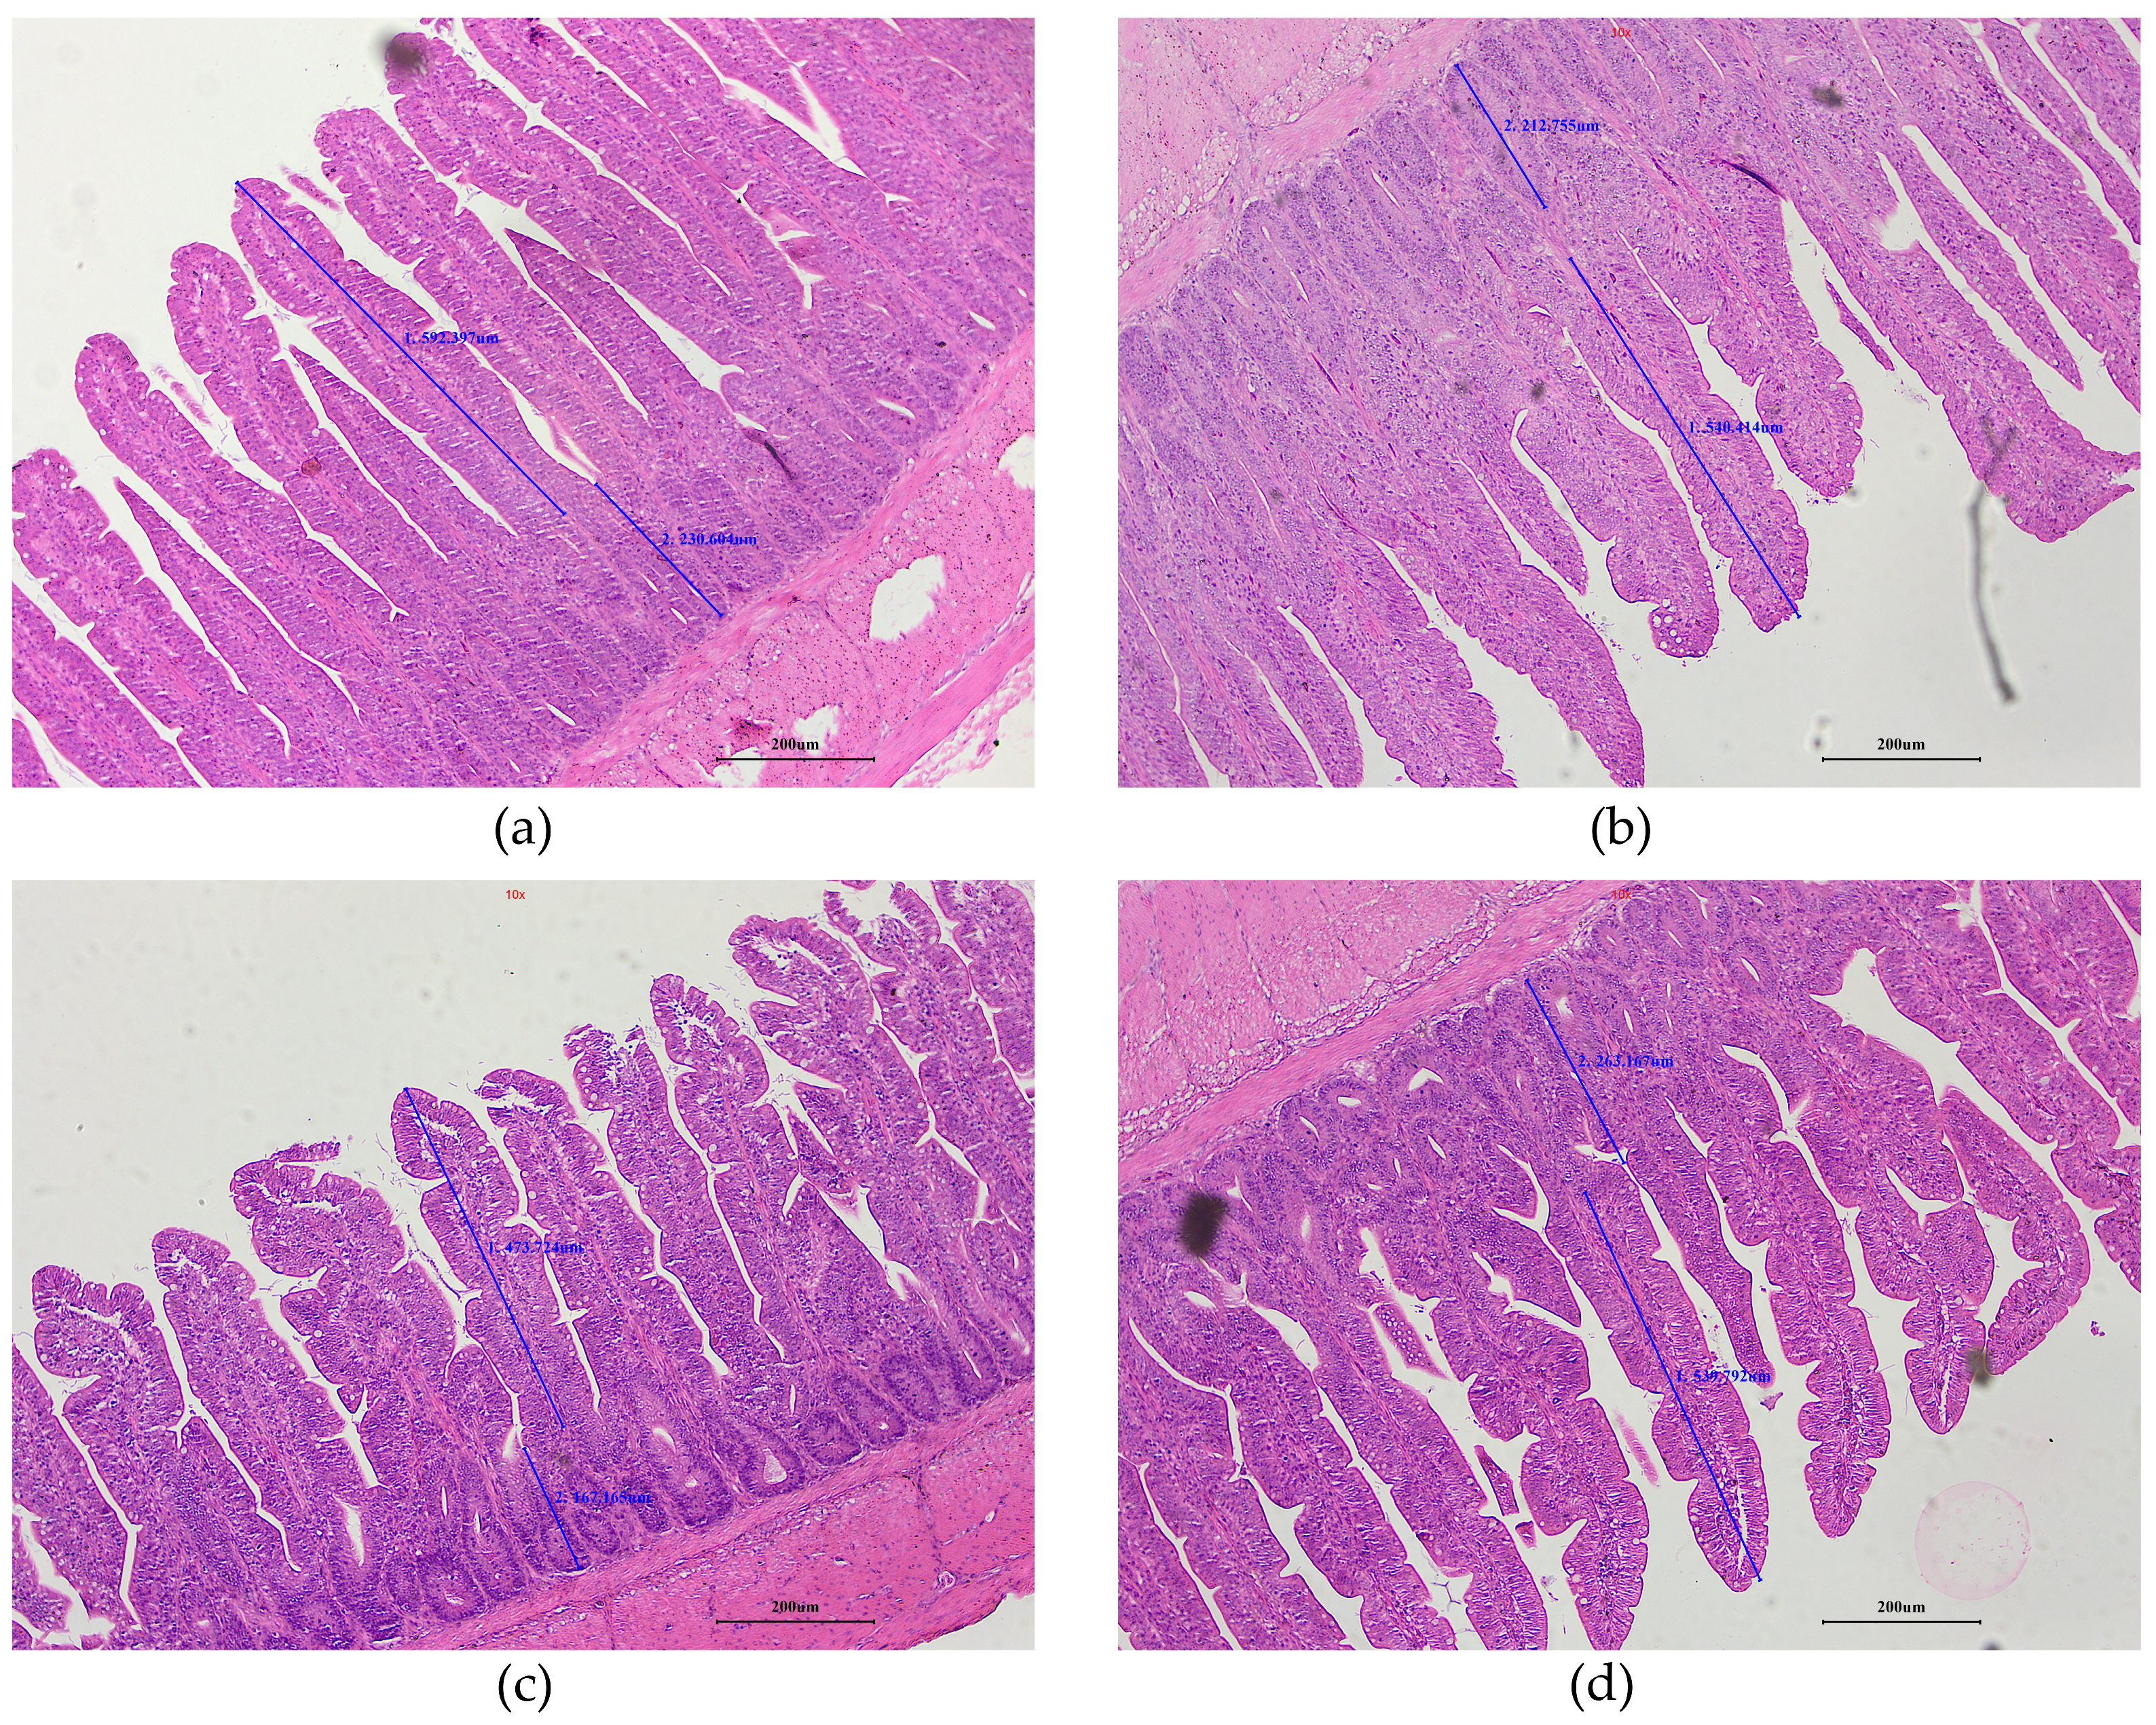
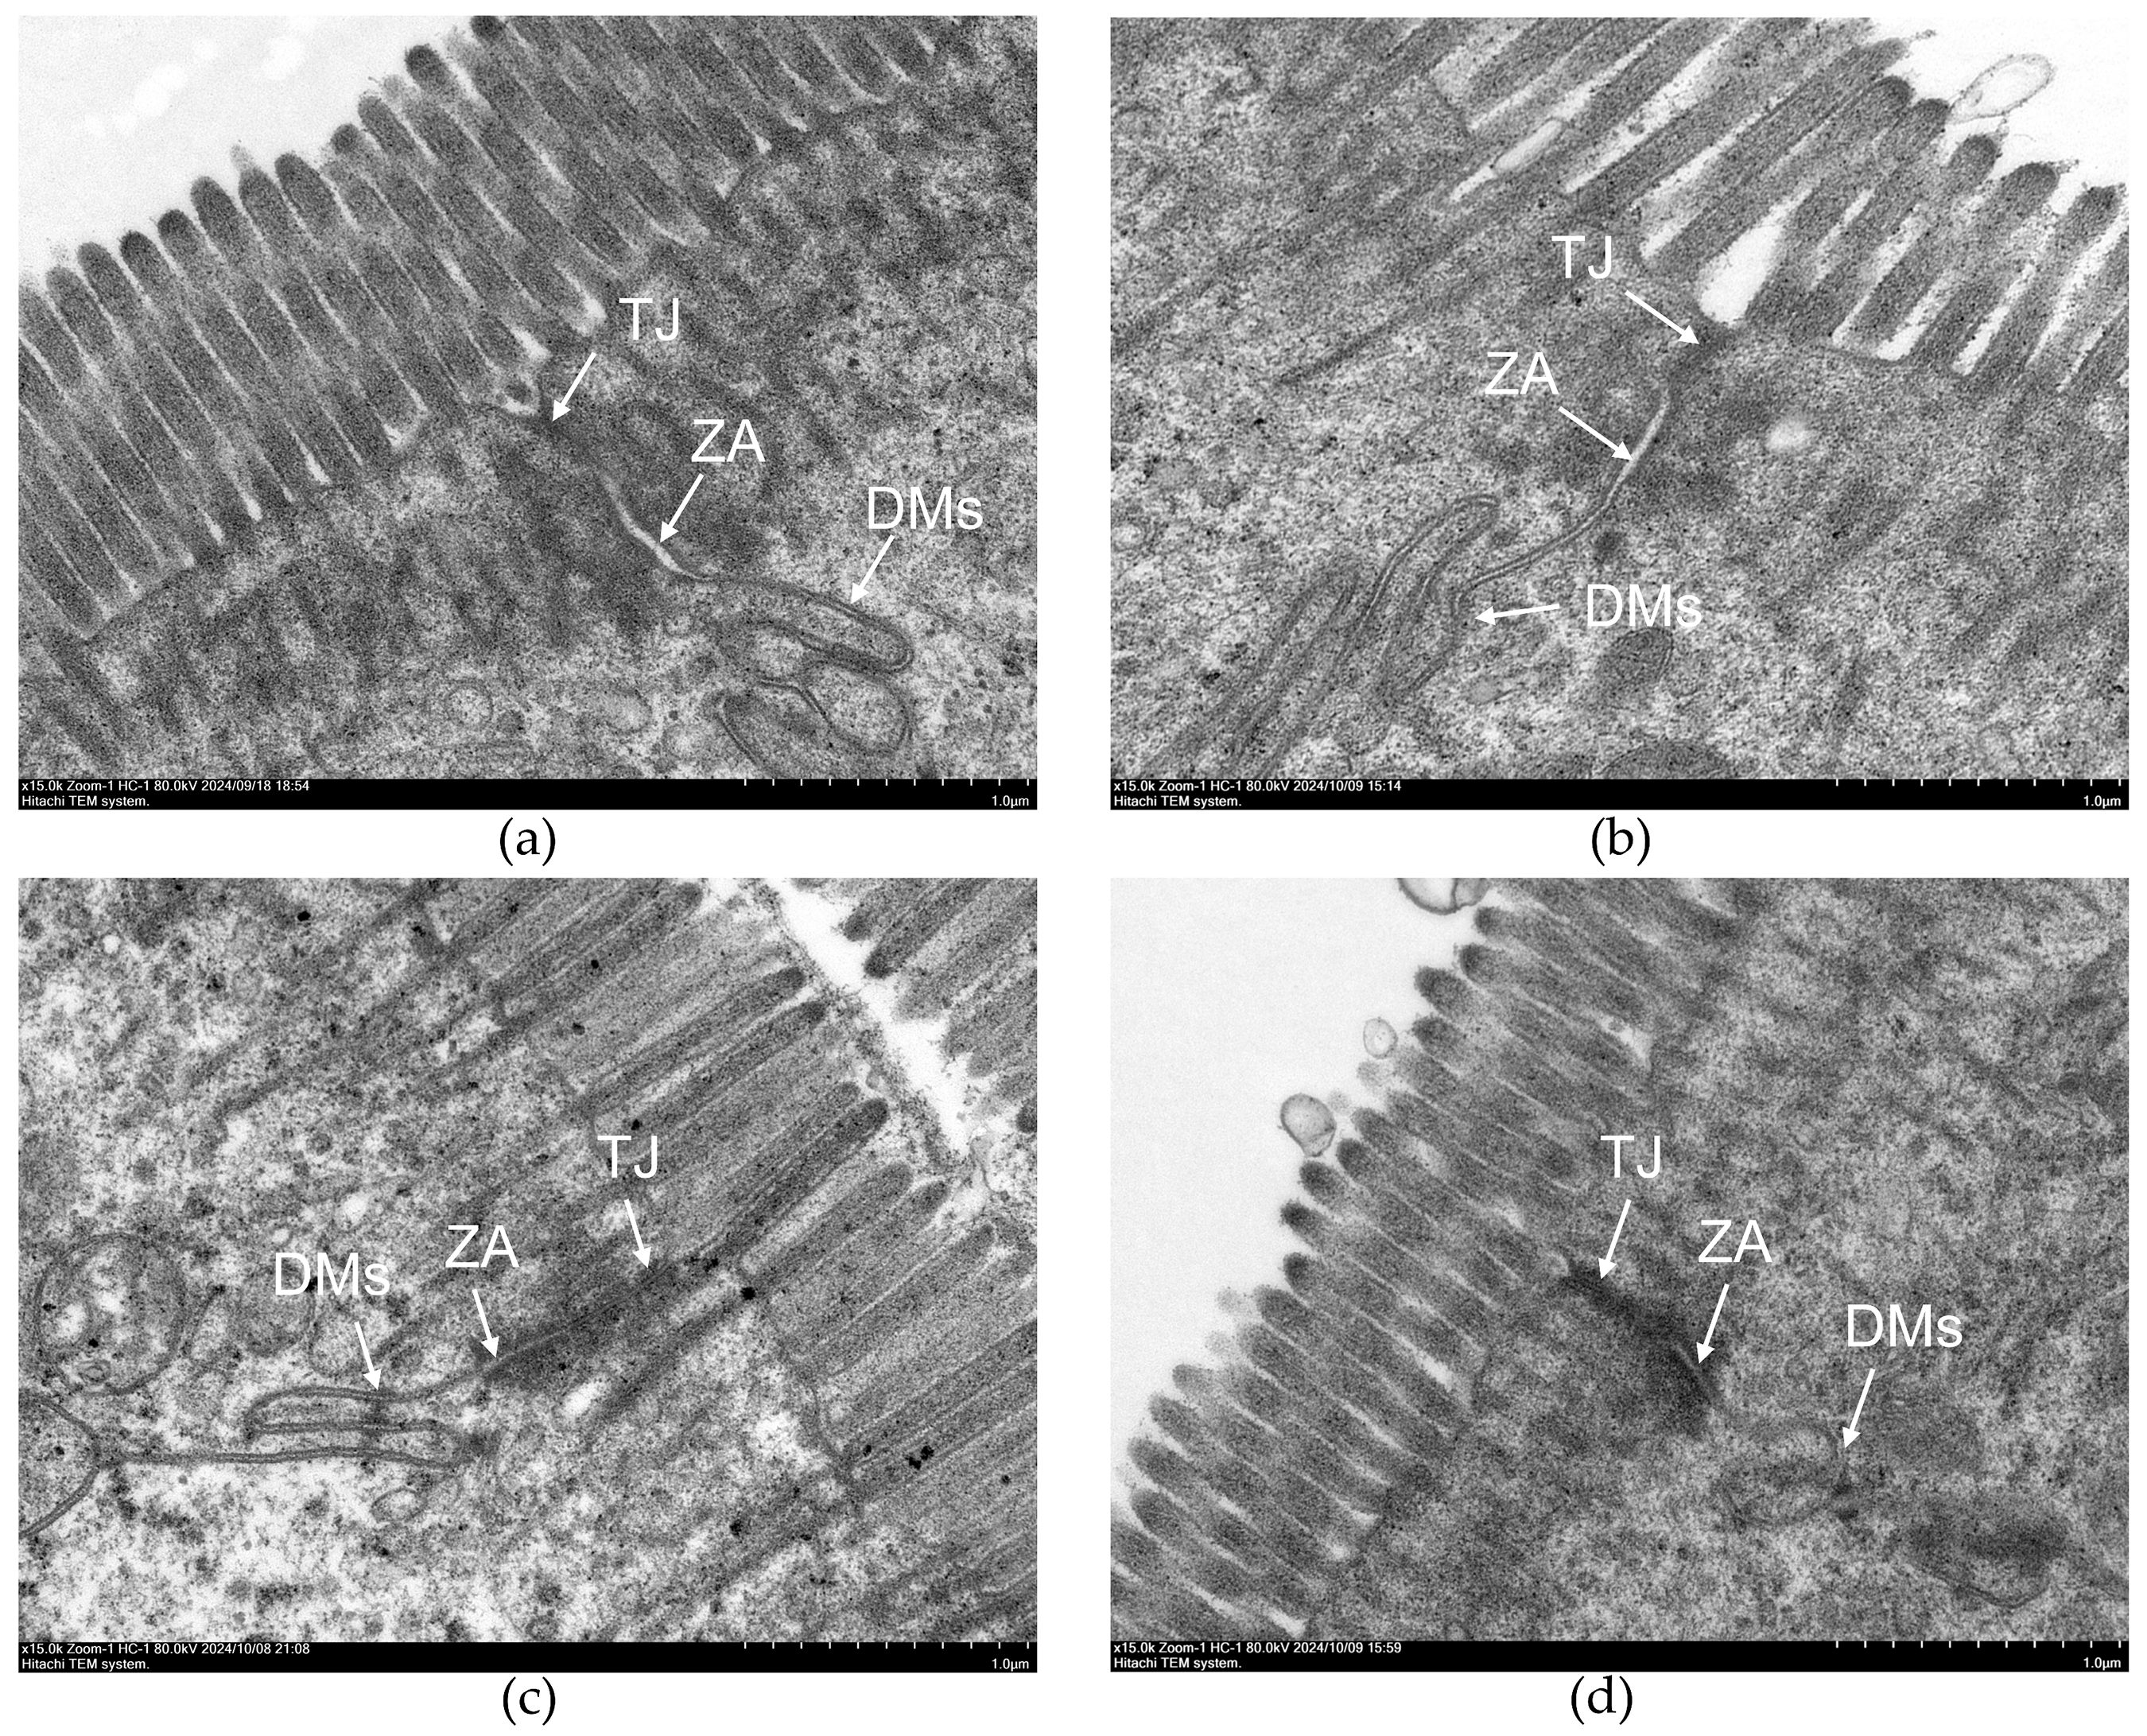
At day 22, five birds per treatment were sampled from five different replicate cages among the eight replicate cages per treatment, with one bird selected per cage; these birds had not been previously sampled at day 14. Ileal samples were collected for histomorphology and transmission electron microscopy (TEM). Samples for TEM were cut into approximately 1 to 2 mm3 sections and immediately immersed in 10 volumes of 2.5% glutaraldehyde at 4 °C. During collection, forceps compression was avoided to preserve the intestinal morphology.
At day 42, one bird was sampled from each available replicate cage among the eight replicate cages per treatment for breast meat measurements. After slaughter, the breast was exposed and photographed for white striping evaluation. A 1.5 cm × 4.0 cm strip from the center of the right pectoralis major muscle was used for pH measurement. Two additional 1 cm × 1 cm samples were collected from the same region; one sample was frozen in liquid nitrogen and stored at −80 °C for the analysis of malondialdehyde (MDA), glutathione (GSH), and total antioxidant capacity (T-AOC), and the other was fixed in 10 volumes of paraformaldehyde for the determination of the collagen volume fraction (CVF) and muscle fiber diameter (MFD). The left pectoralis major muscle was stored at −20 °C for cooking loss analysis.
At day 43, two birds were sampled from each available replicate cage among the eight replicate cages per treatment for carcass measurements. The dressed percentage (DP), half-eviscerated yield with giblets (HEP), eviscerated yield (EP), abdominal fat yield (AEP), breast muscle yield (BMP), and leg muscle yield (LMP) were calculated according to standard slaughter procedures. For carcass analysis, values from the two birds were averaged within the cage before statistical analysis. Excreta was collected from six replicate cages per treatment at days 14 and 28 for the determination of moisture, crude protein, ether extract, gross energy, ash, crude fiber, calcium, and phosphorus. Moisture was additionally measured at day 42.
2.6. Clinical Observations and Lesion Evaluation
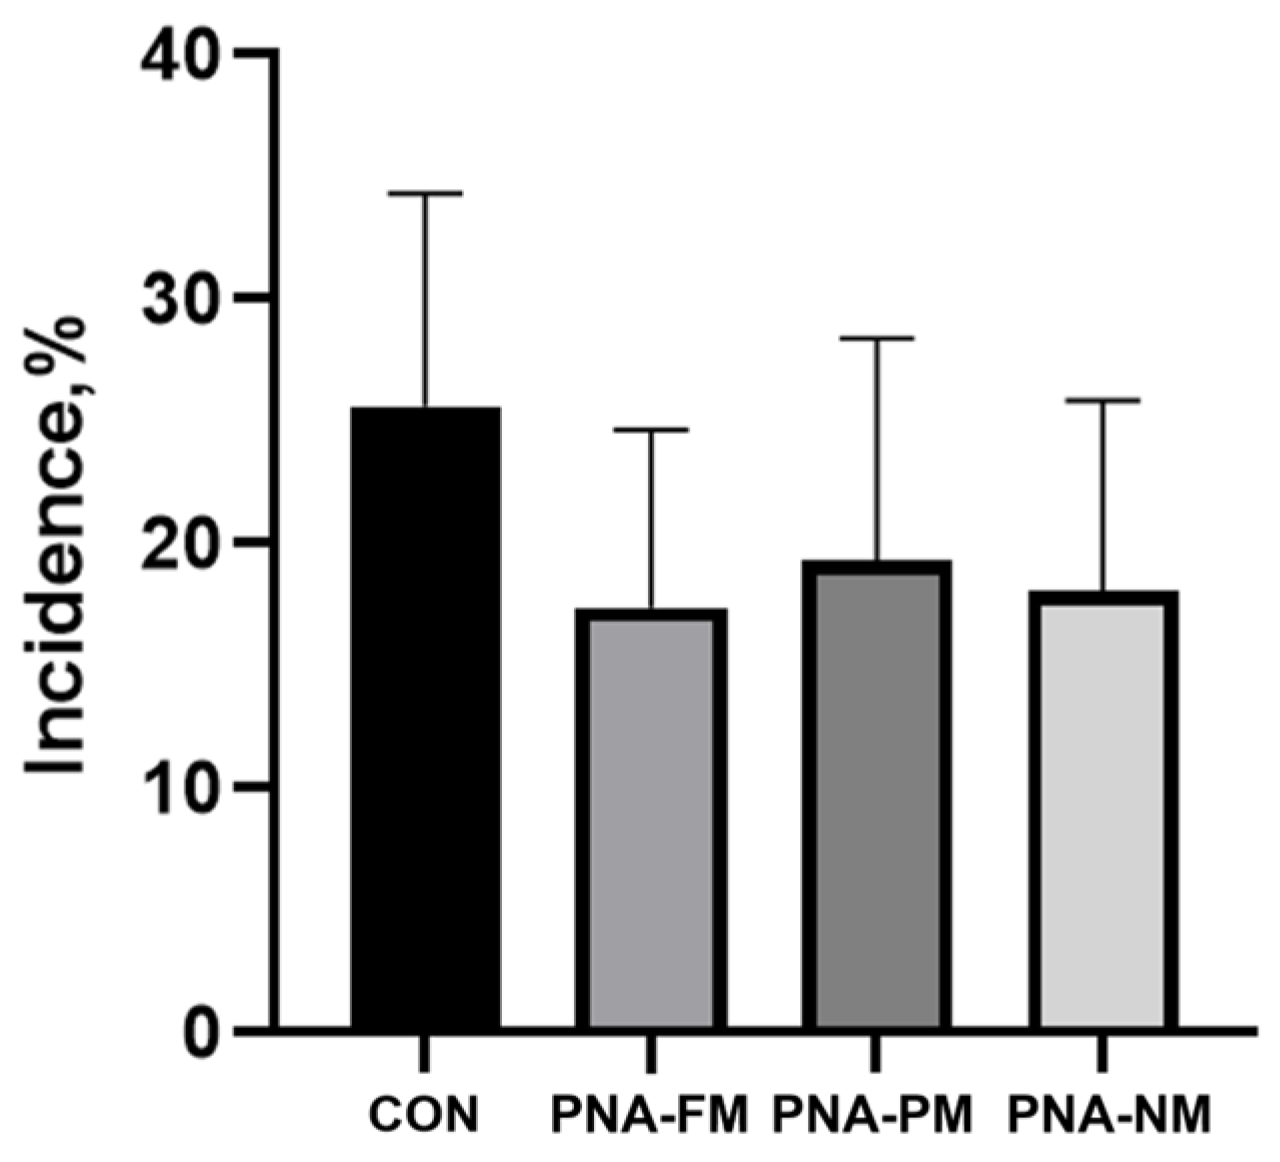
Throughout the 42-day experimental period, birds were monitored daily for general health status and clinical signs of illness. Scheduled gross lesion evaluations were conducted from day 14 to day 42, with a total of 21 clinically healthy birds examined per treatment over this period. The evaluated gross lesion indicators included oral lesions (ML), intestinal hemorrhage (IH), excessive intestinal mucus (MC), excessive intestinal water content (WC), intestinal epithelial cell shedding (CS), intestinal hyperemia (HY), poor intestinal elasticity (IT), gizzard erosion (GIZ), and cecal gas bubbles, used as an indicator of microbial imbalance (CFM). Binary indicators were scored as 0 = absent and 1 = present, whereas intestinal hemorrhage and gizzard erosion were graded on a 0 to 3 scale, with 0 indicating absence and higher scores indicating greater lesion severity. For lesion incidence analysis, birds with a score greater than 0 for a given indicator were considered lesion-positive. The lesion incidence was calculated as the number of lesion-positive birds divided by the number of birds examined within each treatment and expressed as a percentage. The average lesion incidence was calculated as the mean percentage of lesion-positive birds across the recorded gross lesion indicators from day 14 to day 42.
2.7. Meat Quality and Muscle Antioxidant Indices
Cooking loss was determined after thawing the left pectoralis major muscle samples at 4 °C, using a procedure adapted from Gál et al. [
28]. Samples were weighed (W1), sealed in polyethylene bags, and cooked in a water bath at 85 °C until the internal center temperature reached 70 °C. After cooling to ambient temperature in tap water and storage at 4 °C for 24 h, samples were blotted dry and reweighed (W2). Cooking loss was calculated as 100 × (W1 − W2)/W1.
For muscle antioxidant indices, approximately 0.1 g of muscle tissue was homogenized in normal saline to prepare a ten-fold dilution and centrifuged at 3500× g for 15 min at 4 °C. The protein concentration was determined using a BCA Protein Assay Kit (P0012, Beyotime Biotechnology, Nantong, Jiangsu, China). MDA, GSH, and T-AOC were quantified using commercial kits (Nanjing Jiancheng Bioengineering Institute, Nanjing, Jiangsu, China), according to the manufacturers’ instructions. MDA was measured at 532 nm, whereas GSH and T-AOC were measured at 405 nm using a microplate reader (Epoch 2, BioTek Instruments, Winooski, VT, USA). Results were normalized to the protein concentration.
For Masson staining, muscle tissue fixed in 4% paraformaldehyde for more than 24 h was stained using a Masson Trichrome Stain Kit (Solarbio G1340, Beijing, China). Images were collected using an SQD-40P slide scanning system (Shenzhen Shengqiang Technology Co., Ltd., Shenzhen, China). CVF was calculated as the ratio of the blue-stained collagen fiber area to the total muscle cross-sectional area. MFD was calculated by averaging the long and short axes of observed muscle fibers. Images were analyzed using ImageJ (version 1.53k, National Institutes of Health, Bethesda, MD, USA).
The white striping score was evaluated using the classification scheme described by Kuttappan et al. [
29], where 0 = normal, 1 = moderate, 2 = severe, and 3 = extreme. All evaluations were conducted under standardized conditions by trained observers blinded to treatment.
2.8. Transmission Electron Microscopy
Ileal samples collected at day 22 were fixed in 2.5% glutaraldehyde and stored at 4 °C until further processing, following the approaches used for intestinal ultrastructure assessment in poultry [
30,
31]. Samples were washed three times with 0.1 M phosphate buffer, secondarily fixed with 1% osmium tetroxide, dehydrated through a graded ethanol series, embedded in epoxy resin, sectioned at approximately 50 nm, double-stained with uranyl acetate and lead citrate, and examined by transmission electron microscopy. Ultrastructural characteristics, including the integrity of tight junctions, zonula adherens, and desmosomes, were evaluated qualitatively by an independent observer blinded to the dietary treatments.
2.9. FITC-d and Intestinal Barrier-Related Assays
The serum FITC-d concentration was used as a relative indicator of intestinal permeability at day 14, consistent with the use of paracellular permeability markers in gut barrier research and poultry studies [
32,
33,
34]. Serum samples and standards were analyzed in triplicate, and serum from chickens not administered FITC-d was used as the blank control. Fluorescence was measured using a Synergy MX microplate reader (BioTek Instruments, Inc., Winooski, VT, USA) at an excitation wavelength of 485 nm and an emission wavelength of 530 nm. D-Lactic acid and DAO were quantified using commercial colorimetric assay kits (Elabscience Biotechnology Co., Ltd., Wuhan, China).
For mucosal analysis, approximately 0.1 g of ileal mucosa was homogenized in a ten-fold volume of normal saline and centrifuged at 10,000× g for 10 min at 4 °C. Supernatants were used to determine secretory immunoglobulin A (sIgA) and cyclooxygenase-2 (COX-2) using ELISA kits (Shanghai Enzyme-Linked Biotechnology Co., Ltd., Shanghai, China).
2.10. Gene Expression in the Ileum
Total RNA was extracted from ileal tissue using Trizol reagent (Vazyme Biotech Co., Ltd., Nanjing, China), according to the manufacturer’s protocol. Total RNA (1 μg) was reverse-transcribed into cDNA using HiScript III All-in-One RT SuperMix Perfect (Vazyme Biotech Co., Ltd.), and the final cDNA was diluted with nuclease-free water before qPCR analysis. The qPCR reaction mixture contained 2× Taq Pro Universal SYBR qPCR Master Mix (Vazyme Biotech Co., Ltd., Nanjing, China), forward and reverse primers, nuclease-free water, and cDNA. Reactions were performed on a 7500 ABI Prism Sequence Detection System (Applied Biosystems, Foster City, CA, USA) under the following conditions: 95 °C for 30 s, followed by 40 cycles of 95 °C for 10 s and 60 °C for 30 s.
Relative gene expression was normalized to β-actin, the endogenous reference gene listed in
Table A1, and calculated using the 2
−ΔΔCt method, with the CON group used as the calibrator [
35]. Primer sequences and GenBank accession numbers are provided in
Table A1. Dissociation curves were generated to verify amplification specificity.
2.11. Statistical Analysis
All statistical analyses were performed using IBM SPSS Statistics 21 (IBM Corp., Armonk, NY, USA). Data were analyzed as a completely randomized design using one-way ANOVA, with the dietary treatment as the fixed effect. The replicate cage was considered the experimental unit for growth performance and excreta measurements. For sampled traits, including serum indices, intestinal morphology, gene expression, TEM, and meat quality measurements, each sampled bird was selected from a different replicate cage; therefore, the sampled bird represented its corresponding cage for statistical analysis. For carcass traits at day 43, two birds were sampled from each cage and their values were averaged within the cage before statistical analysis. For relative gene expression data, statistical analyses were performed on the ∆Ct values (or ∆∆Ct values) prior to conversion to 2−∆∆Ct fold changes to satisfy the assumptions of a normal distribution and homogeneity of variance. Data are presented as treatment means with pooled SEMs. Normality and homogeneity of variance were checked before analysis. When the assumption of homogeneity of variance was satisfied, data were analyzed using one-way ANOVA, followed by Duncan’s multiple-range test for multiple comparisons. When variances were unequal, Welch’s ANOVA was used, followed by the Games–Howell test for multiple comparisons. Statistical significance was declared at p < 0.05, and 0.05 ≤ p < 0.10 was considered a tendency.



 ,
,