Article

Effects of Starvation on Growth Characteristics, Locomotor Performance, Foraging Behavior, and Hypoxia Tolerance in Chinese Giant Salamander (Andrias davidianus) Larvae


Laboratory of Evolutionary Physiology and Behavior, Chongqing Key Laboratory of Conservation and Utilization of Freshwater Fishes, Animal Biology Key Laboratory of Chongqing Education Commission of China, Chongqing Normal University, Chongqing 401331, China
*
Authors to whom correspondence should be addressed.
Animals 2026, 16(12), 1801; https://doi.org/10.3390/ani16121801
Submission received: 2 May 2026 / Revised: 6 June 2026 / Accepted: 9 June 2026 / Published: 11 June 2026
(This article belongs to the Section Aquatic Animals)

Simple Summary

Animals adopt diverse morphological, physiological, and behavioral strategies to cope with starvation stress, which can occur at various life history stages. The Chinese giant salamander (Andrias davidianus) is the largest extant amphibian species in the world, and its wild population is declining due to habitat destruction and other factors. This study aimed to investigate the effects of starvation stress for 1–4 weeks on the growth characteristics, locomotor performance, foraging behavior, and hypoxia tolerance of A. davidianus larvae. The results showed that the locomotor performance and foraging behavior of A. davidianus larvae were not significantly affected by starvation stress, which may be beneficial for maintaining normal foraging and predator avoidance activities during starvation. However, starvation led to a significant reduction in body weight and ultimate hypoxia tolerance. Therefore, starvation tolerance time and hypoxia tolerance warrant full attention in the conservation practice and research involving A. davidianus larvae.

Abstract

Starvation is one of the common survival stresses frequently encountered by wildlife, and the adaptive strategies of animals to starvation stress exhibit significant interspecific differences. This study investigated the effects of different starvation periods (1–4 weeks) on the growth characteristics, locomotor performance, foraging behavior, and hypoxia tolerance of Chinese giant salamander (Andrias davidianus) larvae (5.41 ± 0.06 g; 9.78 ± 0.03 cm). Our results showed that the final body weight of A. davidianus larvae decreased significantly with prolonged starvation time, with a more pronounced rate of decrease during the early starvation period. However, the final body length of A. davidianus larvae was less significantly affected by starvation stress. Starvation had no significant effects on the relative induction flow speed, relative burst swimming speed, total foraging distance, relative foraging speed, and foraging time of A. davidianus larvae. The resting metabolic rate of A. davidianus larvae decreased significantly as the starvation period lengthened. Starvation lasting 2–4 weeks significantly increased the dissolved oxygen level at which A. davidianus larvae exhibited the loss of equilibrium (ventral side facing upward). These results indicate that (1) starvation has a more significant negative impact on body mass than on body length in A. davidianus larvae; (2) starvation stress does not significantly affect the locomotor performance or foraging behavior of A. davidianus larvae, but it does lead to a significant reduction in their extreme hypoxia tolerance.

1. Introduction

Due to the uneven distribution of food resources in both temporal and spatial dimensions in nature, animals are frequently subjected to the adverse stress of starvation during their life cycles [1,2,3]. Throughout long-term adaptive evolution, different animals have adopted varied strategies in response to starvation stress [2,4]. Previous studies have found that amphibians typically cope with environmental stress from food shortages by employing physiological or behavioral strategies, such as downregulating daily maintenance energy expenditure and reducing the frequency of daily activities [3,4,5,6]. Due to limitations in food supply, amphibians continuously consume their intrinsic energy stores, and the functions of various organs are subsequently downregulated. Consequently, the body mass of amphibians also decreases significantly with prolonged starvation [7,8,9].
Locomotor performance is a fundamental guarantee for the survival and reproduction of aquatic animals and is significantly influenced by various environmental factors [10,11,12,13,14]. Induced flow speed refers to the water velocity at which an aquatic animal initiates a swimming behavior response and is a commonly used parameter for studying its locomotor characteristics [15,16]. Burst swimming speed reflects the maximum swimming speed an aquatic animal can achieve in a short period and serves as an important parameter for evaluating anaerobic locomotor capacity in aquatic animals [17,18]. Previous studies have found that starvation stress can significantly affect the locomotor performance of aquatic animals. However, due to species-specific differences in tolerance to starvation, the responses of locomotor performance to starvation stress also exhibit significant interspecific variation among different aquatic animals [19,20,21].
Foraging behavior is one of the fundamental life activities of aquatic animals, providing them with nutrients and energy for survival [22,23]. Researchers employ various indicators to examine animal foraging behavior, such as foraging time, food preference, percentage of time spent moving during foraging activity, number of movements per minute, and number of successful prey captures [24,25,26]. The foraging behavior of aquatic animals is influenced by various external environmental factors (e.g., light, temperature, dissolved oxygen) and internal factors inherent to the animal itself (e.g., body size and health status) [27,28,29,30,31,32]. Previous studies have found that amphibians also exhibit different foraging behavior characteristics during starvation, which are closely related to their species and the duration of starvation [33,34].
Dissolved oxygen in water is a crucial environmental factor affecting the survival of aquatic animals [35,36]. Aquatic surface respiration (ASR) and loss of equilibrium (LOE) are important indicators used to assess the hypoxia tolerance of aquatic animals [36,37]. ASR refers to the behavior where aquatic animals ascend to the water surface to ingest atmospheric air to meet their oxygen requirements when the ambient dissolved oxygen falls below a certain threshold, representing their critical tolerance to hypoxic stress. LOE refers to the point at which aquatic animals cannot maintain bodily equilibrium (ventral or lateral side facing upward) when the dissolved oxygen drops to a certain level, representing their ultimate tolerance to hypoxic stress [38,39,40]. The hypoxia tolerance of amphibians is influenced by various environmental factors such as altitude (vertical height above mean sea level) and temperature [41,42,43,44]. Previous studies have found that an animal’s metabolic rate is closely related to its hypoxia tolerance [45,46]. Due to their lower oxygen demand, animals with generally lower metabolic rates tend to possess greater hypoxia tolerance [47]. Starvation leads to a decrease in maintenance metabolic energy expenditure in some aquatic animals, thereby positively influencing their hypoxia tolerance [45]. However, other studies have found that starvation can also have a significant negative impact on the hypoxia tolerance of aquatic animals [48].
The Chinese giant salamander (Andrias davidianus) (Amphibia: Caudata) is the largest extant amphibian species in the world and is a unique State Key Protected Wildlife species in China [49,50]. Due to overexploitation by humans and the gradual loss of its habitat, the trend of population decline in wild A. davidianus is becoming increasingly evident [50,51]. Previous studies have found that the species possesses a remarkable ability to withstand starvation, capable of surviving for dozens of days or even up to a year without food [52,53,54]. To date, research on A. davidianus during starvation has involved aspects such as blood parameters [55], intestinal microbiota [56], body composition [57], immune responses [58], and proteomics [59]. However, these studies on the effects of starvation in A. davidianus have mainly used subadults or adults as study subjects, while research on larvae remains relatively scarce. Our previous research found that the swimming performance of juvenile A. davidianus is not sensitive to meal sizes [60], and long-term fasting leads to a significant decrease in their maintenance metabolism [4]. However, studies on the locomotor function, behavioral traits, and environmental tolerance of the species under starvation stress have not yet been reported in the literature. Although long-term starvation has negative effects on the body weight and certain physiological functions of A. davidianus, moderate starvation (starved for 6 days followed by refeeding for 6 days) can increase its feeding rate and digestive enzyme activity, thereby improving its growth rate [61]. Studies on other animals have also found that moderate starvation may positively affect their immune response and lifespan [62,63]. Therefore, this study used A. davidianus larvae as the research animal to investigate the effects of 4 weeks of starvation stress on their growth characteristics (body mass and body length), swimming performance (induced flow speed and burst swimming speed), foraging behavior traits (total foraging distance, relative foraging speed, foraging time), and hypoxia tolerance (ASR and LOE). The aim was to explore their physiological and behavioral adaptation strategies in response to starvation stress, thereby providing theoretical support and foundational data for the conservation practices of this species.

2. Materials and Methods

2.1. Source of Experimental Animals and Acclimation Conditions

The A. davidianus larvae used in this study were purchased from the “Zhujiangyuan” Chinese Giant Salamander Farm in Linwu County (25°10′–25°35′ N, 112°20′–112°47′ E), Hunan Province, China. They were acclimated for 14 days in a recirculating aquaculture system (length × width × height: 180 cm × 50 cm × 50 cm; water depth: 10 cm) at the Laboratory of Evolutionary Physiology and Behavior, Chongqing Normal University. During the acclimation period, the photoperiod, dissolved oxygen level, and water temperature were set at 14L:10D, (7.5 ± 0.5) mg L−1, and (20.0 ± 0.5) °C, respectively. The larvae were fed daily at 19:00 with chironomid larvae until satiation. To maintain water quality in the aquaculture system, any remaining feed and feces were removed 2 h after feeding. One-third of the aquaculture water was replaced daily with fully aerated tap water. The pH, GH, and TDS of the aquaculture water were 6.94, 105.50 mg L−1, and 226.52 mg L−1, respectively.

2.2. Starvation Treatment

After 14 days of acclimation, 216 larvae (<1 year old) of similar size (5.41 ± 0.06 g; 9.78 ± 0.03 cm) and good health were selected and randomly divided into a control group (S0) and three starvation groups: 1-week (S1), 2-week (S2), and 4-week (S4) starvation, with 54 individuals per group. In this study, the 216 experimental individuals were measured for body length and weight one by one, and then sequentially randomly assigned to three starvation groups and a control group. The sample size of each group was determined based on the number of samples required for measuring the parameters in this experiment. Each individual was housed in a separate cage (length × width × height: 10 cm × 10 cm × 10 cm) made of wire mesh for the duration of the starvation treatment. The cage dimensions did not prevent the experimental animals from fully turning around or engaging in normal activities. None of the experimental individuals died during the starvation treatment. After the experiment, all experimental individuals were able to feed voluntarily and gradually increased in body weight. Other environmental conditions during the starvation period remained consistent with those during the acclimation period.

2.3. Parameter Measurement and Calculation

Body weight and length of the S0 group were measured before starvation. For the S1, S2, and S4 groups, body weight and length were measured once before starvation, and again after starvation when the measurement of relevant parameters was completed. In this study, the body length of the experimental individuals refers to the total length from the tip of the snout to the end of the tail. Parameters related to locomotor performance, foraging behavior, resting metabolic rate, and hypoxia tolerance were measured for the S0, S1, S2, and S4 groups after 0, 1, 2, and 4 weeks of starvation, respectively. The samples used to measure each parameter were randomly selected from the corresponding treatment groups. In this study, we did not exclude any experimental individuals or their data points. During the different stages of the experiment, only the first author was aware of the group allocation. All other investigators were blinded during the allocation, the conduct of the experiment, the outcome assessment, and the data analysis.

2.3.1. Body Mass and Body Length

The body mass and body length of each individual (mildly anesthetized with 50 mg L−1 MS-222, tricaine methane sulfonate) were measured before and after the starvation treatment, and the relevant parameters were calculated using the following formulas.
Condition factor (100 × g cm−3) = 100 × body mass (g)/body length (cm)3
Daily rate of body mass change (% d−1) = 100 × [Final body mass (g) − Initial body mass (g)]/Starvation duration (d)
Daily rate of body length change (% d−1) = 100 × [Final body length (cm) − Initial body length (cm)]/Starvation duration (d)

2.3.2. Locomotor Performance

Following the different starvation periods, 10 individuals were randomly selected from each group for the measurement of absolute induction velocity and burst swimming speed. The measurement method is briefly described as follows [60]: After the starvation treatment, each individual was transferred separately into an “Aquatic Animal Swimming Respirometer” (3.5 L) [64] and allowed to acclimate for 1 h with a water velocity set at 5 cm s−1 (approximately 0.5 body lengths per second, bl s−1). Subsequently, their induction velocity and burst swimming speed were measured. The water velocity in the respirometer was controlled by a connected computer program. After the acclimation period, the water velocity was increased continuously at an acceleration rate of 0.167 cm (s2)−1. When the individual exhibited a swimming posture characterized by lifting its body off the bottom, holding its limbs close to its sides, and swinging its tail laterally, the corresponding water velocity was recorded as its absolute induction velocity (cm s−1). The relative induction velocity (bl s−1) was calculated by dividing the absolute induction velocity by the individual’s body length. As the water velocity continued to increase, the individual eventually reached an exhausted state, remaining against the mesh screen at the end of the swimming chamber for more than 20 s without further swimming. The water velocity at this point was recorded as its absolute burst swimming speed (cm s−1). The relative burst swimming speed (bl s−1) was calculated by dividing the absolute burst swimming speed by the individual’s body length.

2.3.3. Foraging Behavior

Following the different starvation periods, 10 individuals were randomly selected from each group for the measurement of foraging behavior characteristics. The measurement method was as follows: A cylinder (PVC pipe; diameter: 15 cm) was placed on the right side of a custom-built rectangular filming apparatus for feeding behavior (PVC sheets; length × width × height: 120 cm × 20 cm × 20 cm; water depth: 10 cm) to allow the individuals to acclimate to the test environment. Fifty chironomid larvae were placed at the center of the filming apparatus. Prior to the start of the trial, a single individual was placed into the acclimation cylinder for 5 min. The cylinder was then removed, and a camera (brand: Logitech, Lausanne, Switzerland; C920; resolution: 720 × 1280) was used to begin recording for a duration of 20 min. The recording duration was determined by preliminary experiments. After each trial, the water and all chironomid larvae were replaced, and the interior of the filming apparatus was thoroughly cleaned. Foraging behavior parameters were analyzed using EthoVision XT 9 software (EthoVision XT 9, Nodus, Wageningen, The Netherlands). The distance traveled and the time taken by an individual to locate and consume the first chironomid larva were defined as the foraging distance (cm) and foraging time (s), respectively. The ratio of foraging distance to foraging time was defined as the absolute foraging speed (cm·s−1), and its value divided by the individual’s body length was defined as the relative foraging speed (bl·s−1).

2.3.4. Resting Metabolic Rate

Following the different starvation periods, 10 individuals were randomly selected from each group for the measurement of resting metabolic rate. The metabolic rate of each individual was measured using a custom-built “recirculating closed respirometer” [60]. The measurement method is briefly described as follows: Prior to the resting metabolic rate measurement, each individual was placed separately in a respiratory chamber of the recirculating closed respirometer for a 24 h acclimation period. Subsequently, the oxygen consumption rate of each individual was measured for 10 min periods at 8:00, 14:00, and 20:00. During the measurement, a dissolved oxygen meter (HQ30, Hach Company, Loveland, CO, USA) was used to record the dissolved oxygen level in the experimental respiratory chamber containing the individual every 10 s. The oxygen consumption rate for an individual was calculated from the slope of the dissolved oxygen values (6 readings) within the respiratory chamber over 1 min as a function of time. Concurrently, the dissolved oxygen level in an empty respiratory chamber (to account for bacterial oxygen consumption) was measured for 10 min, and the slope of bacterial oxygen consumption at that time point was calculated using the same method. The average of all oxygen consumption rates (30 readings) measured for an individual over the day was taken as its resting metabolic rate (mg O2·kg−1·h−1). The resting metabolic rate of the individuals was calculated using the following formula [60]:
MO2 = (StS0) × V × 60/(M × 1000)
where MO2 (mg O2·kg−1·h−1) is the metabolic rate of the individual, St is the slope of the dissolved oxygen change over time in the experimental respiratory chamber during the 1 min period, S0 is the slope of the dissolved oxygen change in the blank chamber (bacterial oxygen consumption), V is the volume of the respirometer (0.15 L), 60 is 60 min, and M is the body mass (g) of the individual.

2.3.5. Hypoxia Tolerance

Following the different starvation periods, 24 individuals were randomly selected from each group and divided into 4 replicates (6 individuals per replicate) for the measurement of hypoxia tolerance. The method for determining the hypoxia tolerance parameters ASR100 and LOE100 is briefly described as follows [40]: A recirculating pump was placed at the bottom of a custom-built cylindrical hypoxia tolerance testing apparatus (50 L) to create internal water circulation, ensuring uniform dissolved oxygen levels throughout the apparatus. The water surface was sealed with a transparent plastic film. Prior to the test, six independent wire mesh cages (length × width × height: 30 cm × 20 cm × 10 cm) were placed below the waterline, and one individual was placed into each cage for a 1 h acclimation period. Subsequently, nitrogen was introduced into the apparatus to rapidly reduce the dissolved oxygen level from normoxic conditions (approximately saturation) to 5 mg·L−1 within 3 min, and then further reduced to 2.5 mg·L−1 within the next 3 min. The dissolved oxygen level was maintained at each of these two levels for 0.5 h. Thereafter, the dissolved oxygen level was decreased in a stepwise manner in decrements of 0.1 mg·L−1. At this stage, each change in dissolved oxygen level was accomplished in less than 1 min and maintained for 0.5 h. Dissolved oxygen levels were continuously monitored throughout the experiment using a dissolved oxygen meter (HQ30, Hach Company). The dissolved oxygen level at which the last individual in a replicate continuously and vigorously surfaced to hit the plastic film for 5 s was recorded as the ASR100. The dissolved oxygen level at which the last individual in a replicate exhibited a ventral-side-up posture at the bottom of the mesh compartment was recorded as the LOE100.

2.4. Statistical Analysis

Data processing and statistical analyses were performed using Excel 2003 and SPSS 17.0 software. All data were tested for normality (Shapiro–Wilk test) and homogeneity of variances. If these assumptions were met, one-way analysis of variance (ANOVA) was used to examine the effects of starvation on parameters related to growth characteristics and locomotor performance. Analysis of covariance (ANCOVA), with body length or body mass as a covariate, was employed to test the effects of starvation on parameters related to foraging behavior, resting metabolic rate, and hypoxia tolerance. When significant differences were detected, multiple comparisons were conducted using the least significant difference (LSD) test. The effects of starvation on initial and final body mass, body length, and condition factor within the same starvation time treatment group were analyzed using a T-test. All data are presented as the mean ± standard error (mean ± SE). A probability (p) value of less than 0.05 was considered statistically significant.

3. Results

3.1. Growth Characteristics

The final body mass and final condition factor of each starvation group (S1, S2, and S4) were significantly lower than their respective initial body mass and initial condition factor (p < 0.05). The final body mass (F2, 161 = 4.412; p = 0.014) and final condition factor (F2, 161 = 4.107; p = 0.018) of the S4 group were significantly lower than those of the S1 and S2 groups. The final body length of the S4 group was significantly lower than its initial body length (p < 0.05). No significant differences in final body length were found among the three starvation groups. The daily change rate of body mass in the S1 group was significantly greater than that in the S2 and S4 groups (F2, 161 = 57.068; p < 0.001). No significant differences were observed in the daily change rate of body length among the three starvation groups (Table 1).

3.2. Locomotor Performance

Different starvation durations did not significantly affect the relative induction velocity (F3,39 = 2.599, p = 0.067) or the relative burst swimming speed (F3,39 = 2.361, p = 0.088) of the A. davidianus larvae. There were no significant differences among treatment groups in relative induction velocity or relative burst swimming speed (Table 2).

3.3. Foraging Behavior

Starvation had no significant effects on the total prey searching distance (F3,39 = 1.612, p = 0.204), relative prey searching speed (F3,39 = 0.575, p = 0.635), or prey searching time (F3,39 = 1.196, p = 0.326) of the A. davidianus larvae. No significant differences were observed among treatment groups in total prey searching distance, relative prey searching speed, or prey searching time (Table 2).

3.4. Resting Metabolic Rate

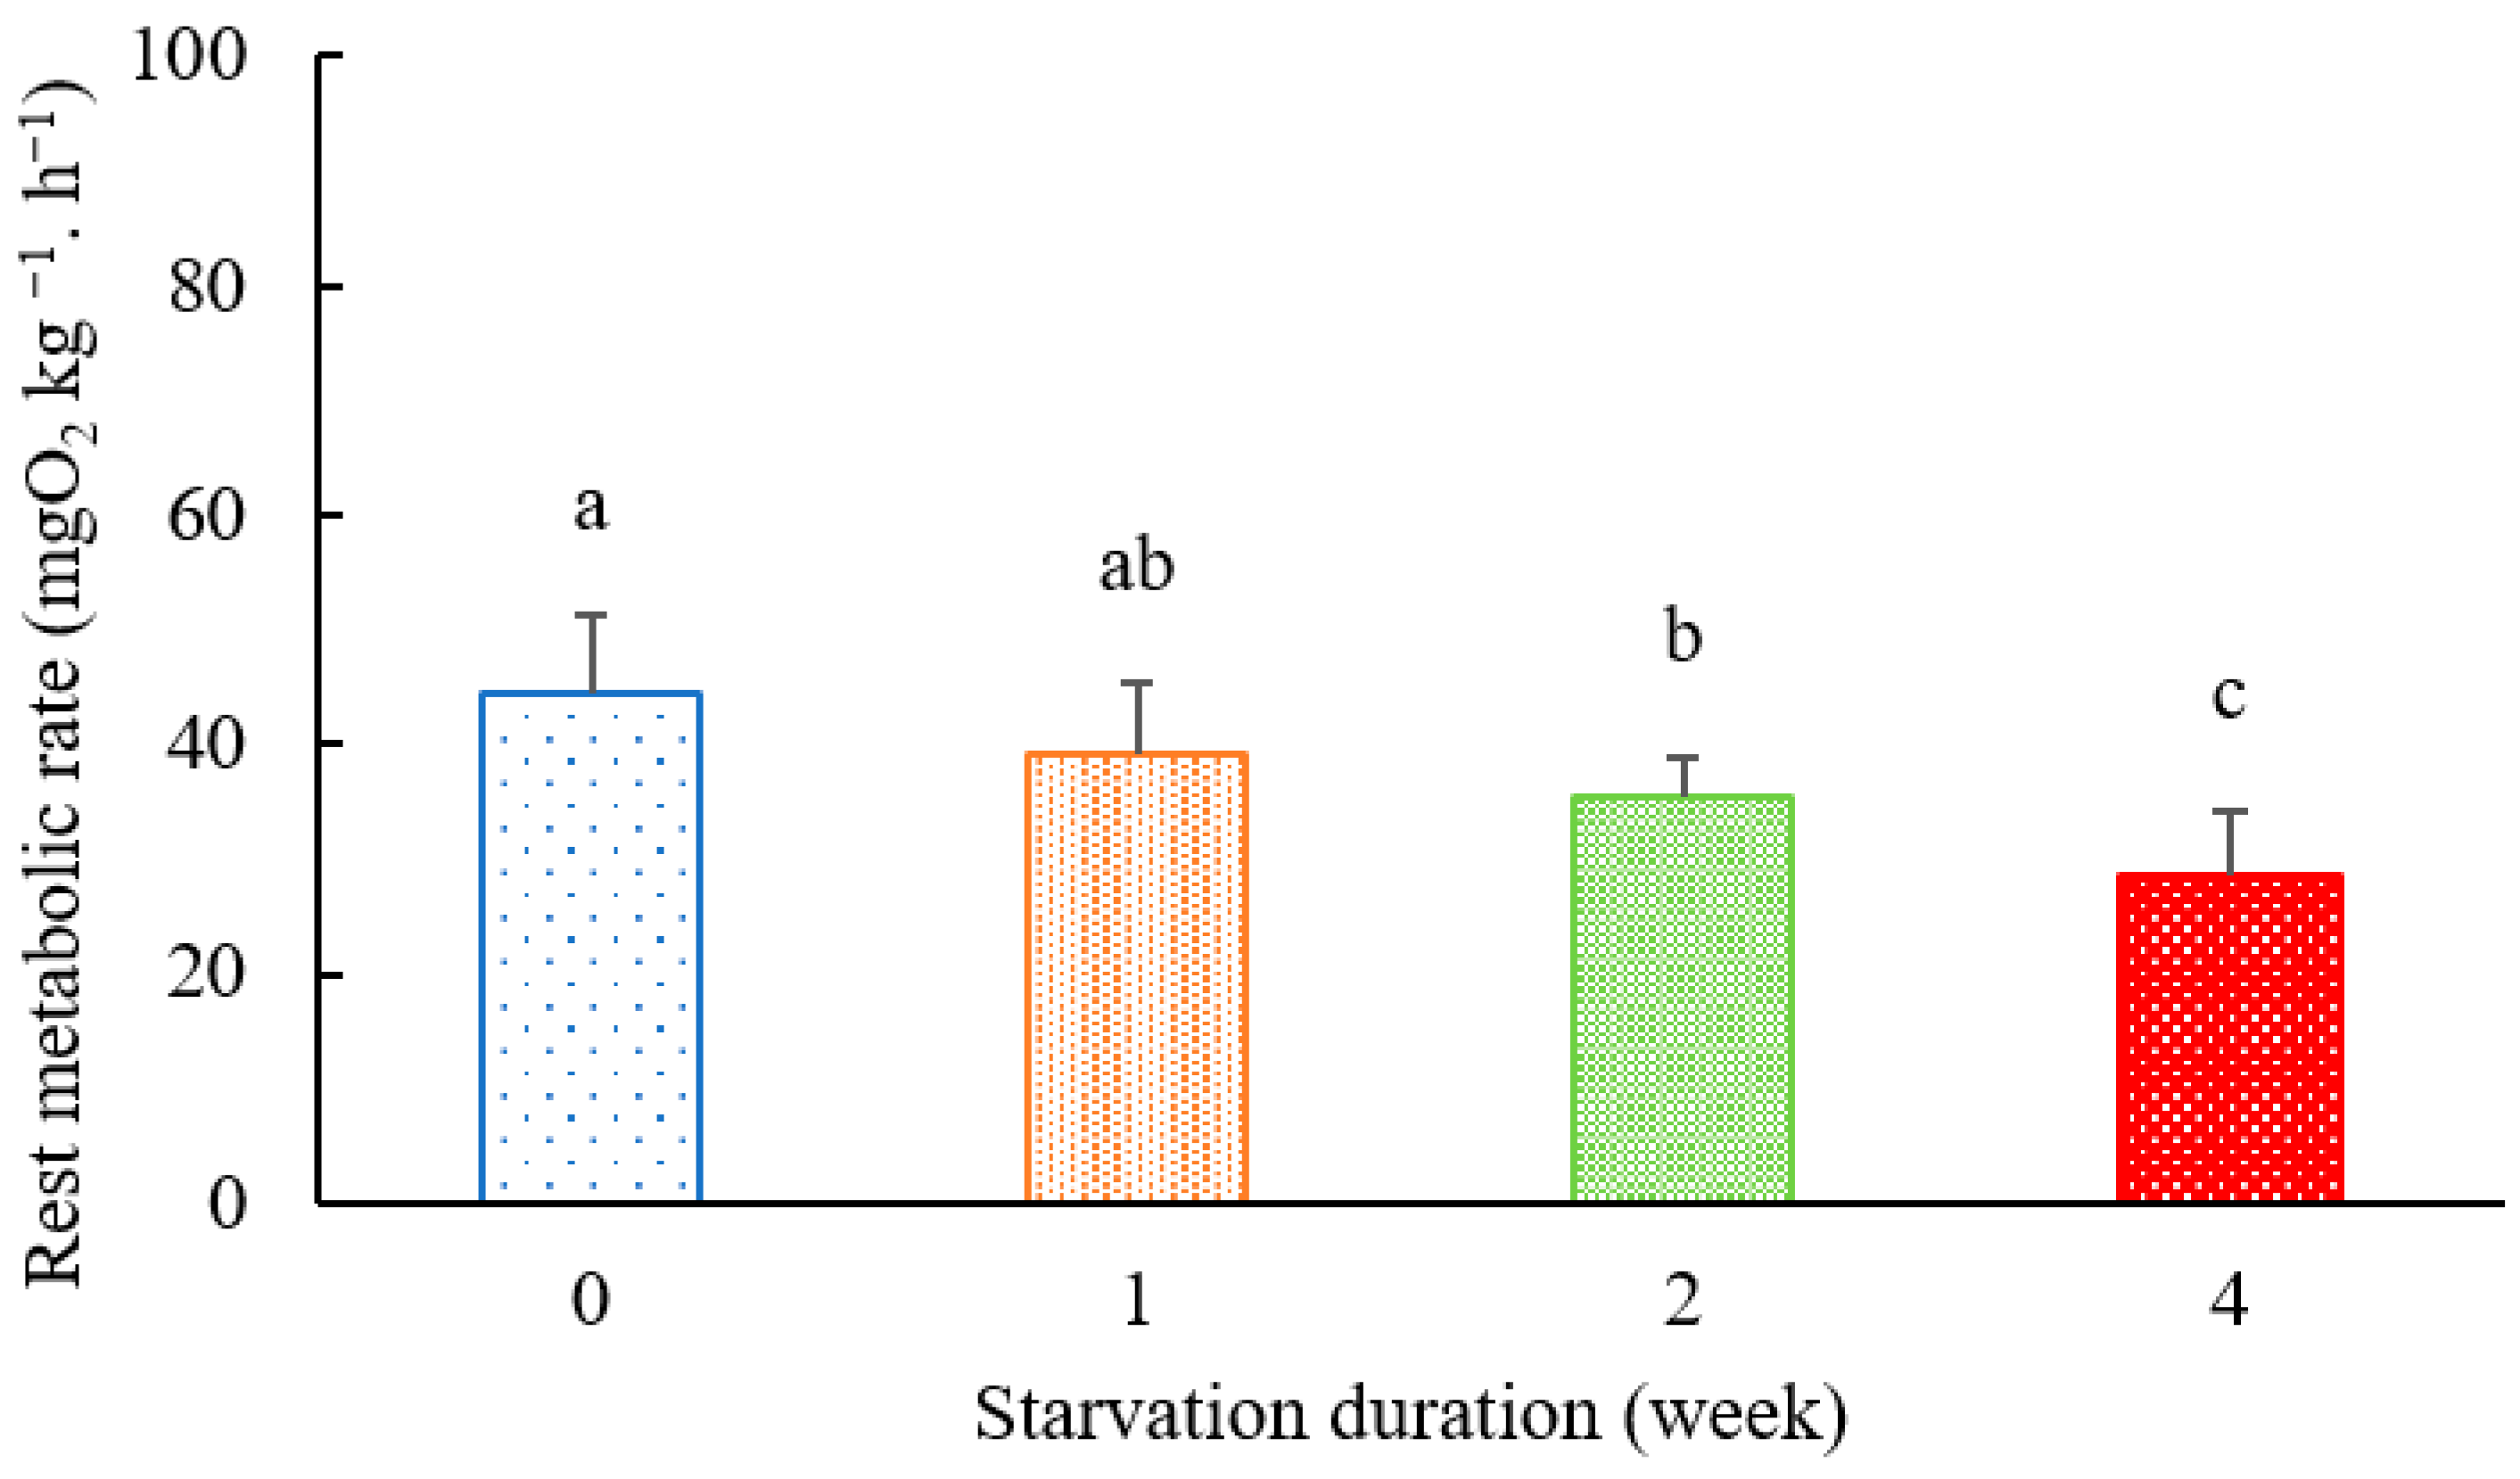
With prolonged starvation duration, the resting metabolic rate of the A. davidianus larvae decreased significantly (F3,39 = 11.833, p < 0.001). The resting metabolic rates of the S0, S1, S2, and S4 groups were 44.34, 39.32, 35.41, and 28.56 mg O2·kg−1·h−1, respectively. The resting metabolic rate was highest in the S0 group, intermediate in the S2 group, and lowest in the S4 group (Figure 1).

3.5. Hypoxia Tolerance

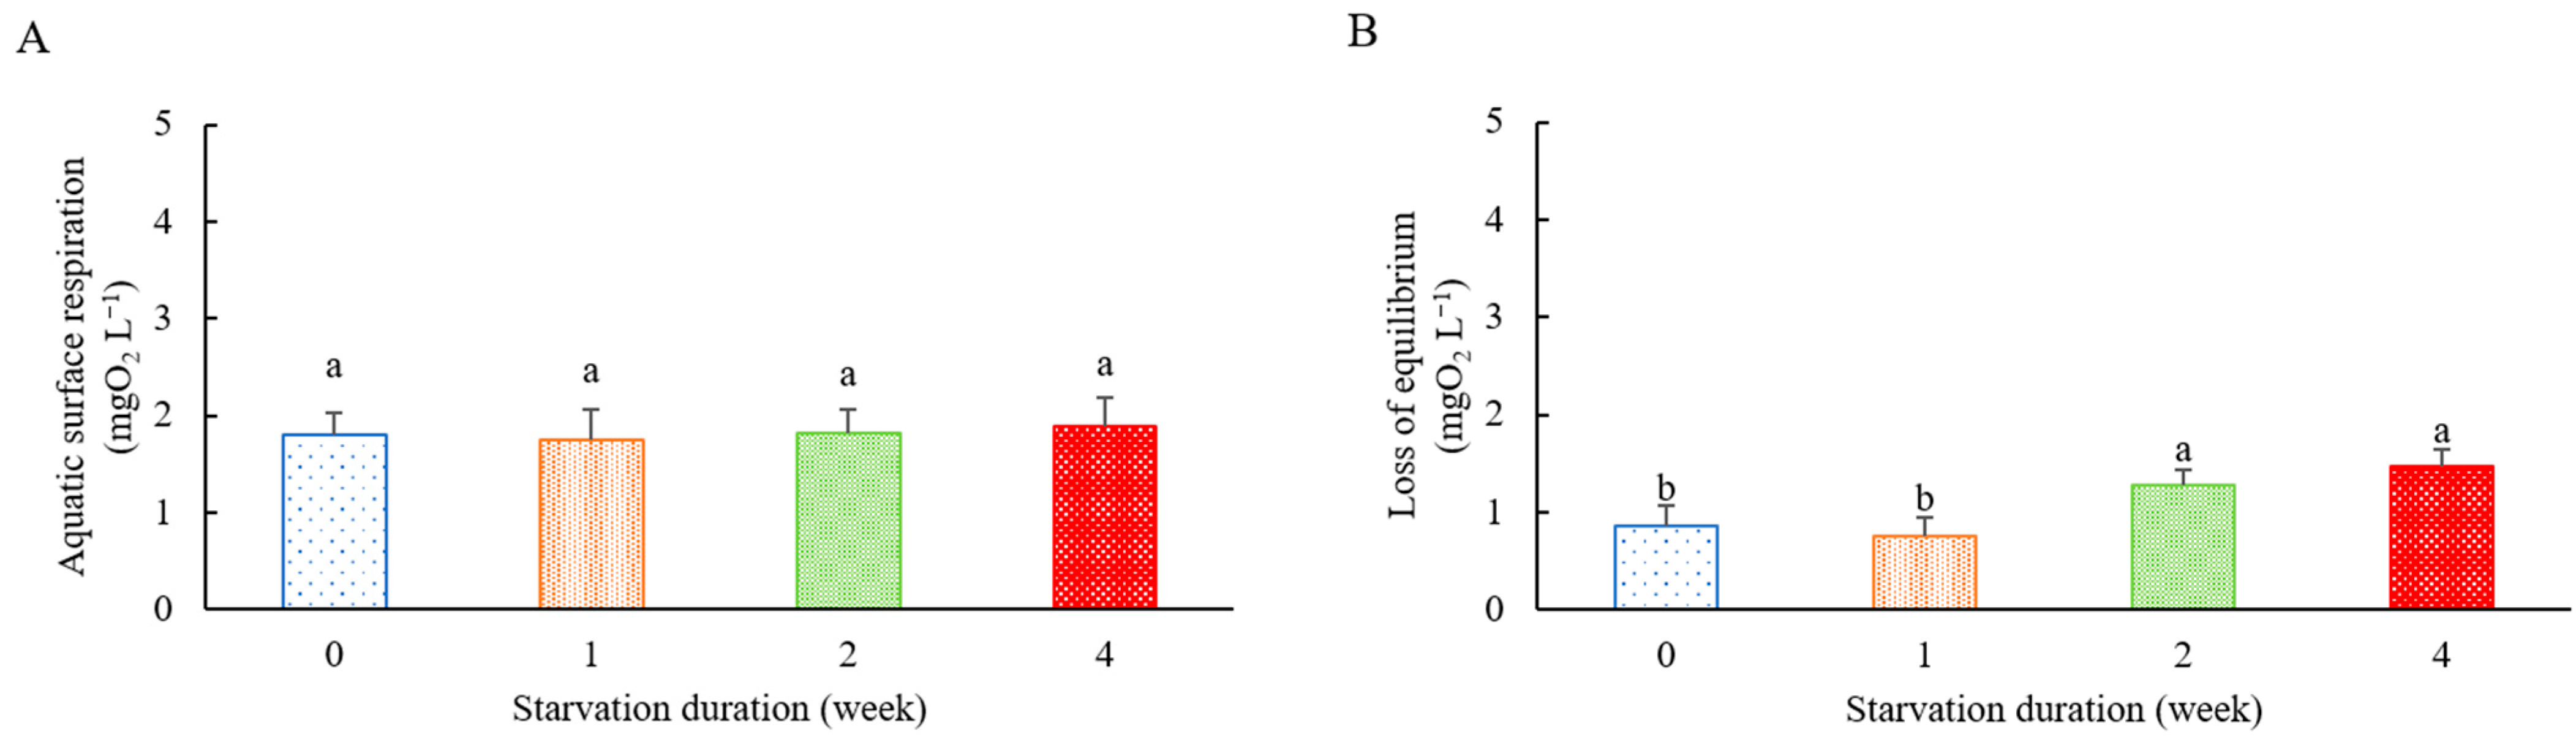
The aquatic surface respiration (ASR100) values of the S0, S1, S2, and S4 groups were 1.80, 1.75, 1.82, and 1.89 mg O2 L−1, respectively. Starvation had no significant effect on the ASR100 of A. davidianus larvae (F3,15 = 0.789, p = 0.525) (Figure 2A). No significant difference was found in the loss of equilibrium (LOE100) between the S0 and S1 groups (0.86, and 0.76 mgO2 L−1, respectively); however, the LOE100 values for both the S0 and S1 groups were significantly lower than those of the S2 and S4 groups (1.27, and 1.46 mgO2 L−1, respectively) (F3,15 = 7.339, p = 0.006) (Figure 2B).

4. Discussion

4.1. Effects of Starvation on Growth Characteristics of A. davidianus Larvae

In the absence of food supplementation, animals facing starvation stress must rely on the consumption of internal energy reserves to sustain basic physiological activities, which subsequently exerts a negative impact on their growth [1,2,65]. Previous studies have found that the effect of starvation on amphibian growth may be related to the species’ starvation tolerance and the duration of starvation [3,9,66]. Two weeks of starvation did not significantly affect the body mass and body length of Asiatic toads (Bufo gargarizans), Chinese fire-bellied newts (Cynops orientalis), and Andean toads (Bufo spinulosus) [67,68,69]. Starvation resulted in a significant decrease in body mass in African clawed frogs (Xenopus laevis) (starved for 3 and 7 months), Macedonian crested newts (Triturus macedonicus) and Buresch’s crested newts (Triturus ivanbureschi) (starved for 2 weeks), three-toed amphiumas (Amphiuma tridactylum) (starved for 3 and 6 months), toads (Bombina maxima) (starved for 60 days) and yellow belly toad (Bombina variegata) (starved for 2 weeks) [3,9,66,70,71].
A. davidianus larvae may face the threat of starvation in the wild, particularly during the overwintering season or when disturbances such as water quality deterioration and human activities induce stress responses. The present study found that 1, 2, and 4 weeks of starvation stress led to significant reductions in the body mass of Chinese giant salamander larvae by 11%, 12%, and 19%, respectively, but only resulted in body length decreases of 0.9%, 1.5%, and 2.8%, respectively. In this study, we did not set up parallel control groups corresponding to each starvation group (S1, S2, and S4) to monitor data on continuous growth under normal feeding conditions. The S0 group was not really a control group, because growth-related parameters were not measured in this group over the same time period as the other starvation groups. Therefore, the design of this control group has certain limitations. Due to the possibility that individuals in the parallel control groups might have continued to grow and gain mass during the study period, the actual negative effects of starvation on the body mass of A. davidianus larvae may have been more significant than the results observed in this experiment. These data indicate that the negative impact of starvation on body mass was significantly greater than that on body length in A. davidianus larvae. This finding is similar to the results of our previous study [4]. This phenomenon has also been observed in studies on other urodeles. For instance, starvation did not significantly affect the body length of Macedonian crested newts (T. macedonicus) and Buresch’s crested newts (T. ivanbureschi) (fasted for 2 weeks) [9], cave-dwelling salamanders (Proteus anguinus) (fasted for 18 months) [8], and three-toed amphiumas (Amphiuma tridactylum) (fasted for 1–6 months) [66]. Since the tail plays a crucial role in the locomotion of caudate amphibians, a relatively conservative change in body length may be more beneficial for these caudate amphibians to maintain locomotor performance under starvation stress, thereby enabling them to more effectively capture prey and evade predators.
The present study found that the final body mass of the 4-week starvation group was significantly lower than that of the 1-week and 2-week starvation groups. This indicates that starvation duration significantly affects the body mass of A. davidianus larvae. Similar results have been found in studies on other amphibians [3,66]. However, the daily change rate of body mass in the 1-week starvation group (−8.74% d−1) was significantly greater than that in the 2-week (−4.68% d−1) and 4-week (−3.72% d−1) starvation groups. This suggests that the negative impact of starvation on body mass was more pronounced during the early phase, which may be related to the relatively higher energy maintenance requirements during the initial period of starvation. A study found that larger individuals of a tropical amphibian (Ceratophrys stolzmanni) exhibited significantly higher activity levels, locomotor performance, and survival rates than smaller individuals [72]. Although our study did not investigate the reproductive behavior of adult A. davidianus, the poor physical condition of larvae after starvation may also affect their long-term adaptability and reproductive performance as adults, even if their physical condition can improve once food supply is restored. Therefore, further research on the reproductive capacity and survival rate of A. davidianus after starvation is needed in the future.

4.2. Effects of Starvation on Locomotor Performance of A. davidianus Larvae

Induction velocity primarily reflects the ability of aquatic animals to perceive changes in water flow. Due to its significant interspecific variation, it holds important reference value in the conservation practices of aquatic animals [73,74]. Previous studies on induction velocity have mainly focused on fish [15,16]. In the present study, the relative induction velocity observed in A. davidianus larvae was generally consistent with data obtained in our previous studies on juvenile A. davidianus (approximately 2.8 bl s−1) [60,75]. Furthermore, 4 weeks of starvation stress did not significantly alter the relative induction velocity of A. davidianus larvae. Combined with our previous findings that anaerobic exercise training and feeding levels did not affect the induction velocity of juvenile A. davidianus [60,75], the results of this study further suggest that the induction velocity in the early life stage of A. davidianus is relatively conservative and was not significantly affected by 4 weeks of starvation stress.
Amphibians cannot survive without an aquatic environment, and their swimming ability is crucial for behaviors such as foraging and predator avoidance [76,77,78]. This study found that the relative burst swimming speed of A. davidianus larvae in the control group was approximately 4.3 bl s−1, which is similar to the results of our previous studies on juvenile A. davidianus [60,75]. Moreover, although the resting metabolic rate decreased significantly, 1–4 weeks of starvation stress did not significantly affect the relative burst swimming speed of A. davidianus larvae. Since the locomotor performance of aquatic animals is influenced not only by their maintenance metabolism but also by physiological traits such as maximum locomotor metabolism and locomotor efficiency [11,39], the intrinsic reasons why the locomotor performance of A. davidianus larvae remains stable under starvation stress warrants further investigation. Previous studies have found that the swimming speed of brown tree frog tadpoles (Litoria ewingii) subjected to restricted feeding (half the normal ration) for 14 days was significantly reduced [20]. A blind cave-dwelling salamander (Proteus anguinus) and a surface-dwelling salamander (Euproctus asper) exhibited a pattern of initially increasing and then decreasing displacement speed during long-term starvation (240 days and 90 days, respectively) [21]. This indicates that there are significant interspecific differences in the locomotor performance of amphibians under food-scarce conditions. Similar to induction velocity, the burst swimming speed of A. davidianus larvae was also relatively conservative under starvation stress. This “maintenance” strategy of locomotor function may be beneficial for enhancing their ability to forage and avoid predators in environments with scarce food resources, thereby improving their survival fitness. However, although there was no statistically significant difference (F3,39 = 2.361, p = 0.088), the relative burst swimming speed of A. davidianus larvae showed a decreasing trend with prolonged starvation. In particular, four weeks of starvation resulted in a 12% decrease in the relative burst swimming speed. Therefore, the negative impact of long-term food deprivation on the locomotor performance of this species should be further addressed in future studies.

4.3. Effects of Starvation on Foraging Behavior of A. davidianus Larvae

Throughout the long process of evolution, an animal’s foraging strategy is closely related to its living environment [79]. Changes in the nutritional status of amphibians due to food restriction can significantly impact their foraging behavior [33,34]. For example, 5 days of starvation significantly shortened the attack latency of graybelly salamanders (Eurycea multiplicata), but did not significantly change their prey handling time [33]. Four days of starvation stress not only increased the activity level of pool frog (Rana lessonae) and edible frog (Rana esculenta) tadpoles, but also extended the duration of their foraging activity [34]. The present study found that 1–4 weeks of starvation stress had no significant effects on the total foraging distance, relative foraging speed, or foraging time of A. davidianus larvae. This indicates that there are interspecific differences in the foraging behavioral responses of amphibians when facing starvation stress. The foraging behavior characteristics of A. davidianus larvae were also relatively conservative during food restriction, which may be related to the “maintenance” strategy observed in their locomotor performance (burst swimming speed). Such a behavioral strategy may be beneficial for maintaining foraging ability in food-scarce environments, thereby increasing their probability of surviving periods of starvation stress.

4.4. Effects of Starvation on Hypoxia Tolerance of A. davidianus Larvae

In natural aquatic environments, animals are frequently subjected to varying degrees of hypoxic stress [80]. Metabolic suppression is often accompanied by a reduced demand for oxygen, which facilitates better adaptation to hypoxic conditions and is therefore considered a crucial mechanism for animal survival in hypoxic environments [43,80]. For example, Sichuan sinibrama (Sinibrama taeniatus) exhibited significantly enhanced hypoxia tolerance after 28 days of starvation stress, which researchers attributed to a potential decrease in maintenance metabolic rate during starvation [45]. In contrast, 16 days of starvation did not significantly alter the resting metabolic rate or hypoxia tolerance of largemouth bass (Micropterus salmoides) [46]. In the present study, with prolonged starvation duration (2–4 weeks), the resting metabolic rate of A. davidianus larvae decreased significantly, indicating that they cope with starvation stress by reducing maintenance energy expenditure. The average body length of the experimental subjects in this study was approximately 9.78 cm, yet they were housed individually in cages measuring 10 cm in length, width, and height. This spatial constraint may have had an inhibitory effect on their metabolic rate. Therefore, the reduction in maintenance metabolic energy observed in A. davidianus larvae may have been influenced, to some extent, by the limited housing conditions provided to them. Starvation for 1–4 weeks did not result in significant differences in the ASR100 of A. davidianus larvae. However, 2–4 weeks of starvation led to a significant increase in their LOE100. These data suggest that while the critical hypoxia tolerance of A. davidianus larvae was not affected by starvation stress, their extreme hypoxia tolerance was impaired with prolonged starvation, which may subsequently negatively impact their survival. This impairment might be related to decreased oxygen uptake and transport capacity, as well as impaired anaerobic metabolic function during starvation [48,81,82]. This phenomenon has also been observed in studies on North African catfish (Clarias gariepinus) [48], and the underlying mechanisms warrant further investigation.

5. Conclusions

In summary, 1 to 4 weeks of starvation stress had a significant negative impact on the body mass of A. davidianus larvae, with this negative effect being more pronounced during the early phase of starvation. The body length of A. davidianus larvae remained relatively conservative under the same starvation stress conditions. The locomotor performance and foraging behavior of A. davidianus larvae were not affected by starvation (up to 4 weeks), which may be beneficial for maintaining foraging and predator avoidance abilities in food-scarce environments, thereby enhancing their survival fitness. However, with prolonged starvation duration (2–4 weeks), the extreme hypoxia tolerance of A. davidianus larvae was impaired, potentially due to excessive energy consumption and disruptions in physiological regulation under starvation stress. The control group (S0) was a separate pre-control group, and parallel control groups for each starvation group (S1, S2, and S4) at the same time points of starvation were not established in this study. Therefore, the negative effects of starvation on A. davidianus larvae may not have been fully revealed in this study. This limitation in the setup of the control group should be avoided in future studies. Furthermore, when A. davidianus larvae are exposed to multiple harsh environmental stressors in the wild, such as temperature fluctuations, hypoxia variability, intraspecific competition, and predation risk, the negative effects of starvation on their body mass and hypoxia tolerance may become more pronounced, potentially leading to carryover effects on subsequent life stages. Therefore, the issue of food availability should be fully considered in conservation practices such as the stock enhancement of A. davidianus larvae. Additionally, hypoxia tolerance warrants greater attention in future conservation research on this species. It is recommended to select a release site for A. davidianus larvae that offers relatively abundant prey and moderate water flow. This will help prevent the larvae from experiencing multiple stressors, such as food scarcity and low oxygen levels, thereby enhancing their post-release survival rate.

Author Contributions

Conceptualization, S.F., X.L. and J.R.; Methodology, S.F., X.L. and Z.L.; Writing—Original Draft Preparation, J.R.; Writing—Review & Editing, J.R., Z.L., S.F. and X.L.; Funding Acquisition, J.R., S.F. and X.L. All authors have read and agreed to the published version of the manuscript.

Funding

Supported by the National Natural Science Foundation of China (32370509); the Natural Science Foundation of Chongqing, China (CSTB2022NSCQ-MSX0623); the “Chengdu-Chongqing Economic Circle” Project of the Science and Technology Research Program of the Chongqing Education Commission of China (KJCX2020023); the Graduate Research Innovation Projects of Chongqing Normal University (YKC25038).

Institutional Review Board Statement

The study protocol was approved by the Animal Ethics Committee of Chongqing Normal University on 18 May 2025, under Approval No. CKLCUFF20250518-08.

Informed Consent Statement

Not applicable. The juvenile Chinese giant salamanders (Andrias davidianus) used in this study were all sourced from a commercial farm in Linwu County, Hunan Province, China.

Data Availability Statement

The data presented in this study are available on request from the corresponding author. The data are not publicly available due to privacy/ethical restrictions.

Conflicts of Interest

The authors declare no conflicts of interest.

References

  1. Xie, X.J.; Deng, L.; Zhang, B. Advances and studies on ecophysiological effects of starvation on fish. Acta Hydrobiol. Sin. 1998, 22, 181–188. [Google Scholar] [CrossRef] [Scilit]
  2. Bar, N. Physiological and hormonal changes during prolonged starvation in fish. Can. J. Fish. Aquat. Sci. 2014, 71, 1447–1458. [Google Scholar] [CrossRef] [Scilit]
  3. Nakajima, A.; Yamaguchi, R.; Sasazaki, M.; Ishihara, A.; Yamauchi, K. Adult male Xenopus laevis can tolerate months of fasting by catabolizing carbohydrates and lipids. J. Comp. Physiol. B 2023, 193, 227–238. [Google Scholar] [CrossRef] [Scilit] [PubMed]
  4. Peng, Z.S.; Wang, Q.S.; Yang, Y.F.; Tong, J.X.; Qin, C.; Huang, T.J.; Fu, S.J.; Li, X.M. Fasting on physical parameters and postprandial metabolic response in juvenile Andrias davidianus. Acta Hydrobiol. Sin. 2024, 48, 1766–1772. [Google Scholar]
  5. Fraker, M.E. The effect of hunger on the strength and duration of the antipredator behavioral response of green frog (Rana clamitans) tadpoles. Behav. Ecol. Sociobiol. 2008, 62, 1201–1205. [Google Scholar] [CrossRef] [Scilit]
  6. Gazzola, A.; Balestrieri, A.; Martín, J.; Pellitteri-Rosa, D. Is it worth the risk? food deprivation effects on tadpole anti-predatory responses. Evol. Biol. 2018, 45, 67–74. [Google Scholar] [CrossRef] [Scilit]
  7. Enriquez-Urzelai, U.; San Sebastián, O.; Garriga, N.; Llorente, G.A. Food availability determines the response to pond desiccation in anuran tadpoles. Oecologia 2013, 173, 117–127. [Google Scholar] [CrossRef] [Scilit]
  8. Bizjak Mali, L.; Sepčić, K.; Bulog, B. Long-term starvation in cave salamander effects on liver ultrastructure and energy reserve mobilization. J. Morphol. 2013, 274, 887–900. [Google Scholar] [CrossRef] [Scilit]
  9. Prokić, M.D.; Petrović, T.G.; Despotović, S.G.; Vučić, T.; Gavrić, J.P.; Radovanović, T.B.; Gavrilović, B.R. The effect of short-term fasting on the oxidative status of larvae of crested newt species and their hybrids. Comp. Biochem. Physiol. A Mol. Integr. Physiol. 2021, 251, 110819. [Google Scholar] [CrossRef] [Scilit]
  10. Lee, C.G.; Farrell, A.P.; Lotto, A.; MacNutt, M.J.; Hinch, S.G.; Healey, M.C. The effect of temperature on swimming performance and oxygen consumption in adult sockeye (Oncorhynchus nerka) and coho (O. kisutch) salmon stocks. J. Exp. Biol. 2003, 206, 3239–3251. [Google Scholar] [CrossRef] [Scilit]
  11. Li, X.M.; Huang, T.J.; Deng, C.L.; Fu, S.J.; Shi, X.T. Continuous flow stimulation had no significant effect on the growth rate but was conducive to the swimming performance, spontaneous behavior, and nonspecific immune parameter of juvenile Percocypris pingi. J. Exp. Zool. A Ecol. Integr. Physiol. 2023, 339, 925–938. [Google Scholar] [CrossRef] [Scilit]
  12. Aretz, J.M.; Cassill, D.; Deban, S.M.; Catenazzi, A.; Gainsbury, A.M. Thermal ecology and swimming performance of native tadpoles Dryophytes femoralis in central Florida. J. Therm. Biol. 2025, 132, 104237. [Google Scholar] [CrossRef] [Scilit]
  13. Ackerly, K.L.; Krahe, R.; Sanford, C.P.; Chapman, L.J. Effects of hypoxia on swimming and sensing in a weakly electric fish. J. Exp. Biol. 2018, 221, jeb172130. [Google Scholar] [CrossRef] [Scilit]
  14. Burton, A.H.; Bai, Q.; Burton, E.A. Sinusoidal analysis reveals a non-linear and dopamine-dependent relationship between ambient illumination and motor activity in larval zebrafish. Neurosci. Lett. 2021, 761, 136121. [Google Scholar] [CrossRef] [Scilit]
  15. Zhang, L.B.; Yao, W.Z.; Song, Y.Q. Preliminary study on the induction velocity of three cobitidae species in Heishui River. J. Hydroecol. 2022, 43, 102–107. [Google Scholar]
  16. Wang, X.C.; Xing, J.J. Comparison of induction velocities for five fish species. J. Hydroecol. 2018, 39, 77–81. [Google Scholar] [CrossRef] [Scilit]
  17. Reidy, S.P.; Kerr, S.R.; Nelson, J.A. Aerobic and anaerobic swimming performance of individual Atlantic cod. J. Exp. Biol. 2000, 203, 347–357. [Google Scholar] [CrossRef] [Scilit]
  18. Xia, J.G.; Li, X.M.; Fu, S.J. Effects of PFOS on burst swimming performance and metabolic recovery in juvenile Spinibarbus sinensis. Acta Hydrobiol. Sin. 2019, 43, 356–361. [Google Scholar]
  19. Cai, L.; Johnson, D.; Fang, M.; Mandal, P.; Tu, Z.; Huang, Y. Effects of feeding, digestion and fasting on the respiration and swimming capability of juvenile sterlet sturgeon (Acipenser ruthenus, Linnaeus 1758). Fish. Physiol. Biochem. 2017, 43, 279–286. [Google Scholar] [CrossRef] [Scilit] [PubMed]
  20. Hector, K.L.; Bishop, P.J.; Nakagawa, S. Consequences of compensatory growth in an amphibian. J. Zool. 2012, 286, 93–101. [Google Scholar] [CrossRef] [Scilit]
  21. Hervant, F.; Mathieu, J.; Durand, J.P. Behavioural, physiological and metabolic responses to long-term starvation and refeeding in a blind cave-dwelling (Proteus anguinus) and a surface-dwelling (Euproctus asper) salamander. J. Exp. Biol. 2001, 204, 269–281. [Google Scholar] [CrossRef] [Scilit]
  22. Sales, R.F.; Freire, E.M. Diet and foraging behavior of Ameivula ocellifera (Squamata: Teiidae) in the Brazilian semiarid Caatinga. J. Herpetol. 2015, 49, 579–585. [Google Scholar] [CrossRef] [Scilit]
  23. Mahapatra, S.; Dutta, S.K.; Sahoo, G. Opportunistic predatory behaviour in Duttaphrynus melanostictus (Schneider, 1799) tadpoles. Curr. Sci. 2017, 112, 1755–1759. [Google Scholar] [CrossRef] [Scilit]
  24. Weber, M.J.; Dettmers, J.M.; Wahl, D.H.; Czesny, S.J. Effects of predator-prey interactions and benthic habitat complexity on selectivity of a foraging generalist. Trans. Am. Fish. Soc. 2010, 139, 1004–1013. [Google Scholar] [CrossRef] [Scilit]
  25. Koprivnikar, J.; Penalva, L. Lesser of two evils? Foraging choices in response to threats of predation and parasitism. PLoS ONE 2015, 10, e0116569. [Google Scholar] [CrossRef] [Scilit]
  26. Sánchez-Hernández, J.; Cobo, F. Foraging behaviour of brown trout in wild populations: Can population density cause behaviourally-mediated foraging specializations? Anim. Biol. 2013, 63, 425–450. [Google Scholar] [CrossRef] [Scilit]
  27. Xia, P.; Sheng, X.Q.; Zhang, W.X.; Xu, Y.J. Effects of short-term temperature changes on the physiology, biochemistry and feeding behaviour of the juvenile yellow seahorse-Hippopotamus kuda Bleeker. Aquac. Res. 2021, 53, 1084–1097. [Google Scholar] [CrossRef] [Scilit]
  28. Abdel-Tawwab, M.; Hagras, A.E.; Elbaghdady, H.A.M.; Monier, M.N. Dissolved oxygen level and stocking density effects on growth, feed utilization, physiology, and innate immunity of Nile Tilapia, Oreochromis niloticus. J. Appl. Aquac. 2014, 26, 340–355. [Google Scholar] [CrossRef] [Scilit]
  29. Yin, F.; Gong, Q.; Li, Y.; Dan, X.; Sun, P.; Gao, Q.; Shi, Z.; Peng, S.; Li, A. Effects of Cryptocaryon irritans infection on the survival, feeding, respiratory rate and ionic regulation of the marbled rockfish Sebastiscus marmoratus. Parasitology 2014, 141, 279–286. [Google Scholar] [CrossRef] [Scilit] [PubMed]
  30. Yoseda, K.; Yamamoto, K.; Asami, K.; Chimura, M.; Hashimoto, K.; Kosaka, S. Influence of light intensity on feeding, growth, and early survival of leopard coral grouper (Plectropomus leopardus) larvae under mass-scale rearing conditions. Aquaculture 2008, 279, 55–62. [Google Scholar] [CrossRef] [Scilit]
  31. Parker, B.; Britton, J.R.; Green, I.D.; Amat-Trigo, F.; Andreou, D. Parasite infection but not chronic microplastic exposure reduces the feeding rate in a freshwater fish. Environ. Pollut. 2023, 320, 121120. [Google Scholar] [CrossRef] [Scilit]
  32. Pimentel Lima, A.; Magnusson, W.E. Partitioning seasonal time: Interactions among size, foraging activity and diet in leaf-litter frogs. Oecologia 1998, 116, 259–266. [Google Scholar] [CrossRef] [Scilit] [PubMed]
  33. Whitham, J.; Mathis, A. Effects of hunger and predation risk on foraging behavior of graybelly salamanders, Eurycea multiplicate. J. Chem. Ecol. 2000, 26, 1659–1665. [Google Scholar] [CrossRef] [Scilit]
  34. Horat, P.; Semlitsch, R.D. Effects of predation risk and hunger on the behaviour of two species of tadpoles. Behav. Ecol. Sociobiol. 1994, 34, 393–401. [Google Scholar] [CrossRef]
  35. Storey, J.M.; Li, Z.; Storey, K.B. Hypoxia inducible factor-1α responds to freezing, anoxia and dehydration stresses in a freeze-tolerant frog. Cryobiology 2023, 110, 79–85. [Google Scholar] [CrossRef] [Scilit]
  36. McBryan, T.L.; Healy, T.M.; Haakons, K.L.; Schulte, P.M. Warm acclimation improves hypoxia tolerance in Fundulus heteroclitus. J. Exp. Biol. 2016, 219, 474–484. [Google Scholar] [CrossRef] [Scilit]
  37. Sloman, K.A.; Wood, C.M.; Scott, G.R.; Wood, S.; Kajimura, M.; Johannsson, O.E.; Almeida-Val, V.M.; Val, A.L. Tribute to R. G. Boutilier: The effect of size on the physiological and behavioural responses of oscar, Astronotus ocellatus, to hypoxia. J. Exp. Biol. 2006, 209, 1197–1205. [Google Scholar] [CrossRef] [Scilit] [PubMed]
  38. Fu, S.J.; Brauner, C.J.; Cao, Z.D.; Richards, J.G.; Peng, J.L.; Dhillon, R.; Wang, Y.X. The effect of acclimation to hypoxia and sustained exercise on subsequent hypoxia tolerance and swimming performance in goldfish (Carassius auratus). J. Exp. Biol. 2011, 214, 2080–2088. [Google Scholar] [CrossRef] [Scilit]
  39. Fu, S.J.; Fu, C.; Yan, G.J.; Cao, Z.D.; Zhang, A.J.; Pang, X. Interspecific variation in hypoxia tolerance, swimming performance and plasticity in cyprinids that prefer different habitats. J. Exp. Biol. 2014, 217, 590–597. [Google Scholar]
  40. Zhou, L.Y.; Fu, S.J.; Fu, C.; Ling, H.; Li, X.M. Effects of acclimation temperature on the thermal tolerance, hypoxia tolerance and swimming performance of two endangered fish species in China. J. Comp. Physiol. B 2019, 189, 237–247. [Google Scholar] [CrossRef] [Scilit]
  41. Niu, Y.; Zhang, X.; Zhang, H.; Men, S.; Xu, T.; Ding, L.; Li, X.; Wang, L.; Wang, H.; Storey, K.B.; et al. Ecological adaptations of amphibians to environmental changes along an altitudinal gradient (Case Study: Bufo gargarizans) from phenotypic and genetic perspectives. BMC Biol. 2024, 22, 231. [Google Scholar] [CrossRef] [Scilit]
  42. Kruhøffer, M.; Glass, M.L.; Abe, A.S.; Johansen, K. Control of breathing in an amphibian Bufo paracnemis: Effects of temperature and hypoxia. Respir. Physiol. 1987, 69, 267–275. [Google Scholar] [CrossRef] [Scilit]
  43. Boutilier, R.G. Mechanisms of metabolic defense against hypoxia in hibernating frogs. Respir. Physiol. 2001, 128, 365–377. [Google Scholar] [CrossRef] [Scilit] [PubMed]
  44. Issartel, J.; Hervant, F.; de Fraipont, M.; Clobert, J.; Voituron, Y. High anoxia tolerance in the subterranean salamander Proteus anguinus without oxidative stress nor activation of antioxidant defenses during reoxygenation. J. Comp. Physiol. B 2009, 179, 543–551. [Google Scholar] [CrossRef] [Scilit] [PubMed]
  45. Pu, D.Y.; Liu, X.H.; Li, M.L.; Shen, J.; Pang, X. Effects of fasting on energy metabolism and hypoxia tolerance of Sinibrama taeniatus. J. Southwest Univ. Nat. Sci. 2024, 46, 87–95. [Google Scholar]
  46. Tan, G.; Shi, H.Y.; Chen, Y.J.; Lin, S.M.; Li, Y.; Pang, X. Feeding and fasting on swimming performance and hypoxia tolerance of Micropterus Salmoides. Acta Hydrobiol. Sin. 2022, 46, 826–831. [Google Scholar]
  47. Shekhovtsov, S.V.; Bulakhova, N.A.; Tsentalovich, Y.P.; Zelentsova, E.A.; Osik, N.A.; Meshcheryakova, E.N.; Poluboyarova, T.V.; Berman, D.I. Metabolomic profiling reveals differences in hypoxia response between Far Eastern and siberian frogs. Animals 2023, 13, 3349. [Google Scholar] [CrossRef] [Scilit]
  48. Xiang, P.; Zhang, Y.F.; Huang, K.R.; Fu, S.J. The effects of feeding and short-term starvation on the thermal and hypoxia tolerance of Clarias gariepinus. Chin. J. Ecol. 2025, 44, 1518–1524. [Google Scholar]
  49. Jiang, J.P.; Xie, F.; Zang, C.X.; Cai, L.; Li, C.; Wang, B.; Li, J.T.; Wang, J.; Hu, J.H.; Wang, Y.; et al. Assessing the threat status of amphibians in China. Biodivers. Sci. 2016, 24, 588–597. [Google Scholar] [CrossRef] [Scilit]
  50. Turvey, S.T.; Chen, S.; Tapley, B.; Wei, G.; Xie, F.; Yan, F.; Yang, J.; Liang, Z.; Tian, H.; Wu, M.; et al. Imminent extinction in the wild of the world’s largest amphibian. Curr. Biol. 2018, 28, R592–R594. [Google Scholar] [CrossRef] [Scilit]
  51. Yan, F.; Lü, J.; Zhang, B.; Yuan, Z.; Zhao, H.; Huang, S.; Wei, G.; Mi, X.; Zou, D.; Xu, W.; et al. The Chinese giant salamander exemplifies the hidden extinction of cryptic species. Curr. Biol. 2018, 28, R590–R592. [Google Scholar] [CrossRef] [Scilit]
  52. Geng, X.; Zhang, L.; Zang, X.; Guo, J.; Xu, C. RNA-seq analysis provides insight into molecular adaptations of Andrias davidianus. Dev. Genes Evol. 2019, 229, 197–206. [Google Scholar] [CrossRef] [Scilit]
  53. Zheng, H.X. The Population Ecology and Ecological Adaptation Characteristic of the Chinese Giant Salamander (Andrias davidianus) in Lushi County, Henan Province, China. Doctoral Dissertation, East China Normal University, Shanghai, China, 2006. [Google Scholar]
  54. Zhang, T. Protein Expression and Effect of Lung Physiological and Biochemical in Andrias davidianus During Fasting. Master’s Thesis, Henan Normal University, Xinxiang, China, 2018. [Google Scholar]
  55. Yang, H.S.; Yang, G.R.; Wang, H. The effect of hunger on blood in giant salamanders. J. Henan Norm. Univ. Nat. Sci. 1993, 21, 43–46. [Google Scholar]
  56. Dai, Y.F. The Effects of Hunger Stress on the Gut Physiology, Biochemistry, and Microbiota of Chinese Giant Salamanders. Master’s Thesis, Chongqing Three Gorges University, Chongqing, China, 2024. [Google Scholar]
  57. Yang, D.Q. Effect of season, hunger and sex on biochemical composition of muscle and liver of giant salamander. J. Hubei Agric. Coll. 1990, 10, 32–38. [Google Scholar]
  58. Meng, Z. Studies on Skin Immune-Related Protein Expression and Effect Under Fasting Conditions in Andrias davidianus. Master’s Thesis, Henan Normal University, Xinxiang, China, 2018. [Google Scholar]
  59. Geng, X.; Guo, J.; Zhang, L.; Sun, J.; Zang, X.; Qiao, Z.; Xu, C. Differential proteomic analysis of Chinese giant salamander liver in response to fasting. Front. Physiol. 2020, 11, 208. [Google Scholar] [CrossRef] [Scilit]
  60. Hou, Q.M.; Fu, S.J.; Huang, T.J.; Li, X.M. Meal size on swimming performance and excess post-exercise oxygen consumption in juvenile Andrias davidianus. Acta Hydrobiol. Sin. 2023, 47, 2028–2036. [Google Scholar]
  61. Yang, Z.J.; Xiao, H.B.; Tian, H.F.; Meng, Y.; Hu, Q.M.; Wang, F. Suitable feeding frequency of juvenile Chinese giant salamander. Fish. Sci. 2015, 34, 629–633. [Google Scholar]
  62. Hamamoto, Y.; Kurose, T.; Seino, Y. Is caloric restriction enough to increase longevity? Fasting and circadian alignment. J. Diabetes Investig. 2023, 14, 933–935. [Google Scholar] [CrossRef] [Scilit]
  63. Li, K.; Wei, X.; Li, K.; Zhang, Q.; Zhang, J.; Wang, D.; Yang, J. Dietary restriction to optimize T cell immunity is an ancient survival strategy conserved in vertebrate evolution. Cell. Mol. Life Sci. 2023, 80, 219. [Google Scholar] [CrossRef] [Scilit]
  64. Zhang, W.; Cao, Z.D.; Fu, S.J. Effect of dissolved oxygen level on metabolic mode in juvenile crucian carp. Acta. Ecol. Sin. 2012, 32, 5806–5812. [Google Scholar] [CrossRef] [Scilit]
  65. Shi, X.; Guo, Q.; Li, X.; Li, T.; Li, T.; Li, T.; Zhang, P.; Li, Z.; Liu, H. Metabolic responses to starvation in the soft-shelled turtle (Pelodiscus sinensis) revealed by integrated metabolome and transcriptome analysis. Comp. Biochem. Physiol. Part D. Genom. Proteom. 2025, 55, 101486. [Google Scholar] [CrossRef] [Scilit]
  66. Smith, M.E.; Secor, S.M. Physiological responses to fasting and estivation for the three-toed amphiuma (Amphiuma tridactylum). Physiol. Biochem. Zool. 2017, 90, 240–256. [Google Scholar] [CrossRef] [Scilit]
  67. Zhang, Y.; Gao, H.Q.; Wang, Z.; Xu, J.; Yao, J.; Wang, H.; Zhang, Z.Q. Body mass and internal organ size response to fasting and refeeding treatments in Asiatic toads (Bufo gargarizans). Chin. J. Zool. 2017, 52, 294–303. [Google Scholar]
  68. Fu, X.F.; Zhang, Z.Q. Effects of fasting on the morphology and distributive density of argyrophilic cells along the gastrointestine of Cynops orientalis. Chin. J. Zool. 2011, 46, 114–119. [Google Scholar]
  69. Naya, D.E.; Veloso, C.; Sabat, P.; Bozinovic, F. The effect of short- and long-term fasting on digestive and metabolic flexibility in the Andean toad, Bufo spinulosus. J. Exp. Biol. 2009, 212, 2167–2175. [Google Scholar] [CrossRef] [Scilit]
  70. Shi, Z.H.; Zhao, Z.; Liu, L.Z.; Bian, X.L.; Zhang, Y. Pore-forming protein βγ-CAT promptly responses to fasting with capacity to deliver macromolecular nutrients. FASEB J. 2022, 36, e22533. [Google Scholar] [CrossRef] [Scilit]
  71. Prokić, M.D.; Petrović, T.G.; Gavrilović, B.R.; Despotović, S.G.; Gavrić, J.P.; Kijanović, A.; Tomašević Kolarov, N.; Vukov, T.; Radovanović, T.B. Carry-over effects of desiccation stress on the oxidative status of fasting anuran juveniles. Front. Physiol. 2021, 12, 783288. [Google Scholar] [CrossRef] [Scilit]
  72. Székely, D.; Cogălniceanu, D.; Székely, P.; Armijos-Ojeda, D.; Espinosa-Mogrovejo, V.; Denoël, M. How to recover from a bad start: Size at metamorphosis affects growth and survival in a tropical amphibian. BMC Ecol. 2020, 20, 24. [Google Scholar] [CrossRef] [Scilit]
  73. Wang, Y.M.; Li, Z.M.; Tu, Z.Y.; Lei, Q.S.; Ke, S.F.; Luo, J.; Cheng, B.X.; Shi, X.T. Fishway design based on the swimming ability of two Schizothorax species in the Yalung River, China. Chin. J. Appl. Ecol. 2020, 31, 2785–2792. [Google Scholar]
  74. Cai, L.; Wang, W.Y.; Wang, H.L.; Hu, W.B.; Zhao, P.; Zhao, N.; Hou, Y.Q.; Chen, S.L.; Chen, H.; Zhang, P. Response of induced flow speed to fish body length and its application in flow design of fish passage facilities. Trans. Chin. Soc. Agric. Eng. 2018, 34, 176–181. [Google Scholar]
  75. Deng, C.L.; Fu, S.J.; Li, X.M. Anaerobic exercise training and detraining on swimming performance and excess post-exercise oxygen consumption in juvenile Andrias davidianus. Acta Hydrobiol. Sin. 2024, 48, 1315–1321. [Google Scholar]
  76. Widder, P.D.; Bidwell, J.R. Tadpole size, cholinesterase activity, and swim speed in four frog species after exposure to sub-lethal concentrations of chlorpyrifos. Aquat. Toxicol. 2008, 88, 9–18. [Google Scholar] [CrossRef] [Scilit]
  77. Wilcox, S.C.; Lappin, A.K. Burst-swimming performance predicts the outcome of cannibalistic interactions in green poison frog larvae (Dendrobates auratus). J. Exp. Zool. Part A Ecol. Genet. Physiol. 2013, 319, 495–504. [Google Scholar] [CrossRef] [Scilit]
  78. Lu, H.L.; Geng, J.; Xu, W.; Ping, J.; Zhang, Y.P. Physiological response and changes in swimming performance after thermal acclimation in juvenile Chinese fire-belly newts, Cynops orientalis. Acta Ecol. Sin. 2017, 37, 1603–1610. [Google Scholar] [CrossRef] [Scilit]
  79. Ladds, M.; Rosen, D.; Gerlinsky, C.; Slip, D.; Harcourt, R. Diving deep into trouble: The role of foraging strategy and morphology in adapting to a changing environment. Conserv. Physiol. 2020, 8, coaa111. [Google Scholar] [CrossRef] [Scilit]
  80. Bickler, P.E.; Buck, L.T. Hypoxia tolerance in reptiles, amphibians, and fishes: Life with variable oxygen availability. Annu. Rev. Physiol. 2007, 69, 145–170. [Google Scholar] [CrossRef] [Scilit]
  81. Speers-Roesch, B.; Mandic, M.; Groom, D.J.E.; Richards, J.G. Critical oxygen tensions as predictors of hypoxia tolerance and tissue metabolic responses during hypoxia exposure in fishes. J. Exp. Mar. Biol. Ecol. 2013, 449, 239–249. [Google Scholar] [CrossRef] [Scilit]
  82. Saez, I.; Duran, J.; Sinadinos, C.; Beltran, A.; Yanes, O.; Tevy, M.F.; Martinez-Pons, C.; Milan, M.; Guinovart, J.J. Neurons have an active glycogen metabolism that contributes to tolerance to hypoxia. J. Cereb. Blood Flow Metab. 2014, 34, 945–955. [Google Scholar] [CrossRef] [Scilit]
Figure 1. Effects of starvation on the rest metabolic rate in A. davidianus larvae (mean ± SE). Different lowercase letters indicate a significant difference (p < 0.05).
Animals 16 01801 g001
Figure 2. Effects of starvation on the hypoxia tolerance in A. davidianus larvae (mean ± SE). (A) aquatic surface respiration, ASR100; (B) loss of equilibrium, LOE100. Different lowercase letters indicate a significant difference (p < 0.05).
Animals 16 01801 g002
Table 1. The effect of starvation on the growth in Andrias davidianus larvae (mean ± SE).
Starvation Time (Week)Significance
Control124Starvation Effect
Sample (N)54545454--
Initial body mass (g)5.46 ± 0.12 a5.42 ± 0.11 a5.35 ± 0.09 a5.42 ± 0.13 aF3, 215 = 0.157; p = 0.925
Initial body length (cm)9.77 ± 0.07 a9.73 ± 0.08 a9.79 ± 0.06 a9.79 ± 0.08 aF3, 215 = 0.118; p = 0.949
Initial condition factor (100 × g cm−3)0.58 ± 0.01 a0.58 ± 0.01 a0.57 ± 0.01 a0.57 ± 0.01 aF3, 215 = 1.295; p = 0.277
Final body mass (g)--4.81 ± 0.10 a*4.69 ± 0.09 a*4.39 ± 0.11 b*F2, 161 = 4.412; p = 0.014
Final body length (cm)--9.64 ± 0.07 a9.64 ± 0.06 a9.51 ± 0.08 a*F2, 161 = 1.012; p = 0.366
Final condition factor (100 × g cm−3)--0.53 ± 0.01 a*0.52 ± 0.01 a*0.50 ± 0.01 b*F2, 161 = 4.107; p = 0.018
Daily rate of body mass change (% d−1)--−8.74 ± 0.54 b−4.68 ± 0.26 a−3.72 ± 0.13 aF2, 161 = 57.068; p < 0.001
Daily rate of body length change (% d−1)--−1.46 ± 0.53 a−1.13 ± 0.25 a−1.00 ± 0.13 aF2, 161 = 0.453; p = 0.636
Values in each row with different lowercase letters indicate a significant difference (p < 0.05). The asterisk (*) denotes a significant difference between the initial and final values within the same treatment group (p < 0.05).
Table 2. The effect of starvation on several variables related to the locomotor performance, foraging behavior in Andrias davidianus larvae (mean ± SE).
Starvation Time (Week)Significance
Control124CovariateStarvation
Sample (N)10101010----
Relative induction flow speed (bl s−1)3.00 ± 0.48 a3.17 ± 0.62 a2.70 ± 0.56 a2.48 ± 0.57 a--F3, 39 = 2.599, p = 0.067
Relative burst swimming speed (bl s−1)4.30 ± 0.66 a4.56 ± 0.65 a4.08 ± 0.69 a3.78 ± 0.63 a--F3, 39 = 2.361, p = 0.088
Total foraging distance (cm)587.07 ±
328.44 a
829.48 ±
541.63 a
1324.38 ±
1083.18 a
1062.24 ±
665.46 a
F1, 39 = 6.397, p = 0.016F3, 39 = 1.612, p = 0.204
Relative foraging speed (bl s−1)0.16 ± 0.13 a0.17 ± 0.19 a0.23 ± 0.21 a0.14 ± 0.08 aF1, 39 = 1.922, p = 0.174F3, 39 = 0.575, p = 0.635
Foraging time (s)495.62 ±
304.76 a
707.43 ±
463.55 a
749.44 ±
413.00 a
893.51 ±
410.63 a
F1, 39 = 1.260, p = 0.269F3, 39 = 1.196, p = 0.326
Values in the same row with the same superscript lowercase letters indicate no significant difference. bl, body length.
Disclaimer/Publisher’s Note: The statements, opinions and data contained in all publications are solely those of the individual author(s) and contributor(s) and not of MDPI and/or the editor(s). MDPI and/or the editor(s) disclaim responsibility for any injury to people or property resulting from any ideas, methods, instructions or products referred to in the content.