
Hematology, Biochemistry, and Blood Gas Reference Intervals for Captive Anesthetized Long-Tailed Goral (Naemorhedus caudatus)

 , , ,
, , ,
Simple Summary
Abstract
1. Introduction
2. Materials and Methods
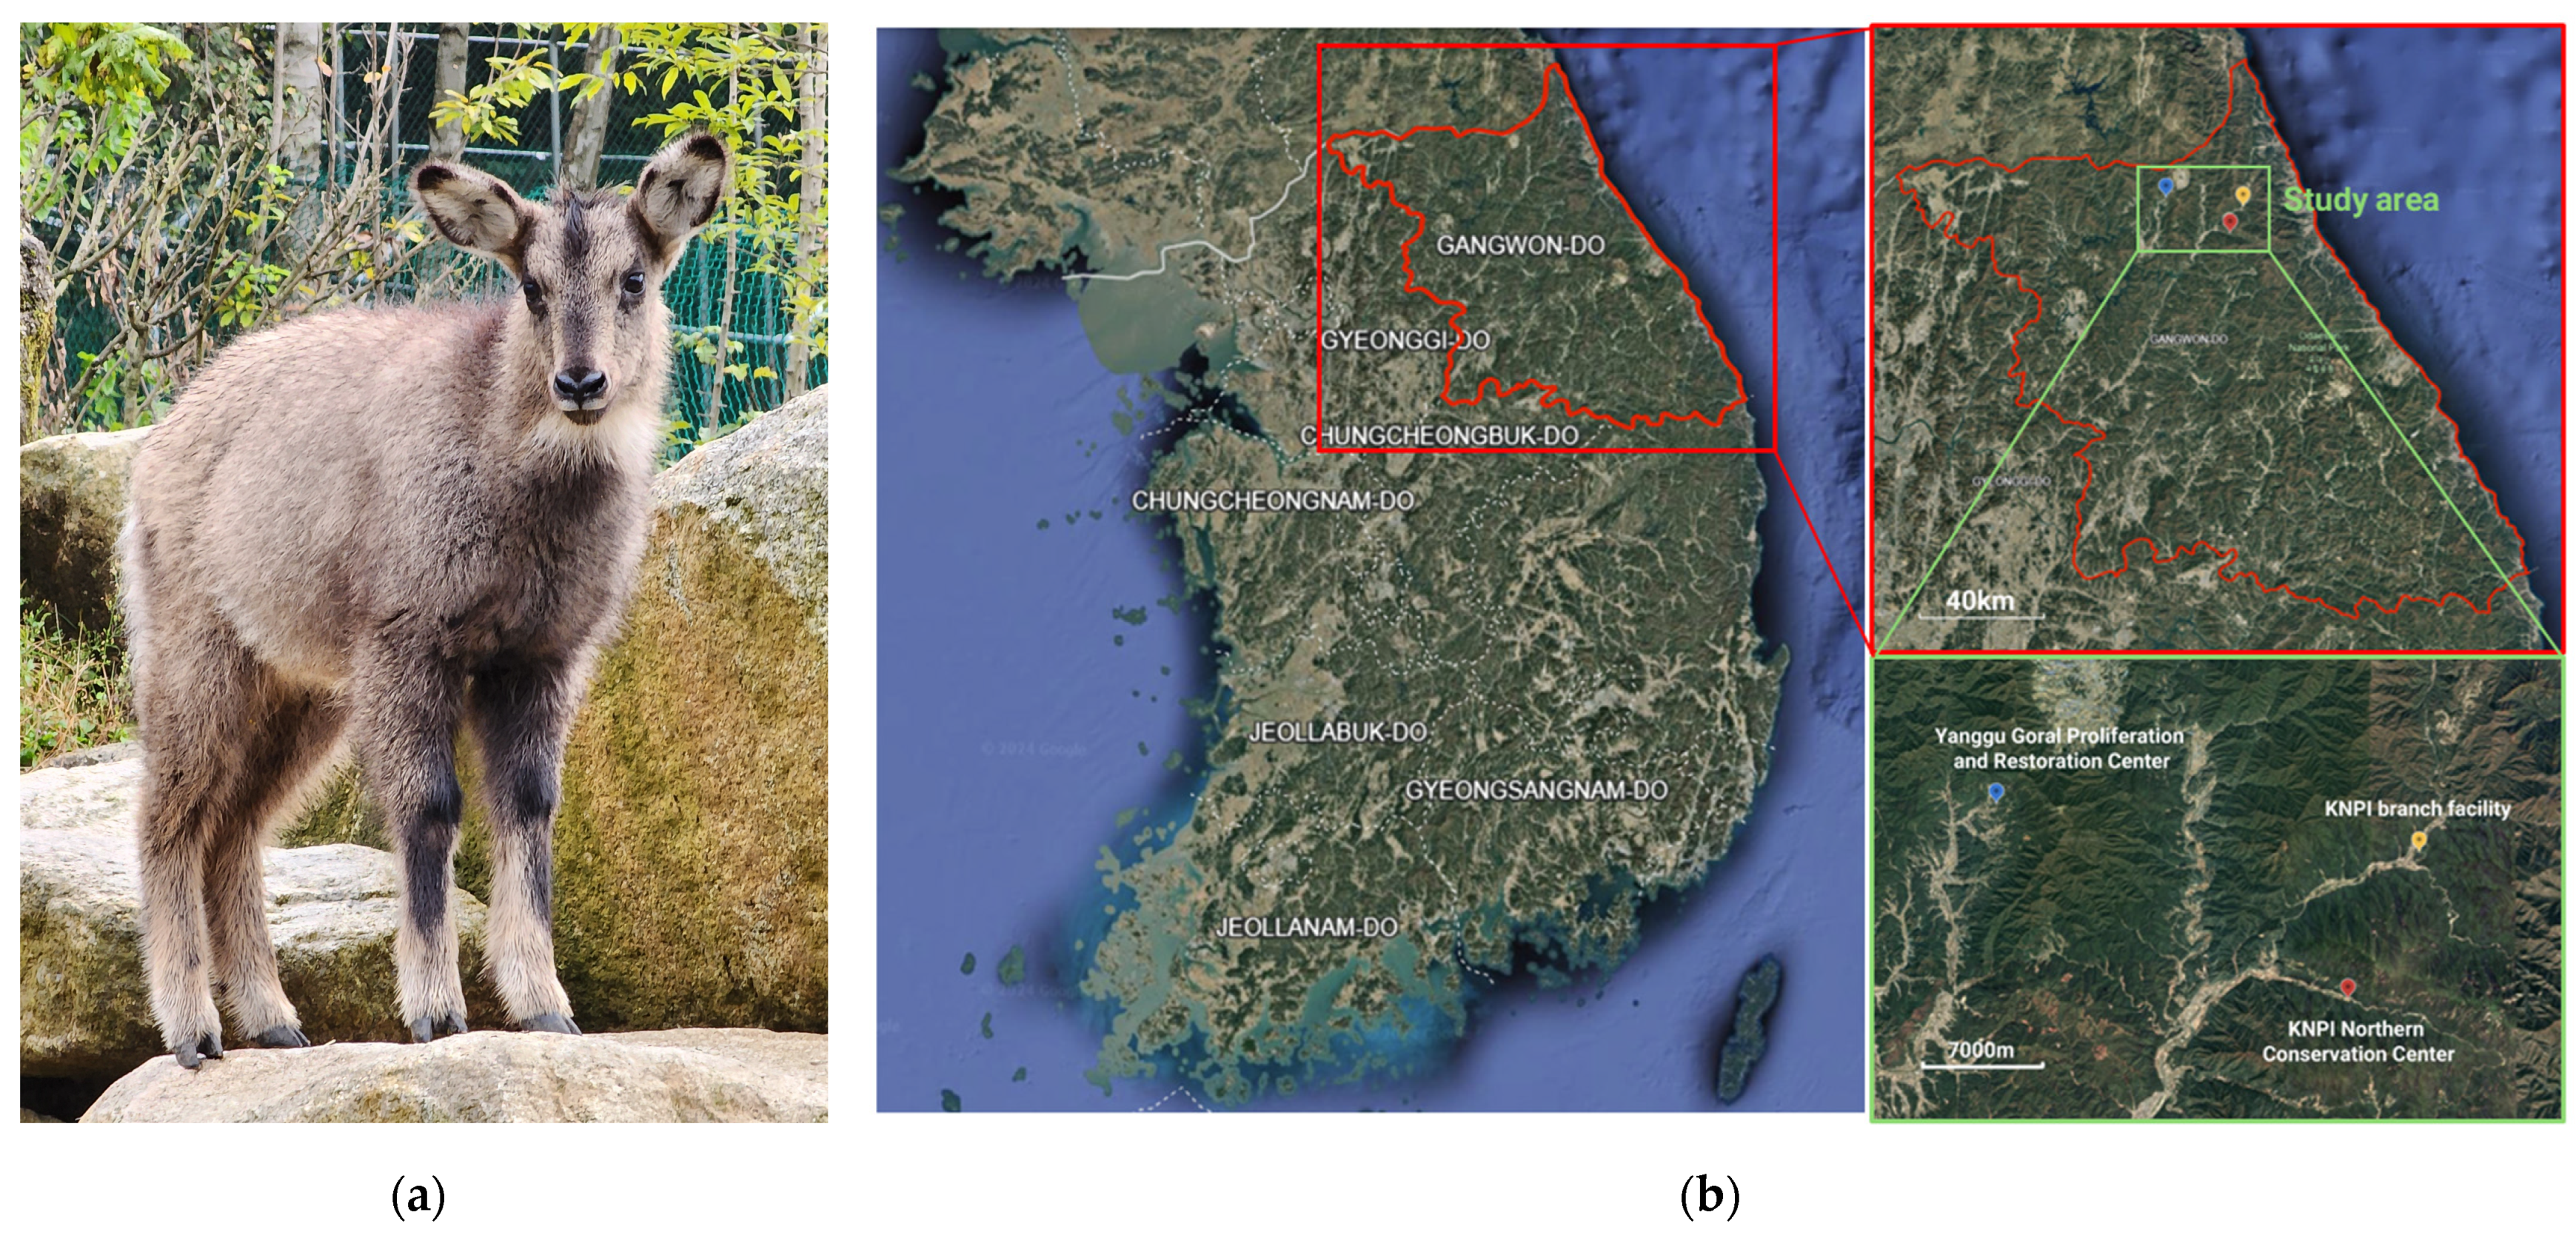
2.1. Animals
2.2. Sample Collection and Laboratory Analysis
2.3. Statistical Analysis
3. Results
3.1. Descriptive Analysis of the Total Number of Animals
3.2. Reference Intervals
3.3. Influence of Age and Sex
3.4. Comparison of Arterial and Venous Blood Gas Analysis Results
4. Discussion
4.1. Reference Intervals for Hematology, Biochemistry Parameters, and Blood Gas Analysis
4.2. Influence of Age and Sex on Hematology and Biochemistry Results
4.3. Evaluation of Arterial and Venous Blood Gas Differences
4.4. Potential Effects of Captivity, Capture Method, and Anesthetic Protocol
5. Conclusions
Author Contributions
Funding
Institutional Review Board Statement
Informed Consent Statement
Data Availability Statement
Acknowledgments
Conflicts of Interest
References
- Jo, Y.S.; Baccus, J.T.; Koprowski, J.L. Mammals of Korea; National Institute of Biological Resources: Incheon, Republic of Korea, 2018; pp. 308–310. [Google Scholar]
- Cho, C.U. Systematic Study on the Long-Tailed Goral (Naemorhedus caudatus) with Ecology and Conservation Plan. Ph.D. Thesis, Chungbuk National University, Cheongju, Republic of Korea, 2013. [Google Scholar]
- National Park Institute for Wildlife Conservation. 2022 Annual Report; National Park Institute for Wildlife Conservation: Gurye, Republic of Korea, 2022. [Google Scholar]
- Bragina, E.; Kim, S.; Zaumyslova, O.; Park, Y.S.; Lee, W. Naemorhedus caudatus. The IUCN Red List of Threatened Species 2020: E.T14295A22150540; IUCN Biodiversity Assessment & Knowledge Team: Red List Unit: Cambridge, UK, 2020. [Google Scholar] [CrossRef]
- Yang, B.G. Systematics, Ecology and Current Population Status of the Goral, Naemorhedus caudatus, in Korea. Ph.D. Thesis, Chungbuk National University, Cheongju, Republic of Korea, 2002. [Google Scholar]
- Won, B.H. Illustrated Encyclopedia of Fauna and Flora of Korean Mammals; Samhwa: Seoul, Republic of Korea, 1967. [Google Scholar]
- Park, H.B. The Habitat Using Characteristics of Long-Tailed Goral (Naemorhedus caudatus) in the Northern Region of Gyeongbuk Province and the Effect of Climate Change. Master’s Thesis, Kyungpook National University, Daegu, Republic of Korea, 2011. [Google Scholar]
- Ahn, S.; Choi, Y.; Kim, J.T. Hematologic and biochemical reference intervals for natural monument Korean goral (Naemorhedus caudatus). Korean J. Vet. Serv. 2017, 40, 155–159. [Google Scholar]
- Ahn, S.; Kim, J.T. Reference Values of Body Measurements, Hematology and Biochemistry and Parasite Prevalence in Fecal Samples of Proliferating and Restoring Korean Gorals (Naemorhedus caudatus). Ann. Anim. Resour. Sci. 2018, 29, 134–141. [Google Scholar] [CrossRef]
- Kim, H.J. Morphological, Hematological Analysis and Serological Surveillance of Infectious Diseases on Endangered Goral (Naemorhedus caudatus). Master’s Thesis, Kangwon National University, Chuncheon, Republic of Korea, 2011. [Google Scholar]
- Al-Rukibat, R.; Ismail, Z. Breed-specific reference intervals of hematologic variables in Shami goats (Capra aegagrus hircus) with the possible effects of age and sex. Vet. Clin. Pathol. 2019, 48, 762–767. [Google Scholar] [CrossRef]
- Karaşahin, T.; Aksoy, N.H.; Dursun, Ş.; Bulut, G.; Haydardedeoğlu, A.E.; Çamkerten, G.; Çamkerten, İ.; İlgün, R. Effects of age and sex on some hematological and biochemical parameters in hair goats. Vet. Res. Forum 2022, 13, 15–19. [Google Scholar]
- Casas-Díaz, E.; López-Olvera, J.R.; Marco, I.; Mentaberre, G.; Lavín, S. Hematologic and biochemical values for Spanish ibex (Capra pyrenaica) captured via drive-net and box-trap. J. Wildl. Dis. 2008, 44, 965–972. [Google Scholar] [CrossRef]
- López-Olvera, J.R.; Marco, I.; Montané, J.; Lavín, S. Haematological and serum biochemical values of southern chamois (Rupicapra pyrenaica). Vet. Rec. 2006, 158, 479–484. [Google Scholar] [CrossRef]
- Pérez, J.M.; González, F.J.; Granados, J.E.; Pérez, M.C.; Fandos, P.; Soriguer, R.C.; Serrano, E. Hematologic and biochemical reference intervals for Spanish ibex. J. Wildl. Dis. 2003, 39, 209–215. [Google Scholar] [CrossRef]
- Omidi, A.; Nik, H.A.; Nazifi, S. Biochemical reference values for healthy captive Persian wild goat (Capra aegagrus). Comp. Clin. Pathol. 2018, 27, 483–491. [Google Scholar] [CrossRef]
- Al-Rukibat, R.; Ismail, Z.; Al-Zghoul, M.B.; Hananeh, W. Establishment of reference intervals of selected blood biochemical parameters in Shami goats. Vet. Clin. Pathol. 2020, 49, 665–668. [Google Scholar] [CrossRef]
- Stevens, J.B.; Anderson, K.L.; Correa, M.T.; Stewart, T.; Braselton, W.E. Hematologic, Blood Gas, Blood Chemistry, and Serum Mineral Values for a Sample of Clinically Healthy Adult Goats. Vet. Clin. Pathol. 1994, 23, 19–24. [Google Scholar] [CrossRef]
- Afshar, F.S.; Baniadam, A.; Marashipour, S.P. Effect of xylazine-ketamine on arterial blood pressure, arterial blood pH, blood gases, rectal temperature, heart and respiratory rates in goats. Bull. Vet. Inst. Pulawy 2005, 49, 481–484. [Google Scholar]
- Kilgallon, C.; Bailey, T.; Arca-Ruibal, B.; Misheff, M.; O’Donovan, D. Blood-gas and acid-base parameters in non-tranquilized Arabian oryx (Oryx leucoryx) in the United Arab Emirates. J. Zoo. Wildl. Med. 2008, 39, 6–12. [Google Scholar] [CrossRef] [PubMed]
- Friedrichs, K.R.; Harr, K.E.; Freeman, K.P.; Szladovits, B.; Walton, R.M.; Barnhart, K.F.; Blanco-Chavez, J. ASVCP reference interval guidelines: Determination of de novo reference intervals in veterinary species and other related topics. Vet. Clin. Pathol. 2012, 41, 441–453. [Google Scholar] [CrossRef]
- Geffré, A.; Concordet, D.; Braun, J.P.; Trumel, C. Reference Value Advisor: A new freeware set of macroinstructions to calculate reference intervals with Microsoft Excel. Vet. Clin. Pathol. 2011, 40, 107–112. [Google Scholar] [CrossRef]
- Stayt, J. Hematology of Sheep and Goats. In Schalm’s Veterinary Hematology, 7th ed.; Weiss, D.J., Wardrop, K.J., Eds.; Wiley-Blackwell: Hoboken, NJ, USA, 2022; pp. 1012–1018. [Google Scholar] [CrossRef]
- Hama Khan, K.M.; Ali, M.K.; Abdullah, M.M.; Hama Amin, S.A. Reference values for haemato-biochemical parameters in the Maraz goats. Res. Opin. Anim. Vet. Sci. 2016, 6, 79–84. [Google Scholar]
- Karapashahin, T.; Aksoy, N.H.; Haydardedeoğlu, A.E.; Dursun, Ş.; Bulut, G.; Çamkerten, G.; Çamkerten, İ.; İlgün, R. Serum cholesterol levels in Hair goats of Aksaray Region. Indian. J. Anim. Res. 2019, 53, 63–66. [Google Scholar]
- Säkkinen, H. Variation in the Blood Chemical Constituents of Reindeer: Significance of Season, Nutrition, and Other Extrinsic and Intrinsic Factors. Ph.D. Thesis, University of Oulu, Oulu, Finland, 2005. [Google Scholar]
- Russell, K.E.; Roussel, A.J. Evaluation of the Ruminant Serum Chemistry Profile. Vet. Clin. N. Am. Food Anim. Pract. 2007, 23, 403–426. [Google Scholar] [CrossRef]
- Bhooshan, N.; Kumar, P.; Yadav, M.C. Effect of age and reproductive state on phosphatase enzymes and steroid hormones profile in Indian goats. Indian J. Anim. Sci. 2010, 80, 321–325. [Google Scholar]
- Hoffmann, W.E.; Solter, P.F. Diagnostic Enzymology of Domestic Animals. In Clinical Biochemistry of Domestic Animals, 6th ed.; Kaneko, J.J., Harvey, J.W., Bruss, M.L., Eds.; Academic Press: San Diego, CA, USA, 2008; pp. 351–378. [Google Scholar]
- Harmon, D.L. Impact of nutrition on pancreatic exocrine and endocrine secretion in ruminants: A review. J. Anim. Sci. 1992, 70, 1290–1301. [Google Scholar] [CrossRef]
- Timbrell, N.E. The Role and Limitations of the Reference Interval Within Clinical Chemistry and Its Reliability for Disease Detection. Br. J. Biomed. Sci. 2024, 10, 12339. [Google Scholar] [CrossRef]
- Barakat, M.Z.; El-Guindi, M.M. Biochemical Analysis of Normal Goat Blood. Zbl. Vet. Med. Reihe A 1967, 14, 589–596. [Google Scholar] [CrossRef] [PubMed]
- Tahas, S.A.; Giadinis, N.D.; Kritsepi-Konstantinou, M.; Papadopoulos, E.; Petridou, E.J.; Posantzis, D.; Dovas, C.I. Assessment of some health parameters in West African Pygmy Goats and Cameroon Dwarf Sheep of a Zoo in Greece. J. Hell. Vet. Med. Soc. 2012, 63, 147–158. [Google Scholar] [CrossRef]
- Ribeiro, A.C.S.; da Conceição, Á.I.; Soares, G.S.L.; Correia, F.R.; de Oliveira-Filho, J.P.; Soares, P.C.; de Mendonça, C.L.; Afonso, J.A.B. Hemogasometry, cardiac biomarkers and blood metabolites in goats with experimentally induced acute ruminal lactic acidosis. Small Rumin. Res. 2020, 191, 106187. [Google Scholar] [CrossRef]
- Fartashvand, M.; Haji-Sadeghi, Y. Evaluation of serum cardiac biomarkers in sheep with acute lactic acidosis. J. Hell. Vet. Med. Soc. 2017, 68, 219–224. [Google Scholar] [CrossRef]
- Joshi, V.; Dimri, U.; Gopalakrishnan, A.; Ajith, Y.; Alam, S.; Gupta, V.K.; Raguvaran, R. Evaluation of oxidant-antioxidant status, serum cytokine levels and some cardiac injury biomarkers in acute ruminal lactic acidosis in goats. Small Rumin. Res. 2017, 149, 6–10. [Google Scholar] [CrossRef]
- Fernandez, J.M.; Sahlu, T.; Hart, S.P.; Potchoiba, M.J.; El Shaer, H.M.; Jacquemet, N.; Carneiro, H. Experimentally-induced subclinical hyperammonemia in dairy goats. Small Rumin. Res. 2001, 42, 5–20. [Google Scholar] [CrossRef]
- Antunović, Z.; Novaković, K.; Klir, Ž.; Šerić, V.; Mioč, B.; Šperanda, M.; Ronta, M.; Novoselec, J. Blood metabolic profile and acid-base status of Istrian goats—A critically endangered Croatian goat—In relation to age. Vet. Arhiv 2020, 90, 27–38. [Google Scholar] [CrossRef]
- Durak, M.H.; Erkan, R.E.C.; Ҫelik, R.; Yokuș, B.; Kurt, D.; Gürgöze, S. The effects of age and gender on some biochemical serum parameters in Zom sheep raised in the vicinity of Karacadağ. Isr. J. Vet. Med. 2015, 70, 33–39. [Google Scholar]
- Simesen, M.G. Calcium, Phosphorus, and Magnesium Metabolism. In Clinical Biochemistry of Domestic Animals, 3rd ed.; Kaneko, J.J., Ed.; Academic Press: San Diego, CA, USA, 1980; Volume 3, pp. 575–648. [Google Scholar]
- Palmisano, B.T.; Zhu, L.; Eckel, R.H.; Stafford, J.M. Sex Differences in Lipid and Lipoprotein Metabolism. Mol. Metab. 2018, 15, 45–55. [Google Scholar] [CrossRef]
- Khan, Z.H.; Samadi, S.; Sadeghi, M.; Alemohammad, M.G.; Zanjani, A.P.; Adine-Hashtjin, S.; Makarem, J. Prospective Study to Determine Possible Correlation Between Arterial and Venous Blood Gas Values. Acta Anaesthesiol. Taiwan. 2010, 48, 136–139. [Google Scholar] [CrossRef]
- Younger, J.; Falk, J.; Rothrock, S. Relationship between arterial and peripheral venous lactate levels. Acad. Emerg. Med. 1996, 3, 730–734. [Google Scholar] [CrossRef] [PubMed]
- Peinado, V.I.; Zabala, J.L.; Palomeque, J. Effect of captivity on the blood composition of Spanish ibex (Capra pyrenaica hispanica). Vet. Rec. 1995, 137, 588–591. [Google Scholar] [PubMed]
- Montané, J.; Marco, I.; López-Olvera, J.R.; Rossi, L.; Manteca, X.; Lavín, S. Effect of acepromazine on the signs of capture stress in captive and free-ranging roe deer (Capreolus capreolus). Vet. Rec. 2007, 160, 730–738. [Google Scholar] [CrossRef]
- Pérez, J.M.; Serrano, E.; Soriguer, R.C.; González, F.J.; Sarasa, M.; Granados, J.E.; Cano-Manuel, F.J.; Cuenca, R.; Fandos, P. Distinguishing disease effects from environmental effects in a mountain ungulate: Seasonal variation in body weight, hematology, and serum chemistry among Iberian ibex (Capra pyrenaica) affected by sarcoptic mange. J. Wildl. Dis. 2015, 51, 148–156. [Google Scholar] [CrossRef]
- Serrano, E.; González, F.J.; Granados, J.E.; Fandos, P.; Soriguer, R.C.; Pérez, J.M. The use of total serum proteins and triglycerides for monitoring body condition in the Iberian wild goat (Capra pyrenaica). J. Zoo. Wildl. Med. 2008, 39, 646–649. [Google Scholar] [CrossRef]
- Serrano, E.; Granados, J.E.; Sarasa, M.; González, F.J.; Fandos, P.; Soriguer, R.C.; Pérez, J.M. The effects of winter severity and population density on body stores in the Iberian wild goat (Capra pyrenaica) in a highly seasonal mountain environment. Eur. J. Wildl. Res. 2011, 57, 45–55. [Google Scholar] [CrossRef]
- Marco, I.; Viñas, L.; Velarde, R.; Pastor, J.; Lavín, S. Effects of capture and transport on blood parameters in free-ranging mouflon (Ovis ammon). J. Zoo. Wildl. Med. 1997, 28, 428–433. [Google Scholar]
- López-Olvera, J.R.; Marco, I.; Montané, J.; Lavín, S. Transport stress in Southern chamois (Rupicapra pyrenaica) and its modulation by acepromazine. Vet. J. 2006, 172, 347–355. [Google Scholar] [CrossRef]
- López-Olvera, J.R.; Marco, I.; Montané, J.; Casas-Díaz, E.; Lavín, S. Effects of acepromazine on the stress response in Southern chamois (Rupicapra pyrenaica) captured by means of drive-nets. Can. J. Vet. Res. 2007, 71, 41–51. [Google Scholar]
- Montané, J.; Marco, I.; López, J.; Perpinan, D.; Manteca, X.; Lavín, S. Effects of acepromazine on capture stress in roe deer (Capreolus capreolus). J. Wildl. Dis. 2003, 39, 375–386. [Google Scholar] [CrossRef]
- Angelucci, S.; Antonucci, A.; Di Tana, F.; Innocenti, M.; Di Domenico, G.; Madonna, L.; Smoglica, C.; Di Francesco, C.E.; López-Olvera, J.R. Welfare and clinical assessment on physical captures followed by anesthesia in Apennine chamois (Rupicapra pyrenaica ornata). Animals 2023, 13, 460. [Google Scholar] [CrossRef]
- Casas-Díaz, E.; Marco, I.; López-Olvera, J.R.; Mentaberre, G.; Lavín, S. Comparison of xylazine–ketamine and medetomidine–ketamine anaesthesia in the Iberian ibex (Capra pyrenaica). Eur. J. Wildl. Res. 2011, 57, 887–893. [Google Scholar] [CrossRef]

| Parameters | n | Mean ± SD | Median | Min | Max | Reference Interval | Lower Limit (90% CI) | Upper Limit (90% CI) |
|---|---|---|---|---|---|---|---|---|
| RBC (1012/L) | 68 | 11.41 ± 1.59 | 11.55 | 7.64 | 14.50 | 8.21–14.60 | 7.67–8.69 | 14.01–15.10 |
| Hemoglobin (g/L) | 68 | 105 ± 16 | 105 | 69 | 139 | 74–139 | 68–79 | 132–145 |
| Hematocrit (L/L) | 68 | 0.34 ± 0.05 | 0.34 | 0.25 | 0.44 | 0.25–0.45 | 0.23–0.27 | 0.43–0.46 |
| MCV (fL) | 68 | 30.4 ± 3.3 | 30.3 | 25.0 | 39.2 | 24.8–38.2 | 24.1–25.5 | 36.5–40.0 |
| MCH (pg) | 68 | 9.3 ± 1.0 | 9.2 | 7.5 | 11.6 | 7.2–11.4 | 6.9–7.5 | 11.0–11.8 |
| MCHC (g/L) | 61 | 307 ± 8 | 307 | 284 | 323 | 289–322 | 286–292 | 319–324 |
| RDW (%) | 63 | 17.1 ± 0.9 | 17.0 | 15.1 | 19.3 | 15.5–19.1 | 15.3–15.8 | 18.7–19.6 |
| WBC (109/L) | 66 | 6.1 ± 2.3 | 5.6 | 2.9 | 12.4 | 2.9–11.8 | 2.6–3.2 | 10.5–13.4 |
| Lymphocyte (%) | 67 | 38.6 ± 11.5 | 38.6 | 15.7 | 66.7 | 15.4–61.9 | 11.6–19.4 | 57.4–66.0 |
| Monocyte (%) | 62 | 0.5 ± 0.7 | 0.2 | 0 | 3.0 | 0–2.8 | 0–0 | 1.9–3.0 |
| Eosinophil (%) | 65 | 6.3 ± 4.4 | 6.1 | 0 | 15.3 | 0–14.3 | 0–0 | 13.4–15.3 |
| Granulocyte (%) | 66 | 53.8 ± 13.3 | 53.2 | 20.7 | 84.3 | 27.0–80.6 | 22.4–31.4 | 75.7–85.3 |
| Lymphocyte (109/L) | 67 | 2.3 ± 0.8 | 2.3 | 1.1 | 4.2 | 1.0–4.0 | 0.8–1.1 | 3.7–4.3 |
| Monocyte (109/L) | 64 | 0.03 ± 0.05 | 0 | 0 | 0.2 | 0–0.2 | 0–0 | 0.1–0.2 |
| Eosinophil (109/L) | 66 | 0.4 ± 0.3 | 0.4 | 0 | 1.1 | 0–1.0 | 0–0 | 0.8–1.1 |
| Granulocyte (109/L) | 64 | 3.3 ± 1.8 | 2.8 | 1.1 | 8.0 | 1.2–8.9 | 1.0–1.3 | 7.1–11.2 |
| Platelet (109/L) | 65 | 355 ± 116 | 340 | 159 | 666 | 180–627 | 167–198 | 562–686 |
| Plateletcrit (L/L) | 64 | 0.0017 ± 0.0010 | 0.0015 | 0.0006 | 0.0042 | 0.0006–0.0040 | 0.0006–0.0006 | 0.0034–0.0042 |
| MPV (fL) | 65 | 4.4 ± 1.5 | 4.3 | 2.3 | 7.8 | 2.4–7.7 | 2.3–2.6 | 7.4–7.8 |
| PDW (%) | 57 | 16.1 ± 1.0 | 16.2 | 13.6 | 18.0 | 13.8–17.9 | 13.3–14.4 | 17.6–18.2 |
| Parameters | n | Mean ± SD | Median | Min | Max | Reference Interval | Lower Limit (90% CI) | Upper Limit (90% CI) |
|---|---|---|---|---|---|---|---|---|
| Total protein (g/L) | 73 | 59 ± 5 | 59 | 48 | 70 | 49–68 | 48–51 | 67–70 |
| Albumin (g/L) | 71 | 35 ± 3 | 35 | 26 | 41 | 27–41 | 26–29 | 40–41 |
| Glucose (mmol/L) | 74 | 7.94 ± 2.89 | 8.05 | 2.77 | 14.21 | 2.44–13.98 | 1.66–3.27 | 12.93–15.04 |
| Triglyceride (mmol/L) | 69 | 0.05 ± 0.06 | 0.01 | 0.01 | 0.25 | 0.01–0.24 | 0.01–0.01 | 0.16–0.25 |
| T-Chol (mmol/L) | 72 | 0.96 ± 0.39 | 0.88 | 0.31 | 1.91 | 0.34–1.91 | 0.28–0.41 | 1.71–2.12 |
| HDL-Chol (mmol/L) | 70 | 0.83 ± 0.36 | 0.80 | 0.23 | 1.60 | 0.26–1.63 | 0.21–0.34 | 1.45–1.78 |
| AST (U/L) | 68 | 127 ± 41 | 117 | 62 | 247 | 69–236 | 64–76 | 206–269 |
| ALT (U/L) | 72 | 59 ± 15 | 57 | 30 | 100 | 34–94 | 31–37 | 87–101 |
| ALP (U/L) | 64 | 469 ± 170 | 414 | 238 | 904 | 235–904 | 214–259 | 786–1038 |
| GGT (U/L) | 72 | 216 ± 66 | 205 | 92 | 366 | 96–356 | 82–112 | 330–382 |
| LDH (U/L) | 66 | 549 ± 136 | 542 | 295 | 840 | 276–824 | 223–331 | 779–872 |
| CPK (U/L) | 55 | 338 ± 173 | 319 | 135 | 852 | 117–767 | 105–139 | 639–890 |
| CK-MB (U/L) | 55 | 153 ± 58 | 144 | 47 | 292 | 37–272 | 12–60 | 248–293 |
| Amylase (U/L) | 71 | 152 ± 62 | 146 | 30 | 289 | 41–286 | 25–56 | 261–313 |
| Lipase (U/L) | 13 | 49 ± 8 | 50 | 39 | 62 | 32–68 | 26–68 | 60–76 |
| T-bil (μmol/L) | 69 | 8.55 ± 8.55 | 6.84 | 1.71 | 32.49 | 1.71–32.49 | 1.71–3.42 | 27.36–32.49 |
| D-bil (μmol/L) | 69 | 3.42 ± 3.42 | 1.71 | 1.71 | 13.68 | 1.71–11.97 | 1.71–1.71 | 11.97–13.68 |
| BUN (mmol/L) | 73 | 8.85 ± 3.11 | 8.57 | 2.25 | 16.53 | 2.64–15.07 | 1.71–3.61 | 14.03–16.03 |
| Creatinine (μmol/L) | 69 | 114.9 ± 26.5 | 106.1 | 53.0 | 176.8 | 53.0–168.0 | 44.2–61.9 | 159.1–185.6 |
| Uric acid (μmol/L) | 71 | 17.84 ± 5.95 | 17.84 | 11.90 | 23.79 | 11.90–23.79 | 11.90–11.90 | 23.79–23.79 |
| NH3 (μmol/L) | 63 | 5.90 ± 3.28 | 4.70 | 1.88 | 15.41 | 1.71–14.52 | 1.53–2.06 | 12.11–16.58 |
| Ca (mmol/L) | 74 | 2.27 ± 0.23 | 2.25 | 1.68 | 2.70 | 1.80–2.73 | 1.73–1.90 | 2.65–2.80 |
| IP (mmol/L) | 69 | 1.42 ± 0.61 | 1.35 | 0.42 | 3.16 | 0.45–2.84 | 0.39–0.58 | 2.52–3.19 |
| Mg (mmol/L) | 72 | 1.19 ± 0.21 | 1.19 | 0.70 | 1.81 | 0.86–1.65 | 0.78–1.19 | 1.56–1.77 |
| Na (mmol/L) | 75 | 141 ± 6 | 141 | 127 | 155 | 131–153 | 129–132 | 151–156 |
| K (mmol/L) | 74 | 4.8 ± 0.8 | 4.8 | 3.1 | 6.7 | 3.2–6.4 | 2.9–3.4 | 6.2–6.7 |
| Cl (mmol/L) | 75 | 100 ± 7 | 99 | 80 | 116 | 86–115 | 84–89 | 112–118 |
| Parameters | n | Mean ± SD | Median | Min | Max | Reference Interval | Lower Limit (90% CI) | Upper Limit (90% CI) |
|---|---|---|---|---|---|---|---|---|
| pH | 32 | 7.35 ± 0.05 | 7.36 | 7.24 | 7.45 | 7.24–7.46 | 7.21–7.26 | 7.43–7.49 |
| pCO2 (kPa) | 32 | 7.13 ± 1.07 | 6.93 | 5.32 | 9.97 | 5.36–9.81 | 5.07–5.72 | 8.96–10.74 |
| pO2 (kPa) | 30 | 9.30 ± 2.08 | 8.73 | 6.97 | 15.68 | 6.93–15.66 | 6.77–7.18 | 12.96–19.00 |
| HCO3 (mmol/L) | 32 | 28.8 ± 2.8 | 28.7 | 25.1 | 35.5 | 24.9–35.5 | 24.2–25.7 | 33.0–38.6 |
| BEecf (mmol/L) | 32 | 3.5 ± 2.7 | 3.4 | −2.1 | 10.5 | −1.7–9.3 | −2.7–−0.4 | 7.6–10.7 |
| SO2 (%) | 32 | 89.9 ± 5.5 | 90.4 | 81.7 | 99.4 | 78.5–100.0 | 75.4–81.2 | 98.7–104.2 |
| TCO2 (mmol/L) | 31 | 30.1 ± 2.3 | 29.9 | 26.8 | 35.6 | 27.0–38.8 | 26.8–27.2 | 35.6–43.2 |
| AnGap | 29 | 8 ± 4 | 9 | −2 | 16 | 0–17 | −2–2 | 14–19 |
| Lactate (mmol/L) | 29 | 0.65 ± 0.28 | 0.60 | 0.30 | 1.24 | 0.25–1.49 | 0.20–0.31 | 1.16–1.93 |
| Parameters | n | Mean ± SD | Median | Min | Max | Reference Interval | Lower Limit (90% CI) | Upper Limit (90% CI) |
|---|---|---|---|---|---|---|---|---|
| pH | 32 | 7.34 ± 0.06 | 7.34 | 7.21 | 7.47 | 7.22–7.47 | 7.19–7.25 | 7.44–7.51 |
| pCO2 (kPa) | 32 | 6.85 ± 0.97 | 6.86 | 4.76 | 8.92 | 4.93–8.96 | 4.48–5.43 | 8.44–9.54 |
| pO2 (kPa) | 32 | 5.37 ± 1.17 | 5.01 | 3.45 | 8.10 | 4.80–8.37 | 3.20–3.79 | 7.36–9.45 |
| cHCO3 (mmol/L) | 32 | 27.7 ± 3.8 | 27.8 | 20.6 | 36.8 | 20.2–35.9 | 18.4–22.0 | 33.7–37.9 |
| BEecf (mmol/L) | 32 | 2.1 ± 4.4 | 2.6 | −6.4 | 11.9 | −6.9–11.1 | −9.2–−4.6 | 8.9–13.5 |
| SO2 (%) | 32 | 67.7 ± 12.4 | 65.9 | 45.0 | 90.6 | 42.1–93.4 | 36.5–48.8 | 87.7–99.1 |
| TCO2 (mmol/L) | 32 | 28.9 ± 3.5 | 29.1 | 22.0 | 35.7 | 21.7–36.2 | 20.0–23.6 | 34.3–37.9 |
| AnGap | 32 | 10 ± 6 | 11 | −3 | 17 | −2–21 | −5–1 | 18–24 |
| Lactate (mmol/L) | 31 | 2.50 ± 1.68 | 2.16 | 0.47 | 5.94 | 0–7.03 | −0.33–0.40 | 5.39–8.90 |
| Parameters | Young (<3 y) | Adult (≥3 y) | Statistical Significance * | ||||
|---|---|---|---|---|---|---|---|
| n | Mean ± SD | RI | n | Mean ± SD | RI | ||
| MCV (fL) | 17 | 29.0 ± 3.6 | 19.1–35.8 | 42 | 31.4 ± 3.0 | 24.7–37.2 | ++ |
| MCH (pg) | 17 | 8.7 ± 1.1 | 7.4–13.4 | 42 | 9.6 ± 1.0 | 7.2–11.2 | ++ |
| Lymphocyte (109/L) | 17 | 2.7 ± 0.9 | 0.9–4.7 | 41 | 2.0 ± 0.6 | 0.9–3.3 | ++ |
| Platelet (109/L) | 14 | 400 ± 127 | 165–720 | 42 | 317 ± 96 | 182–578 | + |
| Plateletcrit (L/L) | 13 | 0.0018 ± 0.0008 | 0.0005–0.0042 | 42 | 0.0014 ± 0.0008 | 0.0005–0.0049 | + |
| T-Chol (mmol/L) | 14 | 1.24 ± 0.36 | 0.47–2.04 | 48 | 0.88 ± 0.39 | 0.31–1.89 | ++ |
| HDL-Chol (mmol/L) | 14 | 1.09 ± 0.31 | 0.59–2.09 | 46 | 0.75 ± 0.36 | 0.23–1.68 | ++ |
| ALP (U/L) | 8 | 762 ± 152 | 403–1283 | 46 | 418 ± 122 | 222–704 | ++ |
| LDH (U/L) | 12 | 613 ± 139 | 295–931 | 46 | 529 ± 125 | 313–818 | + |
| Amylase (U/L) | 14 | 115 ± 33 | 41–190 | 48 | 165 ± 64 | 35–295 | ++ |
| Creatinine (μmol/L) | 13 | 88.4 ± 26.5 | 44.2–168.0 | 49 | 114.9 ± 26.5 | 53.0–176.8 | ++ |
| Ca (mmol/L) | 13 | 2.42 ± 0.17 | 2.10–2.90 | 51 | 2.23 ± 0.23 | 1.77–2.65 | ++ |
| IP (mmol/L) | 14 | 1.94 ± 0.48 | 1.00–3.23 | 46 | 1.26 ± 0.58 | 0.45–2.90 | ++ |
| Parameters | Adult Male | Adult Female | Statistical Significance ** | ||||
|---|---|---|---|---|---|---|---|
| n | Mean ± SD | RI | n | Mean ± SD | RI | ||
| RBC (1012/L) | 27 | 11.57 ± 1.73 | 6.89–14.52 | 15 | 10.55 ± 1.64 | 7.17–14.41 | + |
| WBC (109/L) | 26 | 5.3 ± 2.3 | 2.5–11.8 | 15 | 6.5 ± 2.6 | * | + |
| Lymphocyte (109/L) | 26 | 1.8 ± 0.5 | 0.9–3.0 | 15 | 2.4 ± 0.6 | 1.1–3.6 | ++ |
| T-Chol (mmol/L) | 31 | 0.67 ± 0.21 | 0.28–1.16 | 17 | 1.22 ± 0.39 | 0.39–2.07 | ++ |
| HDL-Chol (mmol/L) | 29 | 0.59 ± 0.23 | 0.21–1.11 | 17 | 1.06 ± 0.34 | 0.31–1.81 | ++ |
| ALT (U/L) | 32 | 62 ± 13 | 41–95 | 17 | 49 ± 10 | 28–72 | ++ |
| GGT (U/L) | 32 | 233 ± 62 | 126–379 | 18 | 189 ± 61 | 71–337 | + |
| Amylase (U/L) | 31 | 187 ± 59 | 64–309 | 17 | 126 ± 54 | 16–251 | ++ |
| Parameters | Arterial Blood | Venous Blood | Statistical Significance * | ||
|---|---|---|---|---|---|
| n | Mean ± SD | n | Mean ± SD | ||
| pO2 (kPa) | 30 | 9.30 ± 2.08 | 32 | 5.37 ± 1.17 | ++ |
| SO2 (%) | 32 | 89.9 ± 5.5 | 32 | 67.7 ± 12.4 | ++ |
| Lactate (mmol/L) | 29 | 0.65 ± 0.28 | 31 | 2.50 ± 1.68 | ++ |
Disclaimer/Publisher’s Note: The statements, opinions and data contained in all publications are solely those of the individual author(s) and contributor(s) and not of MDPI and/or the editor(s). MDPI and/or the editor(s) disclaim responsibility for any injury to people or property resulting from any ideas, methods, instructions or products referred to in the content. |
© 2025 by the authors. Licensee MDPI, Basel, Switzerland. This article is an open access article distributed under the terms and conditions of the Creative Commons Attribution (CC BY) license (https://creativecommons.org/licenses/by/4.0/).
Share and Cite
Im, O.; Lee, S.-J.; Kim, H.-C.; Yang, J.-J.; Son, J.-I.; Yang, D.-H.; Jeong, D.-H. Hematology, Biochemistry, and Blood Gas Reference Intervals for Captive Anesthetized Long-Tailed Goral (Naemorhedus caudatus). Animals 2025, 15, 1216. https://doi.org/10.3390/ani15091216
Im O, Lee S-J, Kim H-C, Yang J-J, Son J-I, Yang D-H, Jeong D-H. Hematology, Biochemistry, and Blood Gas Reference Intervals for Captive Anesthetized Long-Tailed Goral (Naemorhedus caudatus). Animals. 2025; 15(9):1216. https://doi.org/10.3390/ani15091216
Chicago/Turabian StyleIm, Ockju, Suk-Jin Lee, Hong-Cheol Kim, Jeong-Jin Yang, Jang-Ik Son, Doo-Ha Yang, and Dong-Hyuk Jeong. 2025. "Hematology, Biochemistry, and Blood Gas Reference Intervals for Captive Anesthetized Long-Tailed Goral (Naemorhedus caudatus)" Animals 15, no. 9: 1216. https://doi.org/10.3390/ani15091216
APA StyleIm, O., Lee, S.-J., Kim, H.-C., Yang, J.-J., Son, J.-I., Yang, D.-H., & Jeong, D.-H. (2025). Hematology, Biochemistry, and Blood Gas Reference Intervals for Captive Anesthetized Long-Tailed Goral (Naemorhedus caudatus). Animals, 15(9), 1216. https://doi.org/10.3390/ani15091216