
Application of Environmental DNA for Assessing the Distribution and Biomass of Brachymystax lenok Tsinlingensis in the Zhouzhi Heihe River

 ,
,
Simple Summary
Abstract
1. Introduction
2. Materials and Methods
2.1. Water Sample Collection and Environmental DNA Extraction
2.1.1. Culture Tank Experiments
2.1.2. Field Experiments
2.1.3. Environmental DNA Extraction
2.2. Establishment of qPCR Assay
3. Results
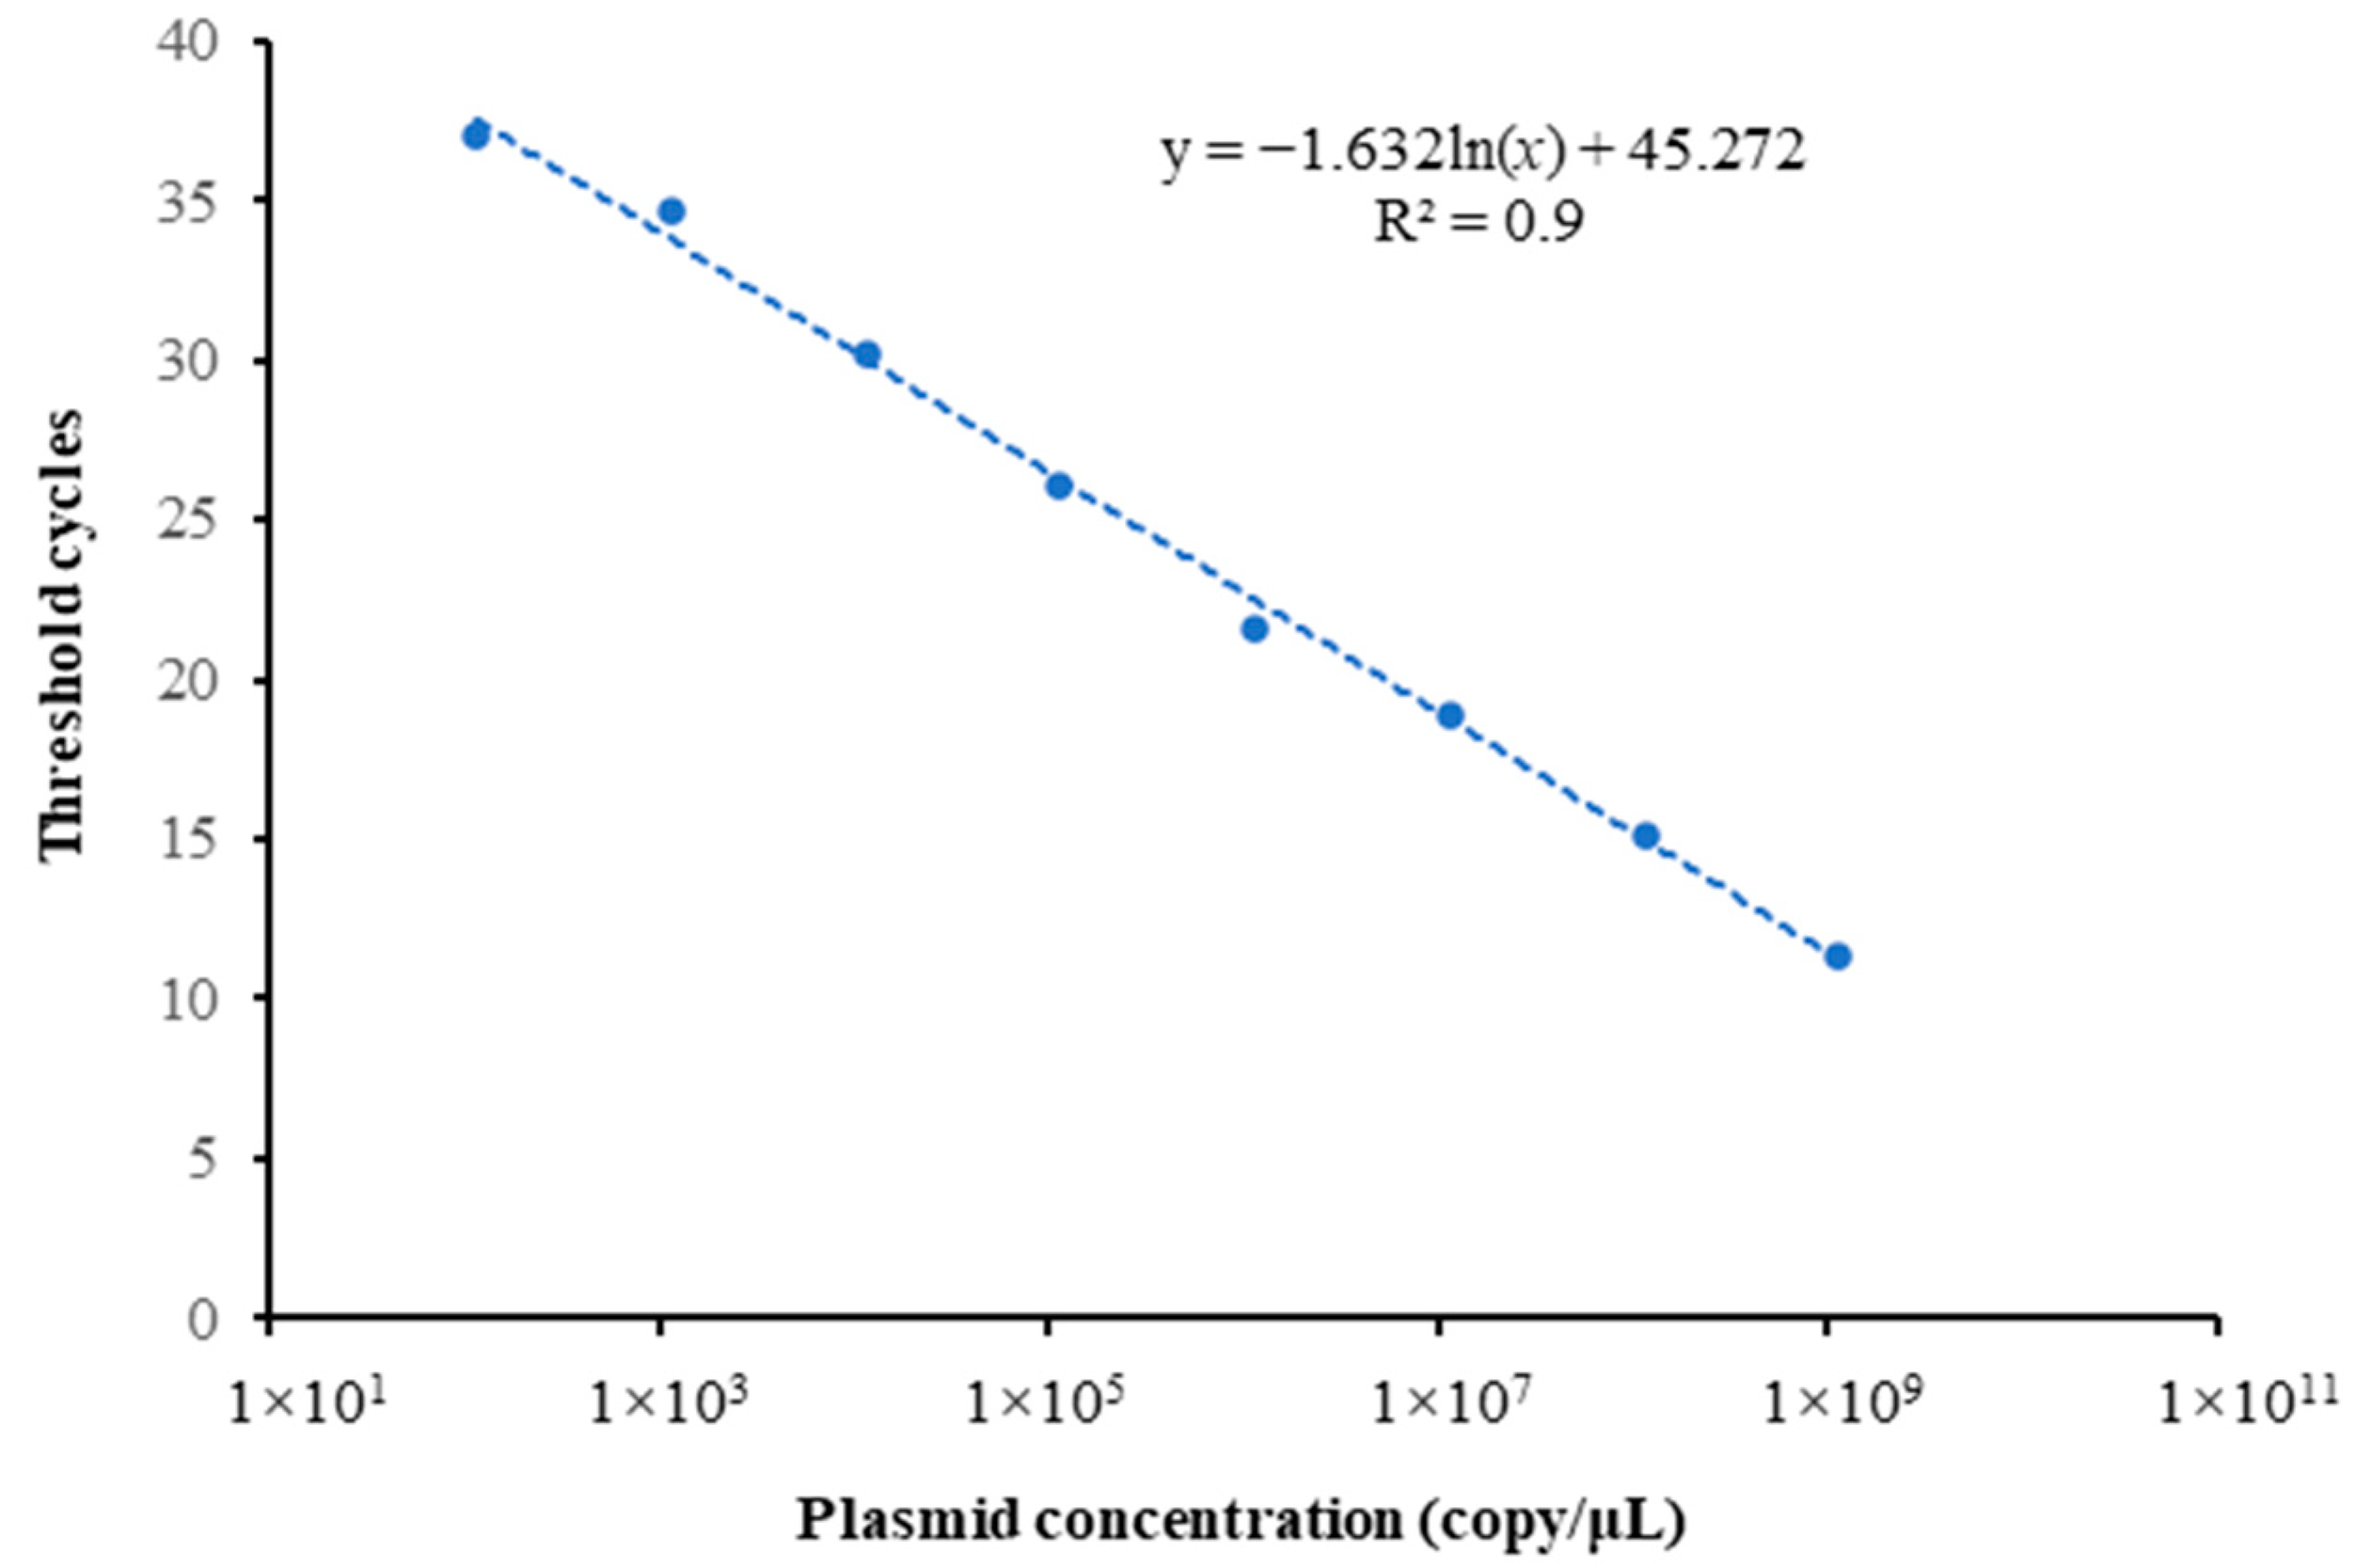
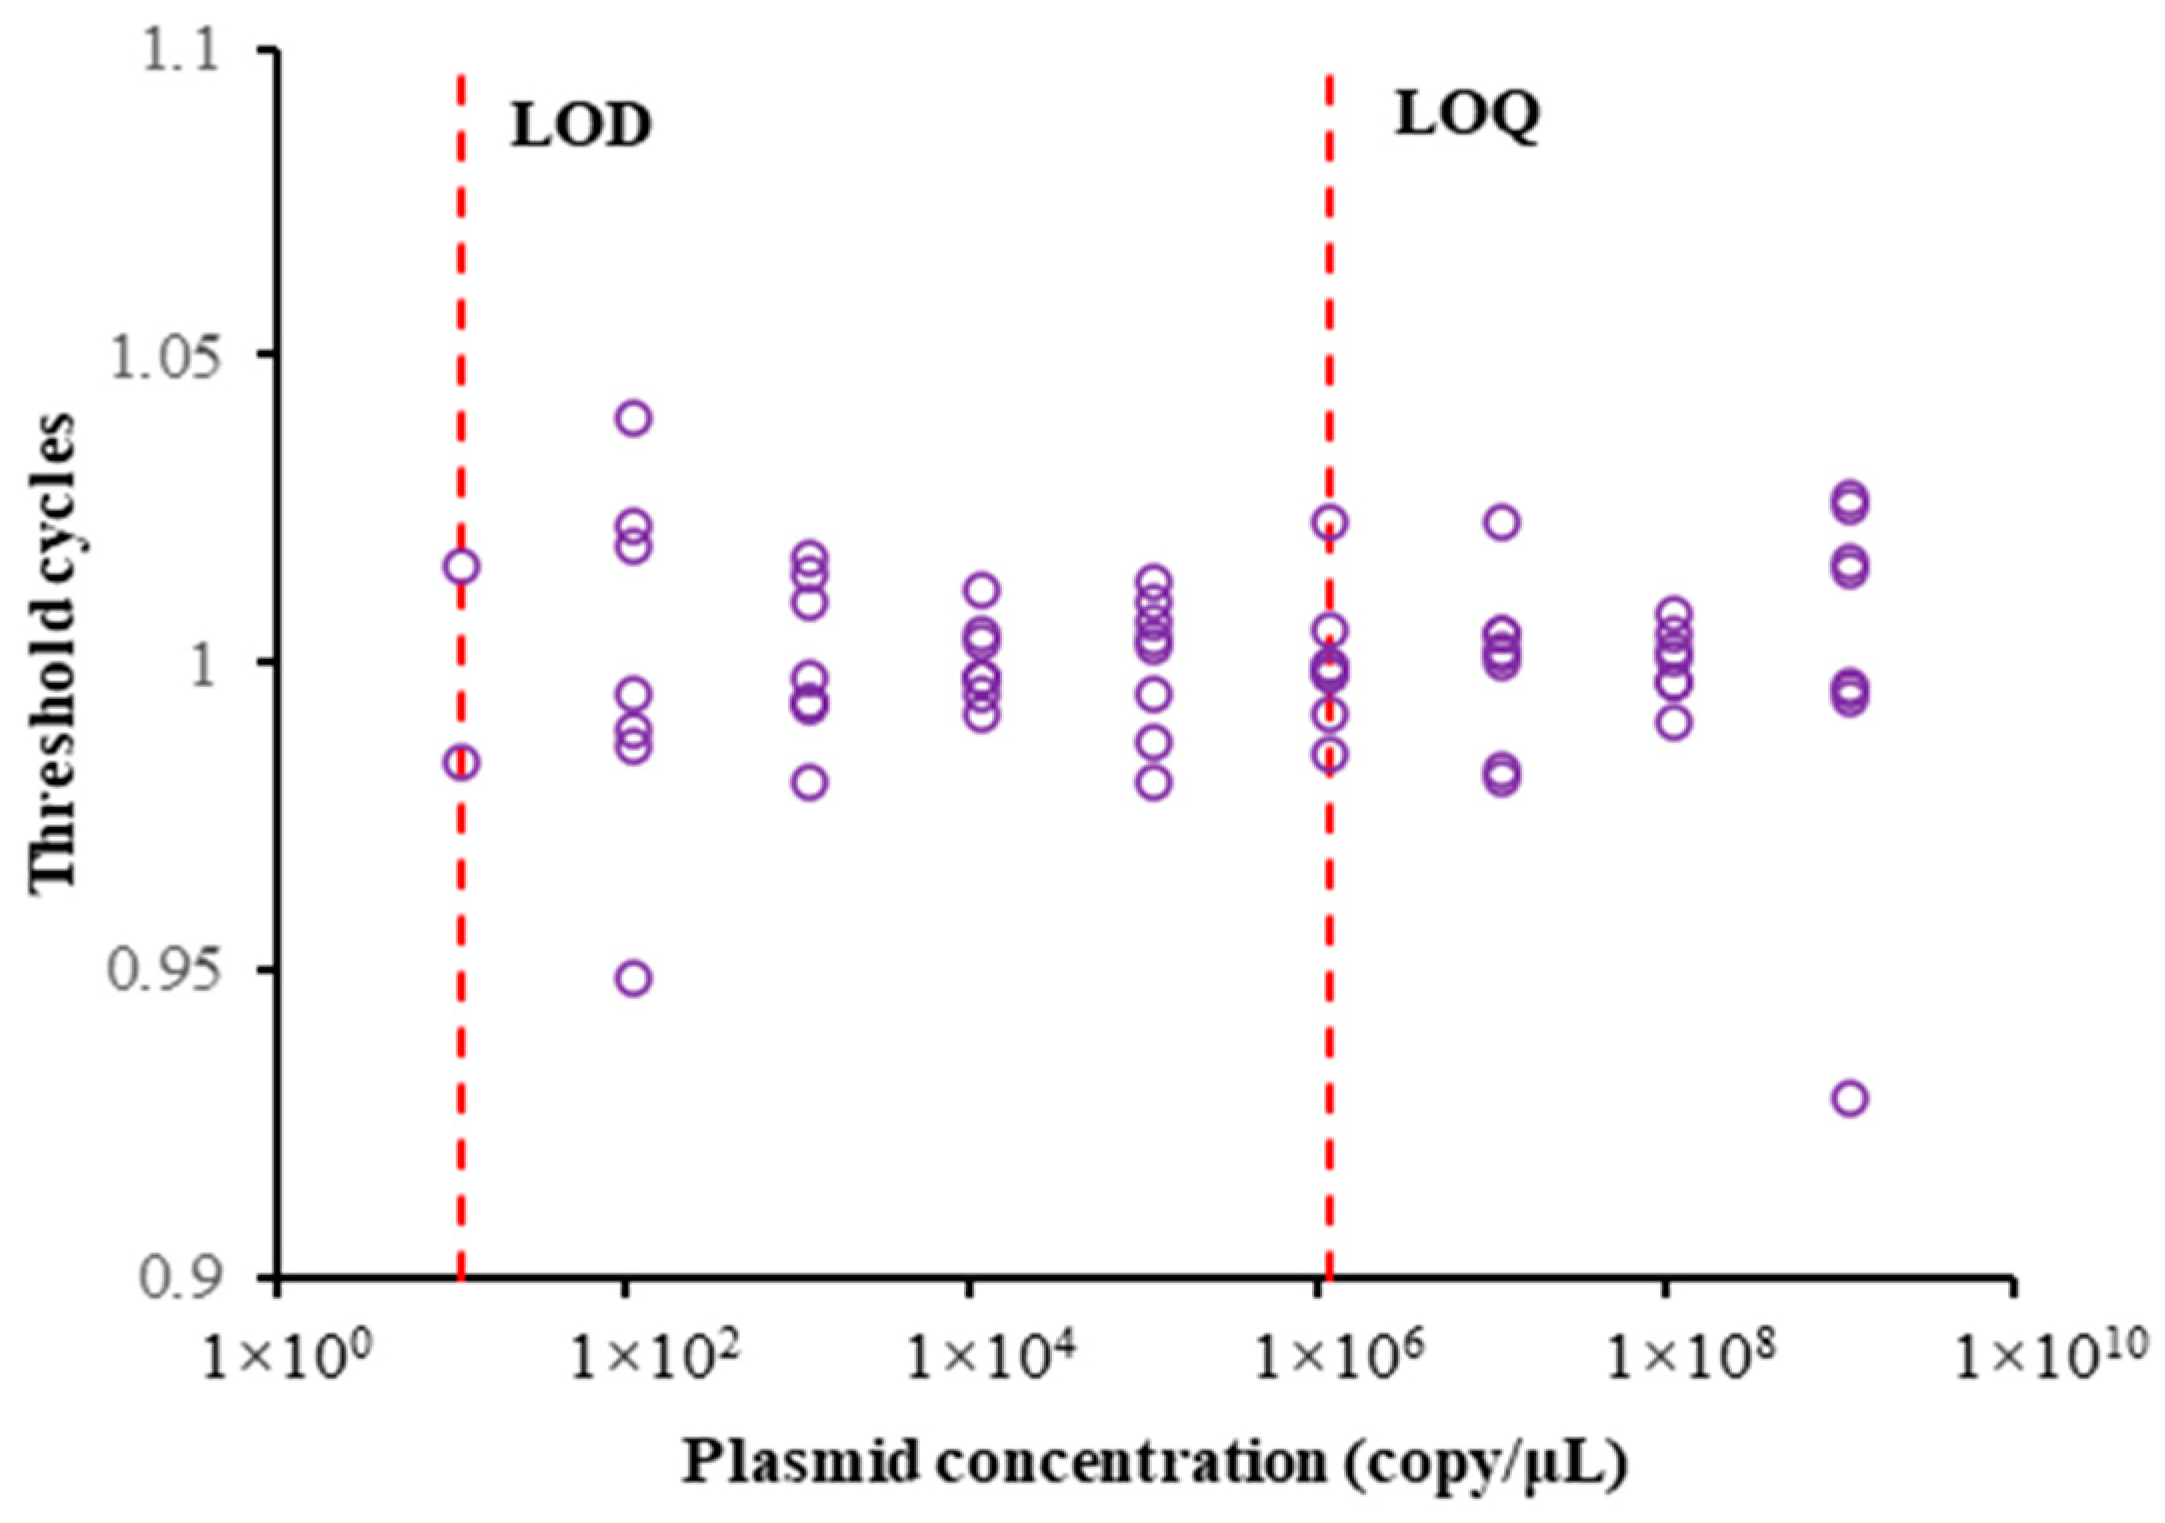
3.1. Results of Preparation of Standard Curve and LOD and LOQ Values
3.2. Results of Water Sample Experiment in Culture Tank
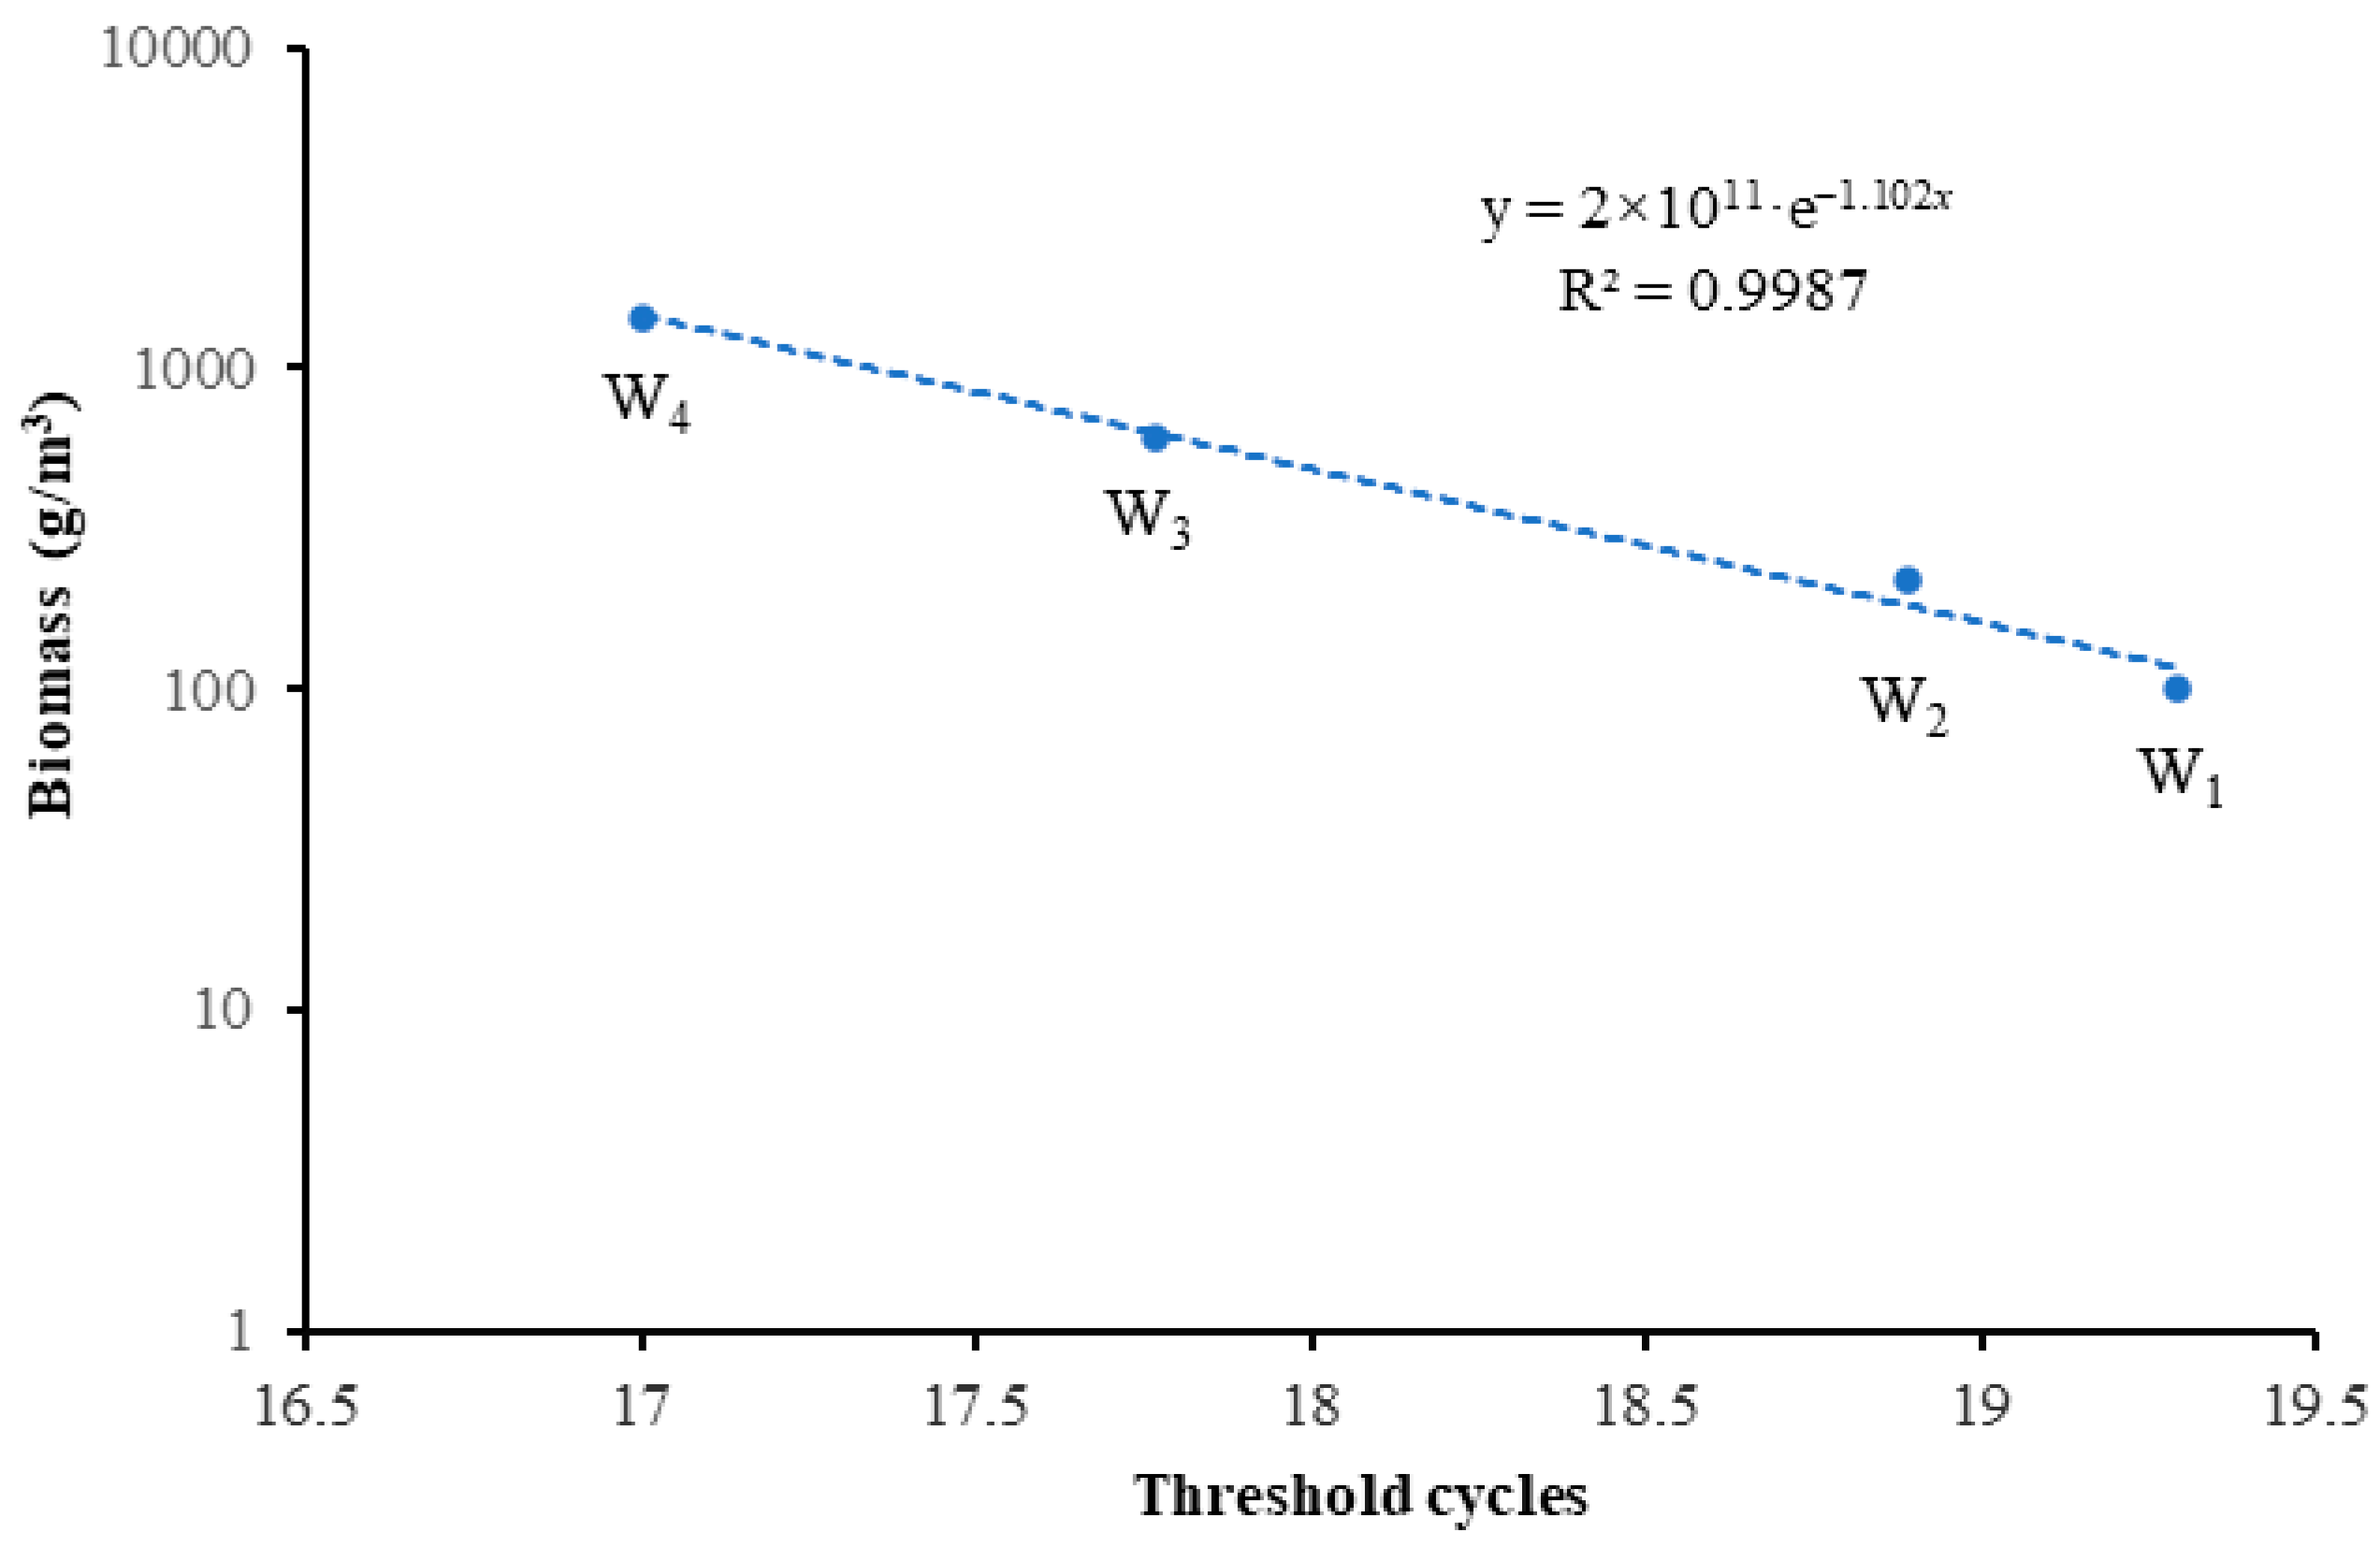
3.3. Estimated B. lenok Tsinlingensis Biomass in the Zhouzhi Heihe River
4. Discussion
5. Conclusions
Supplementary Materials
Author Contributions
Funding
Institutional Review Board Statement
Informed Consent Statement
Data Availability Statement
Conflicts of Interest
References
- Tao, Y.Z.; Wang, L.Y.; Huang, Q.F.; Deng, C.K.; Chen, F.G.; Xia, J.G. Distribution patterns and habitat environment characteristics of Brachymystax tsinlingensis larval fish. Acta. Hydrobiol. Sin. 2024, 48, 1–9. [Google Scholar]
- Ferreira, C.E.L.; Goncçalves, J.E.A.; Coutinho, R. Community structure of fishes and habitat complexity on a tropical rocky shore. Environ. Biol. Fish. 2001, 61, 353–369. [Google Scholar] [CrossRef]
- Song, C.; Liu, Y.Y.; Lv, Y.; Zhao, F.; Yang, G.; Zhang, T.T.; Zhuang, P. Distribution of Salanx ariakensis larvae in the Yangtze estuary and its relationship with environmental factors. Mar. Fish. 2015, 37, 318–324. [Google Scholar]
- Li, M.; Chen, X.Y. Advances in the application of environmental DNA technology in fish ecology. Acta. Ecol. Sin. 2023, 43, 6951–6967. [Google Scholar]
- Elsa, F.; Sergey, A.; Paulo, A.; Steven, W. The evolutionary history of sharp- and blunt-snouted lenok (Brachymystax lenok (Pallas, 1773)) and its implications for the paleo-hydrological history of Siberia. BMC Evol. Biol. 2008, 8, 1–18. [Google Scholar]
- Kaus, A.; Schäffer, M.; Michalski, S.; Pitsch, M.; Karthe, D.; Borchardt, B. Morphological and genetic assessment of sympatric lenok species (Brachymystax spp.) in the Onon river, Mongolia. Mong. J. Biol. Sci. 2023, 21, 3–14. [Google Scholar]
- Lim, D.H.; Lee, Y.J. Fish fauna and the population of a Korean endangered freshwater fish, Brachymystax lenok tsinlingensis, in Korea: Bonghwa Habitat. Environ. Eng. Res. 2019, 24, 638–645. [Google Scholar] [CrossRef]
- Si, S.J.; Wang, Y.; Xu, G.F.; Yang, S.Y.; Mou, Z.B.; Song, Z.B. Complete mitochondrial genomes of two lenoks, Brachymystax lenok and Brachymystax lenok tsinlingensis. Mitochondrial DNA 2012, 23, 338–340. [Google Scholar] [CrossRef]
- Li, S.Z. Study on the distribution of the salmonid fishes in China. J. Zool. 1984, 3, 34–37. [Google Scholar]
- Sun, S.L.; Fang, S.M. Studies on the subspecies of Brachymystax lenok tsinlingensis, China. J. Lanzhou Univ. 1984, 20, 92–95. [Google Scholar]
- Xia, Y.Z.; Sheng, Y.; Chen, Y.Y. DNA sequence variation in the mitochondrial control region of lenok (Brachymystax lenok) populations in China. Biod. Sci. 2006, 14, 48–54. [Google Scholar]
- Xing, Y.C.; Lv, B.B.; Ye, E.Q.; Fan, E.Y.; Li, S.Y.; Wang, L.X.; Zhang, C.G.; Zhao, Y.H. Revalidation and redescription of Brachymystax tsinlingensis Li, 1966 (Salmoniformes: Salmonidae) from China. Zootaxa 2015, 3962, 191–205. [Google Scholar] [CrossRef]
- Meng, Y.X.; Wang, G.H.; Xiong, D.M.; Liu, H.X.; Liu, X.L.; Wang, L.X.; Zhang, J.L. Geometric morphometric analysis of the morphological variation among three lenoks of genus Brachymystax in China. Pak. J. Zool. 2018, 50, 885–895. [Google Scholar]
- Huang, L.; Ye, H.; Yue, H.; Leng, X.; Ruan, R.; Du, H.; Li, C.; Wu, J. Comparative transcriptome analysis reveals sexually dimorphic gene expression in the gonads of Brachymystax tsinlingensis Li. Animals 2023, 13, 3690. [Google Scholar] [CrossRef]
- Wu, J.M.; Yang, H.C.; Shao, J.; Du, H.; Wang, C.Y.; Wei, Q.W. Habitat environmental characteristics of Barchumystax lenok tsinlingensis. Acta. Hydrobiol. Sin. 2017, 41, 214–219. [Google Scholar]
- Song, R.; Wang, Z.; Lin, S.; Guo, X.; Wang, Y.; Zhang, L.; Ye, H.; Shao, J. Intestinal tissue, digestive enzyme, and antioxidant enzyme activities in the early development stage of endangered Brachymystax tsinlingensis. Animals 2024, 14, 3042. [Google Scholar] [CrossRef]
- Ren, J.; Liang, G. Resource survey report of Brachymystax lenok tsinlingensi in Qianhe river valleys of Qinling mountains. J. Shaanxi Norm. Univ. 2004, 32, 65–68. [Google Scholar]
- Zhu, W.B.; Wang, Z.K.; Li, H.R.; Li, P.; Ni, L.L.; Jiao, L.; Ren, Y.D.; You, P. A chromosome-level genome of Brachymystax tsinlingensis provides resources and insights into salmonids evolution. G3 2022, 12, jkac162. [Google Scholar]
- Zhao, Y.H.; Zhang, C.G. Threatened fishes of the world: Brachymystax lenok tsinlingensis Li, 1966 (Salmonidae). Environ. Biol. Fish. 2009, 86, 11–12. [Google Scholar]
- Liu, H.X.; Li, Y.; Liu, X.L. Isolation and characterization of eleven novel microsatellite loci of Brachymystax lenok tsinlingensis, a threatened fish endemic to Shaanxi, China. Conserv. Genet. Resour. 2013, 5, 389–391. [Google Scholar]
- Xiong, D.M.; Shao, J.; Luo, W.; Jiang, H.B.; Wang, F.; Lu, B. The complete mitochondrial genome of the Brachymystax tsinlingensis Li. Mitochondrial DNA Part B 2019, 4, 282–283. [Google Scholar]
- Guo, W.; Shao, J.; Li, P.; Wu, J.M.; Wei, Q.W. Morphology and ultrastructure of Brachymystax lenok tsinlingensis spermatozoa by scanning and transmission electron microscopy. Tissue Cell 2016, 48, 321–327. [Google Scholar]
- Shao, J.; Luo, W.; Wei, Q.W.; Wang, F.; Guo, W.; Ye, H.; Chu, Z.P.; Wu, J.M.; Zhang, S.H. Assignment of parentage by microsatellite analysis in the endangered Brachymystax lenok tsinlingensis (Salmonidae). Aquat. Biol. 2017, 26, 69–73. [Google Scholar]
- Xia, J.G.; Ma, Y.J.; Fu, C.; Fu, S.J.; Cooke, S.J. Effects of temperature acclimation on the critical thermal limits and swimming performance of Brachymystax lenok tsinlingensis: A threatened fish in Qinling mountain region of China. Ecol. Res. 2017, 32, 61–70. [Google Scholar]
- Li, P.; Liu, Q.; Li, J.; Wang, F.; Wen, S.; Li, N. Transcriptomic responses to heat stress in gill and liver of endangered Brachymystax lenok tsinlingensis. Comp. Biochem. Physiol. Part D Genom. Proteom. 2021, 38, 100791. [Google Scholar]
- Zhao, A.N.; Xiao, B. Study on the development and protection of biodiversity in Heihe river wetland. Shaanxi For. Sci. Technol. 2007, 2, 31–34. [Google Scholar]
- Zhang, J.L.; Bian, K.; Jin, T.Z.; Gou, N.N.; Shen, H.B.; Zhang, J.Y.; Wang, K.F.; Ding, Q.Z. Investigation on status of fish resources in Qinling Heihe river basin. Freshw. Fish 2016, 46, 103–108. [Google Scholar]
- Ma, H.Y.; Zhang, H.; Deng, J.; Zhao, H.; Kong, F.; Jiang, W.; Zhang, H.X.; Wang, Q.J. Establishment of analysis method for environment DNA of Batrachuperus from water samples. J. Anhui Agric. Univ. 2021, 48, 784–789. [Google Scholar]
- Plough, L.V.; Ogburn, M.B.; Fitzgerald, C.L.; Getnio, R.; Marafino, G.A.; Richie, K.D. Environmental DNA analysis of river herring in Chesapeake bay: A powerful tool for monitoring threatened keystone species. PLoS ONE 2018, 13, e0205578. [Google Scholar]
- Czeglédi, I.; Sály, P.; Specziár, A.; Preiszner, B.; Szaloky, Z.; Maroda, A.; Pont, D.; Meulenbroek, P.; Valentini, A.; Eros, T. Congruency between two traditional and eDNA-based sampling methods in characterising taxonomic and trait-based structure of fish communities and community-environment relationships in lentic environment. Ecol. Indic. 2021, 129, 107952. [Google Scholar]
- Klymus, K.E.; Merkes, C.M.; Allison, M.J.; Goldberg, C.; Helbing, C.C.; Hunter, M.E.; Jackson, C.A.; Lance, R.F.; Mangan, A.M.; Monroe, E.M.; et al. Reporting the limits of detection and quantification for environmental DNA assays. Environ. DNA 2020, 2, 271–282. [Google Scholar] [CrossRef]
- Dejean, T.; Valentini, A.; Duparc, A.; Pellier-Cuit, S.; Pompanon, F.; Taberlet, P.; Miaud, C. Persistence of environmental DNA in freshwater ecosystems. PLoS ONE 2011, 6, e23398. [Google Scholar] [CrossRef] [PubMed]
- Takahara, T.; Minamoto, T.; Yamanaka, H.; Doi, H.; Kawabata, Z. Estimation of fish biomass using environmental DNA. PLoS ONE 2012, 7, e35868. [Google Scholar] [CrossRef]
- Yan, H.G.; Dong, Z.L.; Ma, T.T.; Zhang, L.B.; Wang, X.Y.; Ye, H.; Yao, W.Z.; He, W.P. Detection and biomass assessment of Procypris rabaudi based on environmental DNA. J. Fish China 2022, 46, 1018–1026. [Google Scholar]
- Gao, T.X.; Chen, Z.; Wang, X.Y.; Zhang, H.B.; Shi, H.L. Correlation between the density of cultured Sebastiscus marmoratus and its environmental DNA. Acta. Hydrobiol. Sin. 2022, 7, 1007–1015. [Google Scholar]
- Gao, T.X.; Zhang, H.B.; Wang, X.Y.; Chen, Z. Qualitative and quantitative analysis of Platyrhina sinensis based on eDNA methods in Zhoushan offshore. J. Fish. China 2024, 48, 039311. [Google Scholar]
- Wilcox, T.M.; McKelvey, K.S.; Young, M.K.; Jane, S.F.; Lowe, W.H.; Whiteley, A.R.; Schwartz, M.K. Robust detection of rare species using environmental DNA: The importance of primer specificity. PLoS ONE 2013, 8, e59520. [Google Scholar] [CrossRef]
- Honda, K.; Kagiwada, H.; Tojo, N.; Miyashita, K. Riverine environmental characteristics and seasonal habitat use by adult Sakhalin taimen Hucho perryi. J. Fish. Biol. 2010, 77, 1526–1541. [Google Scholar]
- Tillotson, M.D.; Kelly, R.P.; Duda, J.J.; Hoy, M.; Kralj, J.; Quinn, T.P. Concentrations of environmental DNA (eDNA)reflect spawning salmon abundance at fine spatial and temporal scales. Biol. Conserv. 2018, 220, 1–11. [Google Scholar] [CrossRef]
- Maruyama, A.; Nakamura, K.; Yamanaka, H.; Kondoh, M.; Minamoto, T. The release rate of environmental DNA from juvenile and adult fish. PLoS ONE 2014, 9, e114639. [Google Scholar]
- Pilliod, D.S.; Goldberg, C.S.; Arkle, R.S.; Waits, L.P. Estimating occupancy and abundance of stream amphibians using environmental DNA from filtered water samples. Can. J. Fish. Aquat. Sci. 2013, 70, 1123–1130. [Google Scholar]
- Yates, M.C.; Glaser, D.M.; Post, J.R.; Cristescu, M.E.; Fraser, D.J.; Derry, A.M. The relationship between eDNA particle concentration and organism abundance in nature is strengthened by allometric scaling. Mol. Ecol. 2021, 30, 3068–3082. [Google Scholar] [PubMed]
- Yamamoto, S.; Minami, K.; Fukaya, K.; Takahashi, K.; Sawada, H.; Murakami, H.; Tsuji, S.; Hashizume, H.; Kubonage, S.; Horiuchi, T.; et al. Correction: Environmental DNA as a ‘snapshot’ of fish distribution: A case study of Japanese jack mackerel in Maizuru bay, sea of Japan. PLoS ONE 2016, 11, e0153291. [Google Scholar]
- Amin, M.H.F.; Lee, J.H.; Kim, A.R.; Kim, J.K.; Lee, C.I.; Kim, H.W. Development of a quantitative PCR assay for four salmon species inhabiting the Yangyangnamdae river using environmental DNA. Biology 2021, 10, 899. [Google Scholar] [CrossRef]
- Li, P.; Wang, F.; Wen, S.; Shen, H.B.; Du, X.Y. Genetic diversity and population structure of Brachymystax lenok tsinlingensis using mitochondrial DNA sequences. Mitochondrial DNA 2017, 2, 408–410. [Google Scholar]
- Treguier, A.; Jean, P.; Tony, D.; Alice, V.; Martin, A.; Schlaepfer, R. Environmental DNA surveillance for invertebrate species: Advantages and technical limitations to detect invasive crayfish Procambarus clarkii in freshwater ponds. J. Appl. Ecol. 2014, 51, 871–879. [Google Scholar]


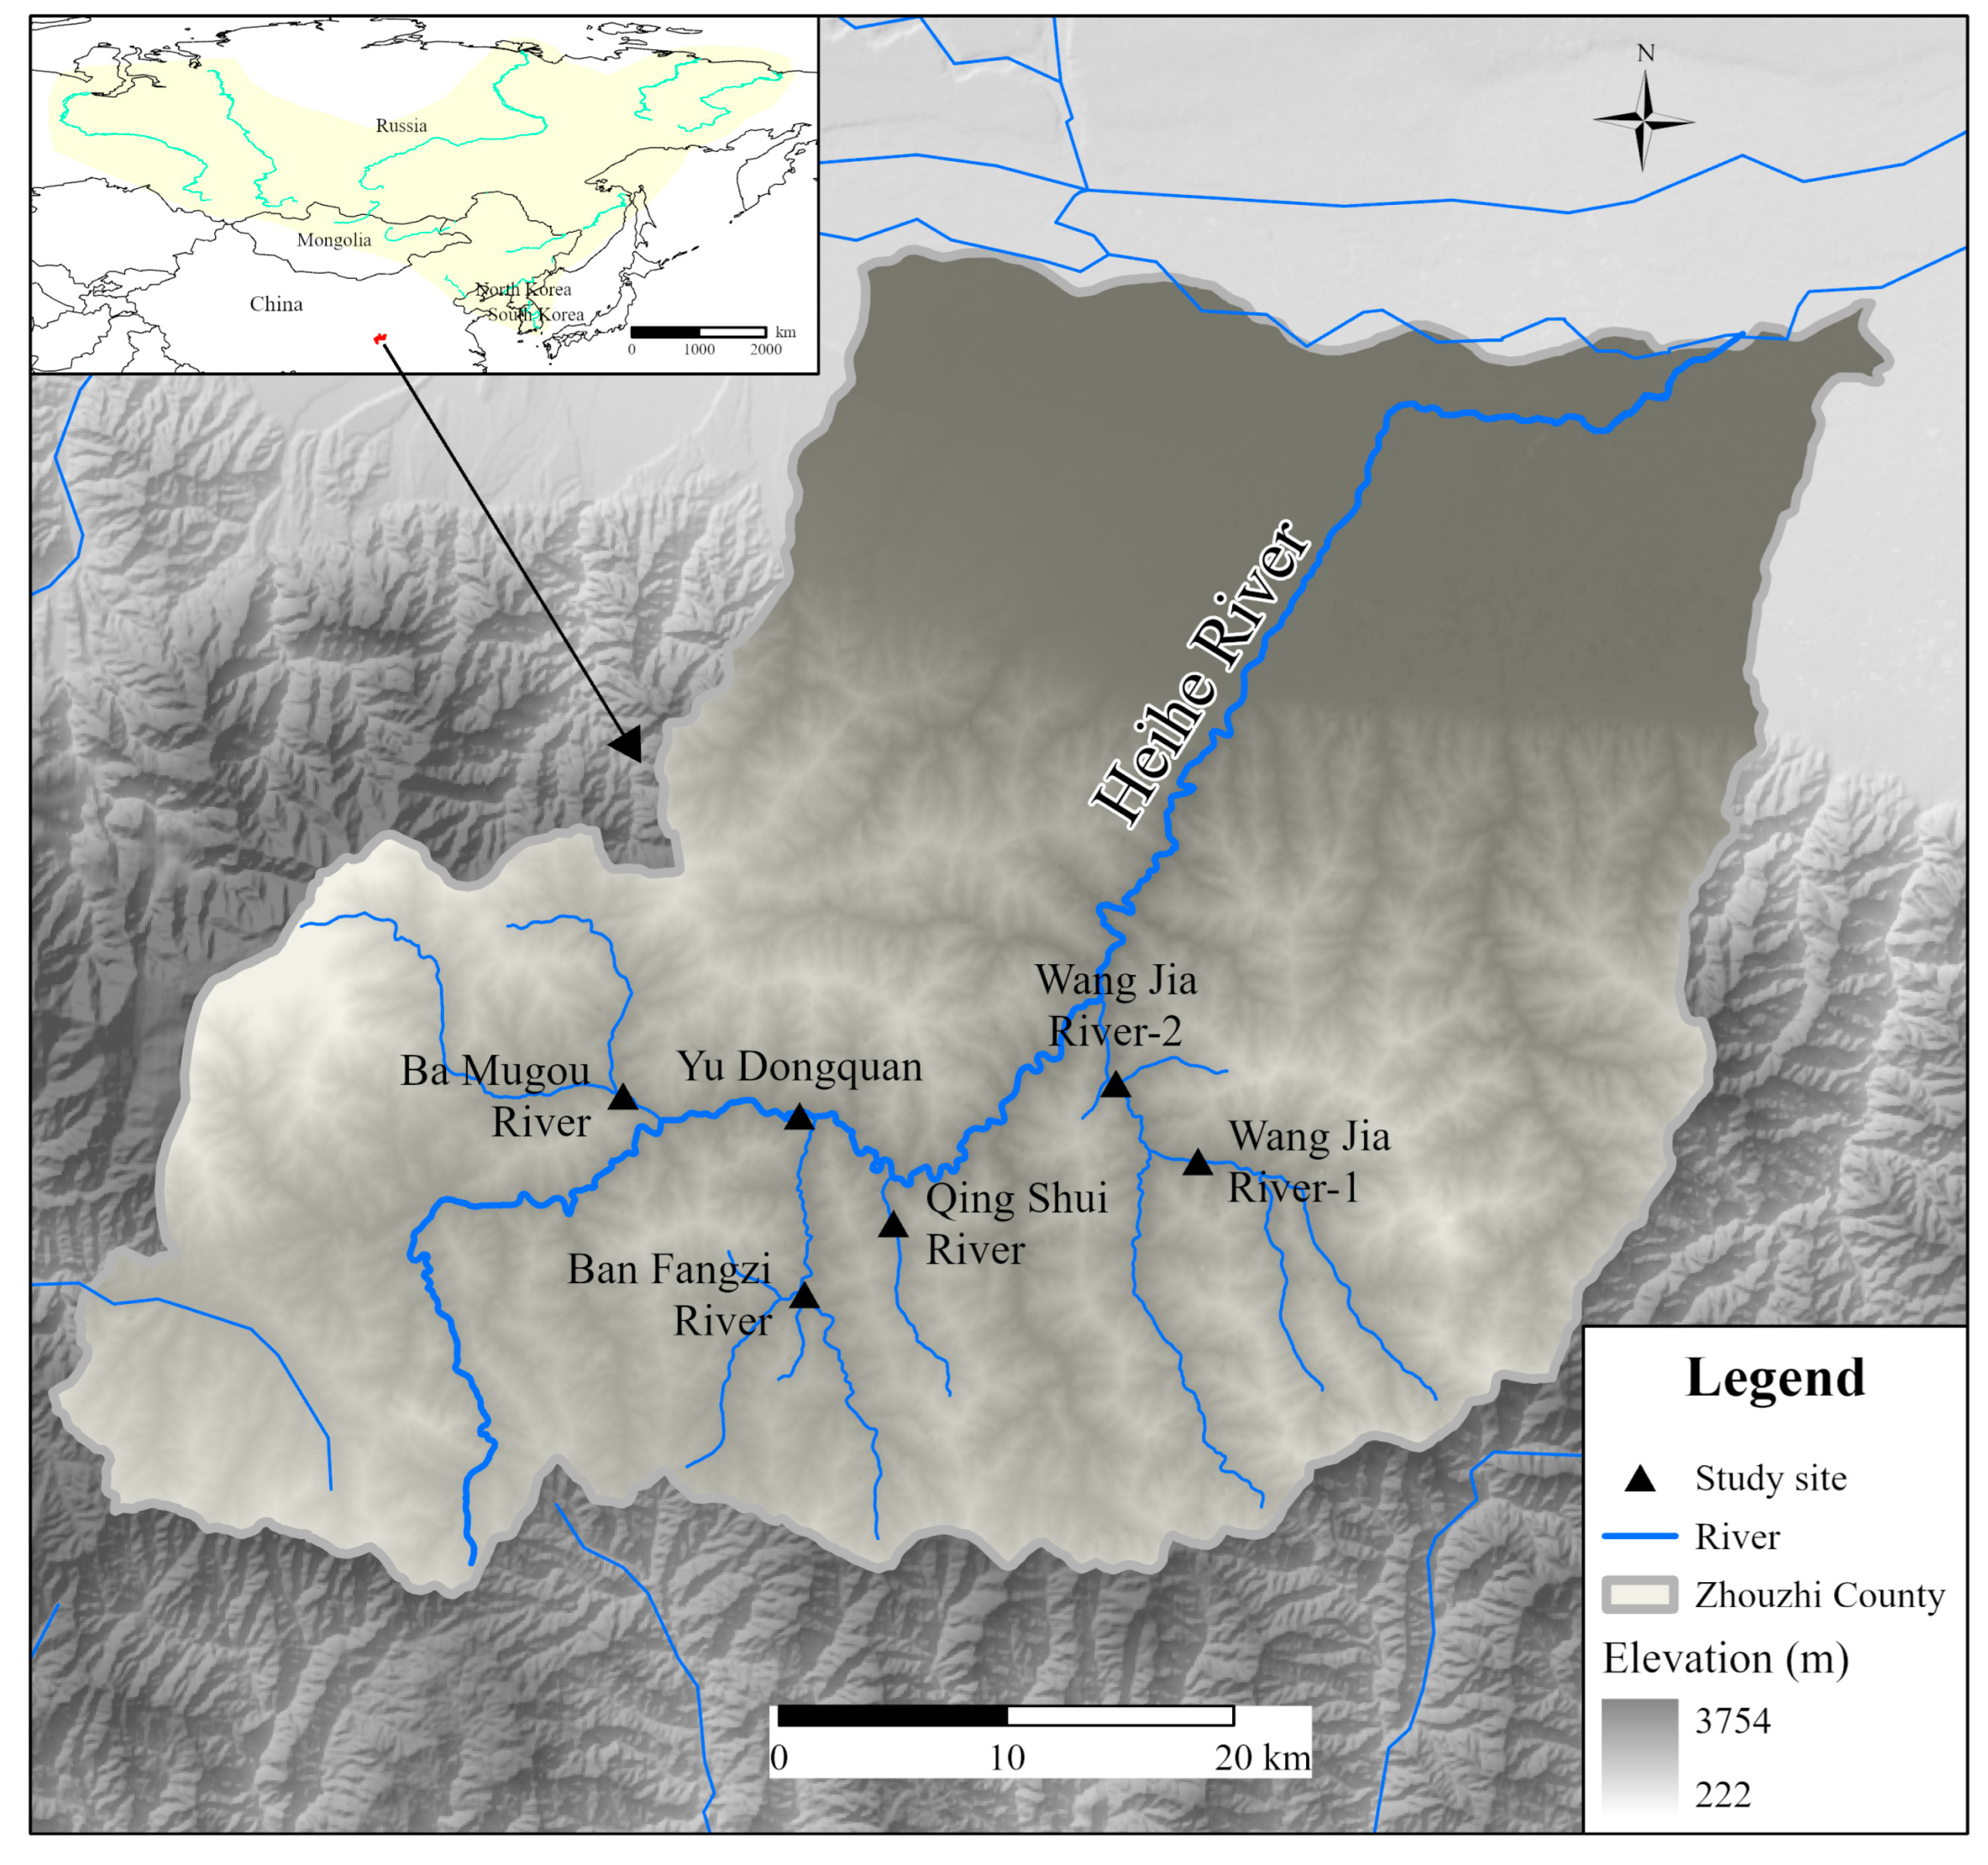
| Serial Number | Location | Coordinates | Altitudes |
|---|---|---|---|
| 1 | Ban Fangzi River | 33.49103 N, 108.00369 E | 1093 m |
| 2 | Ba Mugou River | 33.53463 N, 107.55166 E | 1069 m |
| 3 | Qing Shui River | 33.50553 N, 108.03053 E | 1060 m |
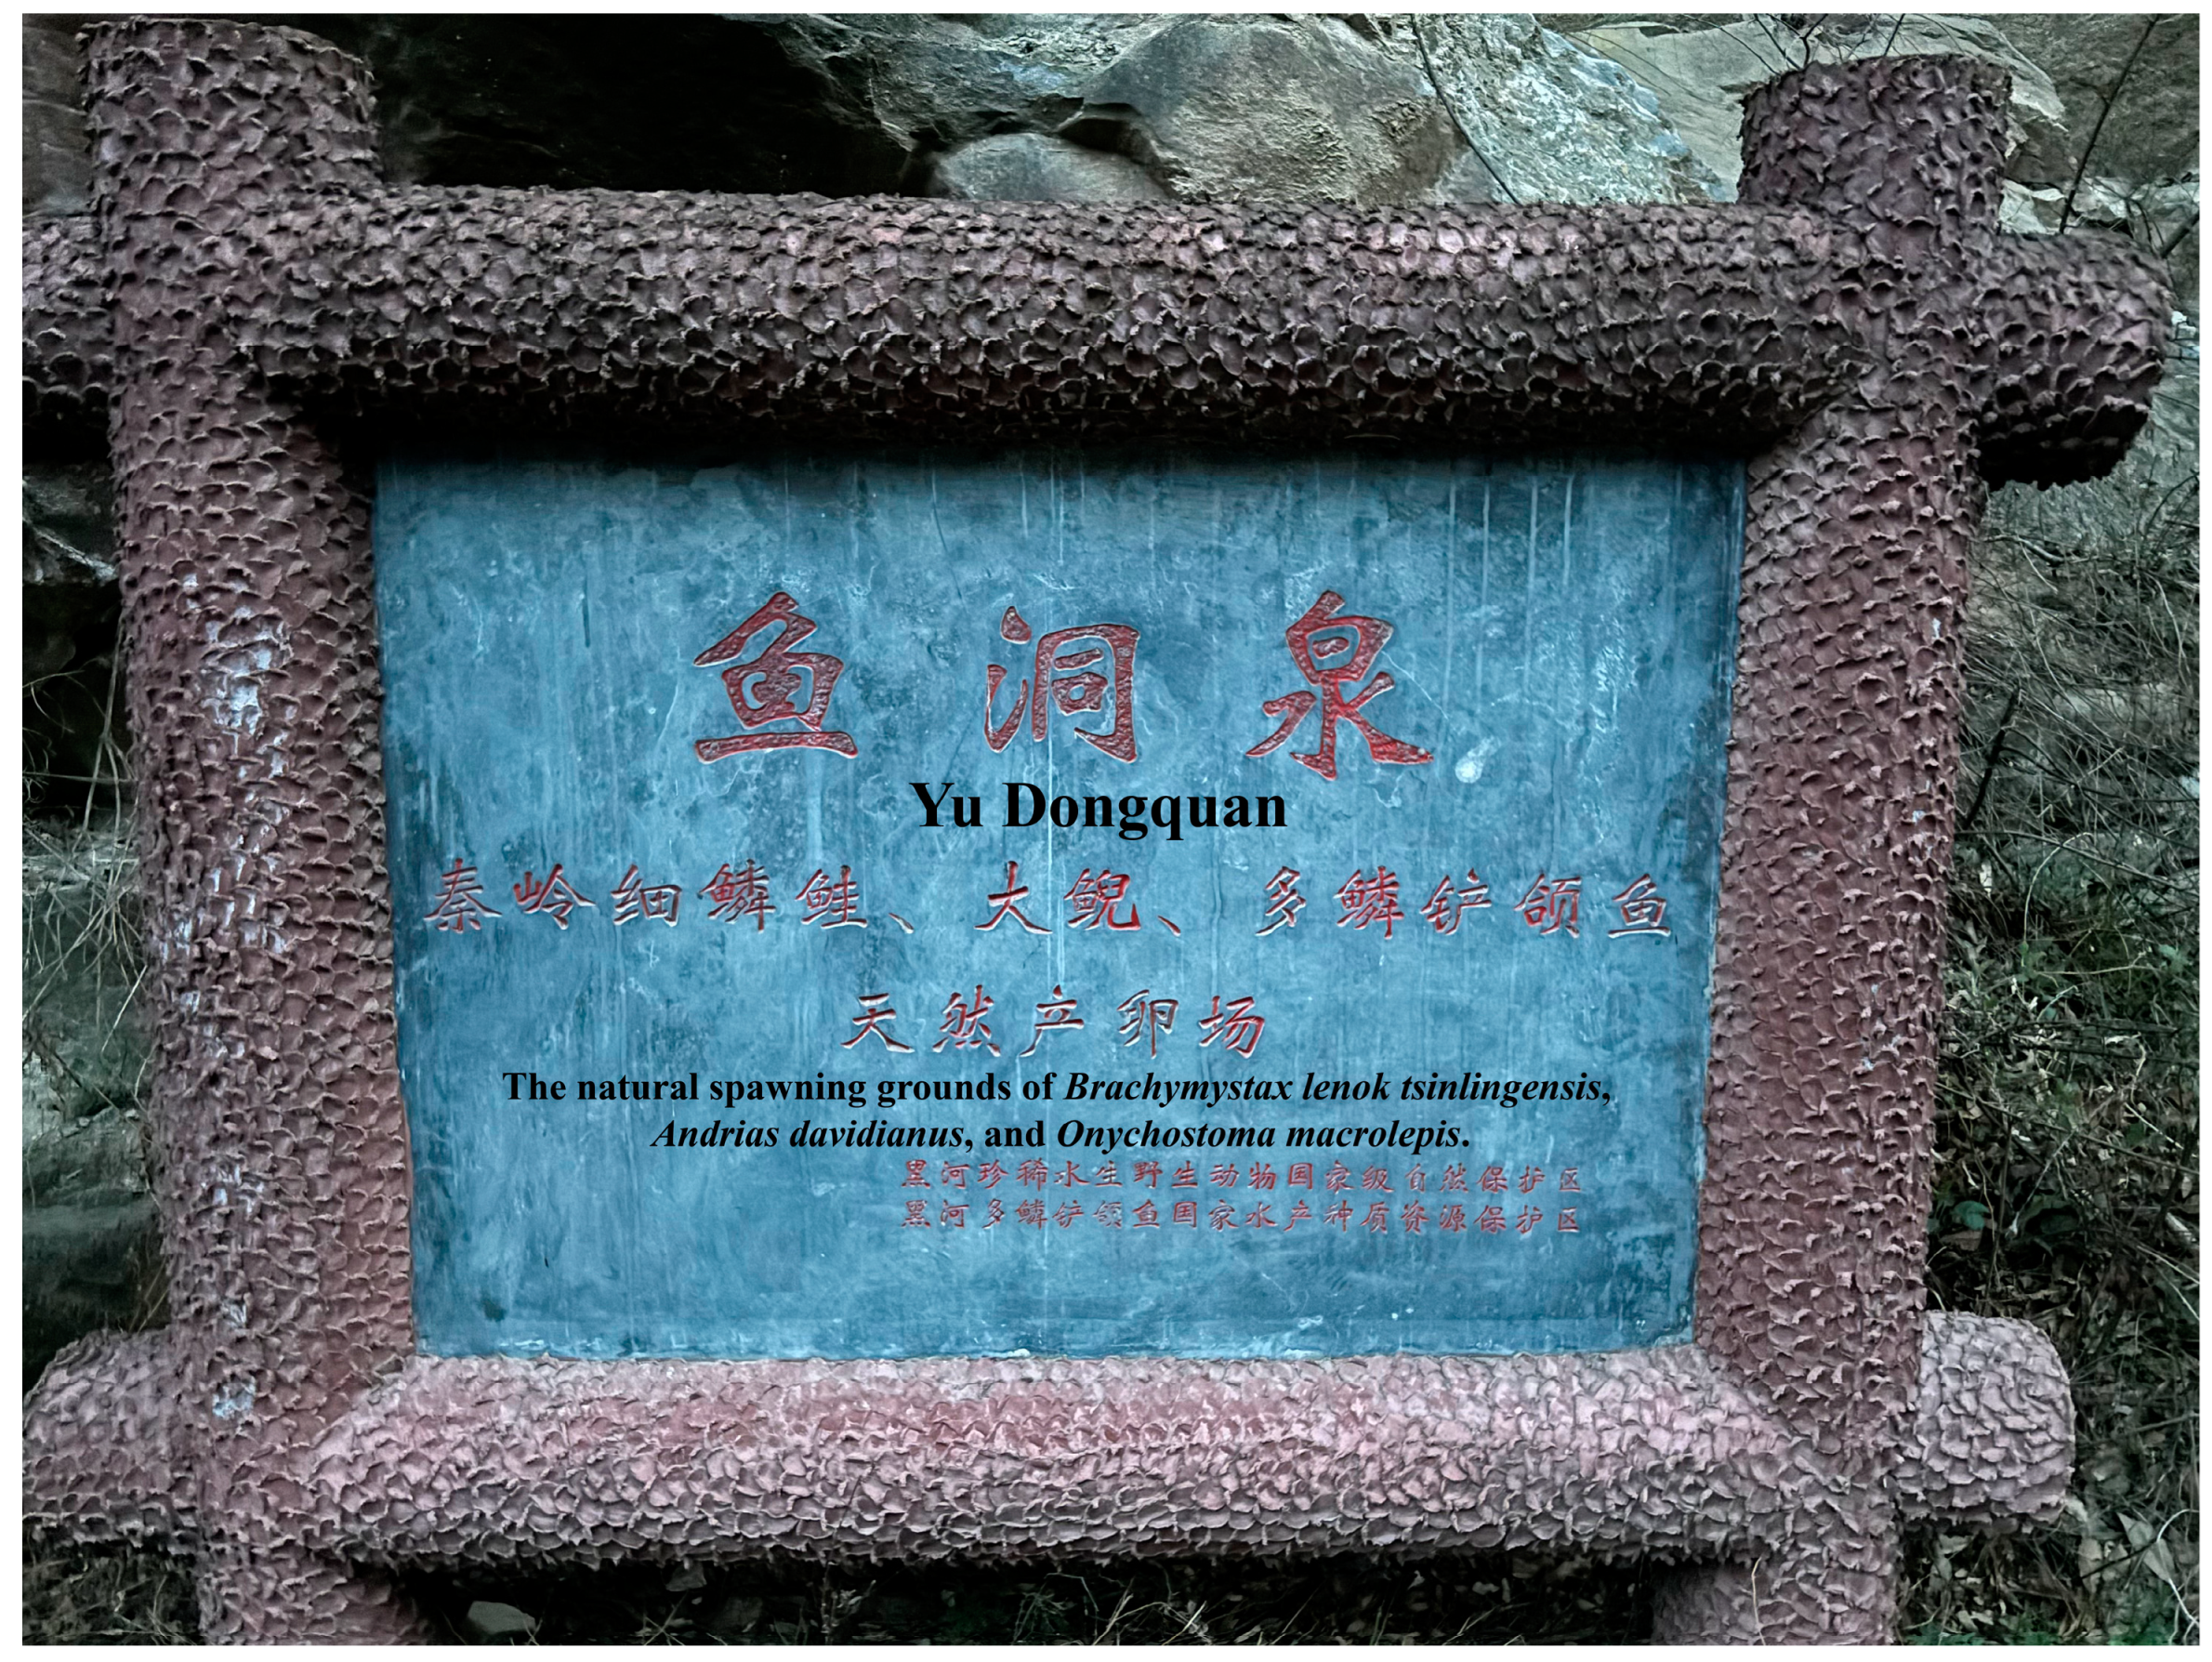
| 4 | Yu Dongquan | 33.53253 N, 108.00194 E | 940 m |
| 5 | Wang Jia River-1 | 33.52363 N, 108.11431 E | 951 m |
| 6 | Wang Jia River-2 | 33.54246 N, 108.09191 E | 849 m |
| Serial Number | Location | Number | Total Length (cm) | Body Length (cm) | Weight (g) |
|---|---|---|---|---|---|
| 1 | Wang Jia River-1 | 1 | 14.3 | 12.4 | 21.2 |
| 2 | Wang Jia River-2 | 1 | 25.6 | 22.1 | 158.9 |
Disclaimer/Publisher’s Note: The statements, opinions and data contained in all publications are solely those of the individual author(s) and contributor(s) and not of MDPI and/or the editor(s). MDPI and/or the editor(s) disclaim responsibility for any injury to people or property resulting from any ideas, methods, instructions or products referred to in the content. |
© 2025 by the authors. Licensee MDPI, Basel, Switzerland. This article is an open access article distributed under the terms and conditions of the Creative Commons Attribution (CC BY) license (https://creativecommons.org/licenses/by/4.0/).
Share and Cite
Zhao, H.; Zhang, H.; Zhang, K.; Deng, J.; Fang, C.; Zhang, J.; Kong, F.; Jiang, W.; Wang, Q.; Ma, H. Application of Environmental DNA for Assessing the Distribution and Biomass of Brachymystax lenok Tsinlingensis in the Zhouzhi Heihe River. Animals 2025, 15, 977. https://doi.org/10.3390/ani15070977
Zhao H, Zhang H, Zhang K, Deng J, Fang C, Zhang J, Kong F, Jiang W, Wang Q, Ma H. Application of Environmental DNA for Assessing the Distribution and Biomass of Brachymystax lenok Tsinlingensis in the Zhouzhi Heihe River. Animals. 2025; 15(7):977. https://doi.org/10.3390/ani15070977
Chicago/Turabian StyleZhao, Hu, Han Zhang, Kunyang Zhang, Jie Deng, Cheng Fang, Jianlu Zhang, Fei Kong, Wei Jiang, Qijun Wang, and Hongying Ma. 2025. "Application of Environmental DNA for Assessing the Distribution and Biomass of Brachymystax lenok Tsinlingensis in the Zhouzhi Heihe River" Animals 15, no. 7: 977. https://doi.org/10.3390/ani15070977
APA StyleZhao, H., Zhang, H., Zhang, K., Deng, J., Fang, C., Zhang, J., Kong, F., Jiang, W., Wang, Q., & Ma, H. (2025). Application of Environmental DNA for Assessing the Distribution and Biomass of Brachymystax lenok Tsinlingensis in the Zhouzhi Heihe River. Animals, 15(7), 977. https://doi.org/10.3390/ani15070977