
Effects of a Phosphorus-Binding Feed Supplement on the Blood P and Ca Levels in Dairy Cows


Simple Summary
Abstract
1. Introduction
2. Materials and Methods
2.1. Animals, Husbandry, Feeding Regime
2.2. Samplings and Laboratory Analysis
2.3. Statistical Analysis
3. Results
4. Discussion
5. Conclusions
Author Contributions
Funding
Institutional Review Board Statement
Informed Consent Statement
Data Availability Statement
Acknowledgments
Conflicts of Interest
References
- Couto Serrenho, R.; DeVries, T.J.; Duffield, T.F.; LeBlanc, S.J. Graduate Student Literature Review: What do we know about the effects of clinical and subclinical hypocalcemia on health and performance of dairy cows? J. Dairy Sci. 2021, 104, 6304–6326. [Google Scholar] [CrossRef] [PubMed]
- Goff, J.P. The monitoring, prevention, and treatment of milk fever and subclinical hypocalcemia in dairy cows. Vet. J. 2008, 176, 50–57. [Google Scholar] [CrossRef] [PubMed]
- Seifi, H.A.; Leblanc, S.J.; Leslie, K.E.; Duffield, T.F. Metabolic predictors of postpartum disease and culling risk in dairy cattle. Vet. J. 2011, 188, 216–220. [Google Scholar] [CrossRef]
- Martinez, N.; Risco, C.A.; Lima, F.S.; Bisinotto, R.S.; Greco, L.F.; Ribiero, E.S.; Maunsell, F.; Galvao, K.; Santos, J.E.P. Evaluation of peripartal calcium status, energetic profile, and neutrophil function in dairy cows at low or high risk of developing uterine disease. J. Dairy Sci. 2012, 95, 7158–7172. [Google Scholar] [CrossRef]
- Rodríguez, E.M.; Arís, A.; Bach, A. Associations between subclinical hypocalcemia and postparturient diseases in dairy cows. J. Dairy Sci. 2017, 100, 7427–7434. [Google Scholar] [CrossRef]
- Reinhardt, T.A.; Lippolis, J.D.; McCluskey, B.J.; Goff, J.P.; Horst, R.L. Prevalence of subclinical hypocalcemia in dairy herds. Vet. J. 2011, 188, 122–124. [Google Scholar] [CrossRef]
- Venjakob, P.L.; Borchardt, S.; Heuwieser, W. Hypocalcemia–Cow-level prevalence and preventive strategies in German dairy herds. J. Dairy Sci. 2017, 100, 9258–9266. [Google Scholar] [CrossRef] [PubMed]
- Szelényi, Z.; Lénárt, L.; Horváth, A.; Hajdú, R.; Katona, R.; Sánta, A.; Lipthay, I.; Szenci, O. Evaluation of subclinical hypocalcemia in Hungarian dairy herds. Magy. Állatorv Lapja 2023, 145, 515–525. [Google Scholar] [CrossRef]
- Oetzel, G.R. Monitoring and testing dairy herds for metabolic disease. Vet. Clin. N. Am. Food Anim. Pract. 2004, 20, 651–674. [Google Scholar] [CrossRef]
- Cohrs, I.; Wächter, S.; Golbeck, L.; Grünberg, W. Evaluation of the relationship between ionized and total calcium concentrations in blood during the first week of lactation in dairy cows. J. Vet. Intern. Med. 2023, 37, 2592–2602. [Google Scholar] [CrossRef]
- Ott, D.; Schrapers, K.T.; Aschenbach, J.R. Changes in the relationship between ionized and total calcium in clinically healthy dairy cows in the period around calving. Animals 2021, 11, 1036. [Google Scholar] [CrossRef] [PubMed]
- NASEM (National Academies of Sciences, Engineering and Medicine). Nutrient Requirements of Dairy Cattle: Eighth Revised Edition; National Academies Press: Washington, DC, USA, 2021. [Google Scholar] [CrossRef]
- Goff, J.P. Calcium and magnesium disorders. Vet. Clin. Food Anim. Pract. 2014, 30, 359–381. [Google Scholar] [CrossRef] [PubMed]
- Thilsing-Hansen, T.; Jørgensen, R.J.; Østergaard, S. Milk fever control principles: A review. Acta Vet. Scand. 2002, 43, 1. [Google Scholar] [CrossRef] [PubMed]
- Cohrs, I.; Wilkens, M.R.; Grünberg, W. Effects of dietary phosphorus deprivation in late gestation and early lactation on the calcium homeostasis of periparturient dairy cows. J. Dairy Sci. 2018, 101, 9591–9598. [Google Scholar] [CrossRef]
- Wilkens, M.R.; Nelson, C.D.; Hernandez, L.L.; McArt, J.A.A. Symposium review: Transition cow calcium homeostasis–Health effects of hypocalcemia and strategies for prevention. J. Dairy Sci. 2020, 103, 2909–2927. [Google Scholar] [CrossRef]
- Frizzarini, W.S.; Monteiro, P.L.J.; Compolina, J.P.; Vang, A.L.; Soudah, O.; Levandowski, L.R.; Connelly, M.K.; Apelo, S.I.A.; Hernandez, L.L. Mechanisms by which feeding synthetic zeolite A and dietary cation-anion difference diets impacts mineral metabolism in multiparous Holstein cows: Part I. J. Dairy Sci. 2024, 107, 5204–5221. [Google Scholar] [CrossRef]
- Thilsing-Hansen, T.; Jørgensen, R.J. Hot topic: Prevention of parturient paresis and subclinical hypocalcemia in dairy cows by zeolite A administration in the dry period. J. Dairy Sci. 2001, 84, 691–693. [Google Scholar] [CrossRef]
- Grabherr, H.; Spolders, M.; Lebzien, P.; Hüther, L.; Flachowsky, G.; Fürll, M.; Grün, M. Effect of zeolite A on rumen fermentation and phosphorus metabolism in dairy cows. Arch. Anim. Nutr. 2009, 63, 321–336. [Google Scholar] [CrossRef]
- Grabherr, H.; Spolders, M.; Fürll, M.; Flachowsky, G. Effect of several doses of zeolite A on feed intake, energy metabolism and on mineral metabolism in dairy cows around calving. J. Anim. Physiol. Anim. Nutr. 2009, 93, 221–236. [Google Scholar] [CrossRef]
- Thilsing, T.; Larsen, T.; Jørgensen, R.J.; Houe, H. The effect of dietary calcium and phosphorus supplementation in zeolite A treated dry cows on periparturient calcium and phosphorus homeostasis. J. Vet. Med. A Physiol. Pathol. Clin. Med. 2007, 54, 82–91. [Google Scholar] [CrossRef]
- Pallesen, A.; Pallesen, F.; Jørgensen, R.J.; Thilsing, T. Effect of pre-calving zeolite, magnesium and phosphorus supplementation on periparturient serum mineral concentrations. Vet. J. 2008, 175, 234–239. [Google Scholar] [CrossRef] [PubMed]
- EFSA. Safety of aluminum from dietary intake—Scientific Opinion of the European Food Safety Authority (EFSA) Panel on Food Additives, Flavorings, Processing Aids and Food Contact Materials (AFC). EFSA J. 2008, 6, 754. [Google Scholar] [CrossRef]
- Code of Federal Regulations § 182.1125 Aluminum Sulfate. Available online: https://www.ecfr.gov/current/title-21/chapter-I/subchapter-B/part-182/subpart-B/section-182.1125 (accessed on 31 January 2025).
- Suzuki, K.; Kondo, N.; Takagi, K.; Nishikawa, A.; Murakami, Y.; Otsuka, M.; Tsukano, K.; Ikeda, K.; Funakura, H.; Yasutomi, I.; et al. Validation of the bovine blood calcium checker as a rapid and simple measuring tool for the ionized calcium concentration in cattle. J. Vet. Med. Sci. 2021, 83, 767–774. [Google Scholar] [CrossRef]
- Bauer, P.J. Affinity and stoichiometry of calcium binding by arsenazo III. Anal. Biochem. 1981, 110, 61–72. [Google Scholar] [CrossRef]
- Daly, J.A.; Erthingshausen, G. Direct method for determining inorganic phosphate in serum with the CentrifiChem. Clin. Chem. 1972, 18, 263–265. [Google Scholar] [CrossRef]
- Rice, E.W.; Lapra, C.Z. Rapid ultramicrospectrophotometric determination of magnesium. Clin. Chim. Acta 1964, 10, 360–364. [Google Scholar] [CrossRef]
- Li, P.K.; Lee, S.T.; MacGillvray, M.H.; Schaefer, P.A.; Siegel, J.H. Direct fixed time kinetic assays for β-hydroxybutyrate and acetoacetate with a centrifugal analyzer or a computer-backed spectrophotometer. Clin. Chem. 1980, 26, 1713–1717. [Google Scholar] [CrossRef]
- R Core Team. R: A Language and Environment for Statistical Computing; R Foundation for Statistical Computing: Vienna, Austria, 2024; Available online: https://www.R-project.org/ (accessed on 21 July 2024).
- Thilsing-Hansen, T.; Jørgensen, R.J.; Enemark, J.M.D.; Larsen, T. The effect of zeolite A supplementation in the dry period on periparturient calcium, phosphorus, and magnesium homeostasis. J. Dairy Sci. 2002, 85, 1855–1862. [Google Scholar] [CrossRef]
- Kerwin, A.L.; Ryan, C.M.; Leno, B.M.; Jakobsen, M.; Theilgaard, P.; Barbano, D.M.; Overton, T.R. Effects of feeding synthetic zeolite A during the prepartum period on serum mineral concentration, oxidant status, and performance of multiparous Holstein cows. J. Dairy Sci. 2019, 102, 5191–5207. [Google Scholar] [CrossRef]
- Khachlouf, K.; Hamed, H.; Gdoura, R.; Gargouri, A. Effects of dietary Zeolite supplementation on milk yield and composition and blood minerals status in lactating dairy cows. J. Appl. Anim. Res. 2019, 47, 54–62. [Google Scholar] [CrossRef]
- Crookenden, M.A.; Phyn, C.V.C.; Turner, S.A.; Loor, J.J.; Smith, A.I.; Lopreiato, V.; Burke, C.R.; Heiser, A.; Roche, J.R. Feeding synthetic zeolite to transition dairy cows alters neutrophil gene expression. J. Dairy Sci. 2020, 103, 723–736. [Google Scholar] [CrossRef] [PubMed]
- Goff, J.P.; Hohman, A.; Timms, L.L. Effect of subclinical and clinical hypocalcemia and dietary cation-anion difference on rumination activity in periparturient dairy cows. J. Dairy Sci. 2020, 103, 2591–2601. [Google Scholar] [CrossRef] [PubMed]
- Goff, J.P. Macromineral physiology and application to the feeding of the dairy cow for prevention of milk fever and other periparturient mineral disorders. Anim. Feed Sci. Technol. 2006, 126, 237–257. [Google Scholar] [CrossRef]
- Petersen, A.B.; Orth, M.W.; Goff, J.P.; Beede, D.K. Periparturient responses of multiparous Holstein cows fed different dietary phosphorus concentrations prepartum. J. Dairy Sci. 2005, 88, 3582–3594. [Google Scholar] [CrossRef]
- Köhler, O.M.; Grünberg, W.; Schnepel, N.; Muscher-Banse, A.S.; Rajaeerad, A.; Hummer, J.; Breves, G.; Wilkens, M.R. Dietary phosphorus restriction affects bone metabolism, vitamin D metabolism and rumen fermentation traits in sheep. J. Anim. Physiol. Anim. Nutr. 2020, 105, 35–50. [Google Scholar] [CrossRef]
- Crowe, N.A.; Neathery, M.W.; Miller, W.J.; Muse, L.A.; Crowe, C.T.; Varnadoe, J.L.; Blackmon, D.M. Influence of high dietary aluminum on performance and phosphorus bioavailability in dairy calves. J. Dairy Sci. 1990, 73, 808–818. [Google Scholar] [CrossRef]
- Allen, V.G.; Horn, F.P.; Fontenot, J.P. Influence of ingestion of aluminum, citric acid and soil on mineral metabolism of lactating beef cows. J. Anim. Sci. 1986, 63, 1396–1403. [Google Scholar] [CrossRef]
- Thilsing-Hansen, T.; Jørgensen, R.J.; Enemark, J.M.; Zelvyte, R.; Sederevicius, A. The effect of zeolite A supplementation in the dry period on blood mineral status around calving. Acta Vet. Scand. 2003, 97, 87–95. [Google Scholar]
- Suthar, V.S.; Canelas-Raposo, J.; Deniz, A.; Heuwieser, W. Prevalence of subclinical ketosis and relationships with postpartum diseases in European dairy cows. J. Dairy Sci. 2013, 96, 2925–2938. [Google Scholar] [CrossRef]
- McArt, J.A.A.; Nydam, D.V.; Oetzel, G.R. Epidemiology of subclinical ketosis in early lactation dairy cattle. J. Dairy Sci. 2012, 95, 5056–5066. [Google Scholar] [CrossRef]
- Loiklung, C.; Sukon, P.; Thamrongyoswittayakul, C. Global prevalence of subclinical ketosis in dairy cows: A systematic review and meta-analysis. Res. Vet. Sci. 2022, 144, 66–76. [Google Scholar] [CrossRef] [PubMed]
- Frizzarini, W.S.; Campolina, J.P.; Vang, A.L.; Lewandowski, L.R.; Teixeira, N.N.; Connelly, M.K.; Monteiro, P.L.J.; Hernandez, L.L. Mechanisms by which feeding synthetic zeolite A and dietary cation-anion difference diets affect feed intake, energy metabolism, and milk performance: Part II. J. Dairy Sci. 2024, 107, 5222–5234. [Google Scholar] [CrossRef] [PubMed]
- Dobrzanski, Z.; Kolacz, R.; Górecka, H.; Chojnacka, K.; Bartkowiak, A. The content of microelements and trace elements in raw milk from cows in the Silesian region. Pol. J. Environ. Stud. 2005, 14, 685–689. [Google Scholar]
- Fernandez-Lorenzo, J.R.; Cocho, J.A.; Rey-Goldar, M.L.; Couce, M.; Fraga, J.M. Aluminum contents of human milk, cow’s milk, and infant formulas. J. Pediatr. Gastroenterol. Nutr. 1999, 28, 270–275. [Google Scholar] [CrossRef]
- Amer, A.A.E.; El-Makarem, H.S.A.; El-Maghraby, M.A.; Abou-Alella, S.A. Lead, cadmium, and aluminum in raw bovine milk: Residue level, estimated intake, and fate during artisanal dairy manufacture. J. Adv. Vet. Anim. Res. 2021, 20, 454–464. [Google Scholar] [CrossRef]
- Alasfar, R.H.; Isaifan, R.J. Aluminum environmental pollution: The silent killer. Environ. Sci. Pollut. Res. Int. 2021, 28, 44587–44597. [Google Scholar] [CrossRef]
- Boudebbouz, A.; Boudalia, S.; Bousbia, A.; Habila, S.; Boussadia, M.I.; Gueroui, Y. Heavy metals levels in raw cow milk and health risk assessment across the globe: A systematic review. Sci. Total Environ. 2021, 751, 141830. [Google Scholar] [CrossRef]


| Control | Treated | p-Value | |
|---|---|---|---|
| Parity (±SD) | 2.9 ± 1.1 | 3.2 ± 1.3 | 1.000 |
| Second lactation (animal/group) | 8 | 7 | |
| Third lactation | 3 | 3 | |
| Fourth lactation | 5 | 4 | |
| Fifth lactation | 1 | 2 | |
| Sixth lactation | 0 | 1 | |
| Milk production for 305 days in the previous lactation (kg ± SD) | 11,241 ± 2544 | 11,318 ± 1962 | 0.9199 |
| Length of the previous lactation (days ± SD) | 344 ± 116 | 351 ± 86 | 0.9109 |
| Number of metritis cases in the previous lactation | 0 | 1 | |
| Number of displaced abomasum cases in the previous lactation | 0 | 0 | |
| Number of milk fever cases in the previous lactation | 0 | 0 | |
| Number of ketosis cases in the previous lactation | 1 | 0 | |
| Body condition score (mean + SE) | 3.62 ± 0.46 | 3.53 ± 0.37 | 0.5394 |
| Ingredients (kg) | Before Calving | After Calving | |
|---|---|---|---|
| Control | Treated | ||
| Corn silage | 14.0 | 14.0 | 17.0 |
| Wheat straw | 4.0 | 4.0 | 0.0 |
| Water | 4.0 | 4.0 | 4.0 |
| Concentrate | 5.5 | 5.5 | 11.0 |
| Barley haylage | 0.0 | 0.0 | 7.0 |
| Wet corn gluten feed | 0.0 | 0.0 | 5.0 |
| Meadow hay | 0.0 | 0.0 | 1.0 |
| Aluminum sulfate | 0.0 | 0.4 | 0.0 |
| In total | 27.5 | 27.9 | 45.6 |
| Items | Before Calving | After Calving | |
|---|---|---|---|
| Control | Treated | ||
| Dry matter (%) | 47.8 | 47.8 | 48.3 |
| NEl (MJ/kgDM) | 5.9 | 5.9 | 7.5 |
| Crude protein (%DM) | 13.7 | 13.7 | 19.7 |
| Rumen degradable protein (%DM) | 9.3 | 9.3 | 13.5 |
| Rumen undegradable protein (%DM) | 4.2 | 4.2 | 6.2 |
| Sugar (%DM) | 2.9 | 2.9 | 4.9 |
| Starch (%DM) | 20.9 | 20.9 | 23.7 |
| Crude fiber (%DM) | 22.3 | 22.3 | 13.5 |
| ADF (%DM) | 25.4 | 25.4 | 15.4 |
| NDF (%DM) | 39.9 | 39.9 | 30.4 |
| NFC (%DM) | 35.7 | 35.7 | 39.2 |
| Ether extract (%DM) | 3.2 | 3.2 | 4.5 |
| Ash (%DM) | 7.3 | 7.3 | 7.1 |
| Ca (%DM) | 0.59 | 0.59 | 0.89 |
| P (%DM) | 0.42 | 0.42 | 0.43 |
| Ca:P ratio | 1.41 | 1.41 | 2.07 |
| Mg (%DM) | 0.25 | 0.25 | 0.39 |
| Cl (%DM) | 0.44 | 0.44 | 0.32 |
| S (%DM) | 0.20 | 1.08 | 0.28 |
| DCAD (mEq/100 g DM) | 10.6 | −13.2 | 29.1 |
| Days in Relation to Calving | p-Value | ||||||||||||||||
|---|---|---|---|---|---|---|---|---|---|---|---|---|---|---|---|---|---|
| −14 * | −10 | −7 | −5 | −3 | −1 | 0 ** | 1 | 2 | 3 | 5 | 7 | 14 | SEM | Group | Sampling | G × S | |
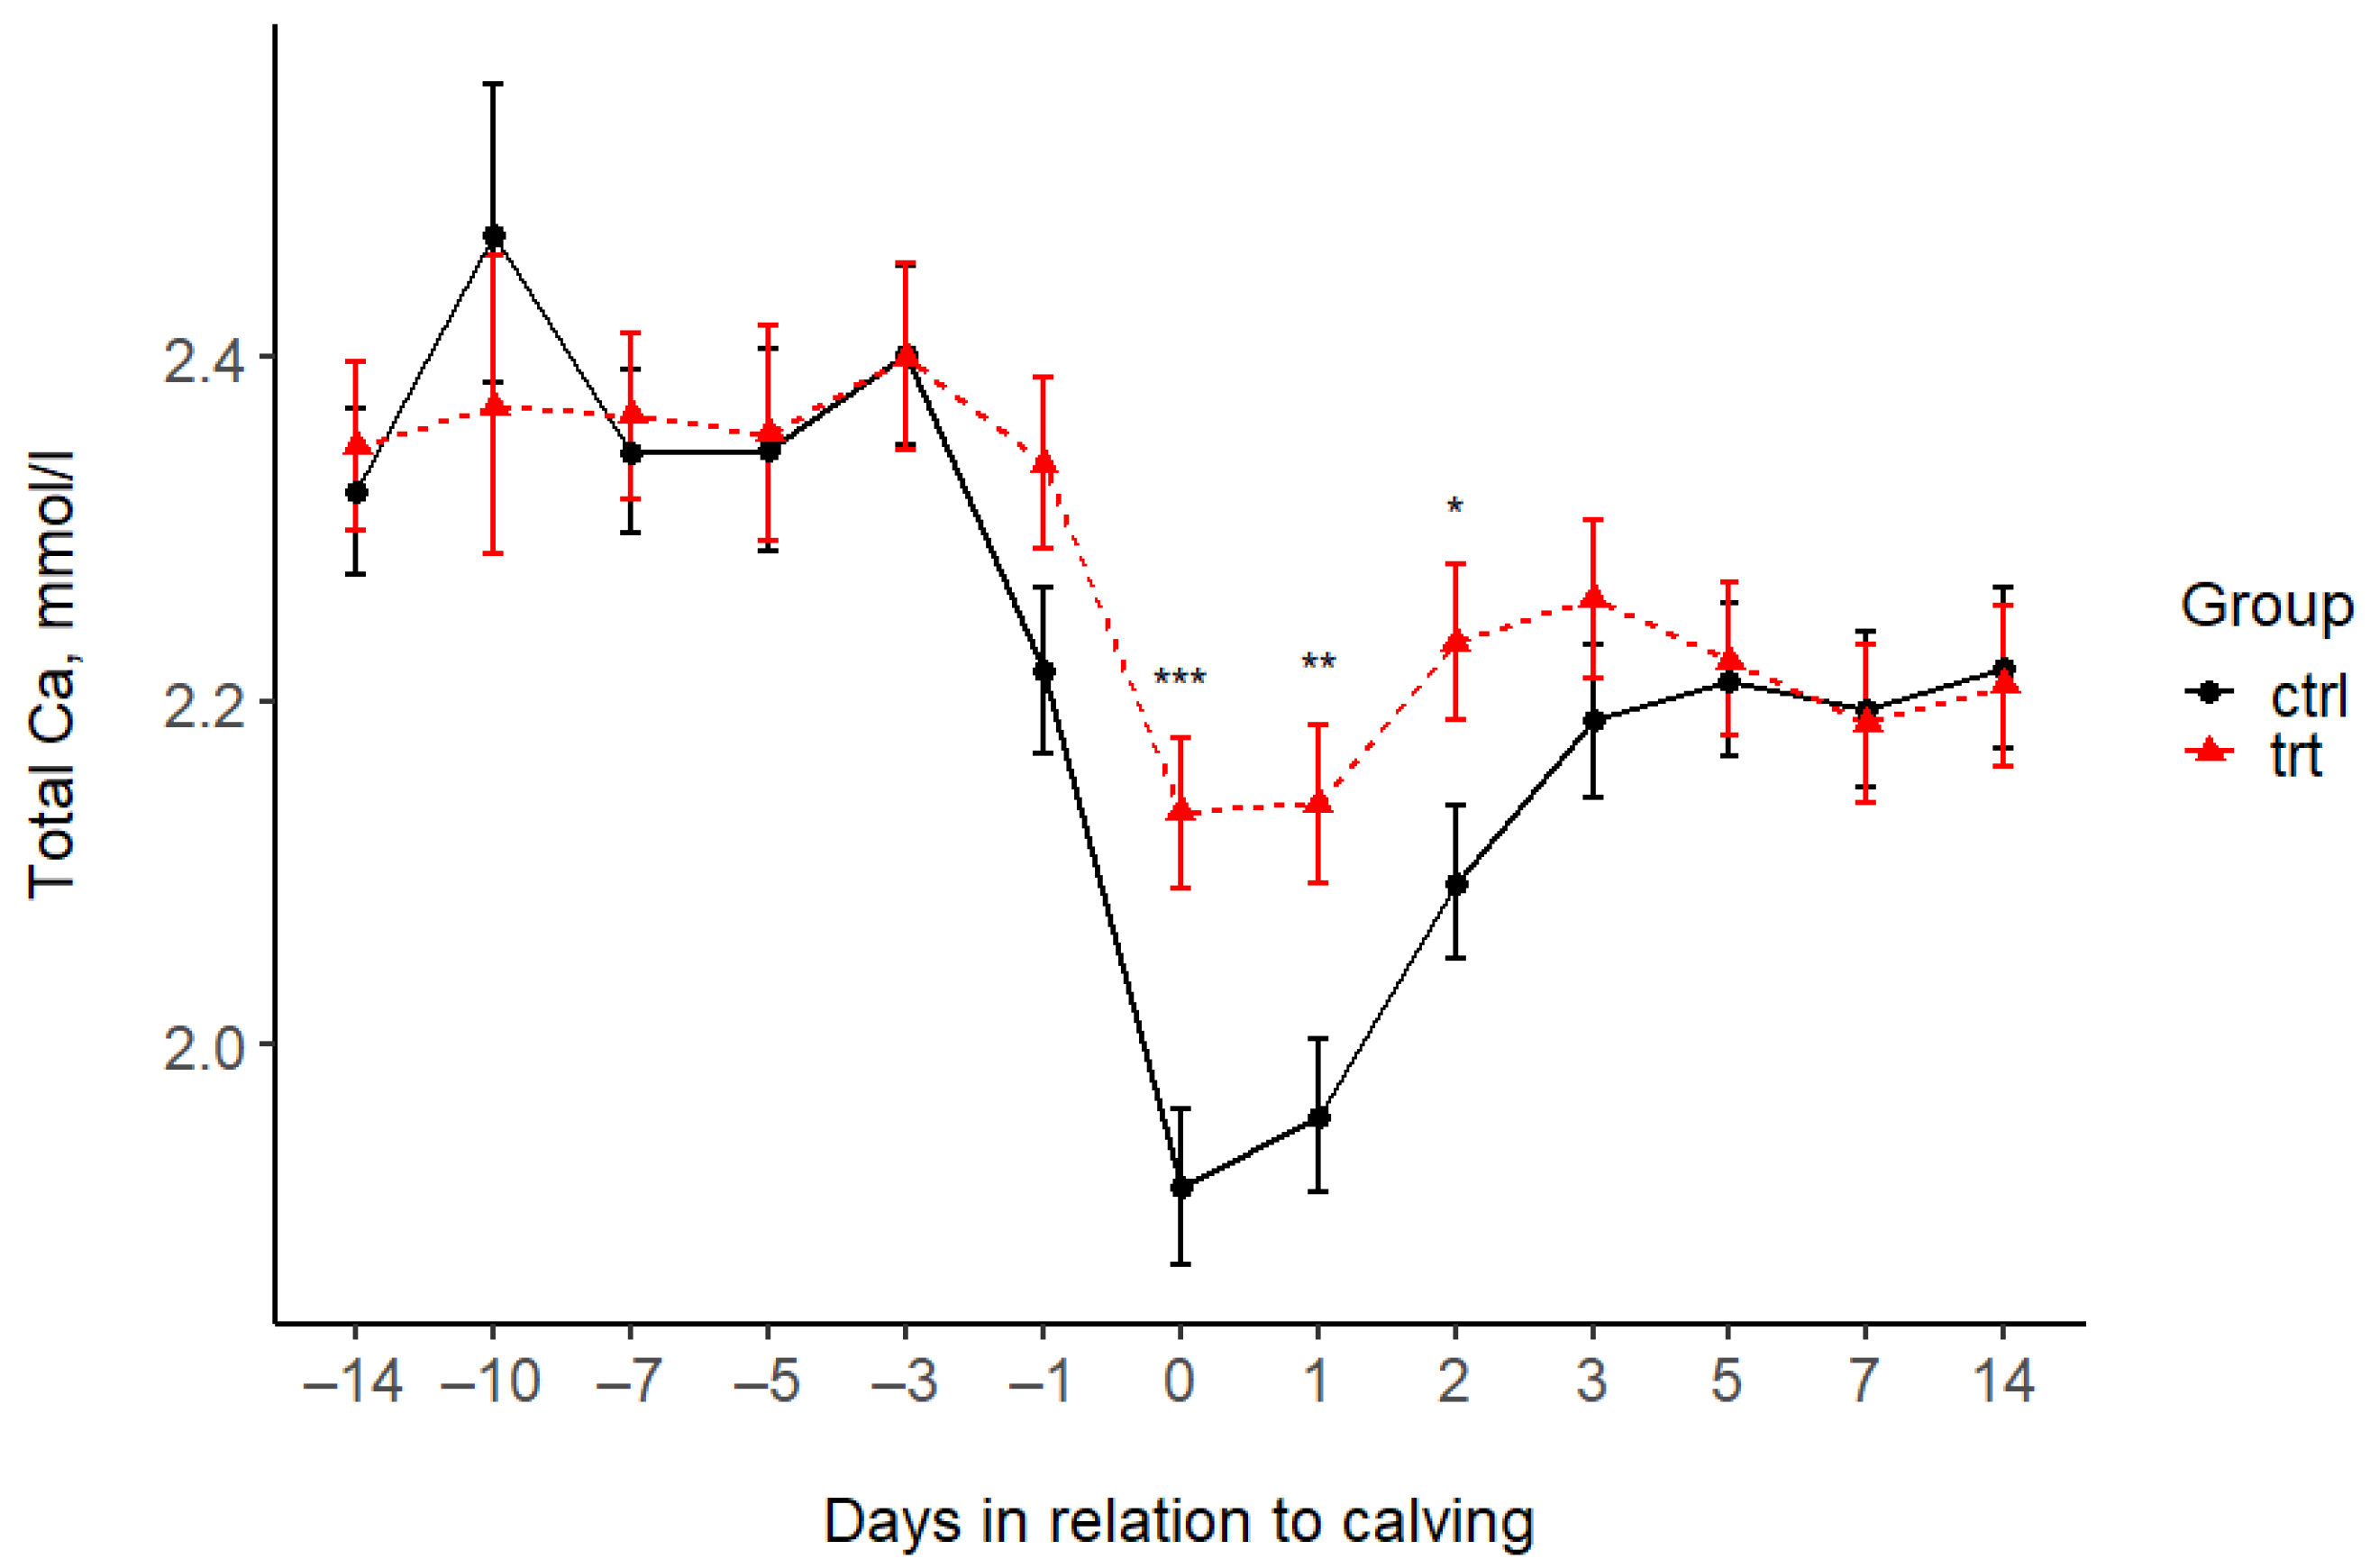
| Total Ca (mmol/L) | |||||||||||||||||
| Control | 2.32 | 2.47 | 2.34 | 2.35 | 2.40 | 2.22 | 1.92 | 1.96 | 2.09 | 2.19 | 2.21 | 2.19 | 2.22 | 0.05 | 0.134 | <0.001 | 0.043 |
| Treated | 2.35 | 2.37 | 2.37 | 2.35 | 2.40 | 2.34 | 2.14 | 2.14 | 2.23 | 2.26 | 2.22 | 2.19 | 2.21 | 0.05 | |||
| p-value (pairwise) | 0.702 | 0.415 | 0.757 | 0.913 | 0.986 | 0.085 | 0.001 | 0.005 | 0.028 | 0.268 | 0.852 | 0.903 | 0.874 | ||||
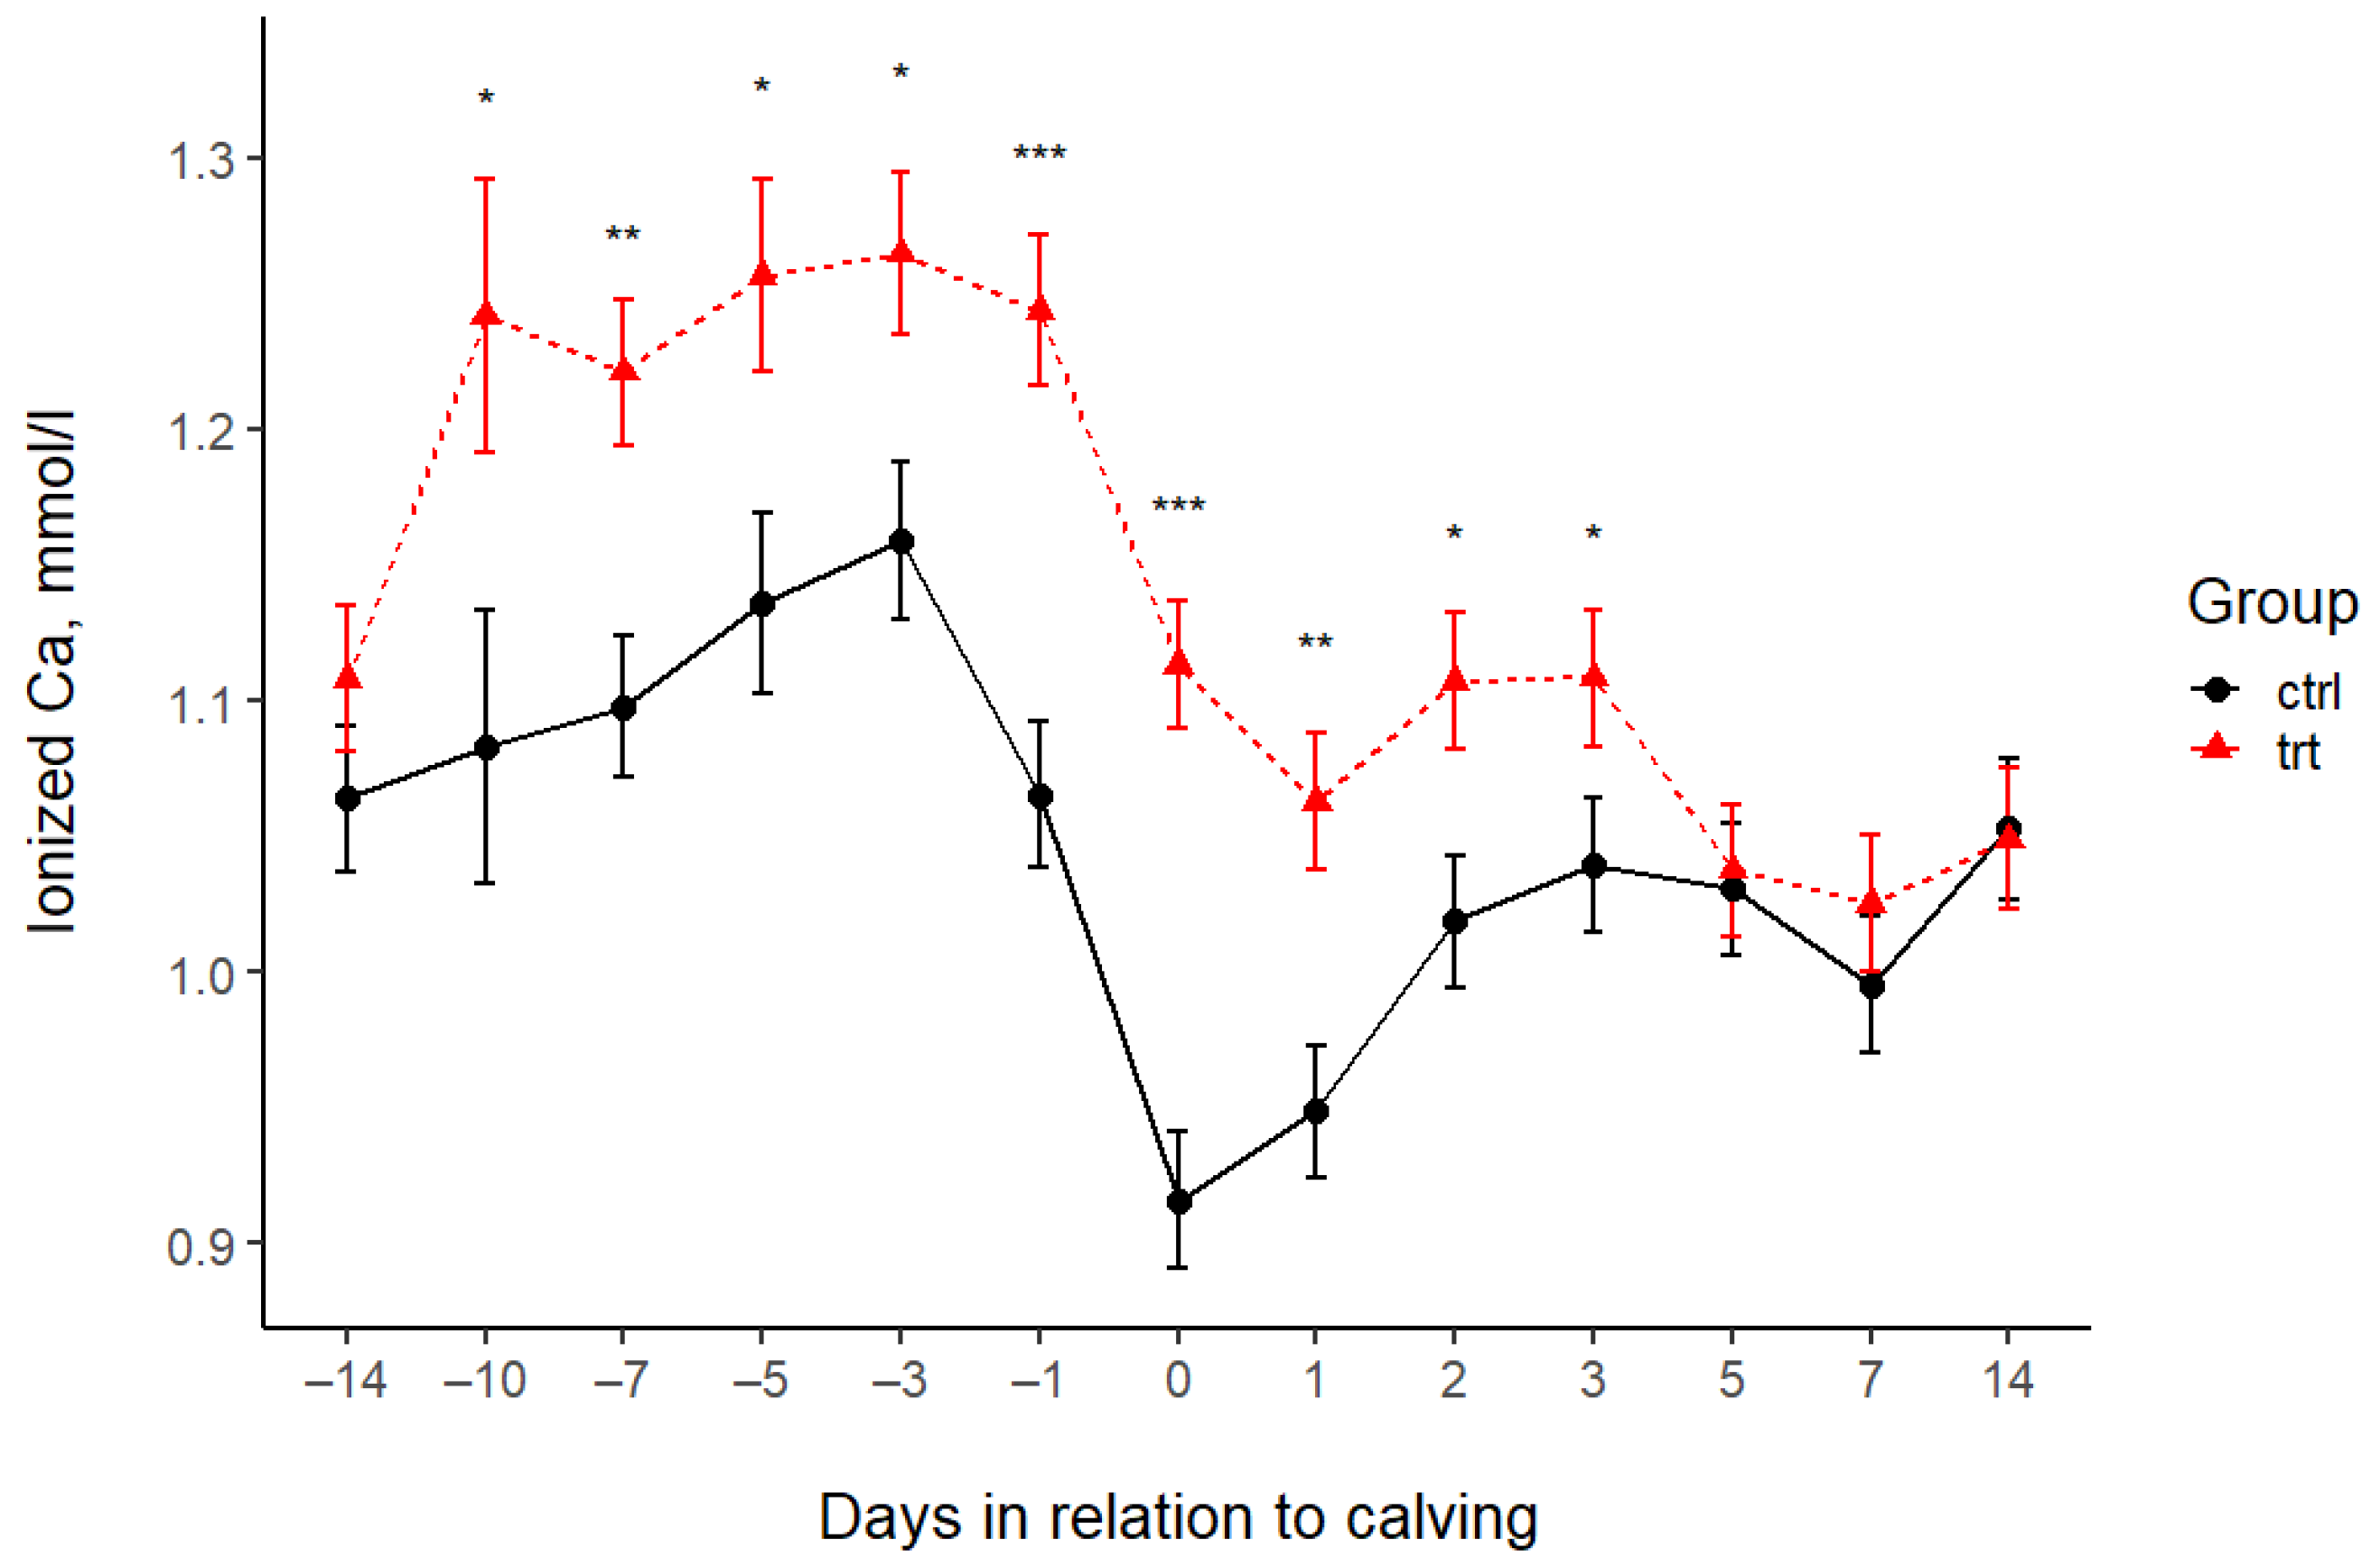
| Ionized Ca (mmol/L) | |||||||||||||||||
| Control | 1.06 | 1.08 | 1.10 | 1.14 | 1.16 | 1.07 | 0.92 | 0.95 | 1.02 | 1.04 | 1.03 | 1.00 | 1.05 | 0.03 | <0.001 | <0.001 | 0.0005 |
| Treated | 1.11 | 1.24 | 1.22 | 1.26 | 1.26 | 1.24 | 1.11 | 1.06 | 1.11 | 1.11 | 1.04 | 1.03 | 1.05 | 0.03 | |||
| p-value (pairwise) | 0.246 | 0.025 | 0.001 | 0.013 | 0.012 | <0.001 | <0.001 | 0.001 | 0.012 | 0.049 | 0.838 | 0.402 | 0.913 | 0.05 | |||
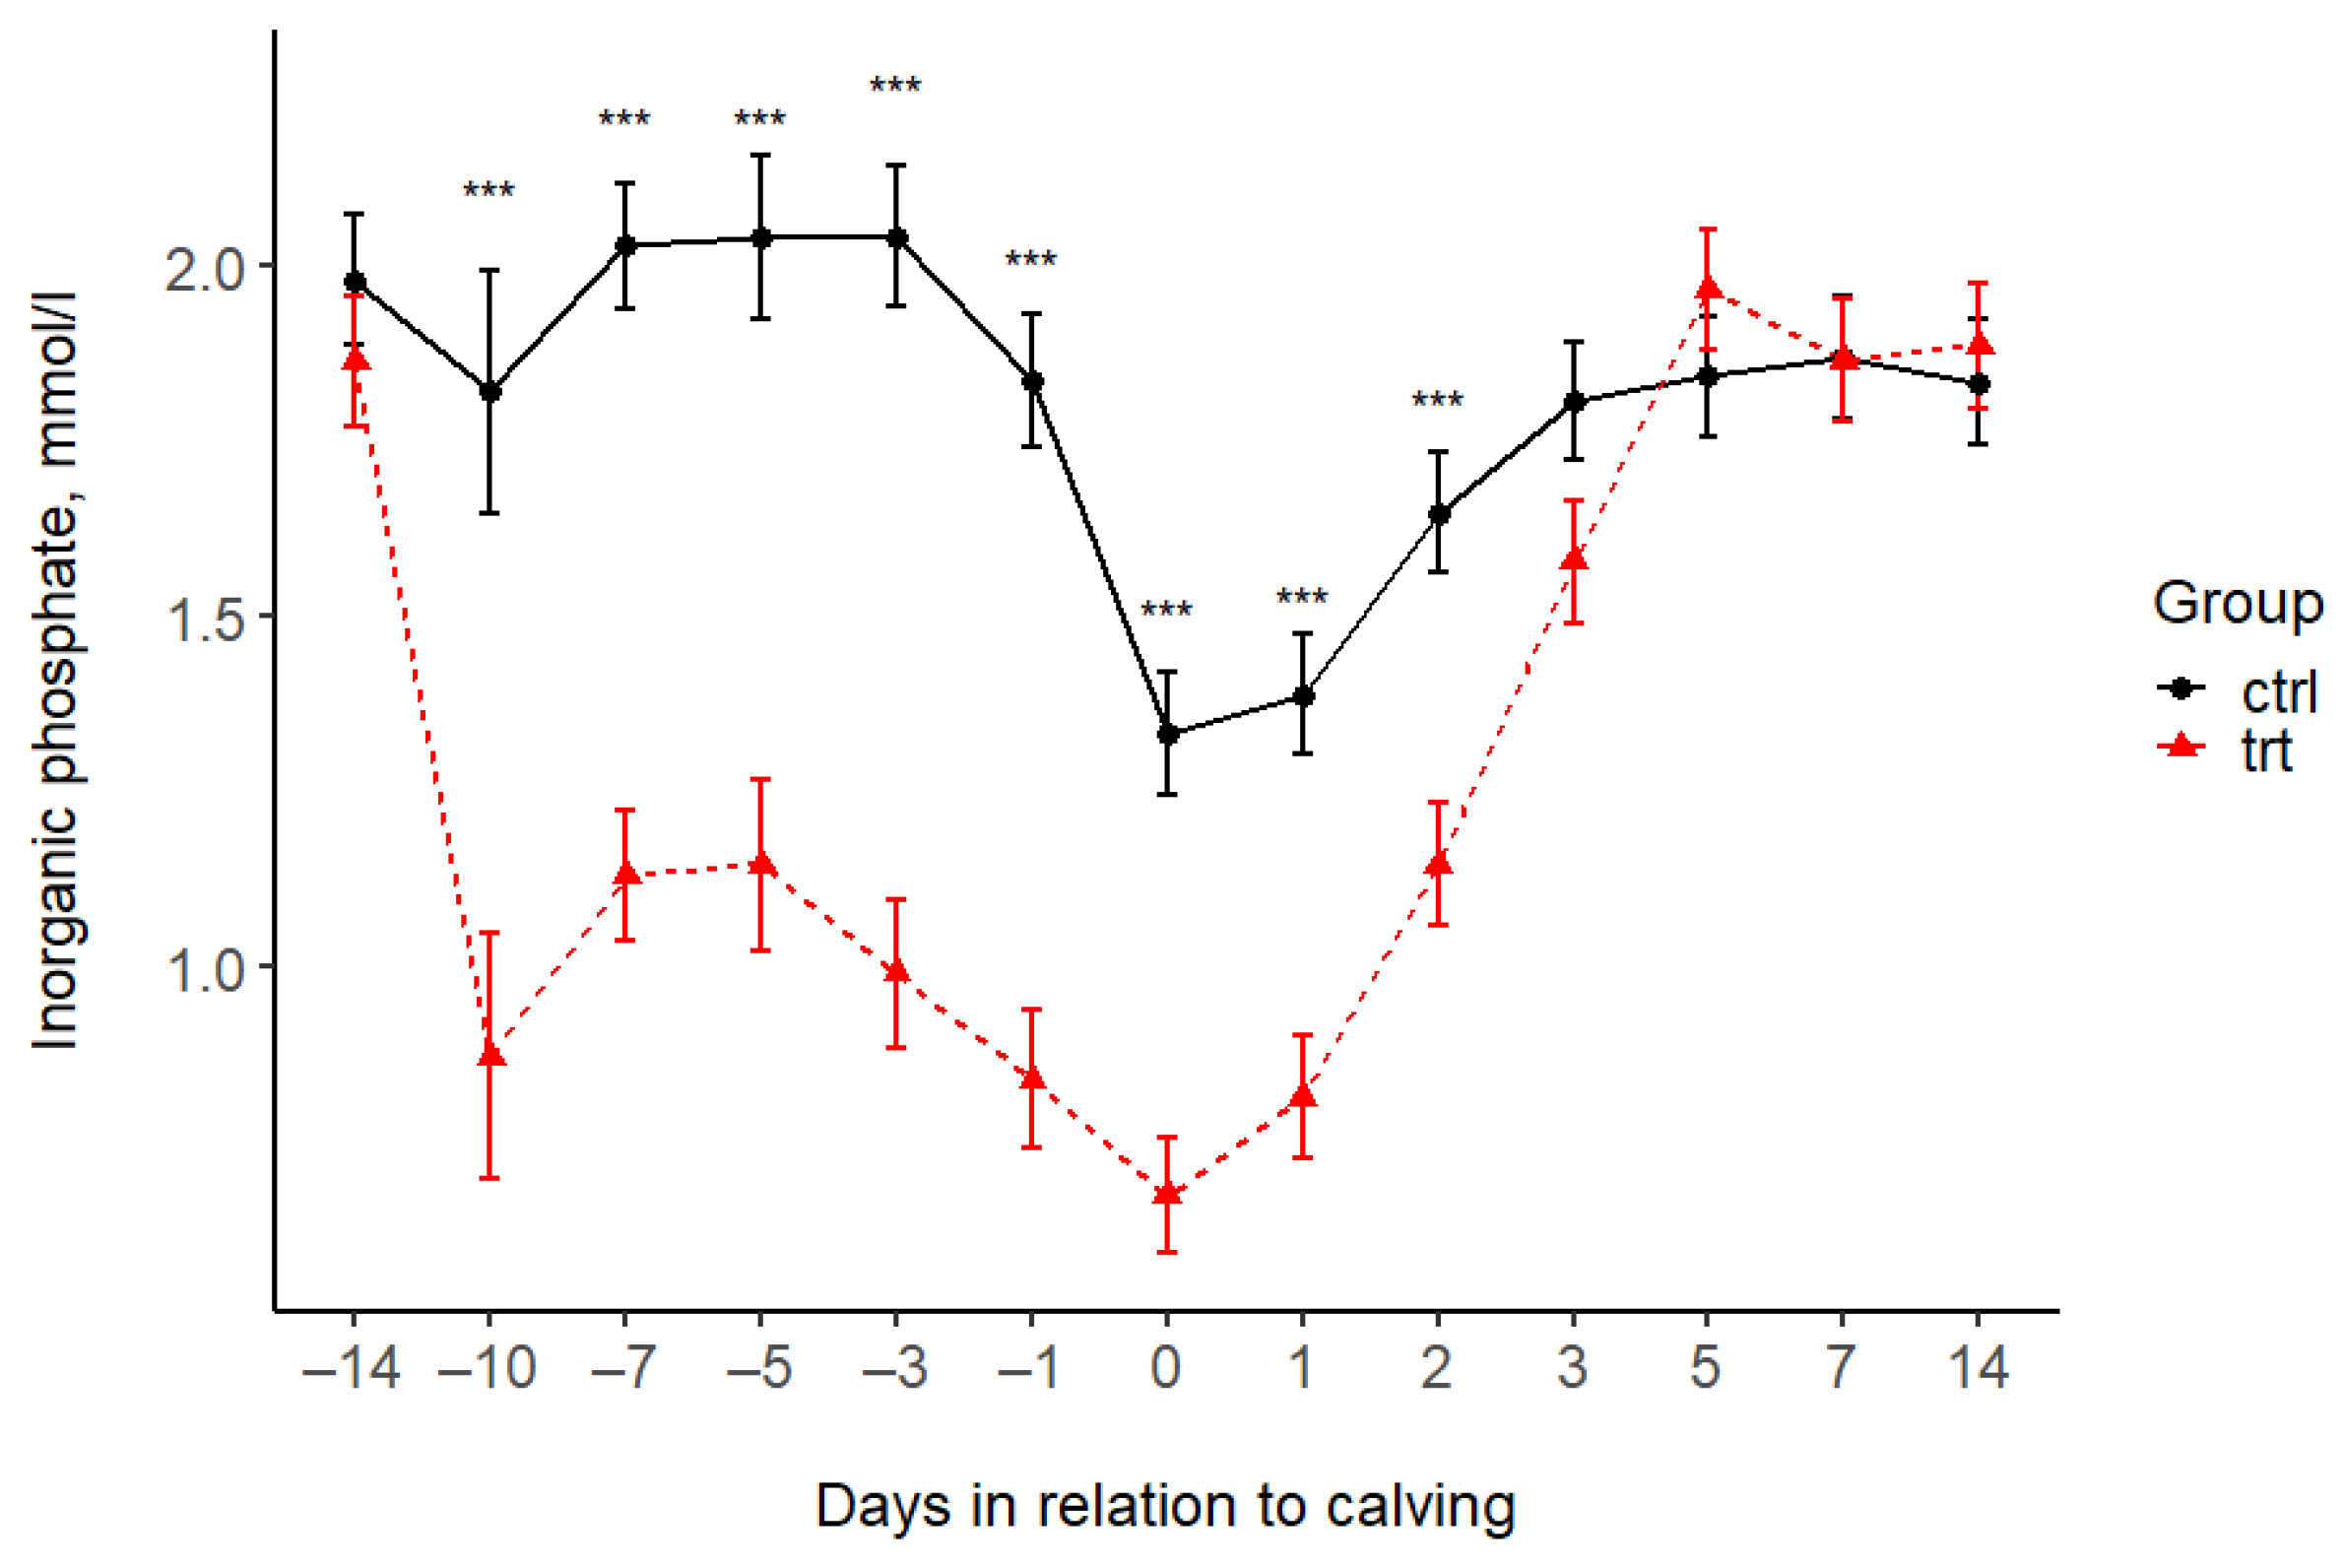
| Phosphorus (mmol/L) | |||||||||||||||||
| Control | 1.98 | 1.82 | 2.03 | 2.04 | 2.04 | 1.84 | 1.33 | 1.39 | 1.65 | 1.81 | 1.84 | 1.87 | 1.83 | 0.1 | <0.001 | <0.001 | <0.001 |
| Treated | 1.86 | 0.87 | 1.13 | 1.14 | 0.99 | 0.84 | 0.67 | 0.81 | 1.15 | 1.58 | 1.96 | 1.86 | 1.88 | 0.1 | |||
| p-value (pairwise) | 0.378 | <0.001 | <0.001 | <0.001 | <0.001 | <0.001 | <0.001 | <0.001 | <0.001 | 0.061 | 0.305 | 0.984 | 0.686 | ||||
| Magnesium (mmol/L) | |||||||||||||||||
| Control | 0.90 | 1.01 | 0.93 | 1.00 | 0.97 | 0.95 | 1.03 | 1.01 | 0.92 | 0.82 | 0.81 | 0.91 | 0.97 | 0.04 | 0.152 | <0.001 | 0.002 |
| Treated | 0.88 | 0.98 | 0.94 | 0.87 | 0.90 | 0.90 | 0.84 | 0.93 | 0.86 | 0.85 | 0.87 | 0.85 | 1.03 | 0.04 | |||
| p-value (pairwise) | 0.719 | 0.713 | 0.755 | 0.048 | 0.209 | 0.302 | <0.001 | 0.112 | 0.197 | 0.645 | 0.214 | 0.215 | 0.233 | ||||
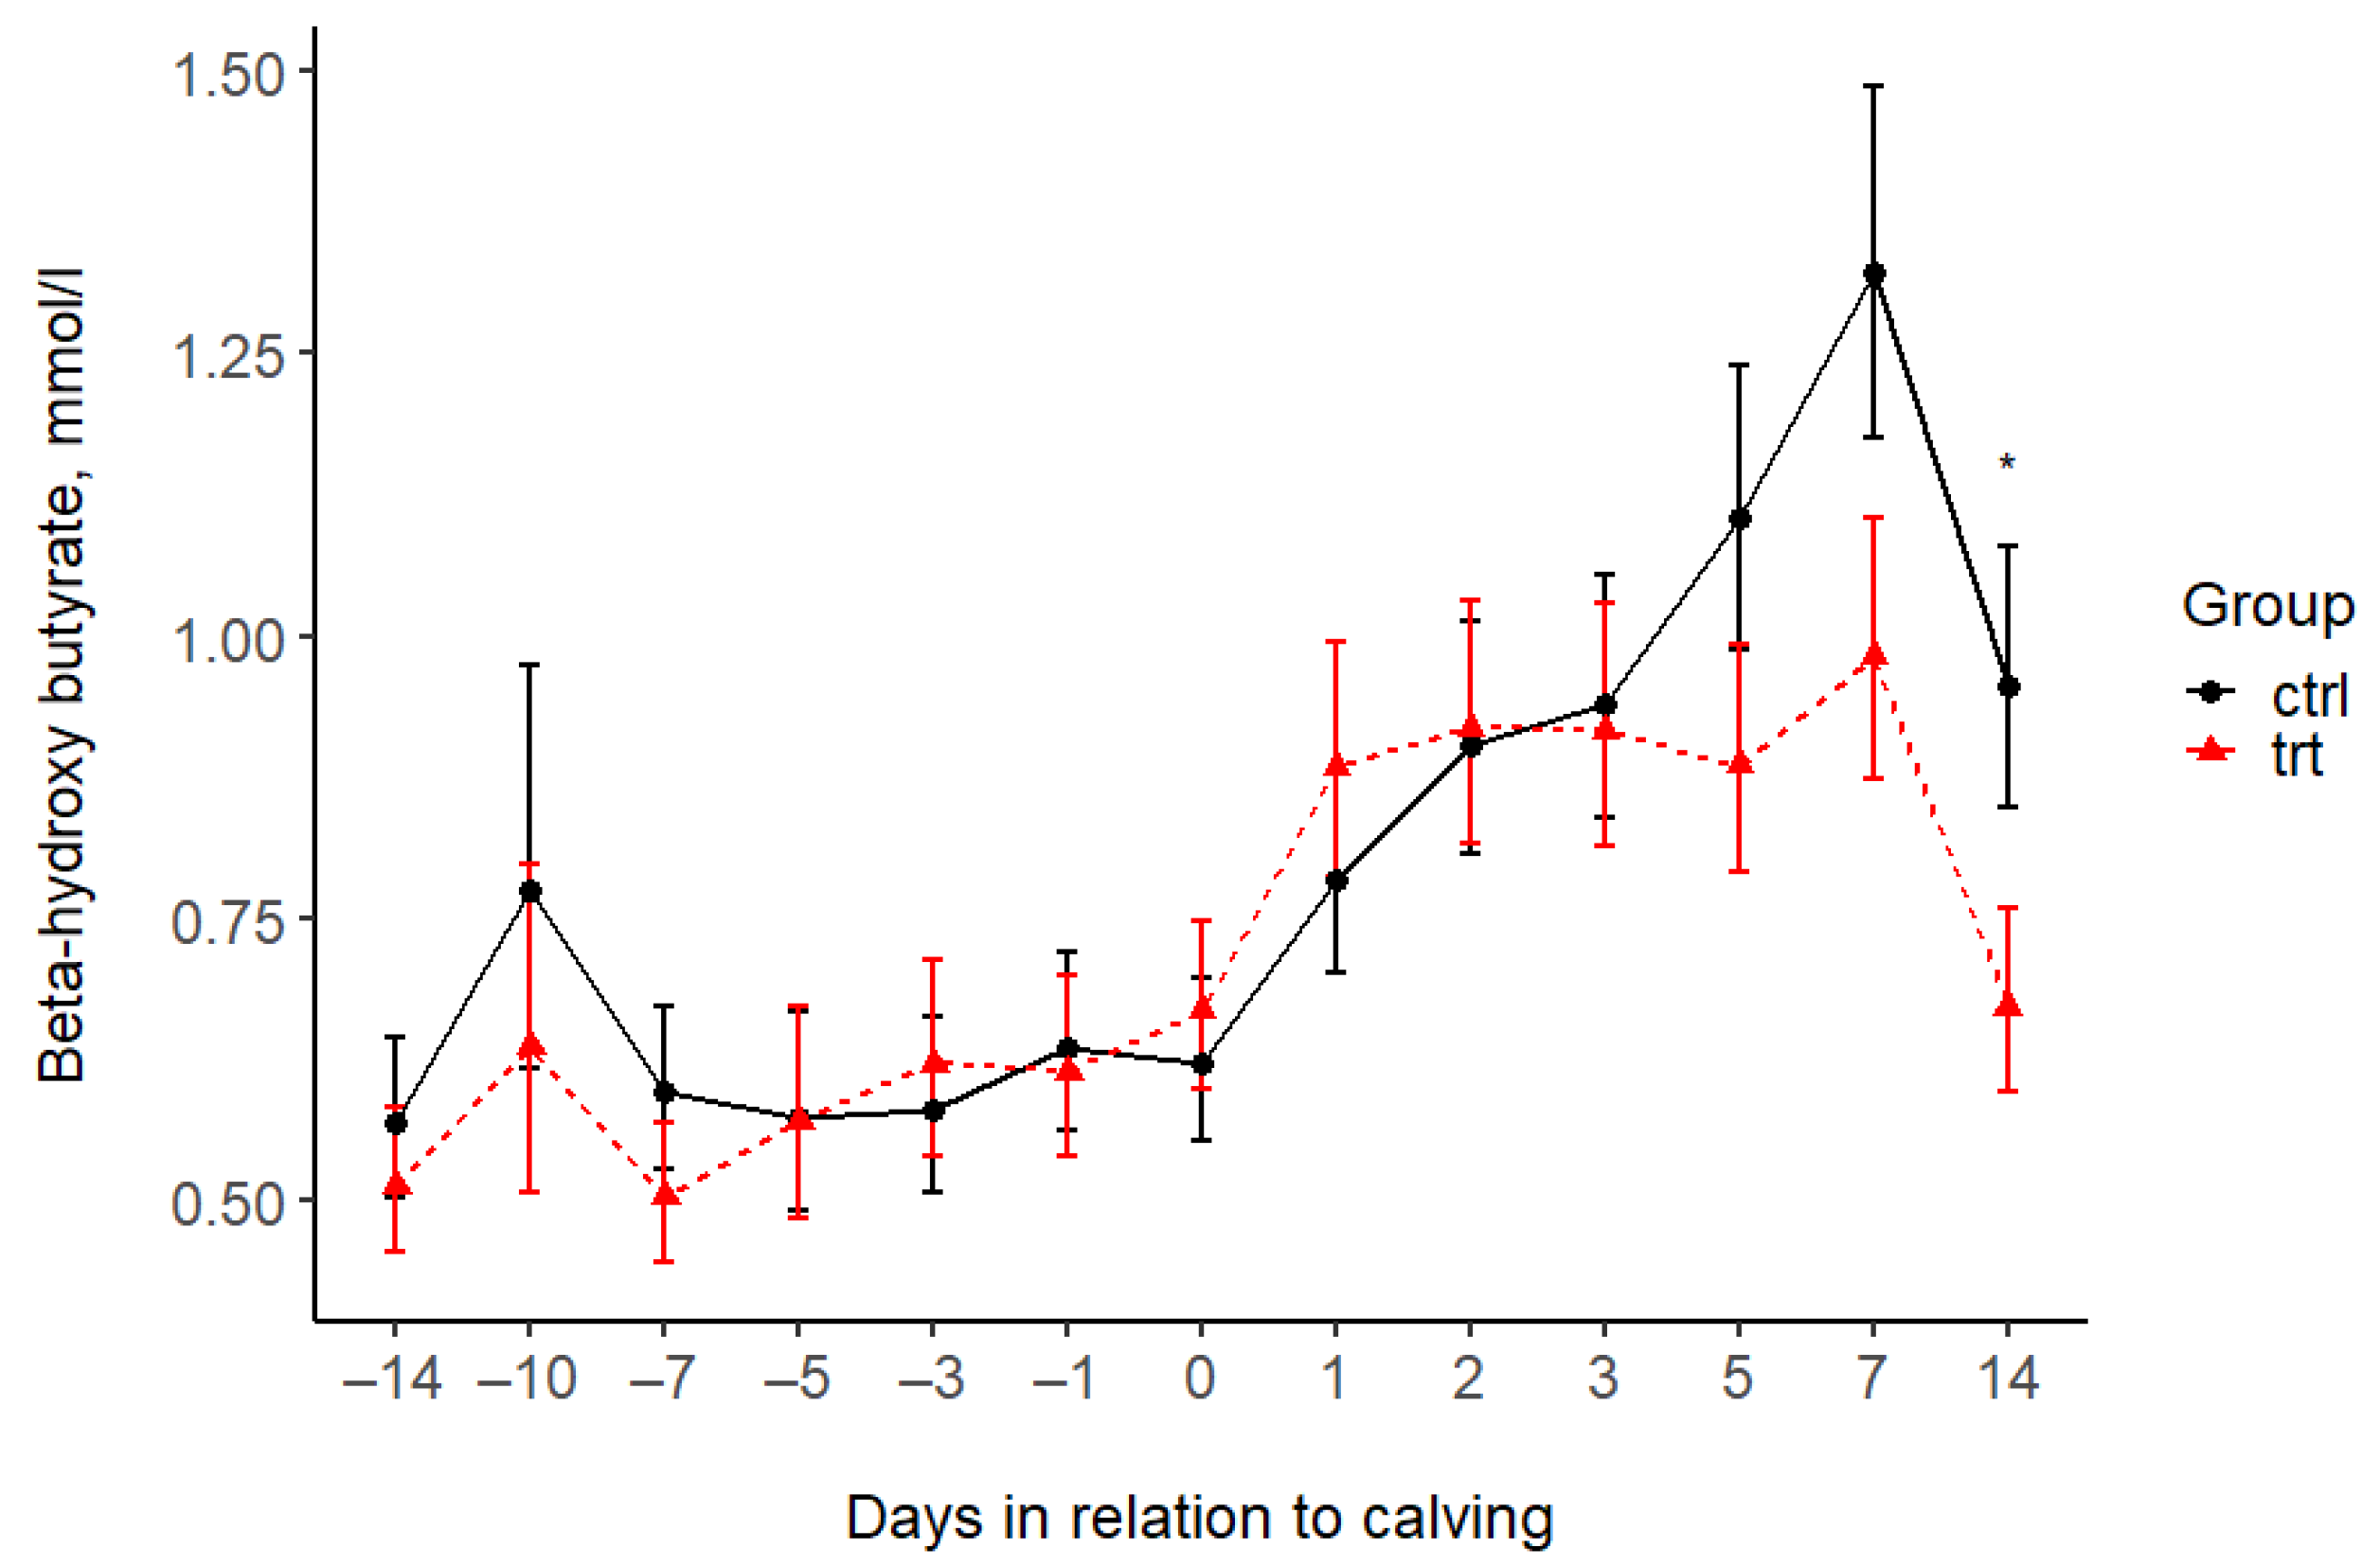
| BHB (mmol/L) *** | |||||||||||||||||
| Control | 0.57 | 0.77 | 0.60 | 0.57 | 0.58 | 0.64 | 0.62 | 0.78 | 0.90 | 0.94 | 1.11 | 1.32 | 0.96 | 0.07 | 0.259 | <0.001 | 0.568 |
| Treated | 0.51 | 0.64 | 0.50 | 0.57 | 0.62 | 0.61 | 0.67 | 0.88 | 0.92 | 0.92 | 0.89 | 0.98 | 0.67 | 0.07 | |||
| p-value (pairwise) | 0.565 | 0.539 | 0.330 | 0.983 | 0.728 | 0.848 | 0.648 | 0.466 | 0.923 | 0.871 | 0.167 | 0.072 | 0.038 | ||||
| Subclinical Hypocalcemia (tCa < 2.1 mmol/L) | Subclinical Hypocalcemia (iCa < 1.05 mmol/L) | |||||
|---|---|---|---|---|---|---|
| Time After Calving | Control | Treated | p-Value | Control | Treated | p-Value |
| 12 h | 10 (59%) | 4 (24%) | 0.0798 | 12 (71%) | 5 (29%) | 0.0380 |
| 24 h | 7 (41%) | 3 (18%) | 0.2587 | 13 (77%) | 6 (35%) | 0.0366 |
| 48 h | 5 (29%) | 3 (18%) | 0.6880 | 11 (65%) | 5 (29%) | 0.0844 |
| Item | Period | TRT | CTRL | p-Value |
|---|---|---|---|---|
| The number of days in hypocalcemia, based on iCa concentrations | total | 3(2–4) | 5(4–7) | 0.0015 |
| prepartum | 0(0–0) | 1(0–2) | 0.0082 | |
| postpartum | 3(2–3) | 4(3–5) | 0.0067 | |
| The minimum iCa concentration (mmol/L) | total | 0.94 ± 0.015 | 0.85 ± 0.026 | 0.0070 |
| prepartum | 1.1 ± 0.015 | 1.02 ± 0.016 | 0.0009 | |
| postpartum | 0.94 ± 0.016 | 0.85 ± 0.026 | 0.0064 | |
| The number of days in hypocalcemia, based on tCa concentrations | total | 1(0–1) | 2(1–4) | 0.0374 |
| prepartum | 1(0–1) | 0(0–0) | 0.3087 | |
| postpartum | 0(0–0) | 2(1–4) | 0.0460 | |
| The minimum tCa concentration (mmol/L) | total | 2.01 ± 0.038 | 1.81 ± 0.064 | 0.0131 |
| prepartum | 2.21 ± 0.037 | 2.17 ± 0.029 | 0.3935 | |
| postpartum | 2.01 ± 0.038 | 1.81 ± 0.064 | 0.0131 |
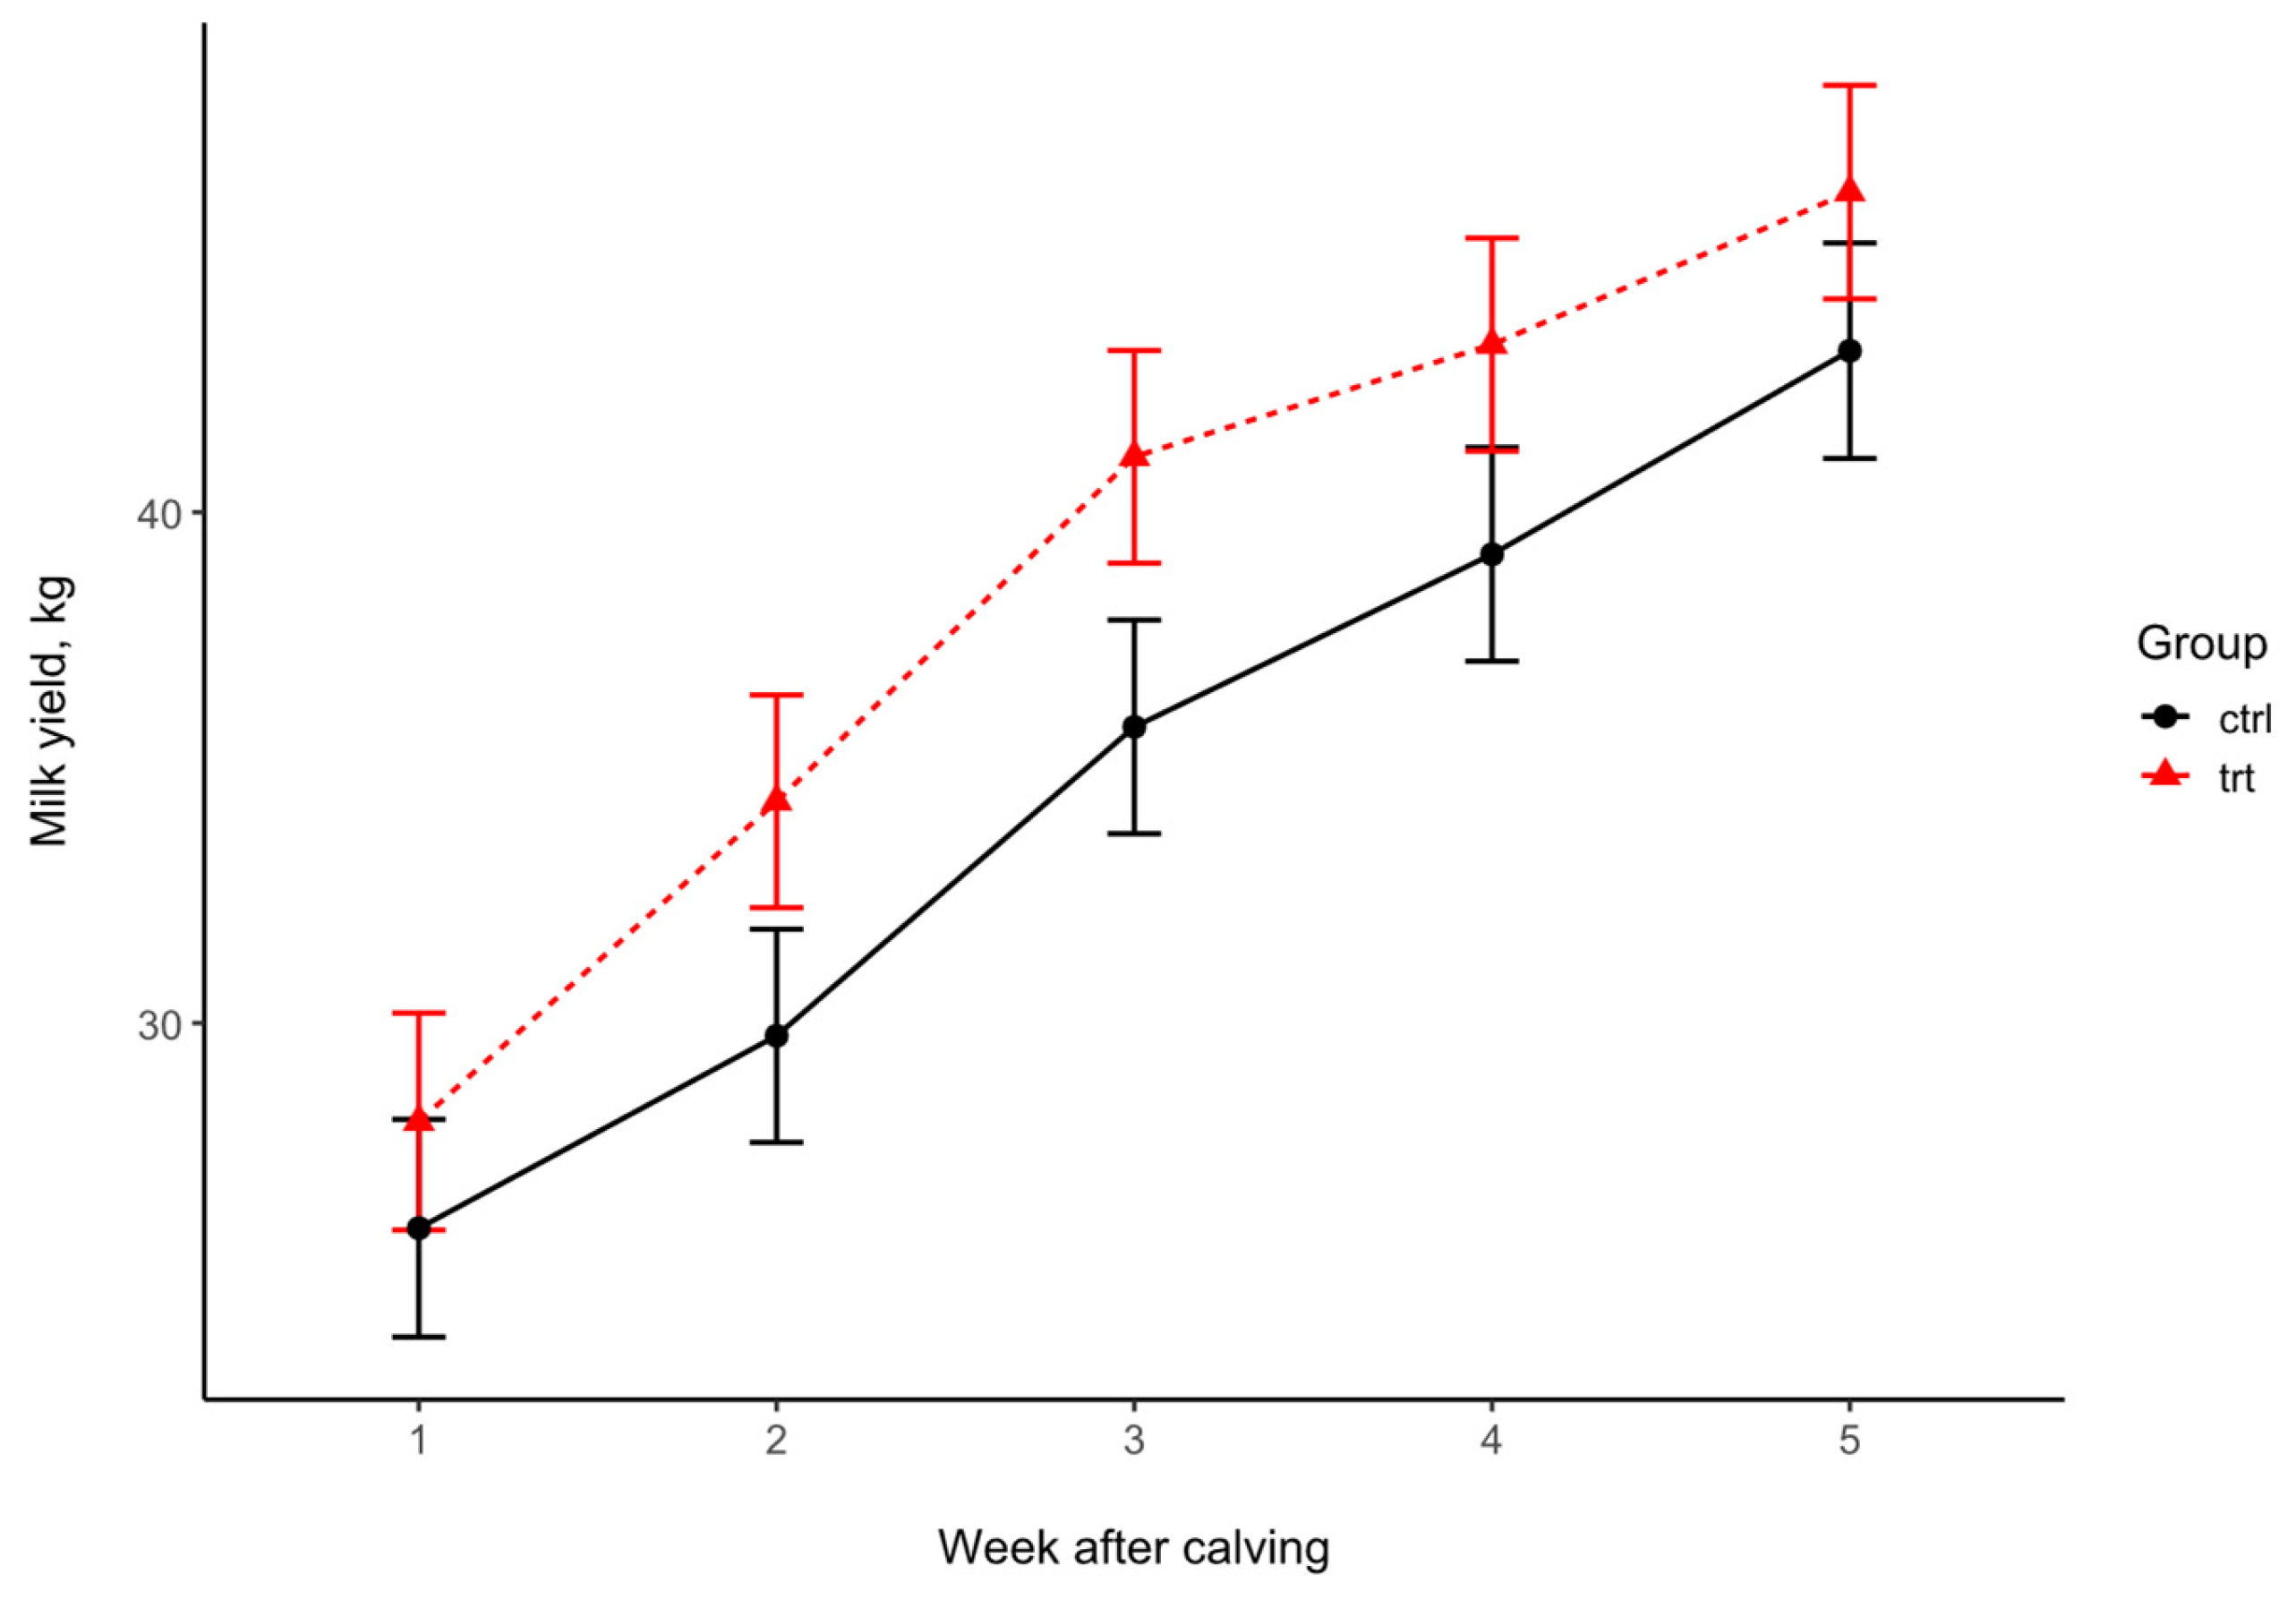
| Milk Yield | Weeks After Calving | p-Value | |||||||
|---|---|---|---|---|---|---|---|---|---|
| Sampling | 1 | 2 | 3 | 4 | 5 | SEM | Trt | Week | Trt × Week |
| Control | 25.99 | 29.75 | 35.80 | 39.18 | 43.16 | 2.09 | 0.165 | <0.001 | 0.084 |
| Treated | 28.07 | 34.34 | 41.08 | 43.28 | 46.26 | ||||
| p-value (pairwise) | 0.492 | 0.129 | 0.083 | 0.174 | 0.303 | ||||
| Day 2 | Day 7 | ||||||
|---|---|---|---|---|---|---|---|
| Treated | Control | Treated | Control | ||||
| Animal No. | Al (mg/L) | Animal No. | Al (mg/L) | Animal No. | Al (mg/L) | Animal No. | Al (mg/L) |
| 2 | <0.1 * | 48 | NA | 2 | <0.1 | 48 | 0.22 |
| 23 | <0.1 | 108 | <0.1 | 23 | <0.1 | 108 | <0.1 |
| 157 | 0.22 | 129 | 0.1 | 157 | <0.1 | 129 | 0.15 |
| 181 | <0.1 | 154 | <0.1 | 181 | <0.1 | 154 | <0.1 |
| 5014 | <0.1 | 156 | <0.1 | 5014 | <0.1 | 156 | <0.1 |
| 5147 | <0.1 | 178 | 0.16 | 5147 | <0.1 | 178 | <0.1 |
| 5280 | <0.1 | 220 | 0.34 | 5280 | NA | 220 | 0.28 |
| 5438 | 0.34 | 5033 | <0.1 | 5438 | <0.1 | 5033 | <0.1 |
| 5838 | <0.1 | 5166 | <0.1 | 5838 | <0.1 | 5166 | 0.54 |
| 6151 | <0.1 | 5629 | <0.1 | 6151 | 0.35 | 5629 | <0.1 |
| 6539 | <0.1 | 5669 | <0.1 | 6539 | <0.1 | 5669 | <0.1 |
| 7084 | <0.1 | 6949 | <0.1 | 7084 | 0.16 | 6949 | <0.1 |
| 7251 | 0.14 | 7800 | <0.1 | 7251 | 0.16 | 7800 | <0.1 |
| 8164 | <0.1 | 8083 | 0.28 | 8164 | 0.35 | 8083 | <0.1 |
| 8283 | 0.15 | 8207 | 0.14 | 8283 | <0.1 | 8207 | <0.1 |
| 8373 | <0.1 | 8384 | <0.1 | 8373 | <0.1 | 8384 | <0.1 |
| 8597 | <0.1 | 8440 | <0.1 | 8597 | <0.1 | 8440 | <0.1 |
Disclaimer/Publisher’s Note: The statements, opinions and data contained in all publications are solely those of the individual author(s) and contributor(s) and not of MDPI and/or the editor(s). MDPI and/or the editor(s) disclaim responsibility for any injury to people or property resulting from any ideas, methods, instructions or products referred to in the content. |
© 2025 by the authors. Licensee MDPI, Basel, Switzerland. This article is an open access article distributed under the terms and conditions of the Creative Commons Attribution (CC BY) license (https://creativecommons.org/licenses/by/4.0/).
Share and Cite
Jurkovich, V.; Bakony, M.; Theilgaard, P.; Kovács, L.; Fébel, H. Effects of a Phosphorus-Binding Feed Supplement on the Blood P and Ca Levels in Dairy Cows. Animals 2025, 15, 959. https://doi.org/10.3390/ani15070959
Jurkovich V, Bakony M, Theilgaard P, Kovács L, Fébel H. Effects of a Phosphorus-Binding Feed Supplement on the Blood P and Ca Levels in Dairy Cows. Animals. 2025; 15(7):959. https://doi.org/10.3390/ani15070959
Chicago/Turabian StyleJurkovich, Viktor, Mikolt Bakony, Per Theilgaard, Levente Kovács, and Hedvig Fébel. 2025. "Effects of a Phosphorus-Binding Feed Supplement on the Blood P and Ca Levels in Dairy Cows" Animals 15, no. 7: 959. https://doi.org/10.3390/ani15070959
APA StyleJurkovich, V., Bakony, M., Theilgaard, P., Kovács, L., & Fébel, H. (2025). Effects of a Phosphorus-Binding Feed Supplement on the Blood P and Ca Levels in Dairy Cows. Animals, 15(7), 959. https://doi.org/10.3390/ani15070959