1. Introduction
As part of precision farming, managing livestock is one of the current challenges for agriculture [
1]. Precision livestock farming (PLF), a term that appeared in the early 21st century with the first PLF conference held in 2003 [
2], follows an innovative production system approach [
3], which plays a key role in the fourth industrial revolution [
4]. Precision livestock farming is potentially one of the most powerful developments and has the potential to revolutionize the livestock farming industry, together with artificial intelligence (AI), machine learning, and other technologies [
5]. The three pillars of sustainability that PLF focuses on are social (human society), economic (production), and environmental (the monitoring of emissions and other impacts) [
6,
7]. This research focuses on the financial pillar of PLF in the feedlot, namely, precision feeding through a profit maximizing reformulation [
8].
Precision livestock feeding, on the other hand, has multiple meanings. The efficient input approach to obtaining maximum and cost-effective outputs is recognized [
7]. In this study, the focus is on feeder calves that have been categorized into established production profiles and we investigate three separate dietary interventions and their effect on the PP classification [
9]. Precision animal nutrition, or precision feeding, is an integrated information-based approach to optimize the supply and demand of nutrients to animals in real time for target performance, profitability, product characteristics, and environmental outcomes [
10,
11]. This practice can significantly reduce protein intake by 25% and nitrogen excretion by 40% while increasing profitability by nearly 10% [
11]. Precision feeding not only improves feed efficiency and animal welfare but also addresses environmental sustainability by reducing feed wastage and nutrient excretion, thereby mitigating greenhouse gas emissions and water pollution [
12].
Precision feeding aims to match the nutrient supply precisely with the nutrient requirement of a feeder calf [
13,
14]. In the feedlot industry, more often than not, a feeder pen is made up of feeder calves that have different growth potentials. These animals are then fed with an average diet. Very little is published in terms of precision feeding in feeder calves. When growth maximization is the objective of the commercial production system, like the feedlot, nutrients must be provided at a level that will allow the most nutrient-demanding animals in the group to express their growth potential [
15]. The current practice of providing a common diet to the group in the pen does not ensure a maximum economic return for all the animals in a sustainable manner. i.e., poor economic efficiency [
15]. The potential can be unlocked by precision feeding to the potential, and this promises to affect the value of gain, reduce the cost of gain, improve the economic returns, and contribute to the economic pillar of sustainable livestock production.
The feed, after the purchase price of the feeder calf, is the second highest contributor to the total cost of producing a beef carcass [
16,
17,
18]. Tailoring the supply, quality, and quantity of the nutrient supply to the requirements for maximum profit further supports the economic pillar of sustainable livestock farming.
The literature contains numerous publications on general agricultural precision farming. This is a well-researched and already-implemented practice in agriculture. The poultry sector has some documented attempts at precision farming as far back as 2003 [
2], and others have followed in the pig and dairy industries [
7,
19]. With the application of precision feeding in the pig production system, an increase in profitability of nearly 10% has been reported [
19], which emphasizes the inherent potential of such an approach. To our knowledge, the feedlot industry has no published information available. Venter, in her master’s thesis (2019), investigates the precision feeding of Nguni steers under feedlot conditions [
20]. She uses different diets, different roughage inclusions, and different metabolizable energy levels to establish the best fit for the growth requirement of the Nguni breed in a South African feedlot. Subsequently, Linde et al. (2023) investigated the gene expression of South African beef breeds (Bonsmara and Nguni) fed different diets and found that genes are expressed differently under different dietary conditions for both breeds, with little breed interaction [
21].
The nutrient supply is by diet formulation and macro composition only. Macro-composition is the matching and changing of raw materials in the diet formulation for growth with energy and protein as the main consideration [
22,
23] and as discussed in the Nutrient
Requirements of Beef Cattle Eighth revised edition. This is carried out by formulating diets for maximum precision for growth [
24,
25,
26], which has more recently been challenged by refocusing on maximum profit [
8]. This does not include micro compositions like enzymes, microminerals, and other micro-ingredients that support growth and form part of a balanced diet for this study. In the process of achieving the maximum growth and accuracy of precision feeding for growth, this study is at the point of feeding a total mixed ration and nutritional grouping. The nutritional grouping is based on the genotype that is expressed in the phenotype and categorized in the PP [
9]. This study does not consider precision feeding aspects related to the feeding process flow, like diet intake, diet delivery, and diet mixing. See
Figure 1. This study addresses only one of the three pillars of sustainability, namely, the production (economic) pillar [
7].
This study aims to establish the potential value of precision feeding production profiled feeder calves in the feedlot.
The objectives of the study are as follows:
To establish the principle of precision livestock feeding, by matching the nutrient supply to growth potential;
To prove the value of the precision livestock feeding concept, based on some economically important feedlot production traits;
To establish the relevance of implementing precision livestock feeding in the South African feedlot industry.
The successful realization of the objectives will make a meaningful contribution to the South African feedlot industry and possibly globally.
2. Materials and Methods
This study is a prospective observational study in two South African beef feedlots and was approved by the Animal Ethics Committee of the University of Pretoria (AEC no 192-21 and 051-23).
The categorization of the feeder calves into production profiles before the feeding period was carried out per Hentzen and Holm [
9]. In short, the animals were classified into production potential groups based on the composite observable characteristics or traits (phenotype) of muscular and skeletal development, ratios thereof, and body capacity. Muscular and skeletal development, which is better than average, was classified as PP1, whereas PP2 represented animals with average production potential. PP3 had the poorest muscular and skeletal development, which predicts below average feedlot production.
Feeder calves enrolled in this study were fed three different feedlot diets, formulated by feedlot nutritionists, registered with the South African Council for Natural Scientific Professions (SACNASP), and fed according to general feedlot norms. The average diet, medium-producing diet (MPD), was the diet formulated to general feedlot norms and considered the norm for average feeder calves. It was the diet fed in the respective feedlots and was considered as the control diet. The high-producing diet (HPD) was formulated to supply nutrients in a balanced feedlot diet, that supports additional growth. The low-producing diet (LPD) was formulated to supply nutrients for the demand of the slow-growth cattle.
To establish the value of PP in feeder calves, and data optimization, a two-experiment approach was considered. The goal of both experiments was the same: to generate data that support the value of PLF in beef feedlots and move away from feeding to the average animal. Experiment 1 was performed in a commercial feedlot. Results from experiment 1 were analyzed and considered in the reformulation of diets for experiment 2. In experiment 2, we fed animals by PP class and treatment (diet) in individual and grouped pens at an experimental farm. This approach had the additional advantage of analyzing on a per-pen basis. Furthermore, data regarding the economic value of feeding to the PP within a pen provided PP-specific intake data and feed costs, and, therefore, contributed to the economic analysis [
27]. This was not possible in experiment 1. To our knowledge, experiment 2 is the first time animals were fed different diets, per PP classification. We could not find a suitable-sized feedlot that could accommodate both experiments in one location, and in one study, hence the two-experiment approach.
2.1. Experiment 1
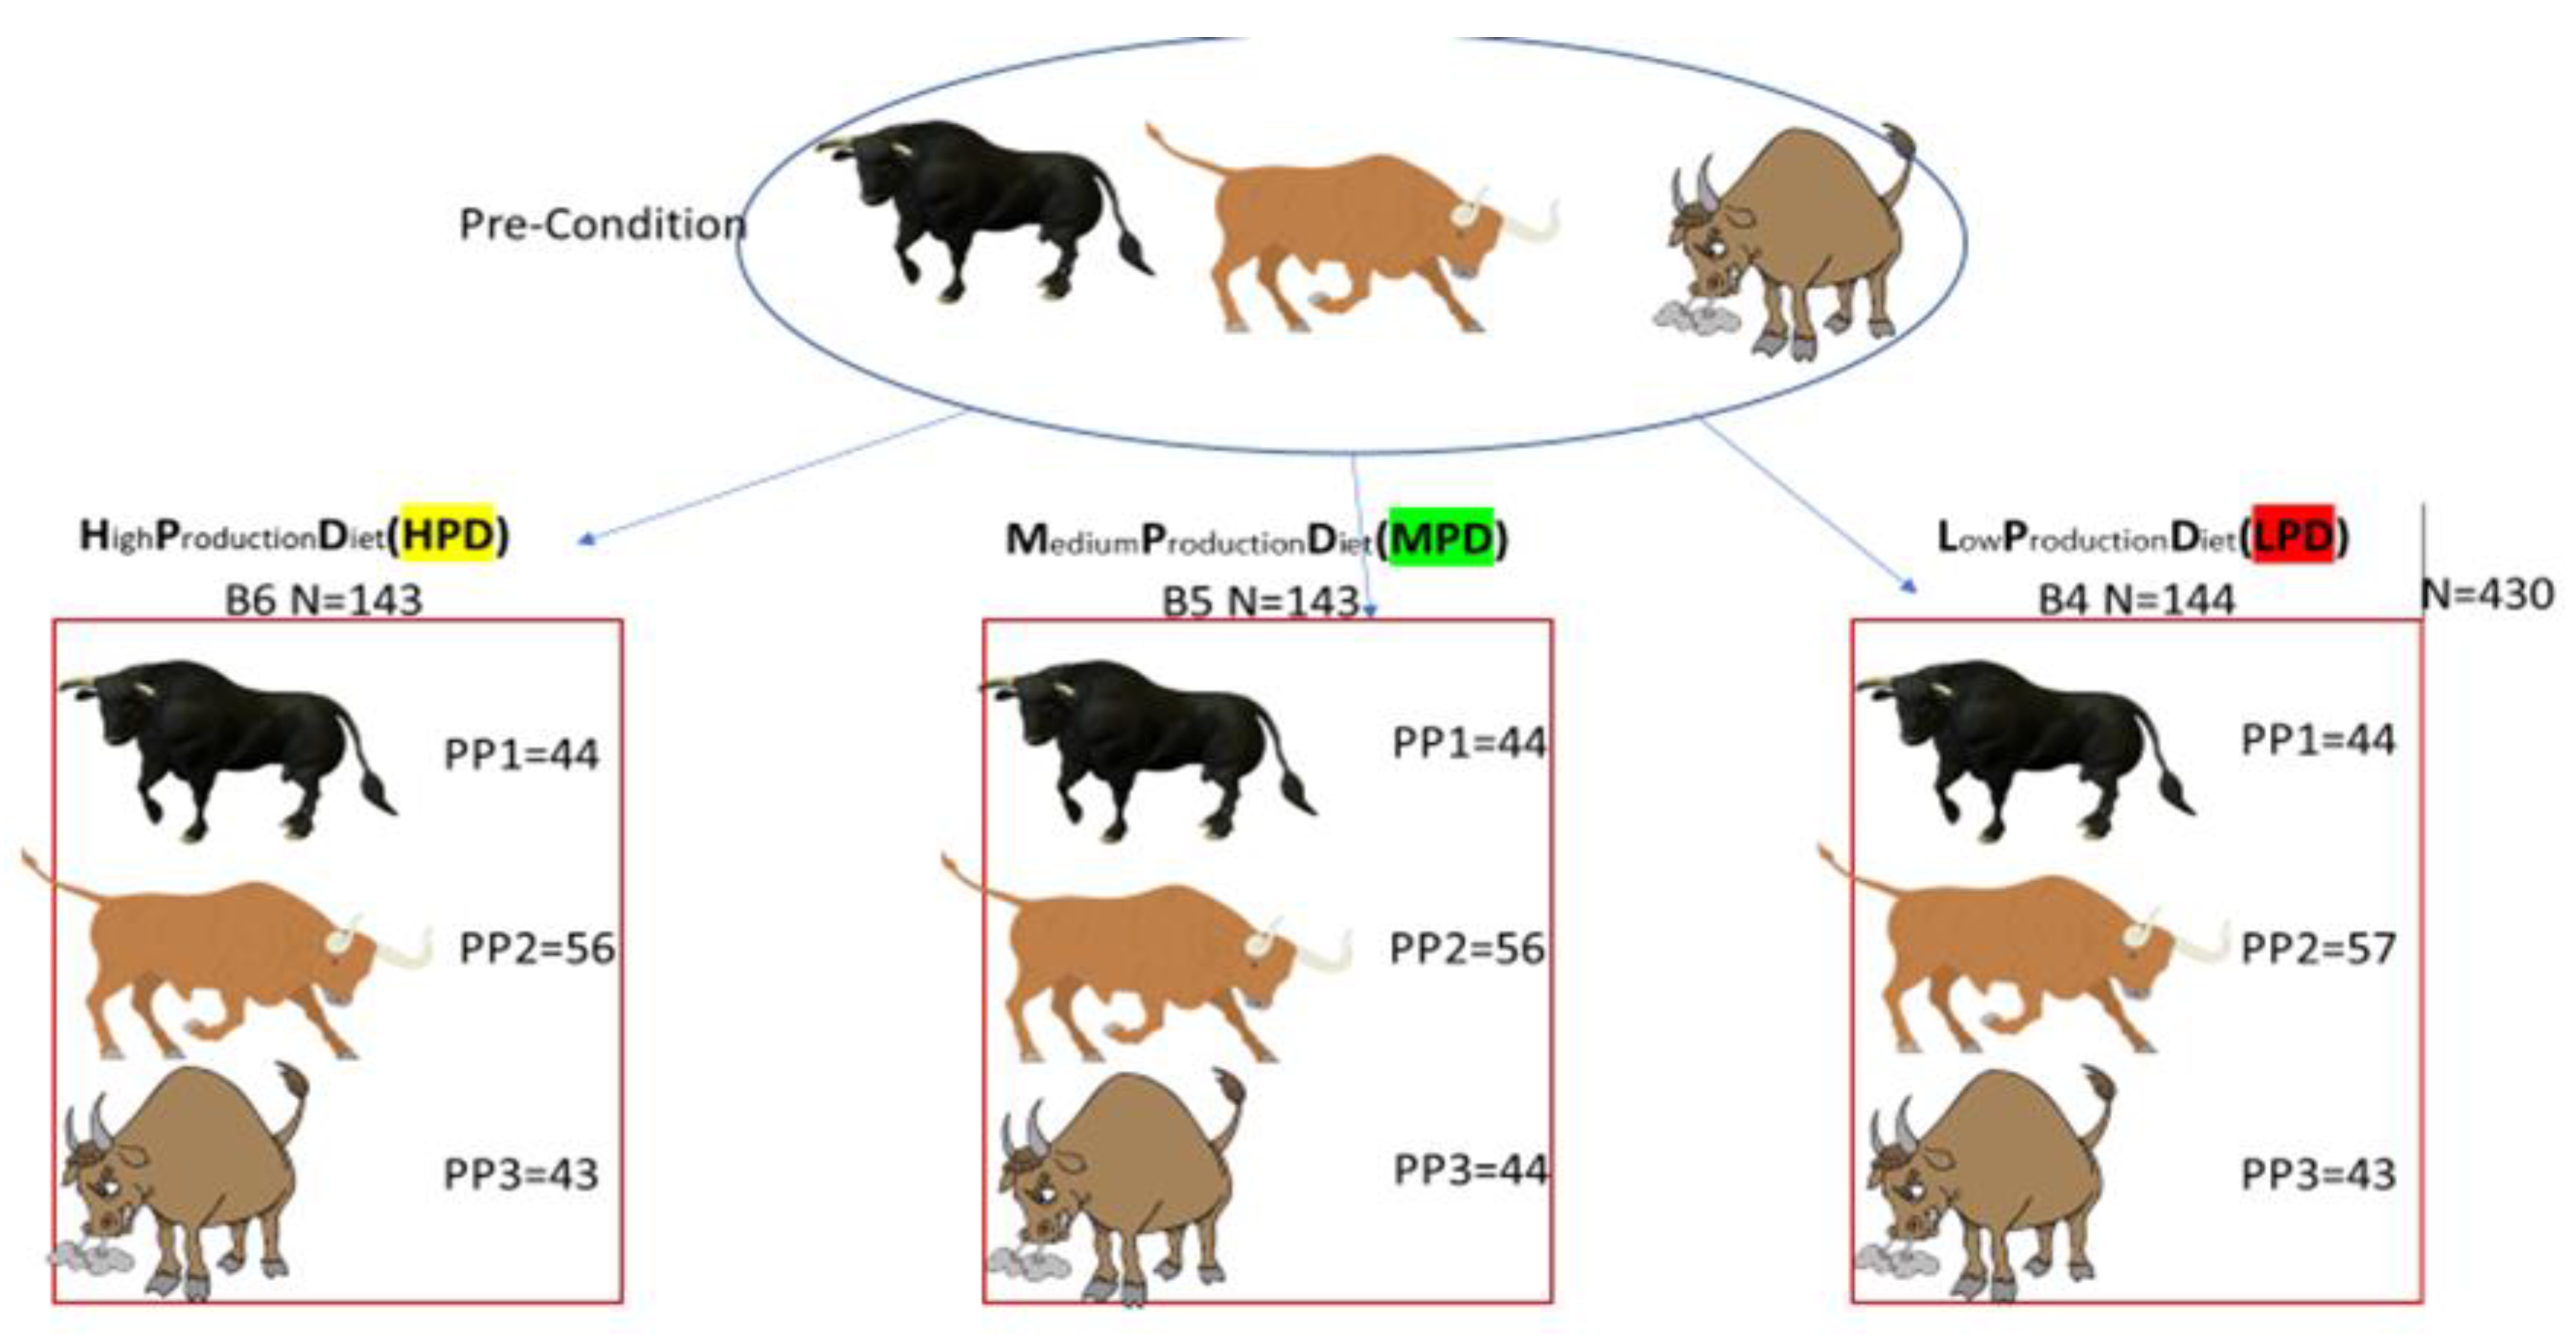
In experiment 1, three feedlot pens (numbered B4, B5, and B6) in a commercial feedlot were each populated with an equal number of representatives of PP 1, PP 2, and PP 3 (
Figure 2). PP 2 was made up of an equal number of PP 2+ and PP 2– animals. Each of the three feedlot pens was fed a different diet. Animals in pen B4 were fed the HPD, pen B5 the MPD, and pen B6 the LPD. This study design had the closest resemblance to a commercial feedlot.
2.1.1. Phenotypic PP Classification
The study animals were individually evaluated by an experienced observer, who is a specialist veterinarian (the author), on their phenotypic appearances. The development of the PP classification system evolved over eight years. Other studies have demonstrated the repeatability of similar methodologies, which have been used in research [
28,
29]. The animal’s inclusion criteria for classification were the composite observable characteristics or traits (phenotype) of muscular and skeletal development, ratios thereof, and body capacity. Considering the phenotype presentation, each animal was categorized into one of the four production profiles (PPs) [
9].
2.1.2. Production Data Collection
On termination of the feeding period, all animals were harvested at a registered slaughter facility approximately 120–150 km from the feedlot. Outcome data points were collected, to analyze the data on carcass growth parameters on a per animal basis. Data collected for experiment 1 included the following [
30]:
Live gain in feedlot = Exit weight (kg)—entry weight (kg);
ADG in feedlot = Gain (kg)/Days on Feed;
Carcass entry weight = 0.694 × shrunk body weight—38.43 kg;
Carcass gain (kg) = Carcass exit weight (kg) (measured)—carcass entry weight (kg) (calculated);
Carcass ADG (CADG) = Carcass gain (kg)/Days on Feed.
2.1.3. Animals
Our data represent feeder calves that were classified at the onset of the feeding period and followed prospectively to determine their growth performance during the feeding period. The study population represented the usual feeder calves from different origins that were procured by the commercial feedlot, and only male-gender calves were enrolled in the study. Before the onset of the study, the calves were prepared in a 60-day preconditioning phase at the same location [
30]. The exact age of the animals was unknown and ranged from approximately seven to thirteen months, as is the industry standard in South Africa [
16] for feeder calves, just weaned, to enter the feedlots. The animals were mixed beef breeds, as per the industry standard in South Africa [
16].
Feeder calves (
n = 430) had entry weights ranging from 261–313 kg (Table 4) and were first categorized into four PP categories, PP 1, PP 2+, PP 2–, and PP 3, which represent the production profile categories as described by Hentzen and Holm (2024) [
9]. Subsequently, each PP group was randomly assigned to three feedlot production pens.
2.1.4. Environment, Feeding, Housing, and Management of the Feeder Calves
The study was performed at a commercial cattle feedlot in South Africa, from spring to late summer. The facility is on degrees Latitude (DMS) 25°55′02″ S and Longitude (DMS) 28°35′52″ E, with an elevation of 1491 m above sea level with mean minimum and maximum spring and late summer temperatures of 12 °C and 29 °C, and 17 °C and 30 °C, respectively, in this area.
At the time of entering the preconditioning period and subsequent placement into the feedlot, all animals were vaccinated and treated for internal and external parasites, as per the feedlot prescribed protocol (
Table 1). The implant strategy was followed, as per the prescribed protocol (
Table 1). This is the exact protocol Hentzen and Holm (2024) followed in their proof-of-concept study [
9].
After PP categorization, animals were individually weighed before block-randomizing them by PP category and weight into the three diet groups. The PP 1 category consisted of
n = 132 and was randomly placed into the HPD (
n = 44) Pen B4, MPD (
n = 44) Pen B5, and LPD
(n = 44) Pen B6 diet groups. Similarly, PP 2+ animals were randomly assigned to HPD (
n = 28), MPD (
n = 27), and LPD
(n = 28), and PP 2– animals were randomized to HPD (
n = 29), MPD (
n = 29), and LPD (
n = 28). The PP 3 animals (
n = 129) made up the rest of the experimental animals and were randomized into the three treatment groups, respectively,
n = 43 each. PP 2+ and PP 2– were classified into separate production profile groups to equally contribute to the PP 2 (representing the average) group (
Figure 2).
A balanced starter diet was formulated and fed for the first 14 days to all experimental feeder calves (B4–B6) before commencing with the experimental diets. The starter diet was formulated to achieve a protein content of 14–16% crude protein (CP) and metabolizable energy (ME) of 10.5 MJ/kg DM. After the general starter diet, the three different diets were introduced (LPD in B4, MPD in B5, and HPD in B6).
The cattle were housed and kept in three purposefully designed rectangular feedlot pens (30 m × 60 m) with a feeding trough on one side. Animals were fed in groups not exceeding 145 animals per pen and with a population density ≥12 m
2/animal. The pens were adjacent to each other, in the middle of a commercial feedlot production line; in other words, none of the experimental pens were at the end of a line. This was carried out to minimize the impact of any pen effect, seeing that pen and diet were collinear in this experimental study design. Feedlot pens at the extremities of a production line are known to cause more variance in cattle performance, compared to pens in the middle of a line [
31]. Furthermore, the pen where MPD was fed (B5) was situated between the pens where LPD and HPD were fed (B4 and B6, respectively), so that both experimental pens (B4 and B6) had pens on either side where the average diet for cattle in this feedlot was fed (MPD).
Animals were fed twice daily according to the intake of the previous days to a zero-bunk score [
32], and had continuous access to clean, fresh water. The pens were cleaned of excess cattle dung once every month or when necessary. Animals in each pen were observed twice daily for signs of disease and discomfort. Animals identified as sick or in discomfort were removed from the pen and the study, and treated according to the overseeing veterinarian’s protocol. Animal welfare and management, including health management, was according to prescribed protocol and/or best management practices.
Due to logistical reasons, the slaughter of the animals occurred over 12 separate days. On the day of slaughter, the same number of animals per PP classification was randomly slaughtered from each pen. In other words, cattle were not individually selected based on market readiness but were fed to the common market endpoint, grade A2/A3 [
33] as a group.
2.1.5. Diets
The three diets were formulated using cattle feed formulation software based on the Cornell Net Carbohydrate and Protein System (CNCPS version 6.5). The already existing diet in the feedlot was used for the MPD and is considered a typical diet for the South African feedlot industry (feeding to the pen average). This diet was fed to pen B5. The HPD and LPD used in experiment 1 were formulated using the MPD as a base. The HPD, fed to pen B6, was formulated in an attempt to address the higher production potential of incoming feeder calves with PP 1 classification. Based on González review, the HPD, therefore, included additional energy and made use of rumen-protected proteins (amino acids) to support additional growth potential [
34]. The LPD was lower in ME, higher in peNDF, and lower in rumen-degradable protein (Table 3). Pen B4 received the LPD, formulated to match the nutritional needs of feeder calves with poorer growth potential (represented by PP 3). The chemical composition of the three diets is summarized in
Table 2.
This approach resulted in having three pens (B4; B5; and B6) next to each other, in the middle of a feeding line. This was carried out to avoid experimental pens being on the end of a feeding line and, thus, being exposed to different environments. The three trial pens were flanked by other feedlot pens, B3 and B7.
The feed is the intervention, and the reaction of the different PP classification animals to the diets is the data captured to address the hypothesis. (
Table 2).
2.2. Experiment 2
In experiment 2, similar PP animals were fed together in smaller feeding pens, keeping to a density of ≥12 m2/animal. Here, the same PP classification animals were fed together and exposed to the HPD, MPD, and LPD. The MPD, as in experiment 1, was a ration fed to a commercial feedlot and considered a control diet. This approach made it possible, in experiment 2, to add an analysis per pen, representing the same PP classification, which was not possible in experiment 1. By doing so, feed intake per PP classification and per diet could be determined, allowing for economic implications to be analyzed.
2.2.1. Phenotypic PP Classification
The study animals were individually evaluated by an experienced observer, who is a specialist veterinarian (the author), on their phenotypic appearances. The development of the PP classification system evolved over eight years. Other studies have demonstrated the repeatability of similar methodologies, which have been used in research [
28,
29]. The animal’s inclusion criteria for classification were the composite observable characteristics or traits (phenotype) of muscular and skeletal development, ratios thereof, and body capacity. Considering the phenotype presentation, each animal was categorized into one of the four production profiles (PPs) [
9].
2.2.2. Production Data Collection
On termination of the feeding period, all animals were slaughtered at a registered slaughter facility approximately 100 km from the feedlot. Outcome data points were collected, to analyze the data and establish the actual growth compared to the allocated PP classification at the beginning of the feeding period. Data collected were similar to that described for experiment 1, with the addition of the following data:
2.2.3. Animals
In experiment 2, animals were sourced in the same way as described for experiment 1, except that the animals were sourced from and the 60-day preconditioning phase was completed at a different commercial feedlot, approximately 350 km from the experimental farm where the study was performed, and feeder calves (n = 108) had entry weights ranging between 161–260 kg.
2.2.4. Environment, Feeding, Housing, and Management of the Feeder Calves
The study was performed at a registered research facility in South Africa from mid-summer to autumn. The facility is on the degrees Latitude (DMS) 28°13′34” S and Longitude (DMS) 28°30′09” E, with an elevation of 1813 m above sea level with mean minimum and maximum mid-summer and autumn temperatures of 15 °C and 25 °C, and 12 °C and 25 °C, respectively, in this area.
Preconditioning, vaccination, and implant protocols were similar to experiment 1 (
Table 1).
Feeder calves in experiment 2 were individually identified, weighed, and categorized into the four production profiles (PP 1; PP 2+; PP 2–; and PP 3) [
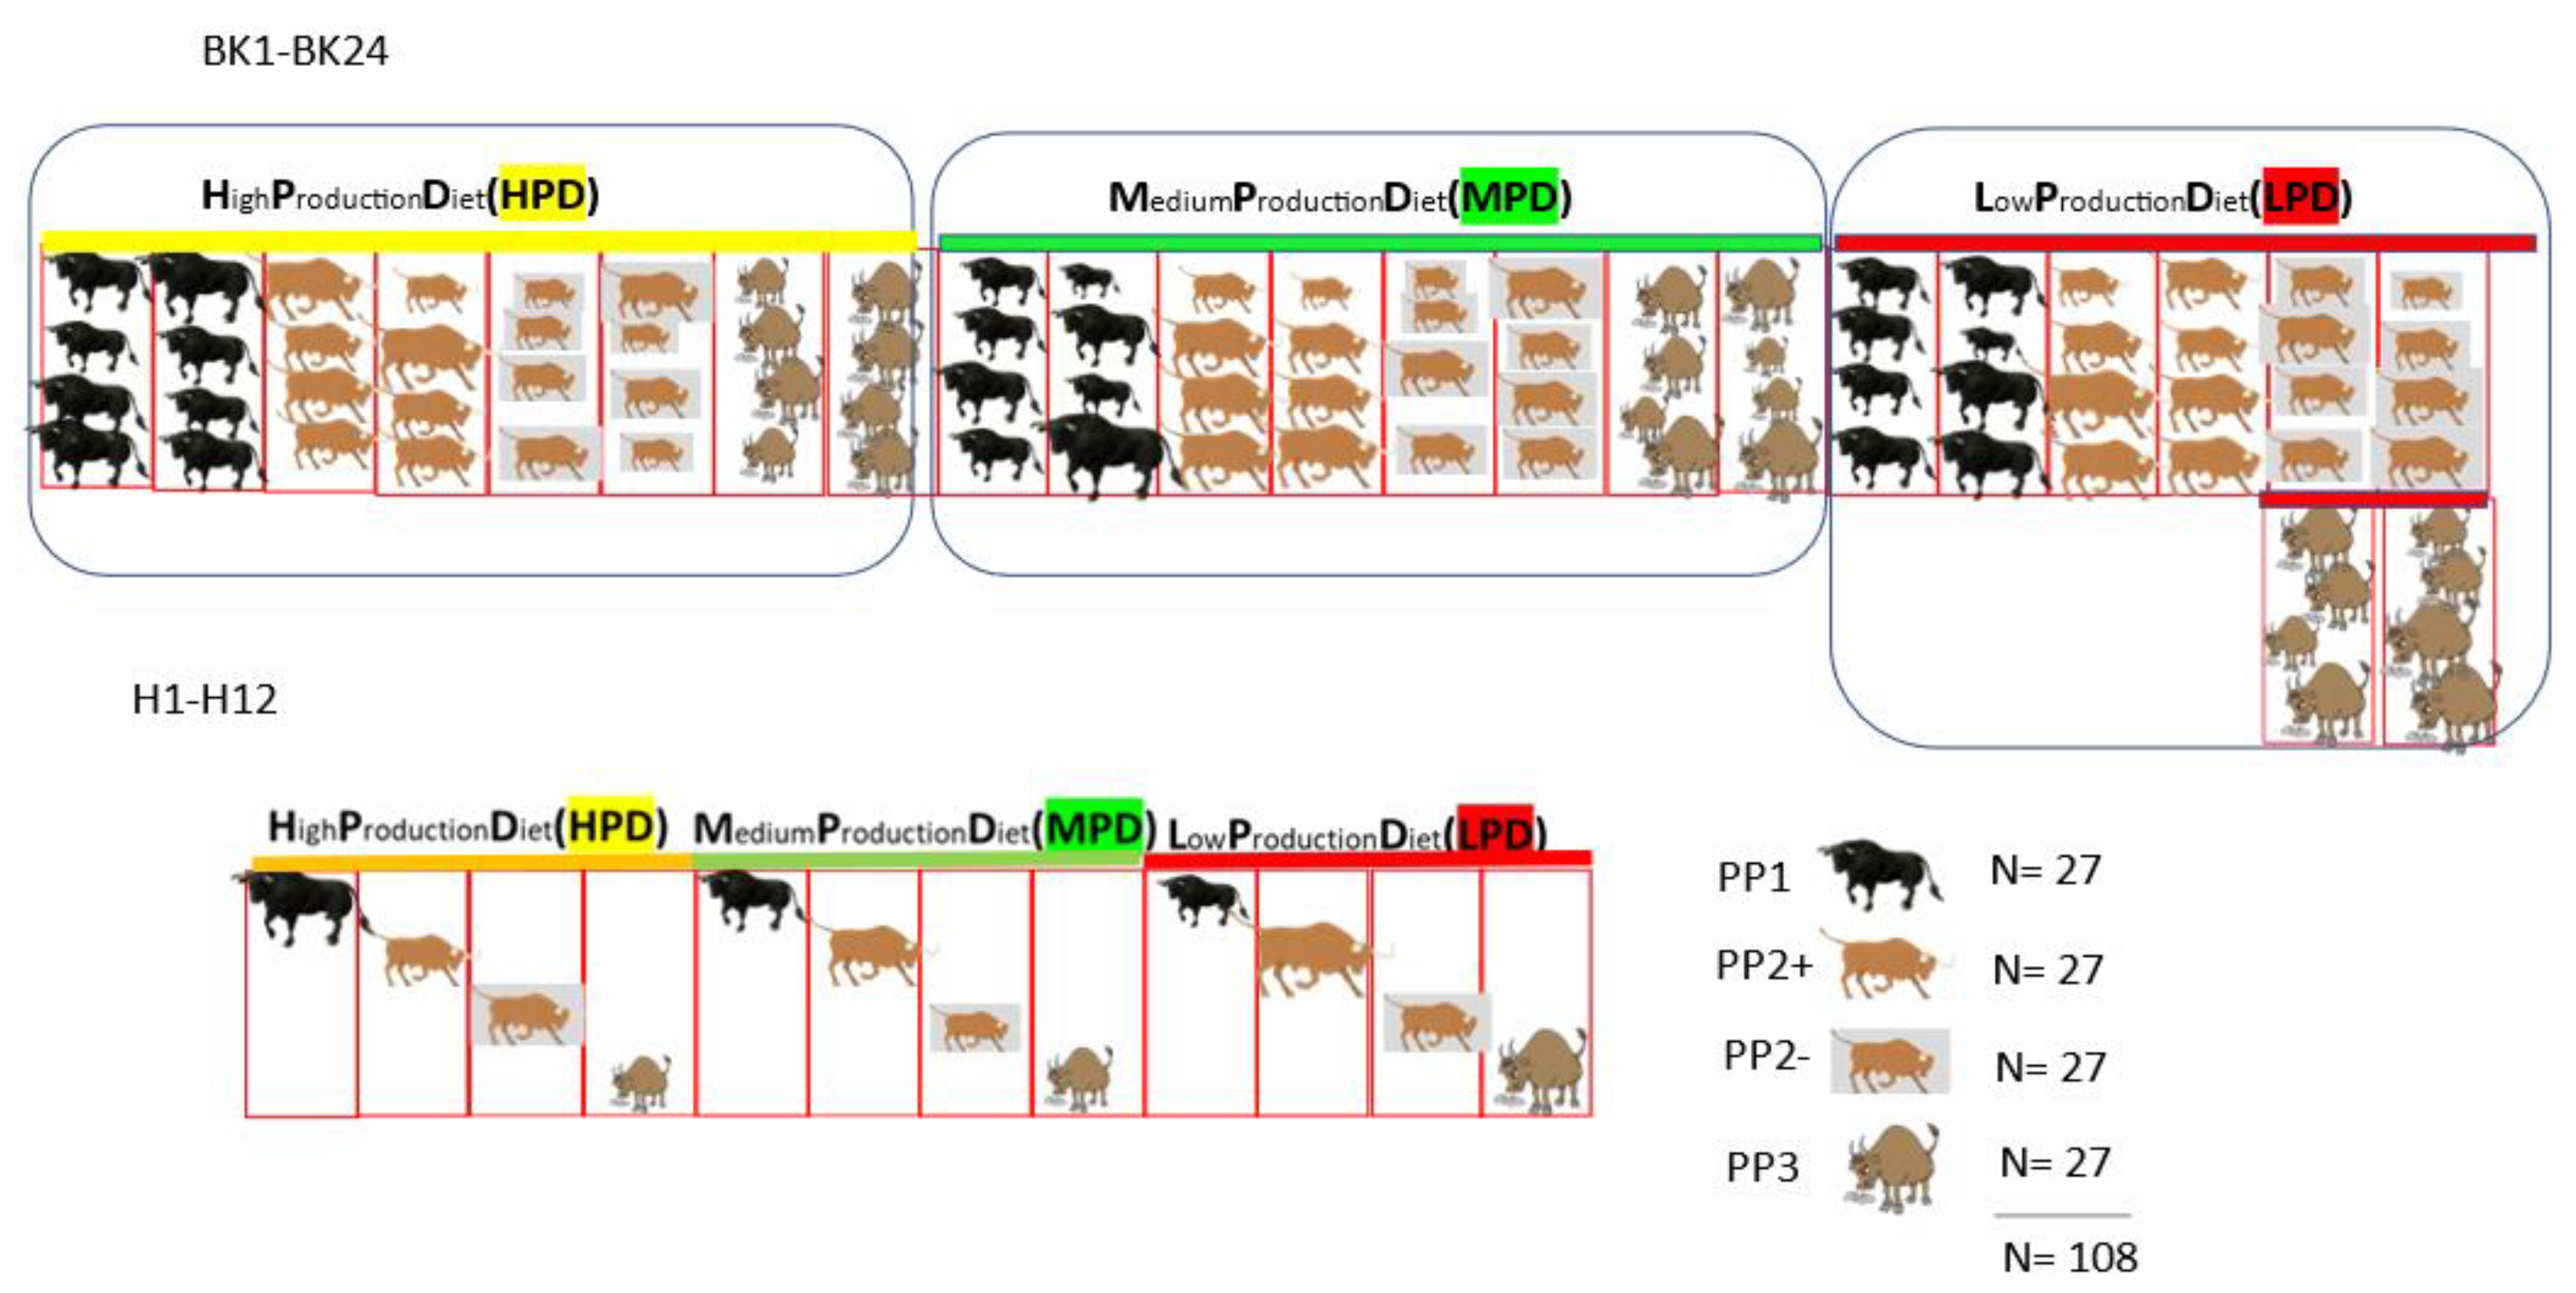
26] at the original commercial feedlot. Each of the four PP classifications consisted of 27 animals that were randomly allocated on arrival at the experimental farm, after ranking based on weight, into 36 pens in total. Each PP category was represented in six pens with four occupants per pen, and three pens for individual animals. Within each PP category, the allocated pens were then subsequently randomized into three diets, using a random number generated in Microsoft Excel (MS Office): HPD, MPD, and LPD.
This approach resulted in having two grouped pens of each PP classification (1; 2+; 2–; and 3) on the LPD, MPD, and HPD (BK1 to BK 24 in
Figure 3). The individual holding pens were similarly allocated, with each pen holding only one animal (H1 to H12 in
Figure 3). Experiment 2 was carried out to address and support possible data shortfalls of experiment 1 and allowed for the reformulation of the diets (
Figure 3).
The cattle were housed and kept in 24 purposefully designed rectangular feedlot pens (4 m × 9 m) with a feeding trough on one side. The individual holding pens are of a similar design, but smaller (2 m × 4 m). Animals were fed twice daily according to the intake of the previous days to a zero-bunk score [
32] and had continuous access to clean, fresh water.
The pens were cleaned of excess cattle dung once every month or when necessary. Animals in each pen were observed twice daily for any signs of disease and/or discomfort. Animals identified as sick or in discomfort were removed and treated according to the overseeing veterinarian’s protocol. Animal welfare and management, including health management, was according to prescribed protocol and or best management practices.
All cattle were slaughtered on the same day and at the same slaughter facility, as is commonly the practice in large commercial feedlots in South Africa. In other words, cattle were not individually selected based on market readiness but were fed to the common market endpoint, grade A2/A3 [
33] as a group.
2.2.5. Diets
The starter diet was formulated similarly to that of experiment 1. After the general starter diet, all animals were individually weighed, placed back into their respective pens, and started subsequently on the three different diets, LPD, MPD, and HPD. Based on our results from experiment 1, the energy in the HPD of experiment 2 was increased further. The ME in the LPD was further reduced, to widen the gap between MPD and LPD from that in experiment 1. Put differently, rations were reformulated to accentuate the interaction between diet and PP classification on feedlot performance.
The three experimental diets were formulated with the CNCPS beef model considering relevant environmental, managerial, animal, and nutritional factors. A 200 g difference in live ADG between the three diets was targeted mainly by using a rumen-protected fat supplement (Megalac
®, Nutribase, Pretoria, South Africa) to create differences in metabolizable energy gain. Metabolizable protein was adjusted to ensure that metabolizable protein gain was not first limiting. LPD and HPD were formulated for feeder calves with poorer and better growth potential compared to the industry norm. The three diets’ chemical composition is summarized in
Table 3.
2.3. Statistical Analysis
Data for both experiments were captured in a spreadsheet and transferred to STATA 14.0 (Statacorp, College Station, TX, USA) for analysis. The analysis of variance between means of the series of measurements collected and the digital model was carried out by one-way ANOVA, using the Bonferroni test to estimate the significance of differences between means. Results were considered statistically significant if p < 0.05.
In experiment 1, subsequent mixed-effects regression models for carcass and growth outcomes were constructed, adjusting for possible confounding factors, with the calf as the experimental unit, diet as fixed effect, and pen as a random effect. Initially, all possible covariates were included in the model, and removed one by one from the model based on the highest Wald
p-values. When only independent covariates (with Wald
p-values < 0.05) remained in the models, potential confounding of other covariates was tested and considered significant if the addition of a potential confounder changed the coefficient of any independent covariate by ≥15%. The exception was carcass entry weight, which was forced into all models due to the known associations between entry weight and feedlot production [
35]. An interaction term between diet and PP classification was included in the model and kept if significant interaction existed. Validity of the models was confirmed by the chi-square statistic, to estimate the overall effect of the model on the dependent variable and was considered a good fit if
p < 0.05. For the mixed-effects models, PP 2+ and PP 2– were combined as PP 2, representing the average feeder calf, to compare the carcass and growth outcomes of the better (PP 1) and weaker (PP 3) calf to that of the average (PP 2) calf after adjusting for possible confounders, on the different diets (LPD, MPD, HPD).
In experiment 2, Days on Feed (DoF) was not considered a covariate because it was similar for all animals. In experiment 2, feed intake and carcass feed conversion were determined for each PP classification and diet, using the pen as an experimental unit rather than the animal, because feed intake could only be measured per pen, and not per animal, in the case of the grouped pens. Following this, a similar mixed-effects model to those described in experiment 1 was created for carcass feed conversion, which also considered the number of animals in a pen as an additional potential confounder.
4. Discussion
This study aims to demonstrate the value of PLF based on the growth potential of feeder calves, as visually classified according to Production Profiles (PPs) before entering the feedlot phase. This approach supports and contributes to the economic pillar of sustainable PLF. The environmental and social aspects of PLF are relevant in the feedlot industry but are not included in this study. The potential impact of PLF in alleviating methane reduction, and the reduction in nitrogen and phosphate in the environment are valid and recognized, but also not included in this study. The potential role that PLF can have on market segmentation is also valid, but not part of this research.
This study focuses on the matching of the nutrient supply to the nutrient requirements of feeder calves fed a balanced diet. It is acknowledged that diets need refinement to unlock the full potential of PLF. The authors do not advocate the specific diets fed in this study to be the only ration for precision feeding, but rather the principle of matching the nutrient supply to growth potential. Our focus was on energy (ME) and protein, since they are the main contributors to growth [
27,
36].
The need to classify feeder calves according to production potential, and then feed accordingly, has been expressed [
9]. Successfully categorizing feeder calves into Production Profiles [
9] before the feeding period is the initial step in PLF. The feeder calves with better Production Profiles can potentially add additional value to the feedlot when an additional supply of nutrients is attained, for the demand of additional growth [
27]. Similarly, losses incurred by calves with below average production potential could potentially be mitigated by PLF.
4.1. Demonstrating the Principle of Precision Livestock Feeding, by Matching Nutrient Supply to Growth Potential
The MPD in both experiments are diets that are fed in commercial feedlots and are used as the reference. They are good balanced diets, established through positive feedback over the years. Since carcass gain is the product of CADG and DoF, the discussion focuses on the carcass gained by different PPs on different diets. Compared to the average animal (PP 2 fed on an average diet MPD), the PP 2-classified feeder calves did not gain additional carcass weight over the feeding period when fed the HPD in experiment 1 and 2 (1.9 kg and 5.5 kg difference, p = 0.696 and p = 0.437, respectively), accounting for confounders. In both experiments, the higher ME diets failed to improve the carcass gain significantly, measured over the feeding period, and came at a higher cost. When the PP 2 were fed the LPD, they gained 10.7 kg less carcass weight (p < 0.03), compared to when they were fed the MPD in experiment 1. The same class of animal, PP 2, in experiment 2 gained 16.78 kg less carcass than the PP 2 on the control diet (p = 0.01). It is, therefore, evident that, in both experiments, the nutrient supply of the MPD is a good fit for the PP 2 growth potential, confirming our initial suspicion that the MPD base diet was established over many years to suit the production potential of the average feeder calf.
The PP 3 classification animals are animals with a poor growth potential, as seen in the results of the two experiments and previous research [
9]. Feeding this class of animals with the HPD, compared to the average (PP 2 fed an MPD), shows a growth response to the nutritional supply in both experiments 1 and 2. In experiment 1, the carcass gain of PP 3 animals was 19.17 kg, 14.93 kg, and 12.07 kg less than that of the controls when fed the LPD, MPD, and HPD, respectively (
p < 0.03,
Table 5). A similar trend was observed in experiment 2 where PP 3, when fed the LPD, gained 44.27 kg less carcass weight; when fed the MPD, gained 23.37 kg less carcass; and, when fed on the HPD, gained 21.37 kg less carcass weight compared to PP 2 on the MPD (
p < 0.02,
Table 8). The PP 3 feeder calves do, therefore, respond to the additional nutrient supply but at an additional cost and remaining below the performance of PP 2 calves on the MPD. Based on both experiments’ data and the respective diets fed, it is, therefore, not recommended to feed PP 3 the LPD, although further investigation is needed to determine the financial implications for a feedlot.
The PP 1 classification animal, having the highest growth potential [
9], did not show a positive response to the higher nutrient supply in experiment 1: The PP 1-classified calves on the MPD had an additional carcass weight gain of 9.84 kg (
p = 0.06); however, the carcass weight gain of PP 1 calves on the HPD and LPD did not differ from that of PP 2 calves on the MPD (+4.43 kg and −3.14 kg, and
p = 0.39 and
p = 0.54, respectively). On the contrary, in experiment 2, the reaction of the PP 1 class on the HPD of +22.00 kg (
p < 0.01) is noteworthy where the ME was significantly increased by the addition of rumen-protected fat (
Table 3). In this experiment, the PP 1 calves fed the MPD or LPD did not gain significantly more or less weight than PP 2 calves on the MPD (+1.8 kg and −9.66 kg,
p = 0.83 and
p = 0.25, respectively,
Table 8). This is in line with the results [
20] found in her precision feeding research in South Africa, where a ration higher in ME resulted in a significant improvement in ADG live, gain kg live, and carcass weight [
15]. The additional 22 kg carcass weight gain for PP 1 calves on the HPD comes at a higher diet cost; however, compared to experiment 1, it is a better match to the diet. Financial implications need to be considered in the future.
The PP 1 growth potential is not a good match to the LPD in both experiments, and, based on these two experiments, PP 1 should not be fed an LPD.
Overall, we found, in experiment 1, that the effect of PP classification on carcass gain was more significant than the effect of the three different diets (
Table 5). This is why the diet formulation was then reformulated for experiment 2, where the improved matching of the HPD with the PP 1-classified calves, in particular, demonstrates the principle of precision livestock feeding, by matching the nutrient supply to growth potential.
4.2. The Value of Precision Livestock Feeding, Based on Some Economically Important Feedlot Production Traits
The value of supplying the nutrients that support the growth potential lies in the reaction of feeder calves classified according to PP, as measured by economically important growth traits [
27]. The rate of carcass gain (kg) and the efficiency of the gain (kg feed: kg gain ratio) are the most important factors to consider and are discussed. The more carcass weight gained, the more saleable kg meat, resulting in a higher revenue. Better efficiency means that the cost of carcass gain is reduced, thereby also providing a higher revenue.
The feeder calves with the highest PP classification add the highest value when fed the highest production diet. This is seen in experiment 2 where PP 1 calves fed the HPD had a CADG of 0.16 kg/d higher than PP 2 on the MPD (p < 0.01). This value was unlocked after the reformulation, based on the results of experiment 1. The value lies in the possibility to estimate the production potential at the start of the feeding period by PP classification, and subsequent feeding to that potential of growth.
The trend is similar when comparing the CADG, carcass gain (kg), and resulting carcass weight (kg) on the ANOVA analyses. The PP classification has a significant effect on the production parameters in both experiments (
p < 0.01). Comparing the diet effect in the two experiments, the effect of the higher ME in experiment 2 resulted in a significant (
p < 0.01) improvement in all production parameters (
Table 6). The growth rate was always lower when feeding PP 3 compared to PP 1 and PP 2, independent of what diet they were fed (
p < 0.02). Different to PP 1, it is difficult to unlock the value of a PP 3 animal through the diet, based on this research, and this supports that a poor animal cannot be fed right (
Table 7 and
Table 9). To feed the PP 3 profitably, factors other than production and diet need to be considered. This could include an improved diet formulation to ensure a better cost of gain or address the anticipated production loss during procurement.
Another factor that could not be considered in this research that may have influenced the results is the age of the incoming feeder calf. In the current South African feedlot industry, this information is not readily available. Future studies should investigate whether age may influence an incoming feeder calf’s response to different diets, within PP classification. When the information is available, age may therefore further improve our ability to match the diet to the nutrient requirement of the incoming feeder calf.
The efficiency measure, CFCR, could only be measured in experiment 2. The rate (
p < 0.01), as well as the efficiency (
p = 0.06) of gain, is superior in the PP 1 animal fed the HPD (which has been designed in an attempt to support its superior production potential). This makes PP 1 calves ideal candidates to further reformulate diets and challenge the feed. Considering the substantive influence feed conversion has on economic returns [
27], the LPD might not be a diet to consider in circumstances comparable to experiment 2.
From our data in experiment 2, where the diets were more extreme in terms of energy and protein content, it is evident that the efficiency of growth is more severely impacted by the LPD in calves with an average or low production potential than in calves with a better production potential. The PP 2 and PP 3’s CFCR on the LPD was 1.25 kg/kg (
p < 0.01) and 1.50 kg/kg (
p < 0.01) lower than that of PP 2 on the MPD after adjusting for entry weight, respectively (
Table 9). This means that the PP 2 and PP 3 calves consumed 1.25 and 1.50 kg more feed for every 1 kg carcass weight gained when fed the LPD, compared to PP 2 calves fed the MPD. On the other hand, calves with the PP 1 classification seemed to tolerate the lower energy and protein in the LPD better, with a smaller (and not significant) difference in CFCR when compared to PP 2 on the MPD (0.87,
p = 0.07) (
Table 9). On the other end of the spectrum, the HPD did not seem to significantly improve the efficiency of growth in any of the PP classifications, although it is evident that CFCR is most likely to improve more for PP 1 calves on the HPD (0.91 kg/kg better CFCR for PP1 on the HPD compared to PP2 on the MPD,
p = 0.06) when compared to PP 2 and PP3 calves where there was no improvement in feed efficiency evident at all when fed the HPD (
p = 0.26, and
p = 0.50, respectively). This, once again, implies that a diet with a higher energy and protein content may only be able to unlock additional growth efficiency from animals where such an ability is inherent.
4.3. The Relevance of Implementing Precision Livestock Feeding in the Feedlot Industry
The beef feedlot industry must base the decision-making on carcass-based measurements [
37], and act on the influence the diet has on the growth rate [
38]. This study has generated additional information, in that PP-classified animals respond to precision livestock feeding, which aligns with Tatum’s findings. The improved growth rate and reaction to the additional nutrient supply is relevant; practical implementation in a cost-sensitive industry calls for some financial indicators.
The absence of precision feeding in cattle feedlots is a constraint to sustainable beef production. The data of these two experiments show that identifying the individual with the highest CADG and lowest CFCR potential before the feeding period is essential and supplying these individuals with the nutrients that support that specific CADG and CFCR is possible. Matching the cost of those nutrients to the relative growth potential in a cost-effective way makes feeding to the production potential in the intensive feed industry relevant.
Further research is needed in order to investigate the financial implications of precision feeding based on PP classification, which depend not only on the growth rate and efficiency of growth but, amongst others, also on the cost of the diet and the cost of standing for a longer time in the feedlot. Countries with similar feeder calves and variations in receiving feeder calves will find value in this research and support the further research in and application of precision livestock feeding. The second highest cost component of a beef feedlot (feed cost) can be reduced by improving the feed efficiency, which improves the greater economic returns, like the margin over feed cost. The concept of PLF promises greater efficiency in resource utilization [
39]. This leads to possible reduced excretions of, amongst others, nitrogen (N) and methane [
7], and a possible reduction in the carbon footprint [
40].


