
A Mixture of Free and Microencapsulated Essential Oils Combined with Turmeric and Tannin in the Diet of Dairy Cows: Effects on Productive Efficiency and Animal Health
 ,
,  , , ,
, , ,
Simple Summary
Abstract
1. Introduction
2. Materials and Methods
2.1. Additive
2.2. Characterization of Experimental Environment
2.3. Animals, Experimental Design and Diet
2.4. Data and Sample Collection
2.5. Laboratory Analysis
2.5.1. Chemical Composition of Feed
2.5.2. Hemogram
2.5.3. Serum Biochemistry
2.5.4. Proteinogram and Cytokines
2.5.5. Oxidative Status
2.6. Milk Quality: Centesimal Composition, Urea, and Somatic Cell Count of Milk
2.7. Fatty Acid (FA) Profile in Milk
2.8. Statistical Analysis
3. Results
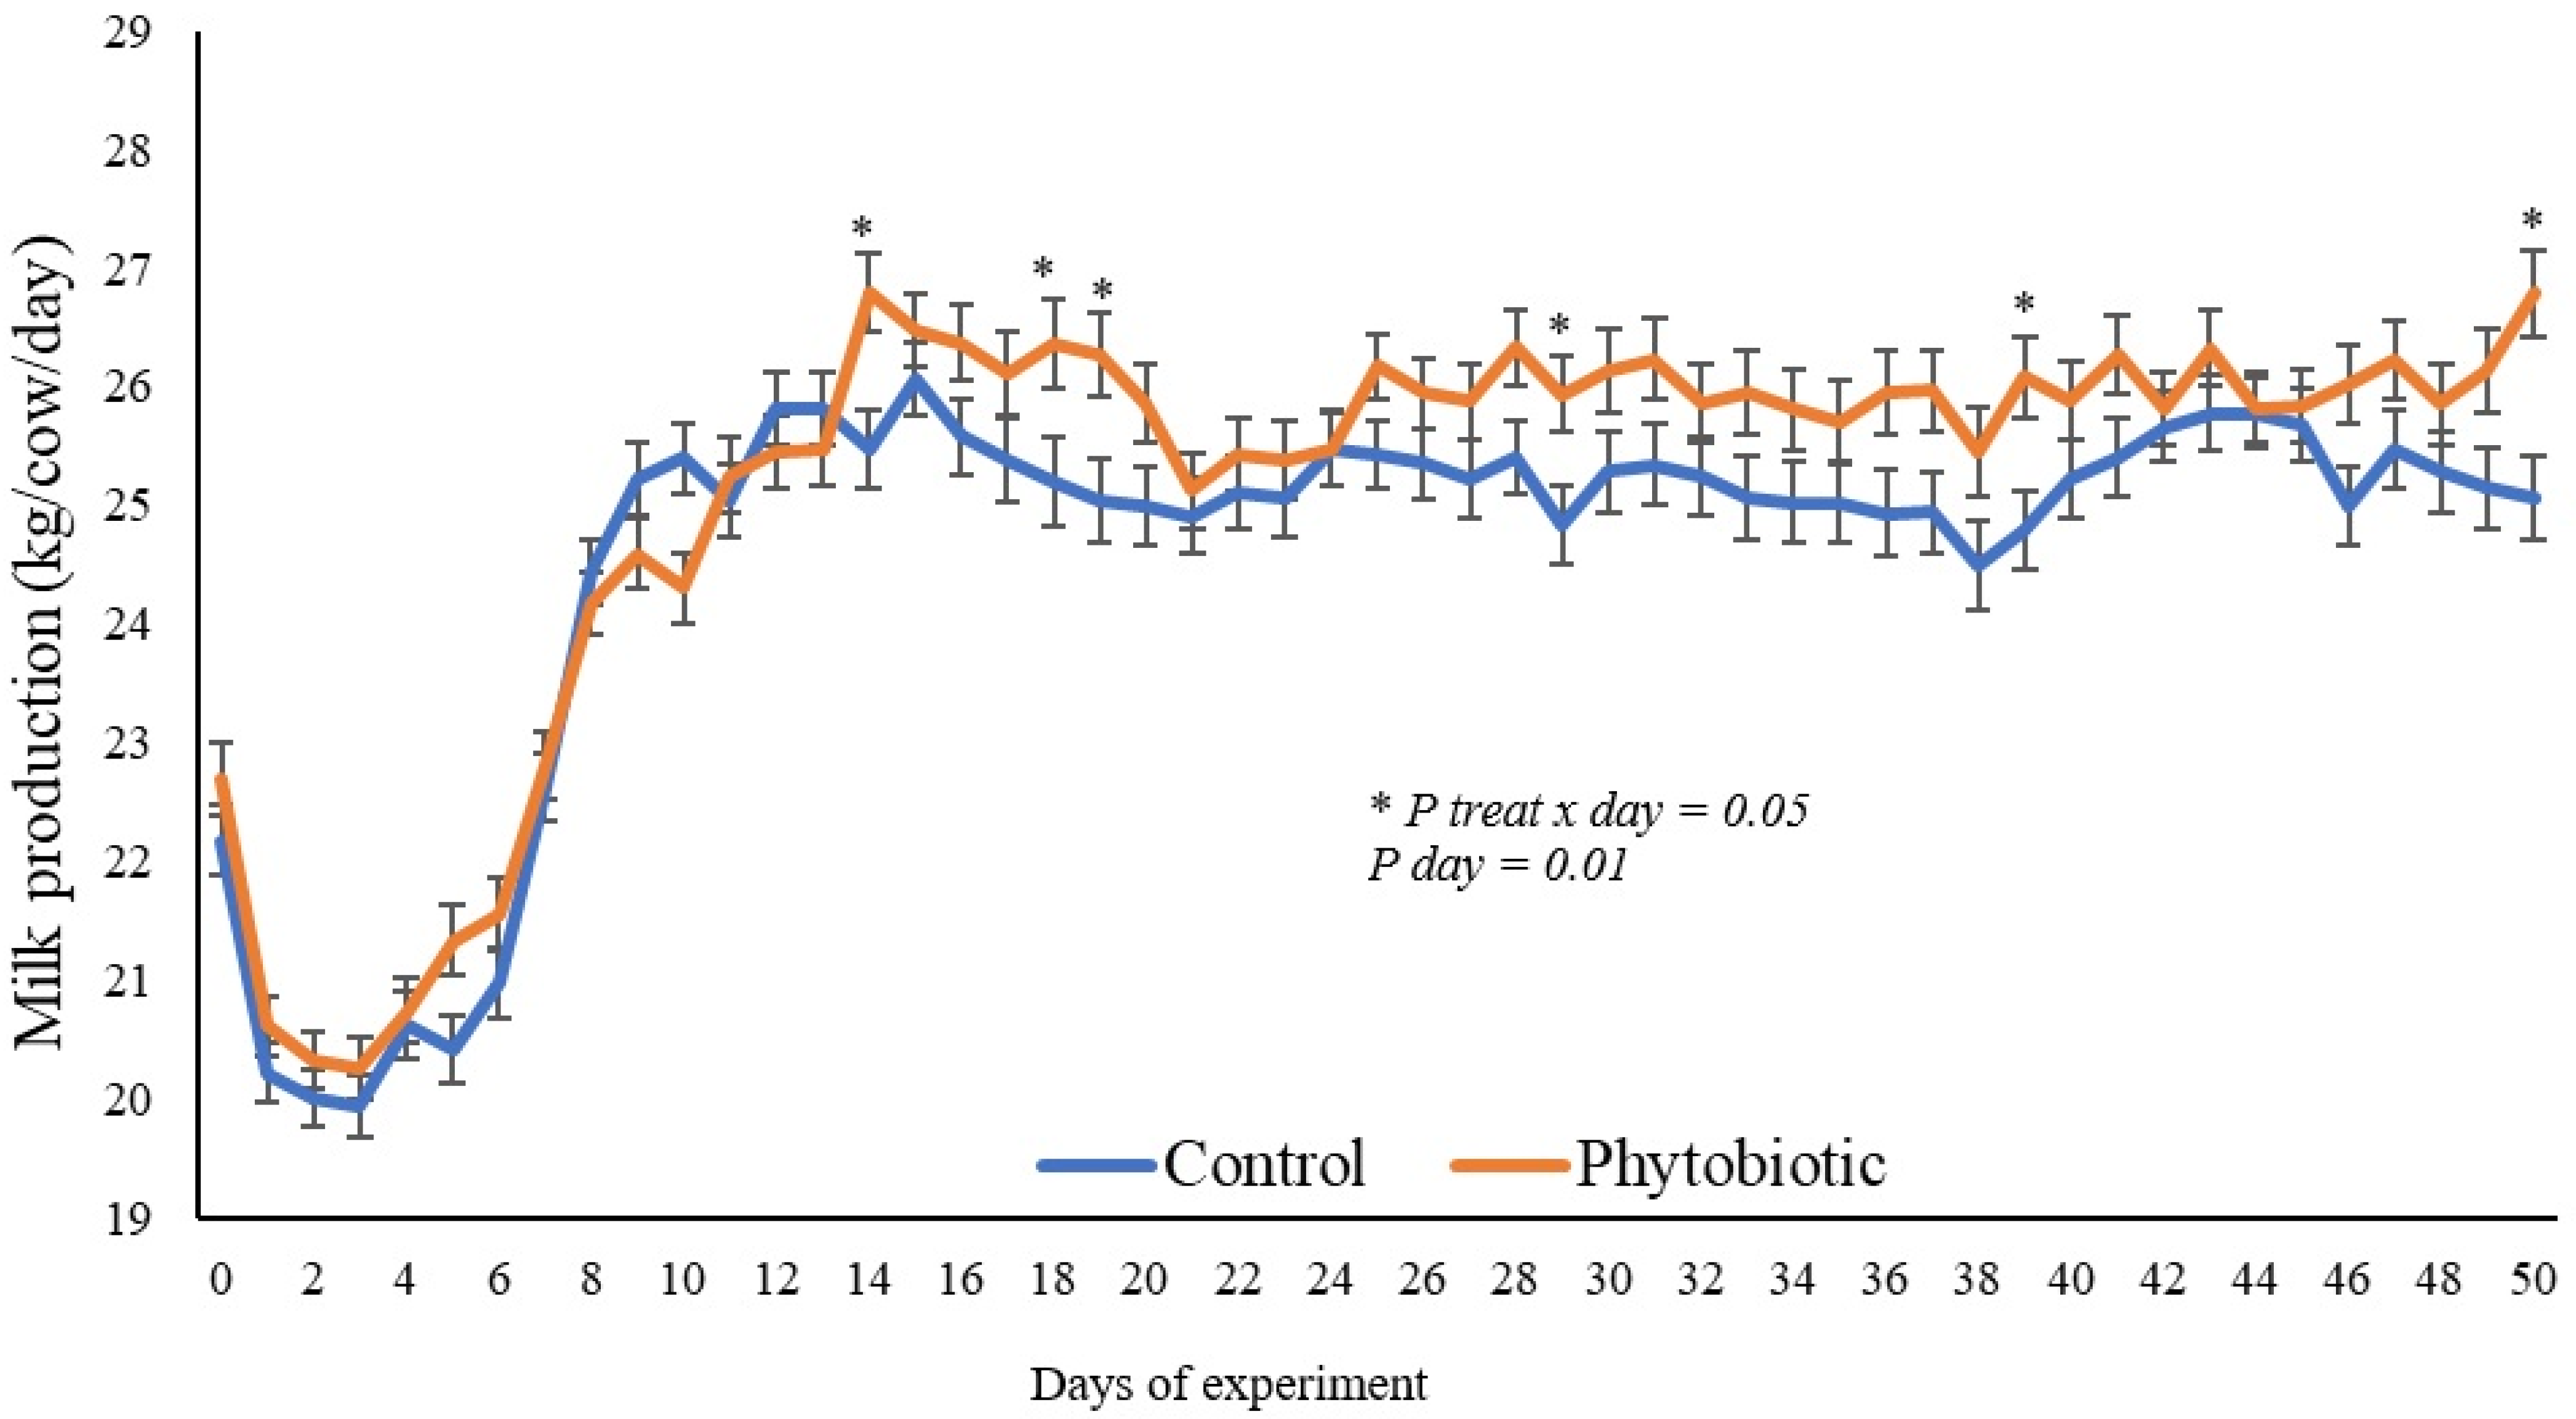
3.1. Productive Performance
3.2. Milk Quality
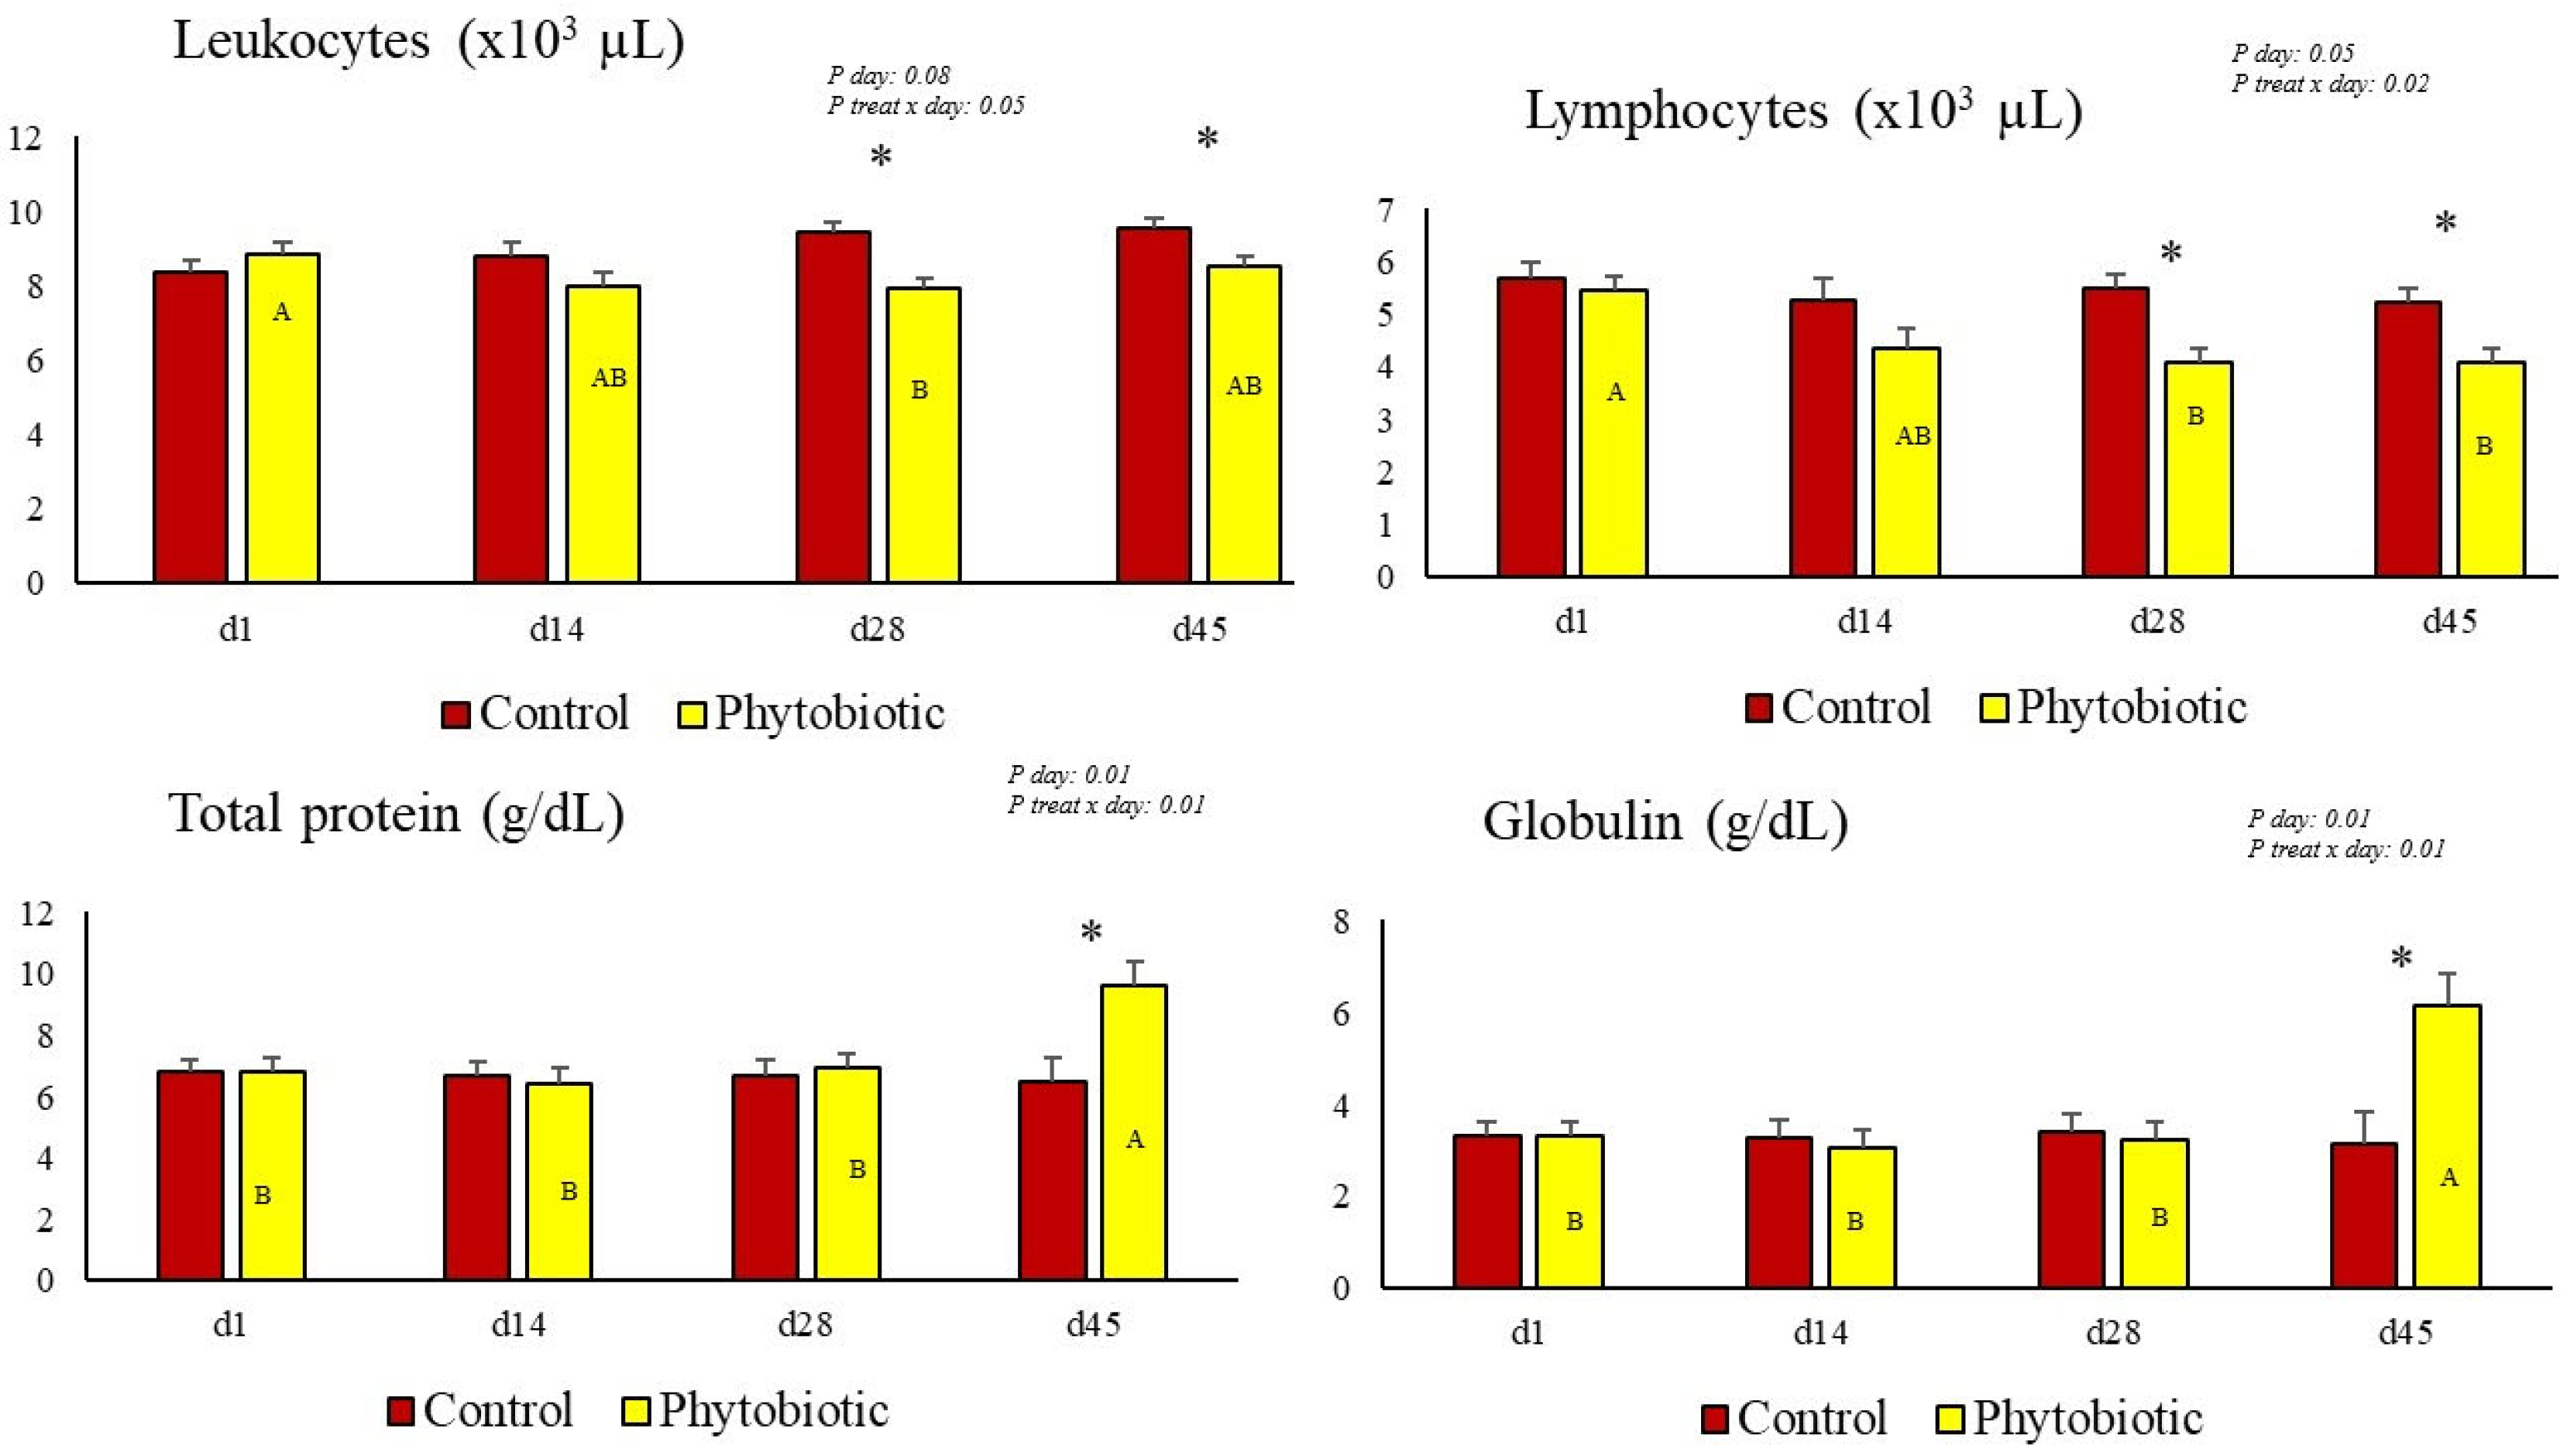
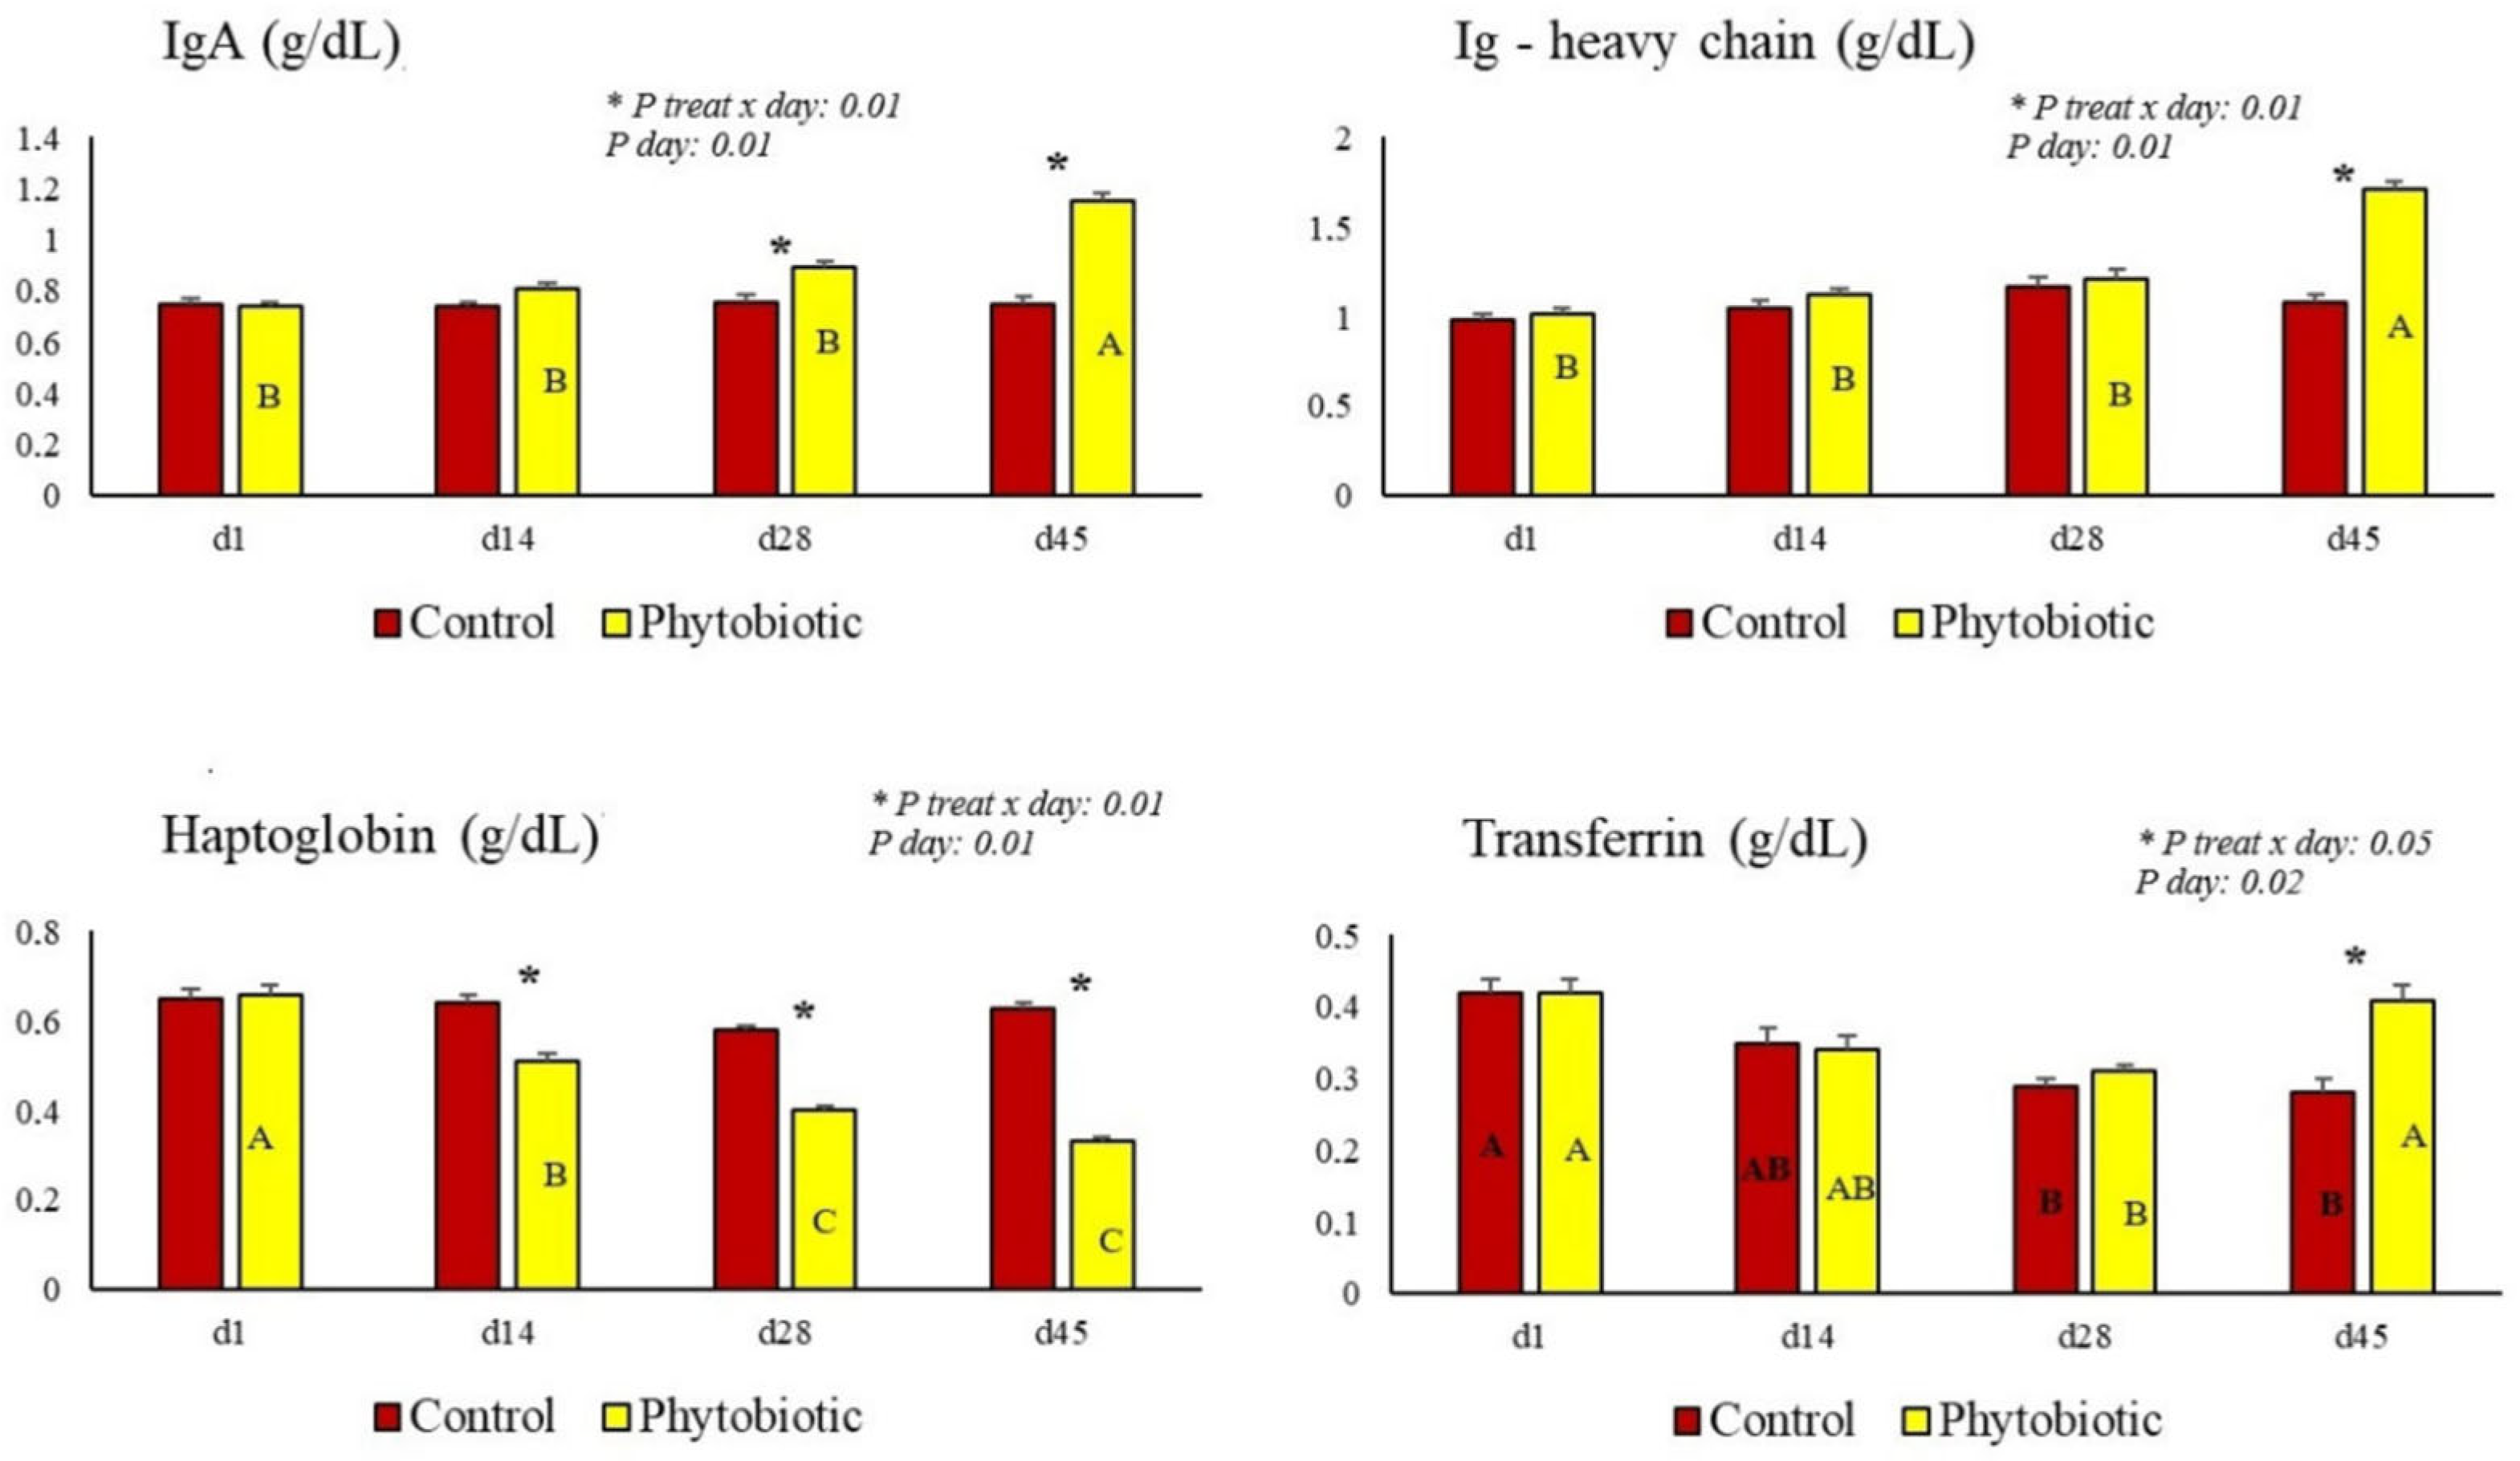
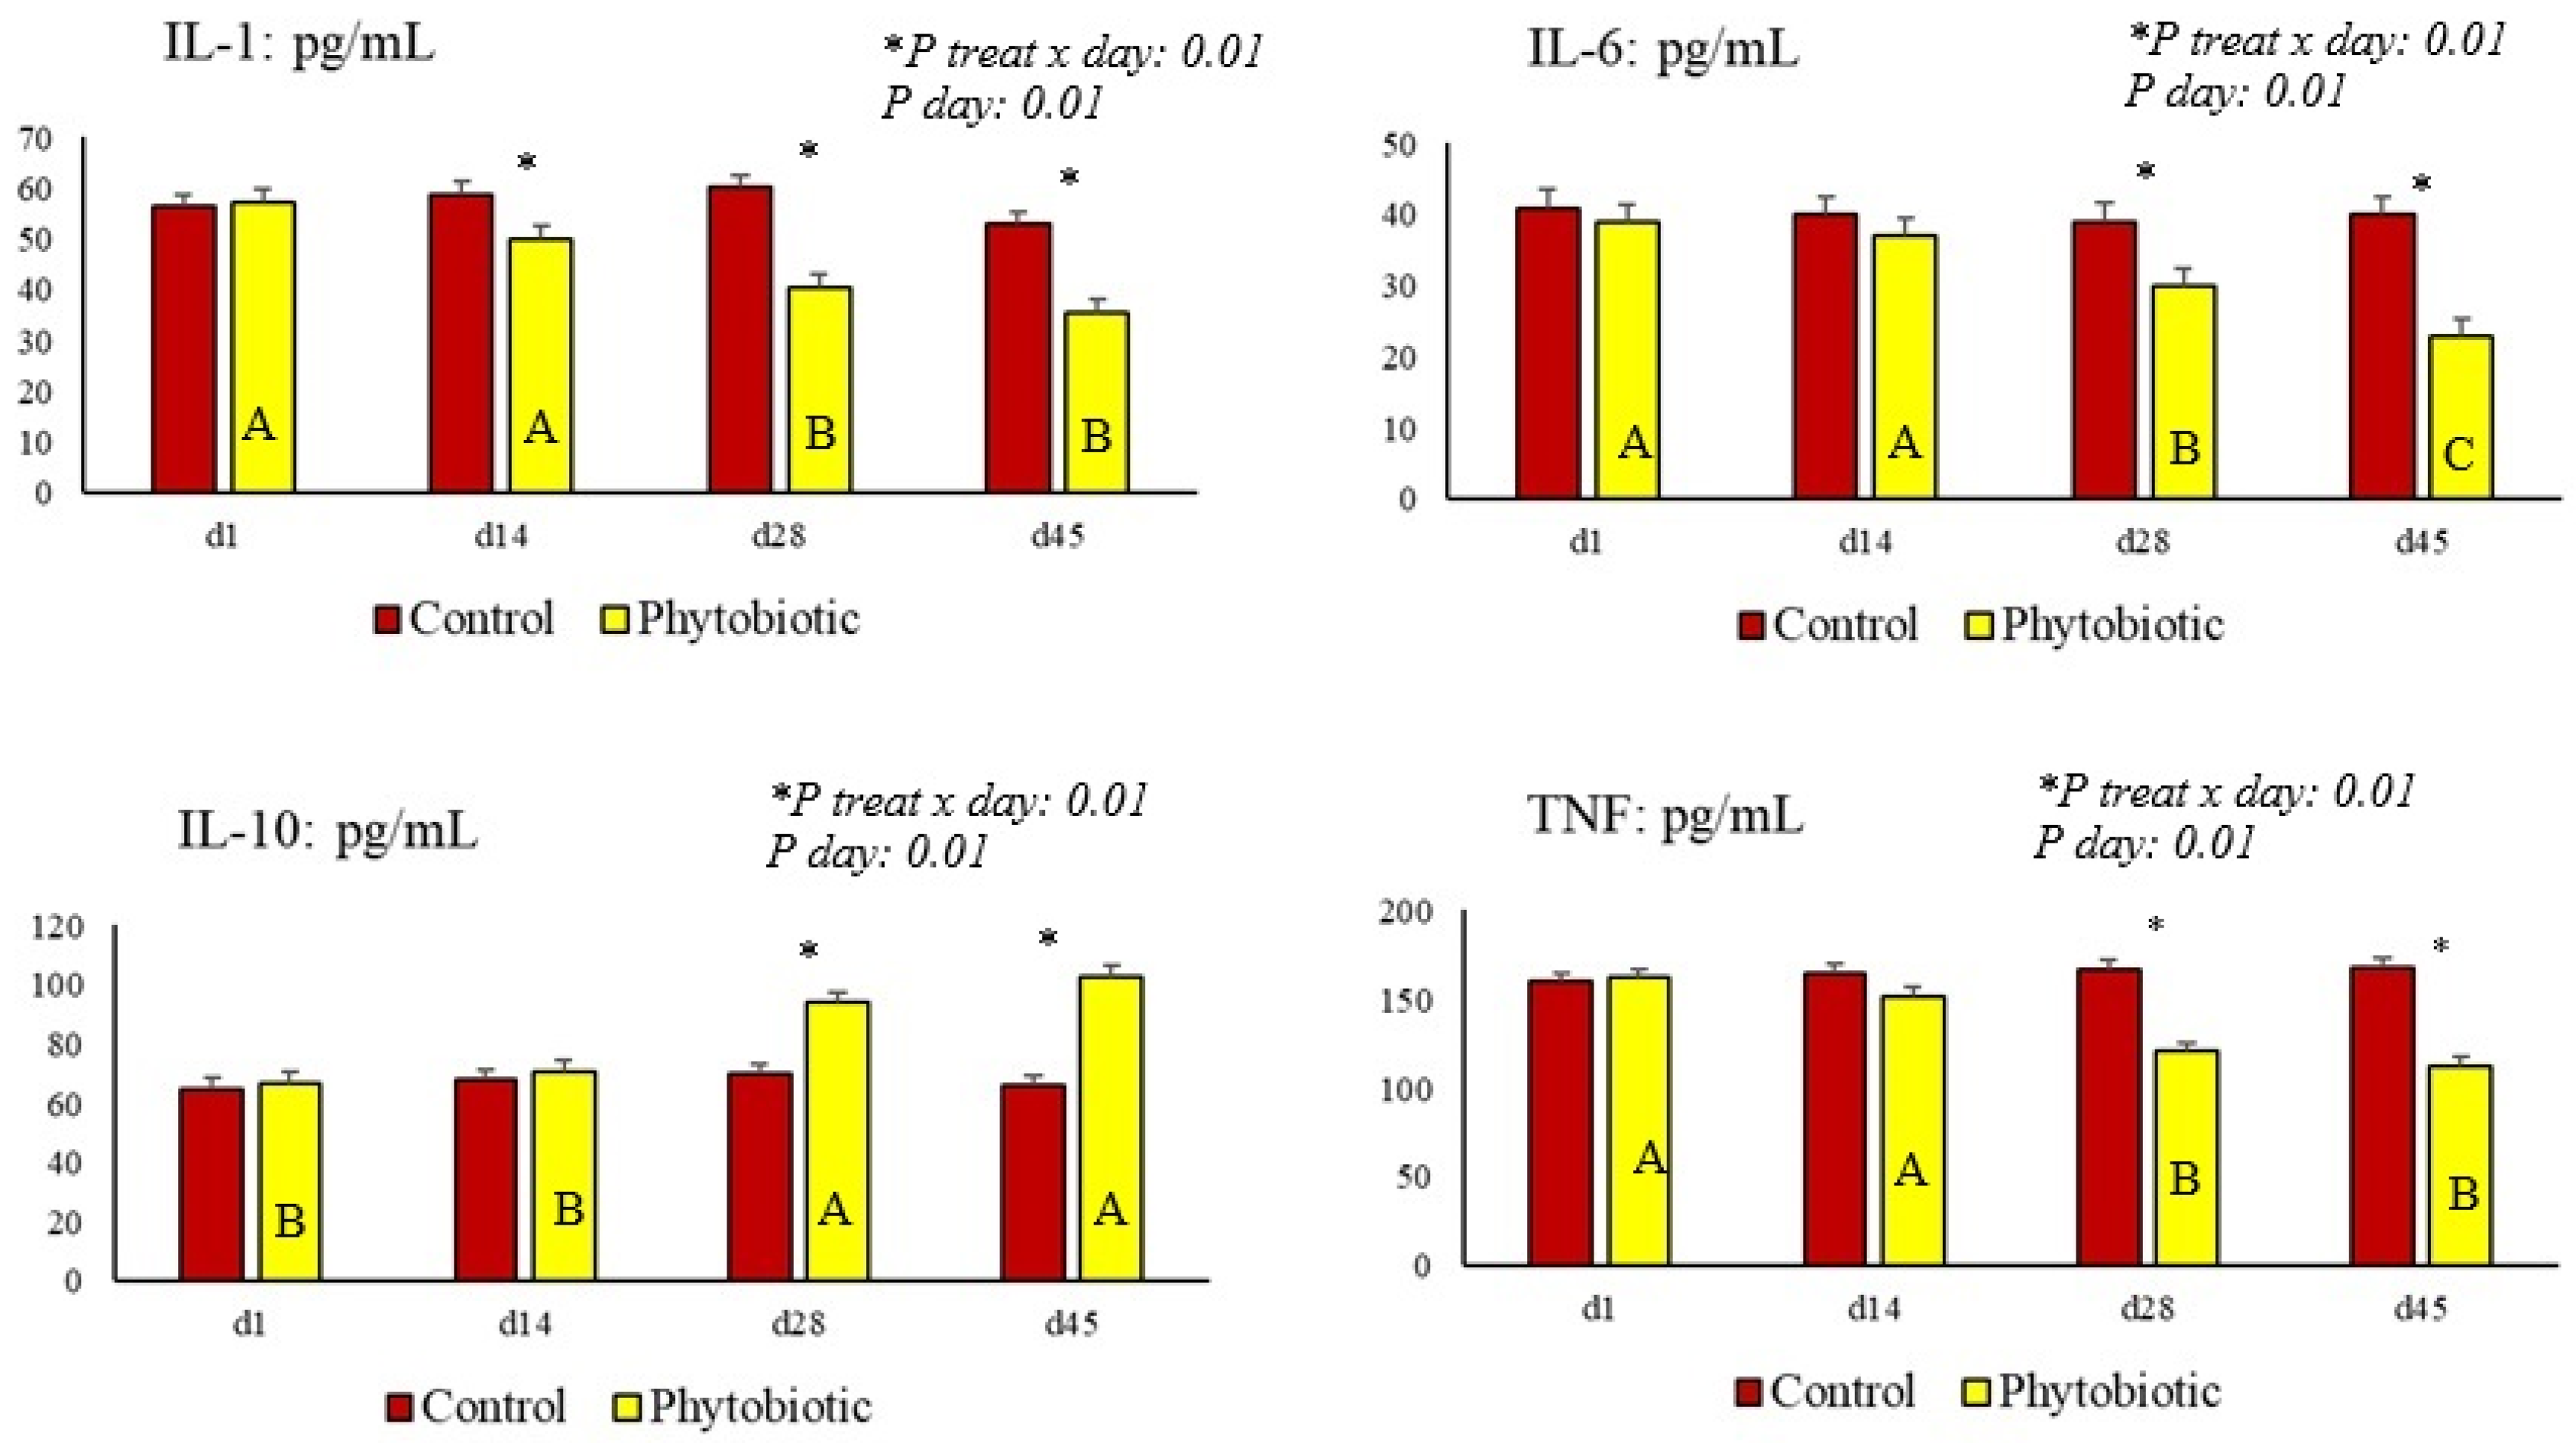
3.3. Hematologic and Biochemical Changes
4. Discussion
5. Conclusions
Author Contributions
Funding
Institutional Review Board Statement
Informed Consent Statement
Data Availability Statement
Acknowledgments
Conflicts of Interest
References
- Van Boeckel, T.P.; Pires, J.; Silvester, R.; Zhao, C.; Song, J.; Criscuolo, N.G.; Laxminarayan, R. Global trends in antimicrobial resistance in animals in low- and middle-income countries. Science 2019, 365, eaaw1944. [Google Scholar] [CrossRef]
- Patra, A.K.; Saxena, J. Exploitation of dietary tannins to improve rumen metabolism and ruminant nutrition. J. Sci. Food Agric. 2010, 91, 24–37. [Google Scholar] [CrossRef] [PubMed]
- Benchaar, C.; Calsamiglia, S.; Chaves, A.V.; Fraser, G.R.; Colombatto, D.; McAllister, T.A.; Beauchemin, K.A. A review of plant-derived essential oils in ruminant nutrition and production. Anim. Feed Sci. Technol. 2008, 145, 209–228. [Google Scholar] [CrossRef]
- Khan, H.; Ullah, H.; Nabavi, S.M. Mechanistic insights of hepatoprotective effects of curcumin: Therapeutic updates and future prospects. Food Chem. Toxicol. 2018, 124, 182–191. [Google Scholar] [CrossRef]
- Calsamiglia, S.; Busquet, M.; Cardozo, P.; Castillejos, L.; Ferret, A. Invited review: Essential oils as modifiers of rumen microbial fermentation. J. Dairy Sci. 2007, 90, 2580–2595. [Google Scholar] [CrossRef]
- Yarru, L.P.; Settivari, R.S.; Gowda, N.K.S.; Antoniou, E.; Ledoux, D.R.; Rottinghaus, G.E. Effects of turmeric (Curcuma longa) on the expression of hepatic genes associated with biotransformation, antioxidant, and immune systems in broiler chicks fed aflatoxin. Poult. Sci. 2009, 88, 2620–2627. [Google Scholar] [CrossRef]
- Vieira, L.V.; Schmidt, A.P.; Barbosa, A.A.; de Oliveira Feijó, J.; Brauner, C.C.; Rabassa, V.R.; Corrêa, M.N.; Schmitt, E.; Del Pino, F.A.B. Utilização de taninos como aditivo nutricional na dieta de ruminantes. Arq. De Ciênc. Vet. E Zool. Da UNIPAR 2020, 23, e2306. [Google Scholar] [CrossRef]
- Lago, R.V.P.; Wolschick, G.J.; Signor, M.H.; Giraldi, G.C.; Mollosse, V.L.; Deolindo, G.L.; Cecere, B.G.O.; Brunetto, A.L.R.; Cucco, D.C.; Bendeti, P.D.B.; et al. A mixture of free and microencapsulated essential oils combined with turmeric and tannin in the diet of cattle in the growing and finishing phase: A new tool to enhance productivity. Anim. Feed. Sci. Technol. 2024, 315, 116033. [Google Scholar] [CrossRef]
- Brunetto, A.L.; Giacomelli, C.M.; Favero, J.F.; Bissacotti, B.F.; Copeti, P.M.; Morsch, V.M.; Da Silva, A.S. Phytogenic blend in the diet of growing Holstein steers: Effects on performance, digestibility, rumen volatile fatty acid profile, and immune and antioxidant responses. Anim. Feed. Sci. Technol. 2023, 297, 115595. [Google Scholar] [CrossRef]
- National Research Council (NRC). Nutrient Requirements of Dairy Cattle; National Academy of Sciences: Washington, DC, USA, 2001.
- Silva, D.J.; Queiroz, A.C. Análises de Alimentos (Métodos Químicos e Biológicos), 3rd ed.; UFV: Abbotsford, Canada, 2002; Volume 3, p. 235. [Google Scholar]
- Van Soest, P.J.; Wine, R.H. Determination of lignin and cellulose in acid detergent fiber with permanganate. J. Assoc. Agric. Chem. 1968, 51, 780–785. [Google Scholar] [CrossRef]
- Fagliari, J.J.; Santana, A.E.; Lucas, F.A.; Campos, E.; Curi, P.R. Constituintes Sangüíneos De bovinos recém-nascidos das raças nelore (Bos indicus) e holandesa (Bos taurus) e de bubalinos (Bubalus bubalis) da raça Murrah. Arq. Bras. Med. Vet. Zootec. 1998, 50, 253–262. [Google Scholar]
- Tomasi, T.; Volpato, A.; Pereira, W.A.B.; Debastiani, L.H.; Bottari, N.B.; Morsch, V.M.; Schetinger, M.R.C.; Leal, M.L.R.; Machado, G.; Da Silva, A.S. Metaphylactic effect of minerals on the immune response, biochemical variables and antioxidant status of newborn calves. J. Anim. Physiol. Anim. Nutr. 2018, 102, 819–824. [Google Scholar] [CrossRef]
- Ali, S.F.; LeBel, C.P.; Bondy, S.C. Reactive oxygen species formation as a biomarker of methylmercury and trimethyltin neurotoxicity. Neurotoxicology 1992, 13, 637–648. [Google Scholar]
- Jentzsch, A.M.; Bachmann, H.; Furst, P.; Biesalski, H.K. Improved analysis of malondialdehyde in human body fluids. Free. Radic. Biol. Med. 1996, 20, 251–256. [Google Scholar] [CrossRef] [PubMed]
- Suzuki, K.; Ota, H.; Sasagawa, S.; Sakatani, T.; Fujikura, T. Assay method for myeloperoxidase in human polymorphonuclear leukocytes. Anal. Biochem. 1983, 132, 345–352. [Google Scholar] [CrossRef]
- Bradford, M.M. A rapid and sensitive method for the quantification of microgram quantities of protein utilizing the principle of protein-dye binding. Anal. Biochem. 1976, 72, 218–254. [Google Scholar] [CrossRef]
- Nelson, D.P.; Kiesow, L.A. Enthalpy of decomposition of hydrogen peroxide by catalase at 25 °C (with molar extinction coefficients of H2O2 solutions in the UV). Anal. Biochem. 1972, 49, 474–478. [Google Scholar] [CrossRef] [PubMed]
- McCord, J.M.; Fridovich, I. Superoxide dismutase: An enzymatic function for erythrocuprein (hemocuprein). J. Biol. Chem. 1969, 244, 6049–6055. [Google Scholar] [CrossRef]
- Bligh, E.G.; Dyer, W.J. A rapid method of total lipid extraction and purification. Can. J. Biochem. Physiol. 1959, 37, 911–917. [Google Scholar] [CrossRef]
- Hartman, L.; Lago, R.C. Rapid preparation of fatty acid methyl esters from lipids. Lab. Pract. 1973, 22, 475–477. [Google Scholar]
- Visentainer, J.V.; Franco, M.R.B. Fatty Acids in Oils and Fats: Identification and Quantification; Varela: São Paulo, Brazil, 2006. [Google Scholar]
- Vitt, M.G.; Signor, M.H.; Corrêa, N.G.; Breancini, M.; Wolschick, G.J.; Klein, B.; Silva, L.E.L.; Wagner, R.; Jung, C.T.K.; Kozloski, G.V.; et al. Combination of phytoactives in the diet of lactating Jersey cows: Effects on productive efficiency, milk composition and quality, ruminal environment, and animal health. Animals 2024, 14, 2518. [Google Scholar] [CrossRef] [PubMed]
- Cunha, M.G.; Alba, D.F.; Leal, K.W.; Marcon, H.; Milarch, C.F.; Baldissera, M.D.; Kavalek, R.L.; Kempka, A.P.; Vedovatto, M.; Silva, A.S. Microencapsulated herbal components in the diet of Lacaune ewes: Impacts on physiology and milk production and quality. An. Acad. Bras. Cienc. 2023, 95, e20201805. [Google Scholar] [CrossRef] [PubMed]
- Maxin, G.; Rulquin, H.; Glasser, F. Response of milk fat concentration and yield to nutrient supply in dairy cows. Animal 2011, 5, 1299–1310. [Google Scholar] [CrossRef]
- Jaguezeski, A.M.; Perin, G.; Bottari, N.B.; Wagner, R.; Fagundes, M.B.; Schetinger, M.R.C.; Morsch, V.M.; Stein, C.S.; Moresco, R.N.; Barreta, D.A.; et al. Addition of curcumin to the diet of dairy sheep improves health, performance and milk quality. Anim. Feed. Sci. Technol. 2018, 246, 144–157. [Google Scholar] [CrossRef]
- Hashemzadeh-Cigari, F.; Khorvash, M.; Ghorbani, G.R.; Kadivar, M.; Riasi, A.; Zebeli, Q. Effect of supplementation with a phytobiotics-rich herbal mixture on performance, udder health, and metabolic status of Holstein cows with various levels of milk somatic cell counts. J. Dairy Sci. 2014, 97, 7487–7497. [Google Scholar] [CrossRef] [PubMed]
- Wang, Z.; Zhao, Y.; Lan, X.; He, J.; Wan, F.; Shen, W.; Tang, S.; Zhou, C.; Tan, Z.; Yang, Y. Tannic acid supplementation in the diet of Holstein bulls: Impacts on production performance, physiological and immunological characteristics, and ruminal microbiota. Front. Nutr. 2022, 9, 1066074. [Google Scholar] [CrossRef]
- Abo-Donia, F.M.; Yang, L.Y.; Hristov, A.N.; Wang, M.; Tang, S.X.; Zhou, C.S.; Han, X.; Kang, J.; Tan, Z.; He, Z. Effects of tannins on the fatty acid profiles of rumen fluids and milk from lactating goats fed a total mixed ration containing rapeseed oil. Livest. Sci. 2017, 204, 16–24. [Google Scholar] [CrossRef]
- Vasta, V.; Makkar, H.P.S.; Mele, M.; Priolo, A. Ruminal biohydrogenation as affected by tannins in vitro. Br. J. Nutr. 2009, 102, 82–92. [Google Scholar] [CrossRef]
- Bechara, G.H.; Szabó, M.P.J. Processo Inflamatório. Componente e Eventos Celulares, UNESP. 2006. Available online: https://www.fcav.unesp.br/Home/departamentos/patologia/GERVASIOHENRIQUEBECHARA/INFLAM_2006.pdf (accessed on 29 December 2024).
- Hatcher, H.; Planalp, R.; Cho, J.; Torti, F.M.; Torti, S.V. Curcumin: From ancient medicine to current clinical trials. Cell. Mol. Life Sci. 2008, 65, 1631–1652. [Google Scholar] [CrossRef]
- Glombowsky, P.; Volpato, A.; Campigotto, G.; Soldá, N.M.; da S dos-Santo, D.; Bottari, N.B.; Schetinger, M.R.C.; Morsch, V.M.; Rigon, F.; Schogor, A.L.B.; et al. A adição dietética de curcumina favorece o ganho de peso e possui ação antioxidante, antiinflamatória e anticoccidiana em bezerros leiteiros. Rev. Colomb. Ciênc. Pecu. 2020, 33, 16–31. [Google Scholar] [CrossRef]
- Favaretto, J.A.; Alba, D.F.; Marchiori, M.S.; Marcon, H.J.; Souza, C.F.; Baldissera, M.D.; Bianchi, A.E.; Zanluchi, M.; Klein, B.; Wagner, R.; et al. Supplementation with a blend based on micro-encapsulated carvacrol, thymol, and cinnamaldehyde in lambs feed inhibits immune cells and improves growth performance. Livest. Sci. 2020, 240, 104144. [Google Scholar] [CrossRef]
- Prodanović, R.; Nedić, S.; Vujanac, I.; Bojkovski, J.; Nedić, S.; Jovanović, L.; Kirovski, D.; Borozan, S. Dietary supplementation of chestnut tannins in prepartum dairy cows improves antioxidant defense mechanisms interacting with thyroid status. Metabolites 2023, 13, 334. [Google Scholar] [CrossRef] [PubMed]
- Kholif, A.E.; Hassan, A.A.; El Ashry, G.M.; Bakr, M.H.; El-Zaiat, H.M.; Olafadehan, O.A.; Matloup, O.H.; Sallam, S.M.A. Phytogenic feed additives mixture enhances the lactational performance, feed utilization and ruminal fermentation of Friesian cows. Anim. Biotechnol. 2020, 32, 708–718. [Google Scholar] [CrossRef] [PubMed]
- Nora, L.; Marcon, C.; Deolindo, G.L.; Signor, M.H.; Muniz, A.L.; Bajay, M.M.; Copetti, P.M.; Bissacotti, B.F.; Morsch, V.M.; da Silva, A.S. The Effects of a Blend of Essential Oils in the Milk of Suckling Calves on Performance, Immune and Antioxidant Systems, and Intestinal Microbiota. Animals 2024, 14, 3555. [Google Scholar] [CrossRef]
- Leal, K.W.; Leal, M.L.R.; Breancini, M.; Signor, M.H.; Vitt, M.G.; Silva, L.E.L.; Wagner, R.; Jung, C.T.K.; Kozloski, G.V.; de Araujo, R.C.; et al. Essential oils and capsaicin in the diet of Jersey cows at early lactation and their positive impact on anti-inflammatory, antioxidant and immunological responses. Trop. Anim. Health Prod. 2024, 56, 247. [Google Scholar] [CrossRef]
- Tothova, C.; Nagy, O.; Kovac, G. Acute phase proteins and their use in the diagnosis of diseases in ruminants: A review. Vet. Med. 2014, 59, 163–180. [Google Scholar] [CrossRef]
- Fachini-Queiroz, F.C.; Kummer, R.; Estevão-Silva, C.F.; Carvalho, M.D.D.B.; Cunha, J.M.; Grespan, R.; Bersani-Amado, C.A.; Cuman, R.K.N. Effects of thymol and carvacrol, constituents of Thymus vulgaris L. essential oil, on the inflammatory response. Evid.-Based Complement. Altern. Med. 2012, 2012, 657026. [Google Scholar] [CrossRef]
- Gholijani, N.; Gharagozloo, M.; Farjadian, S.; Amirghofran, Z. Modulatory effects of thymol and carvacrol on inflammatory transcription factors in lipopolysaccharide-treated macrophages. J. Immunotoxicol. 2016, 13, 157–164. [Google Scholar] [CrossRef]
- Tung, Y.-T.; Chua, M.-T.; Wang, S.-Y.; Chang, S.-T. Anti-inflammation activities of essential oil and its constituents from indigenous cinnamon (Cinnamomum osmophloeum) twigs. Bioresour. Technol. 2008, 99, 850–856. [Google Scholar] [CrossRef]
- Kim, B.H.; Lee, Y.G.; Lee, J.; Lee, J.Y.; Cho, J.Y. Regulatory effect of cinnamaldehyde on monocyte/macrophage-mediated inflammatory responses. Mediat. Inflamm. 2010, 2010, 529359. [Google Scholar] [CrossRef]
- Menon, V.P.; Sudheer, A.R. Antioxidant and anti-inflammatory properties of curcumin. Adv. Exp. Med. Biol. 2007, 595, 105–125. [Google Scholar] [CrossRef]
- Peng, Y.; Ao, M.; Dong, B.; Jiang, Y.; Yu, L.; Chen, Z.; Hu, C.; Xu, R. Anti-inflammatory effects of curcumin in the inflammatory diseases: Status, limitations and countermeasures. Drug Des. Dev. Ther. 2021, 15, 4503–4525. [Google Scholar] [CrossRef] [PubMed]
- Wijesinghe, W.; Ahn, G.; Lee, W.W.; Kang, M.C.; Kim, E.A.; Jeon, Y.J. Anti-inflammatory activity of phlorotannin-rich fermented Ecklonia cava processing by-product extract in lipopolysaccharide-stimulated RAW 264.7 macrophages. J. Appl. Phycol. 2013, 25, 1207–1213. [Google Scholar] [CrossRef]
- Molosse, V.L.; Souza, C.F.; Baldissera, M.D.; Glombowsky, P.; Campigotto, G.; Cazaratto, C.J.; Stefani, L.M.; Silva, A.S.D. Diet supplemented with curcumin for nursing lambs improves animal growth, energetic metabolism, and performance of the antioxidant and immune systems. Small Rumin. Res. 2019, 170, 74–81. [Google Scholar] [CrossRef]
- Marcon, H.; Souza, C.F.; Baldissera, M.D.; Alba, D.F.; Favaretto, J.A.; Santos, D.S.; Da Silva, A.S. Effect of curcumin dietary supplementation on growth performance, physiology, carcass characteristics and meat quality in lambs. Ann. Anim. Sci. 2021, 21, 623–638. [Google Scholar] [CrossRef]
- Bentayeb, K.; Vera, P.; Rubio, C.; Nerin, C. Adaptation of the ORAC assay to the common laboratory equipment and subsequent application to antioxidant plastic films. Anal. Bioanal. Chem. 2009, 394, 903–910. [Google Scholar] [CrossRef]
- Soldado, D.; Bessa, R.J.B.; Jerónimo, E. Condensed Tannins as Antioxidants in Ruminants-Effectiveness and Action Mechanisms to Improve Animal Antioxidant Status and Oxidative Stability of Products. Animals 2021, 11, 3243. [Google Scholar] [CrossRef]
- Madrigal-Santillan, E.; Madrigal-Bujaidar, E.; Alvarez-Gonzalez, I.; Sumaya-Martínez, M.T.; Gutiérrez-Salinas, J.; Bautista, M.; Morales-Gonzalez, A.; García-Luna, Y.; Gonzalez-Rubio, M.; Aguilar-Faisal, J.L.; et al. Review of natural products with hepatoprotective effects. World J. Gastroenterol. 2014, 20, 14787. [Google Scholar] [CrossRef]
- Wellington, K.; Jarvis, B. Silymarin: A Review of its Clinical Properties in the Management of Hepatic Disorders. BioDrugs 2001, 15, 465–489. [Google Scholar] [CrossRef]
- Jakubczyk, K.; Drużga, A.; Katarzyna, J.; Skonieczna-Żydecka, K. Antioxidant potential of curcumin—A meta-analysis of randomized clinical trials. Antioxidants 2020, 9, 1092. [Google Scholar] [CrossRef]

| Variable | PMR Control 1 | PMR Phytobiotic 1 | Robot Feed |
|---|---|---|---|
| Dry matter (DM), % | 49.7 | 49.6 | 92.0 |
| Ash, % DM | 7.24 | 7.11 | 10.6 |
| Crude protein, % DM | 14.0 | 14.0 | 21.8 |
| Ethereal extract, % DM | 1.21 | 1.02 | 5.63 |
| NDF, % DM | 19.0 | 19.2 | 29.7 |
| Fatty acid, % | |||
| C4:0 (Butyric) | 0.55 | 0.57 | - |
| C6:0 (Caproic) | 0.01 | 1.31 | - |
| C12:0 (Lauric) | 0.72 | 0.70 | - |
| C13:0 (Tridecanoic) | 0.20 | 0.15 | - |
| C14:0 (Myristic) | 0.03 | 0.27 | - |
| C14:1 (Myristoleic) | 0.40 | 0.49 | - |
| C15:0 (Pentadecanoic) | 0.16 | 0.24 | - |
| C16:0 (Palmitic) | 23.6 | 24.1 | - |
| C16:1 (Palmitoleic) | 2.15 | 2.08 | - |
| C17:0 (Heptadecanoic) | 0.22 | 0.47 | - |
| C17:1 (cis-10-Heptadecenoic) | 0.04 | 0.07 | - |
| C18:0 (Stearic) | 4.22 | 4.85 | - |
| C18:1n9t (Elaidic) | 0.34 | 0.33 | - |
| C18:1n9c (Oleic) | 24.6 | 24.2 | - |
| C18:2n6c (Linoleic) | 39.6 | 38.8 | - |
| C20:0 (Arachidic) | 0.68 | 0.53 | - |
| C20:1n9 (cis-11-Eicosenoic) | 0.25 | 0.24 | - |
| C18:3n3 (a-Linolenic) | 4.20 | 4.55 | - |
| C21:0 (Henicosanoic) | 0.05 | 0.03 | - |
| C20:2 (cis-11,14-Eicosadienoic) | 0.06 | 0.03 | - |
| C22:0 (Behenic) | 0.61 | 0.43 | - |
| C20:3n6 (cis-8,11,14-Eicosatrienoic) | 0.01 | 0.02 | - |
| C20:4n6 (Arachidonic) | 0.17 | 0.11 | - |
| C24:0 (Lignoceric) | 0.70 | 0.47 | - |
| C24:1n9 (Nervonic) | 0.02 | 0.07 | - |
| Variables | Control | Phytobiotic | SEM | p: Treat 2 |
|---|---|---|---|---|
| Milk production—MP. kg (mean) | ||||
| d −7 to 1 (pre-experiment) | 22.2 | 22.6 | 0.22 | 0.95 |
| d 1 to 14 | 22.6 | 22.8 | 0.20 | 0.94 |
| d 15 to 45 | 25.2 | 26.0 | 0.19 | 0.15 |
| Fat-corrected milk (4%FCM) 1. kg | ||||
| d −7 to 1 | 18.5 | 19.5 | 0.2 | 0.84 |
| d 1 to 14 | 20.2 | 21.7 | 0.18 | 0.76 |
| d 15 to 45 | 24.5 b | 26.6 a | 0.17 | 0.01 |
| Feed intake—FI. kg (mean) | ||||
| d 1 to 14 | 16.5 | 16.2 | 0.14 | 0.95 |
| d 15 to 45 | 17.6 a | 15.8 b | 0.12 | 0.01 |
| Feed efficiency (kg DM/kg FI) | ||||
| d 15 to 45 | 1.43 b | 1.65 a | 0.04 | 0.01 |
| Body score | ||||
| d1 | 3.25 | 3.08 | 0.08 | 0.62 |
| d45 | 3.34 | 3.11 | 0.07 | 0.12 |
| Variables | Control | Phytobiotic | SEM | p: Treat 1 | p: Day 2 | p: Treat × Day 3 |
|---|---|---|---|---|---|---|
| Fat (g/kg) | 36.5 b | 40.1 a | 0.47 | 0.01 | 0.05 | 0.01 |
| Protein (g/kg) | 36.9 | 36.8 | 0.35 | 0.97 | 0.96 | 0.97 |
| Lactose (g/kg) | 46.3 | 45.8 | 0.24 | 0.88 | 0.95 | 0.93 |
| Total solids (g/kg) | 120 | 123 | 1.75 | 0.91 | 0.96 | 0.92 |
| Urea (mg/dL) | 18.3 | 19.9 | 0.64 | 0.82 | 0.89 | 0.83 |
| SCC (×103 mL) | 61.9 | 56.3 | 2.42 | 0.64 | 0.58 | 0.72 |
| Fat (g/kg) 2,3 | ||||||
| d14 | 32.9 bB | 36.9 aB | 0.46 | |||
| d28 | 34.1 bAB | 37.8 aB | 0.48 | |||
| d45 | 42.4 bA | 45.6 aA | 0.46 |
| Fatty Acid | Control | Phytobiotic | SEM | p-Value 1 |
|---|---|---|---|---|
| C4:0 (Butyric) | 0.20 | 0.19 | 0.016 | 0.95 |
| C6:0 (Caproic) | 0.09 | 0.01 | 0.033 | 0.24 |
| C10:0 (Capric) | 2.42 | 2.10 | 0.156 | 0.36 |
| C11:0 (Undecanoic) | 0.21 | 0.15 | 0.024 | 0.23 |
| C12:0 (Lauric) | 3.20 | 3.11 | 0.078 | 0.78 |
| C13:0 (Tridecanoic) | 0.13 | 0.12 | 0.005 | 0.96 |
| C14:0 (Myristic) | 12.0 | 12.5 | 0.158 | 0.92 |
| C14:1 (Myristoleic) | 0.53 | 0.53 | 0.032 | 0.94 |
| C15:0 (Pentadecanoic) | 1.11 | 1.24 | 0.044 | 0.56 |
| C16:0 (Palmitic) | 43.9 | 43.1 | 0.504 | 0.91 |
| C16:1 (Palmitoleic) | 1.17 | 1.06 | 0.043 | 0.44 |
| C17:0 (Heptadecanoic) | 0.66 | 0.67 | 0.009 | 0.98 |
| C17:1 (cis-10-Heptadecenoic) | 0.12 | 0.11 | 0.004 | 0.95 |
| C18:0 (Stearic) | 10.8 | 11.9 | 0.275 | 0.18 |
| C18:1n9t (Elaidic) | 1.50 | 1.71 | 0.058 | 0.13 |
| C18:1n9c (Oleic) | 14.4 | 15.0 | 0.369 | 0.31 |
| C18:2n6t (Linolelaidic) | 0.02 | 0.01 | 0.001 | 0.99 |
| C18:2n6c (Linoleic) | 1.25 | 1.33 | 0.027 | 0.19 |
| C20:0 (Arachidic) | 0.14 | 0.16 | 0.003 | 0.35 |
| C20:1n9 (cis-11-Eicosenoic) | 0.07 | 0.08 | 0.003 | 0.96 |
| C18:3n3 (a-Linolenic) | 0.10 | 0.12 | 0.006 | 0.55 |
| C21:0 (Henicosanoic) | 0.20 | 0.25 | 0.016 | 0.47 |
| C20:2 (cis-11.14-Eicosadienoic) | 0.02 | 0.01 | 0.002 | 0.96 |
| C22:0 (Behenic) | 0.06 | 0.07 | 0.002 | 0.95 |
| C20:3n6 (cis-8.11.14-Eicosatrienoic) | 0.07 | 0.07 | 0.002 | 0.99 |
| C20:4n6 (Arachidonic) | 0.04 | 0.04 | 0.002 | 0.98 |
| C22:2 (cis-13.16-Docosadienoic) | 0.02 | 0.01 | 0.003 | 0.96 |
| C24:0 (Lignoceric) | 0.05 | 0.04 | 0.005 | 0.94 |
| C20:5n3 (cis-5.8.11.14.17-Eicosapentaenoic) | 0.01 | 0.01 | 0.000 | 0.99 |
| C24:1n9 (Nervonic) | 0.01 | 0.01 | 0.001 | 0.99 |
| SFA 2 | 75.3 | 74.7 | 0.652 | 0.24 |
| UFA | 19.3 | 20.1 | 0.125 | 0.09 |
| MUFA | 17.8 | 18.5 | 0.097 | 0.07 |
| PUFA | 1.51 b | 1.61 a | 0.030 | 0.03 |
| UFA/SFA | 0.25 b | 0.27 a | 0.011 | 0.05 |
| Variables | Control | Phytobiotic | SEM | p: Treat 1 | p: Day 2 | p: Treat × Day 2 |
|---|---|---|---|---|---|---|
| Hematology | ||||||
| Total leukocytes (×103 μL) | 9.22 a | 8.02 b | 0.35 | 0.05 | 0.08 | 0.05 |
| Lymphocytes (×103 μL) | 5.33 a | 4.18 b | 0.23 | 0.05 | 0.05 | 0.02 |
| Granulocytes (×103 μL) | 3.16 | 3.26 | 0.20 | 0.89 | 0.82 | 0.93 |
| Monocytes (×103 μL) | 0.72 | 0.79 | 0.04 | 0.87 | 0.79 | 0.81 |
| Erythrocytes (×106 μL) | 4.98 b | 5.44 a | 0.08 | 0.05 | 0.18 | 0.12 |
| Hemoglobin (g/dL) | 9.10 | 9.31 | 0.14 | 0.26 | 0.31 | 0.26 |
| Hematocrit (%) | 26.1 | 26.4 | 0.41 | 0.92 | 0.94 | 0.88 |
| Platelets (×103 μL) | 370 | 339 | 20.9 | 0.55 | 0.63 | 0.61 |
| Serum biochemistry | ||||||
| Albumin (g/dL) | 3.40 | 3.45 | 0.08 | 0.97 | 0.95 | 0.92 |
| Total cholesterol (mg/dL) | 140 | 139 | 1.21 | 0.91 | 0.89 | 0.89 |
| Frutosamine (mg/dL) | 325 | 330 | 2.05 | 0.85 | 0.81 | 0.87 |
| GGT (U/L) 3 | 30.1 | 31.0 | 1.25 | 0.95 | 0.94 | 0.94 |
| Glucose (mg/dL) | 64.4 | 60.7 | 2.36 | 0.88 | 0.84 | 0.85 |
| Total protein (g/dL) | 6.67 b | 7.77 a | 0.11 | 0.05 | 0.01 | 0.01 |
| AST (U/L) 3 | 88.7 | 94.6 | 3.32 | 0.56 | 0.26 | 0.39 |
| ALT (U/L) 3 | 71.3 | 72.2 | 2.67 | 0.92 | 0.94 | 0.94 |
| Triglycerides (mg/dL) | 10.2 | 9.95 | 0.98 | 0.96 | 0.95 | 0.97 |
| Urea (mg/dL) | 42.4 | 45.8 | 1.54 | 0.66 | 0.51 | 0.45 |
| Globulin (g/dL) | 3.26 b | 4.31 a | 0.13 | 0.05 | 0.01 | 0.01 |
| Variables | Control | Phytobiotic | SEM | p: Treat 1 | p: Day 2 | p: Treat × Day 2 |
|---|---|---|---|---|---|---|
| Proteinogram | ||||||
| IgA (g/dL) | 0.75 b | 0.98 a | 0.03 | 0.01 | 0.01 | 0.01 |
| Heavy-chain Ig (g/dL) | 1.12 b | 1.46 a | 0.05 | 0.01 | 0.01 | 0.01 |
| Ceruloplasmin (g/dL) | 0.65 a | 0.52 b | 0.02 | 0.05 | 0.22 | 0.26 |
| Haptoglobin (g/dL) | 0.61 a | 0.42 b | 0.02 | 0.01 | 0.01 | 0.01 |
| Ferritin (g/dL) | 0.40 | 0.37 | 0.01 | 0.65 | 0.74 | 0.68 |
| Transferrin (g/dL) | 0.32 b | 0.36 a | 0.01 | 0.05 | 0.02 | 0.05 |
| Cytokines | ||||||
| IL-1β (pg/mL) | 56.9 a | 42.9 b | 2.58 | 0.01 | 0.01 | 0.01 |
| IL-6 (pg/mL) | 40.1 a | 29.5 b | 2.27 | 0.04 | 0.01 | 0.01 |
| IL-10 (pg/mL) | 65.8 b | 94.3 a | 3.41 | 0.01 | 0.01 | 0.01 |
| TNF (pg/mL) | 164 a | 135 b | 5.02 | 0.03 | 0.01 | 0.01 |
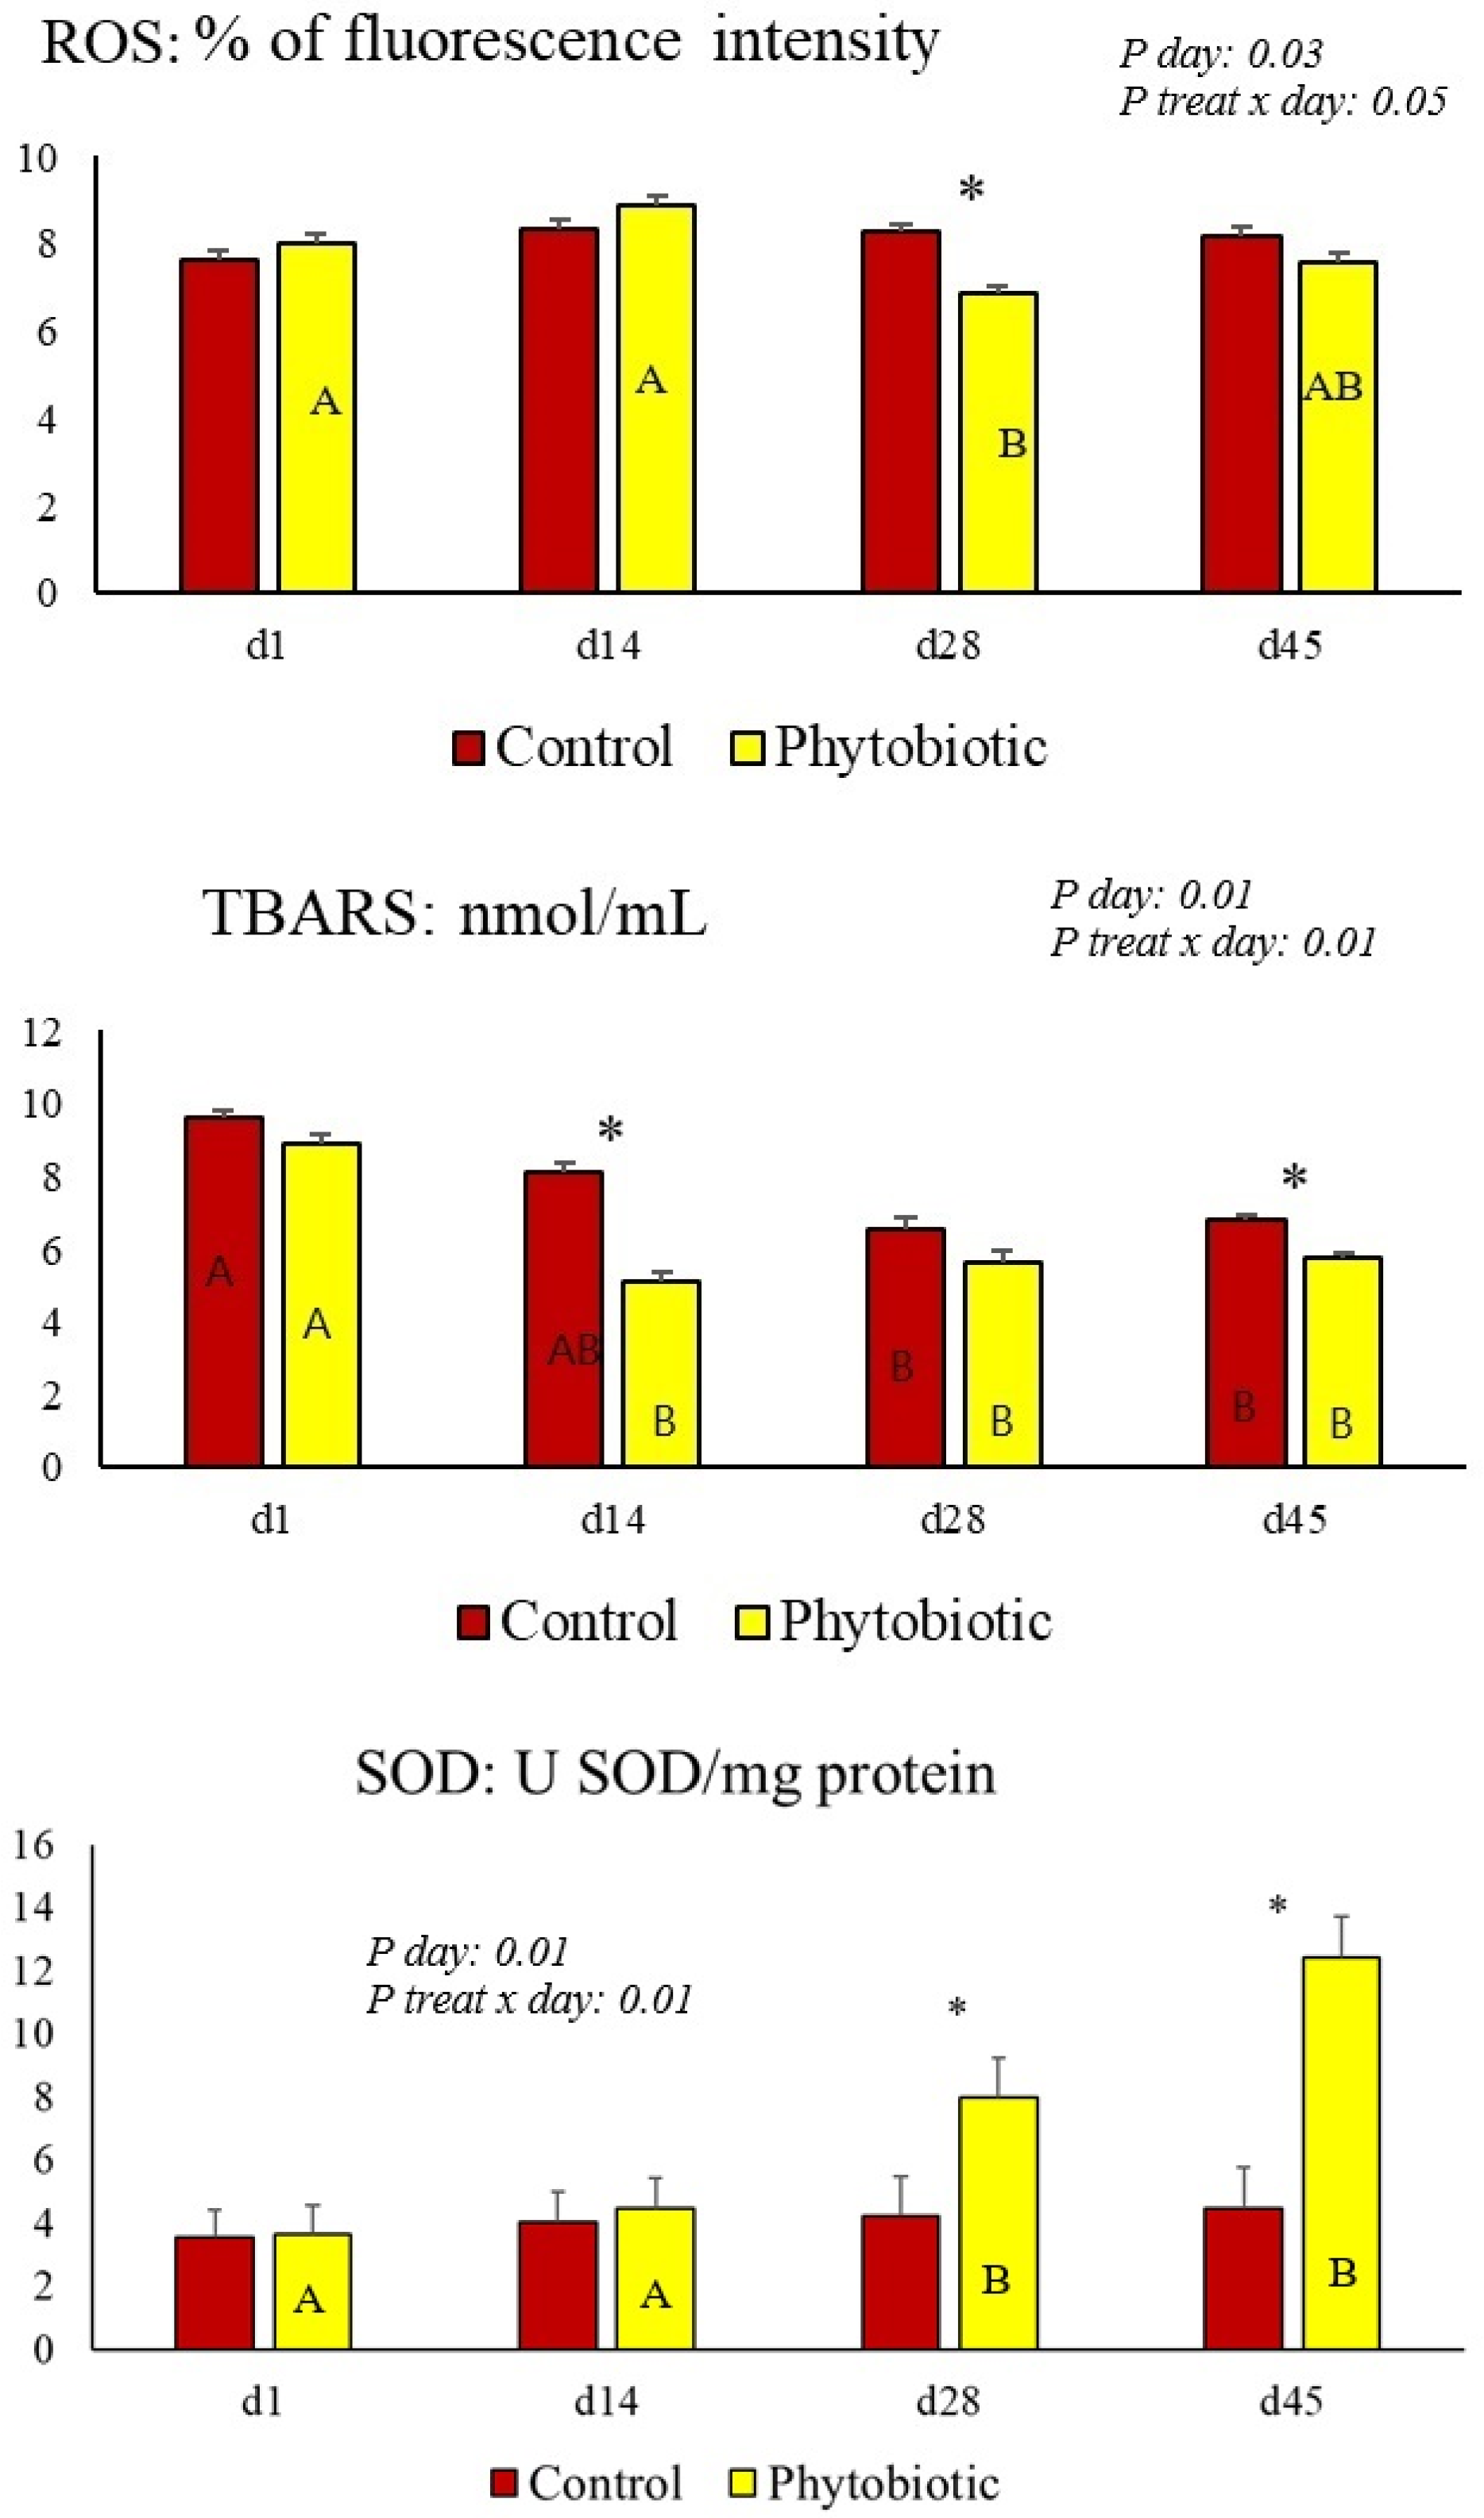
| Oxidative status | ||||||
| ROS 3 (% of fluorescence intensity) | 8.20 a | 7.60 b | 0.22 | 0.19 | 0.03 | 0.05 |
| TBARS (nmol/mL) | 6.83 a | 5.77 b | 0.13 | 0.02 | 0.01 | 0.01 |
| MPO (µM quinoneimin/30 min) | 2.27 | 2.75 | 0.02 | 0.05 | 0.14 | 0.20 |
| CAT (nmol CAT/mg of protein) | 9.74 | 11.2 | 0.45 | 0.04 | 0.11 | 0.13 |
| SOD (U SOD/mg of protein) | 4.23 | 8.23 | 0.31 | 0.01 | 0.01 | 0.01 |
Disclaimer/Publisher’s Note: The statements, opinions and data contained in all publications are solely those of the individual author(s) and contributor(s) and not of MDPI and/or the editor(s). MDPI and/or the editor(s) disclaim responsibility for any injury to people or property resulting from any ideas, methods, instructions or products referred to in the content. |
© 2025 by the authors. Licensee MDPI, Basel, Switzerland. This article is an open access article distributed under the terms and conditions of the Creative Commons Attribution (CC BY) license (https://creativecommons.org/licenses/by/4.0/).
Share and Cite
de Mello, E.P.; Bajay, M.M.; dos Santos, T.L.; de Jesus, R.S.; Deolindo, G.L.; Nora, L.; Tortelli, M.A.; da Silva, G.B.; Manica, D.; Bagatini, M.D.; et al. A Mixture of Free and Microencapsulated Essential Oils Combined with Turmeric and Tannin in the Diet of Dairy Cows: Effects on Productive Efficiency and Animal Health. Animals 2025, 15, 1588. https://doi.org/10.3390/ani15111588
de Mello EP, Bajay MM, dos Santos TL, de Jesus RS, Deolindo GL, Nora L, Tortelli MA, da Silva GB, Manica D, Bagatini MD, et al. A Mixture of Free and Microencapsulated Essential Oils Combined with Turmeric and Tannin in the Diet of Dairy Cows: Effects on Productive Efficiency and Animal Health. Animals. 2025; 15(11):1588. https://doi.org/10.3390/ani15111588
Chicago/Turabian Stylede Mello, Emeline Pizzolatto, Miklos Maximiliano Bajay, Tainara Leticia dos Santos, Renato Santos de Jesus, Guilherme Luiz Deolindo, Luisa Nora, Mario Augusto Tortelli, Gilnei Bruno da Silva, Daiane Manica, Margarete Dulce Bagatini, and et al. 2025. "A Mixture of Free and Microencapsulated Essential Oils Combined with Turmeric and Tannin in the Diet of Dairy Cows: Effects on Productive Efficiency and Animal Health" Animals 15, no. 11: 1588. https://doi.org/10.3390/ani15111588
APA Stylede Mello, E. P., Bajay, M. M., dos Santos, T. L., de Jesus, R. S., Deolindo, G. L., Nora, L., Tortelli, M. A., da Silva, G. B., Manica, D., Bagatini, M. D., Machado, F., Jr., & da Silva, A. S. (2025). A Mixture of Free and Microencapsulated Essential Oils Combined with Turmeric and Tannin in the Diet of Dairy Cows: Effects on Productive Efficiency and Animal Health. Animals, 15(11), 1588. https://doi.org/10.3390/ani15111588