
Central and Peripheral Fatigue Evaluation during Physical Exercise in Athletic Horses by Means of Raman Spectroscopy
 , , , ,
Abstract
:Simple Summary
Abstract
1. Introduction
2. Materials and Methods
2.1. Horses and Sample Preparation
2.2. FT Raman Spectroscopy and Data Analysis
2.3. Statistical Analysis
3. Results
4. Discussion
5. Conclusions
Author Contributions
Funding
Institutional Review Board Statement
Informed Consent Statement
Data Availability Statement
Conflicts of Interest
References
- Caola, G. Fisiologia Dell’esercizio Fisico Del Cavallo, 1st ed.; Calderini Edagricole: Bologna, Italy, 2001. [Google Scholar]
- Wan, J.J.; Qin, Z.; Wang, P.Y.; Sun, Y.; Liu, X. Muscle fatigue: General understanding and treatment. Exp. Mol. Med. 2017, 49, e384. [Google Scholar] [CrossRef] [Green Version]
- Pösö, A.R.; Hyyppa, S.; Geor, R.J. Metabolic responses to exercise and training. In Equine Sports Medicine and Surgery; Hinchcliff, K.W., Kaneps, A., Geor, R.J., Eds.; Saunders: London, UK, 2004; pp. 771–792. [Google Scholar]
- Farris, J.W.; Hinchcliff, K.W.; McKeever, K.H.; Lamb, D.R.; Thompson, D.L. Effect of tryptophan and of glucose on exercise capacity of horses. J. Appl. Physiol. 1998, 85, 807–816. [Google Scholar] [CrossRef] [Green Version]
- Evans, D.L. Welfare of the Racehorse During Exercise Training and Racing. In The Welfare of Horses; Waran, N., Ed.; Animal Welfare; Springer: Dordrecht, The Netherlands, 2007; Volume 1. [Google Scholar] [CrossRef]
- Allen, K.J.; van Erch-Westergren, E.; Franklin, S.H. Exercise testing in the equine athlete. Equine Vet. Educ. 2016, 28, 89–98. [Google Scholar] [CrossRef]
- Jang, H.-J.; Kim, J.W.; Ryu, S.H.; Kim, Y.J.; Kwon, O.; Kim, S.; Kim, S.; Kim, K.-B. Metabolic profiling of antioxidant supplement with phytochemicals using plasma 1H NMR-based meta-bolomics in humans. J. Funct. Foods 2016, 24, 112–121. [Google Scholar] [CrossRef]
- Barding, G.A., Jr.; Salditos, R.; Larive, C.K. Quantitative NMR for bio- analysis and metabolomics. Anal. Bioanal. Chem. 2012, 404, 1165–1179. [Google Scholar] [CrossRef] [PubMed]
- van den Berg, R.A.; Hoefsloot, H.C.; Westerhuis, J.A.; Smilde, A.K.; van der Werf, M.J. Centering, scaling, and transformations: Improving the biological information content of metabolomics data. BMC Genom. 2006, 7, 142. [Google Scholar] [CrossRef] [PubMed] [Green Version]
- Asher, S.A. UV resonance Raman studies of molecular structure and dynamics: Applications in physical and biophysical chemistry. Annu. Rev. Phys Chem. 1988, 39, 537–588. [Google Scholar] [CrossRef] [PubMed]
- Dong, J.; Wan, Z.; Popov, M.; Carey, P.R.; Weiss, M.A. Insulin assembly damps conformational fluctuations: Raman analysis of amide I linewidths in native states and fibrils. J. Mol. Biol. 2003, 330, 431–442. [Google Scholar] [CrossRef]
- Acri, G.; Falcone, A.; Giannetto, C.; Giudice, E.; Piccione, G.; Testagrossa, B.; Cicero, L.; Cassata, G.; Di Pietro, S. Preliminary study for the application of Raman spectroscopy for the identification of Leishmania infected dogs. Sci. Rep. 2022, 12, 7489. [Google Scholar] [CrossRef]
- Li, Y.; Lin, H.; He, Q.; Zuo, C.; Lin, M.; Xu, T. Label-Free Detection and Classification of Glaucoma Based on Drop-Coating Deposition Raman Spectroscopy. Appl. Sci. 2023, 13, 6476. [Google Scholar] [CrossRef]
- Acri, G.; Sansotta, C.; Salmeri, F.M.; Romeo, M.; Ruello, E.V.; Denaro, L.; Testagrossa, B. Use of Raman Spectroscopy, Scanning Electron Microscopy and Energy Dispersive X-ray Spectroscopy in a Multi-Technique Approach for Physical Char-acterization of Purple Urine Bag Syndrome. Appl. Sci. 2022, 12, 4034. [Google Scholar] [CrossRef]
- Sikirzhytski, V.; Sikirzhytskaya, A.; Lednev, I.K. Multidimensional Raman spectroscopic signature of sweat and its potential application to forensic body fluid identification. Anal. Chim. Acta. 2012, 718, 78–83. [Google Scholar] [CrossRef] [PubMed]
- Venuti, V.; Crupi, V.; Fazio, B.; Majolino, D.; Acri, G.; Testagrossa, B.; Stancanelli, R.; De Gaetano, F.; Gagliardi, A.; Paolino, D.; et al. Physicochemical Characterization and Antioxidant Activity Evaluation of Idebenone/Hydroxypropyl-β-Cyclodextrin Inclusion Complex †. Biomolecules 2019, 9, 531. [Google Scholar] [CrossRef] [PubMed] [Green Version]
- Oladepo, S.A.; Xiong, K.; Hong, Z.; Asher, S.A.; Handen, J.; Lednev, I.K. UV resonance Raman investigations of peptide and protein structure and dynamics. Chem. Rev. 2012, 112, 2604–2628. [Google Scholar] [CrossRef] [Green Version]
- Orkoula, M.G.; Kontoyannis, C.G. Raman spectroscopy for the study of biological organisms (biogenic materials and biological tissues): A valuable analytical tool. Spectrosc. Eur. 2014, 26, 16–19. [Google Scholar]
- Kuhar, N.; Sil, S.; Verma, T.; Umapathy, S. Challenges in application of Raman spectroscopy to biology and materials. RSC Adv. 2018, 8, 25888–25908. [Google Scholar] [CrossRef]
- Acri, G.; Micali, A.; D’Angelo, R.; Puzzolo, D.; Aragona, P.; Testagrossa, B.; Aragona, E.; Wylegala, E.; Nowinska, A. Raman Spectroscopic Study of Amyloid Deposits in Gelatinous Drop-like Corneal Dystrophy. J. Clin. Med. 2022, 11, 1403. [Google Scholar] [CrossRef]
- Acri, G.; Testagrossa, B.; Faenza, P.; Caridi, F. Spectroscopic Analysis of pigments of the Antonello Gagini annunciation’s sculptural marble group, church of St. Thodore martyr (Bagaladi, Reggio calabria, Italy): Case study. Mediterr. Archaeol. Archaeom. 2020, 20, 1–5. [Google Scholar] [CrossRef]
- Mapstone, M.; Cheema, A.K.; Fiandaca, M.S.; Zhong, X.; Mhyre, T.R.; MacArthur, L.H.; Hall, W.J.; Fisher, S.G.; Peterson, D.R.; Haley, J.M.; et al. Plasma phospholipids identify antecedent memory impairment in older adults. Nat. Med. 2014, 20, 415–418. [Google Scholar] [CrossRef] [Green Version]
- Acri, G.; Romano, C.; Costa, S.; Pellegrino, S.; Testagrossa, B. Raman Spectroscopy Technique: A Non-Invasive Tool in Celiac Disease Diagnosis. Diagnostics 2021, 11, 1277. [Google Scholar] [CrossRef]
- Pezzotti, G. Raman spectroscopy in cell biology and microbiology. J. Raman Spectrosc. 2021, 52, 2348–2443. [Google Scholar] [CrossRef]
- Stewart, S.; Fredericks, P.M. Surface-enhanced Raman spectroscopy of amino acids adsorbed on an electrochemically prepared silver surface. Spectrochim. Acta A Mol. Biomol. Spectros. 1999, 55, 1641–1660. [Google Scholar] [CrossRef]
- Klein, D.J.; Anthony, T.G.; McKeever, K.H. Metabolomics in equine sport and exercise. J. Anim. Physiol. Anim. Nutr. 2021, 105, 140–148. [Google Scholar] [CrossRef] [PubMed]
- Staritzbichler, R.; Hunold, P.; Estrela-Lopis, I.; Hildebrand, P.W.; Isermann, B.; Kaiser, T. Raman spectroscopy on blood serum samples of patients with end-stage liver disease. PLoS ONE 2021, 16, e0256045. [Google Scholar] [CrossRef] [PubMed]
- McCurnin, D.; Bassert, J. Clinical Textbook for Veterinary Technicians, 5th ed.; Saunders: Philadelphia, PA, USA, 2002. [Google Scholar]
- Arfuso, F.; Giannetto, C.; Giudice, E.; Fazio, F.; Panzera, M.; Piccione, G. Peripheral modulators of the central fatigue development and their relationship with athletic performance in jumper horses. Animals 2021, 11, 743. [Google Scholar] [CrossRef] [PubMed]
- Piccione, G.; Messina, V.; Bazzano, M.; Giannetto, C.; Fazio, F. Heart rate, net cost of transport, and metabolic power in horse subjected to different physical exercises. J. Equine Vet. Sci. 2013, 33, 386–389. [Google Scholar] [CrossRef]
- Castiglione, F.; Crupi, V.; Majolino, D.; Mele, A.; Rossi, B.; Trotta, F.; Venuti, V. Vibrational spectroscopy investigation of swelling phenomena in cyclodextrin nanosponges. J. Raman Spectrosc. 2013, 44, 1463–1469. [Google Scholar] [CrossRef]
- Usoltsev, D.; Sitnikova, V.; Kajava, A.; Uspenskaya, M. Systematic FTIR spectroscopy study of the secondary structure changes in human serum albumin under various denaturation conditions. Biomolecules 2019, 9, 359. [Google Scholar] [CrossRef] [Green Version]
- Susi, H.; Byler, M. Protein structure by fourier transform infrared spectroscopy: Second derivative spectra. Biochem. Biophys. Res. Commun. 1988, 115, 391–397. [Google Scholar] [CrossRef]
- Zheng, X.; Lv, G.; Du, G.; Zhai, Z.; Mo, J.; Lv, X. Rapid and Low-Cost Detection of Thyroid Dysfunction Using Raman Spectroscopy and an Improved Support Vector Machine. IEEE Photonics J. 2018, 10, 1–12. [Google Scholar] [CrossRef]
- Dong, A.C.; Huang, P.; Caughey, B.; Caughey, W.S. Infrared Analysis of Ligand- and Oxidation-Induced Conformational Changes in Hemoglobins and Myoglobins. Arch. Biochem. Biophys. 1995, 316, 893–898. [Google Scholar] [CrossRef] [PubMed]
- Cameron, D.; Moffatt, D.A. Generalized approach to derivative spectroscopy. Appl. Spectrosc. 1987, 41, 539–544. [Google Scholar] [CrossRef]
- Giannetto, C.; Acri, G.; Giudice, E.; Arfuso, F.; Testagrossa, B.; Piccione, G. Quantifying Serum Total Lipids and Tryptophan Concentrations by Raman Spectroscopy During Standardized Obstacle Course in Horses. J. Equine Vet. Sci. 2021, 108, 103820. [Google Scholar] [CrossRef] [PubMed]
- Kurouski, D.; Van Duyne, R.P.; Lednev, I.K. Exploring the structure and formation mechanism of amyloid fibrils by Raman spectroscopy: A review. Analyst 2015, 140, 4967–4980. [Google Scholar] [CrossRef]
- Silveira, L.; Borges, R.D.C.F.; Navarro, R.S.; Giana, H.E.; Zângaro, R.A.; Pacheco, M.T.T.; Fernandes, A.B. Quantifying glucose and lipid components in human serum by Raman spectroscopy and multivariate statistic. Laseres Med. Sci. 2017, 32, 787–795. [Google Scholar] [CrossRef]
- Herrero, A.M.; Cambero, M.I.; Ordóñez, J.A.; de la Hoz, L.; Carmona, P. Raman spectroscopy study of the structural effect of microbial transglutaminase on meat systems and its relationship with textural characteristics. Food Chem. 2008, 109, 25–32. [Google Scholar] [CrossRef] [Green Version]
- Stone, N.; Kendall, C.; Smith, J.; Crow, P.; Barr, H. Raman spectroscopy for identification of epithelial cancers. Faraday Discuss. 2004, 126, 141–157. [Google Scholar] [CrossRef]
- Stone, N.; Kendell, C.; Shepherd, N.; Crow, P.; Barr, H. Near-infrared Raman spectroscopy for the classification of epithelial pre-cancers and cancers. J. Raman Spectrosc. 2002, 33, 564–573. [Google Scholar] [CrossRef]
- Shao, L.; Zhang, A.; Rong, Z.; Wang, C.; Jia, X.; Zhang, K.; Xiao, R.; Wang, S. Fast and non-invasive serum detection technology based on surface-enhanced Raman spectroscopy and multivariate statistical analysis for liver disease. Nanomed. Nanotechnol. Biol. Med. 2018, 14, 451–459. [Google Scholar] [CrossRef]
- Rygula, A.; Majzner, K.; Marzec, K.M.; Kaczor, A.; Pilarczyk, M.; Baranska, M. Raman spectroscopy of proteins: A review. J. Raman Spectrosc. 2013, 44, 1061–1076. [Google Scholar] [CrossRef]
- Sjoberg, B.; Foley, S.; Cardey, B.; Enescu, M. An experimental and theoretical study of the amino acid side chain Raman bands in proteins. Spectrochim. Acta A Mol. Biomol. Spectrosc. 2014, 128, 300–311. [Google Scholar] [CrossRef] [PubMed]
- Birech, Z.; Mwangi, P.W.; Bukachi, F.; Mandela, K.M. Application of Raman spectroscopy in type 2 diabetes screening in blood using leucine and isoleucine amino-acids as biomarkers and in comparative anti-diabetic drugs efficacy studies. PLoS ONE 2017, 12, e0185130. [Google Scholar] [CrossRef] [PubMed] [Green Version]
- Zhou, G.; Yu, D.; Li, S.; Yang, D. Surface enhanced Raman spectroscopy of leucine and isoleucine. Acta Chim. Sin. 2007, 65, 640. [Google Scholar] [CrossRef]
- Guangyong, Z.; Xian, Z.; Qi, F.; Xueliang, W. Raman spectra of amino acids and their aqueous solutions. Spectrochim. Acta Part A 2011, 78, 1187–1195. [Google Scholar] [CrossRef]
- Belen, H.; Fernando, P.; Mama, N.; Mahmoud, G. Vibrational analysis of amino acids and short peptides in hydrated media. iv. amino acids with hydrophobic side chains: L-Alanine, L-Valine, and L-Isoleucine. J. Phys. Chem. B. 2009, 113, 3169–3178. [Google Scholar] [CrossRef]
- Zhan, R.; Liu, B. End functionalized nonionic water-dispersible conjugated polymers. Macromol. Rapid Commun. 2017, 38, 1700010. [Google Scholar] [CrossRef] [Green Version]
- Pösö, A.R.; Viljanen-Tarifa, E.; Soveri, T.; Oksanen, H.E. Exercise-Induced Transient Hyperlipidemia in the Racehorse. J. Vet. Med. Ser. A 1989, 36, 603–611. [Google Scholar] [CrossRef]
- Arfuso, F.; Giannetto, C.; Giudice, E.; Fazio, F.; Piccione, G. Dynamic modulation of platelet aggregation, albumin and nonesterified fatty acids during physical exercise in Thoroughbred horses. Res. Vet. Sci. 2016, 104, 86–91. [Google Scholar] [CrossRef]
- Eaton, M.D. Energetics and performance. In The Athletic Horse; Hodgson, D.R., Rose, R.J., Eds.; Saunders: Phyladelphia, PA, USA, 1994; pp. 49–61. [Google Scholar]
- Fernstrom, J.D.; Fernstrom, M.H.; Grubb, P.E. Twenty-four-hour variations in rat blood and brain levels of the aromatic and branched-chain amino acids: Chronic effects of dietary protein content. Metabolism 1987, 36, 643–650. [Google Scholar] [CrossRef]
- Horowitz, M.; Nauck, M.A. To be or not to be--an incretin or enterogastrone? Gut 2006, 55, 148–150. [Google Scholar] [CrossRef] [Green Version]
- Assenza, A.; Bergero, D.; Congiu, F.; Tosto, F.; Giannetto, C.; Piccione, G. Evaluation of serum electrolytes and blood lactate concentration during repeated maximal exercise in horse. J. Equine Vet. Sci. 2014, 34, 1175–1180. [Google Scholar] [CrossRef] [Green Version]
- Hodgson, D.R.; Rose, R.J. Changes in Plasma or Serum Biochemical and Hormonal Values Associated with Training. In The Athletic Horse: Principles and Practice of Equine Sports Medicine; Saunders: Phyladelphia, PA, USA, 1994. [Google Scholar] [CrossRef]
- Ullah, R.; Khan, S.; Chaudhary, I.I.; Shahzad, S.; Ali, H.; Bilal, M. Cost effective and efficient screening of tuberculosis disease with Raman spectroscopy and machine learning algorithms. Photodiagnosis Photodyn. Ther. 2020, 32, 101963. [Google Scholar] [CrossRef] [PubMed]
- Bilal, M.; Ullah, R.; Khan, S.; Ali, H.; Saleem, M.; Ahmed, M. Lactate based optical screening of dengue virus infection in human sera using Raman spectroscopy. Biomed. Opt. Express 2017, 8, 1250. [Google Scholar] [CrossRef] [Green Version]
- Lin, H.; Lee, H.J.; Tague, N.; Lugagne, J.-B.; Zong, C.; Deng, F.; Shin, J.; Tian, L.; Wong, W.; Dunlop, M.J.; et al. Microsecond fingerprint stimulated Raman spectroscopic imaging by ultrafast tuning and spatial-spectral learning. Nat. Commun. 2021, 12, 3052. [Google Scholar] [CrossRef] [PubMed]
- Arfuso, F.; Assenza, A.; Fazio, F.; Rizzo, M.; Giannetto, C.; Piccione, G. Dynamic change of serum levels of some branched-chain amino acids and tryptophan in athletic horses after different physical exercises. J. Equine Vet. Sci. 2019, 77, 12–16. [Google Scholar] [CrossRef] [PubMed]
- Bergero, D.; Assenza, A.; Schiavone, A.; Piccione, G.; Perona, G.; Caola, G. Amino acid concentrations in blood serum of horses performing long lasting low-intensity exercise. J. Anim. Physiol. Anim. Nutr. 2005, 89, 146–150. [Google Scholar] [CrossRef]


| Data Points | ||||
|---|---|---|---|---|
| Before | After Exercise | After 30 min | After 60 min | |
| Rectal temperature (°C) | 36.98 ± 0.34 | 37.94 ± 0.43 | 37.56 ± 0.28 | 37.22 ± 0.19 |
| Heart rate (bpm) | 39.60 ± 2.60 | 199.00 ± 21.90 | 55.20 ± 3.34 | 40.80 ± 3.03 |
| Lactic acid (mmol/L) | 1.11 ± 0.07 | 4.06 ± 0.34 | 2.10 ± 0.66 | 1.23 ± 0.18 |
| Glucose (mg/dL) | 74.80 ± 6.76 | 55.60 ± 8.90 | 76.40 ± 4.33 | 76.20 ± 6.26 |
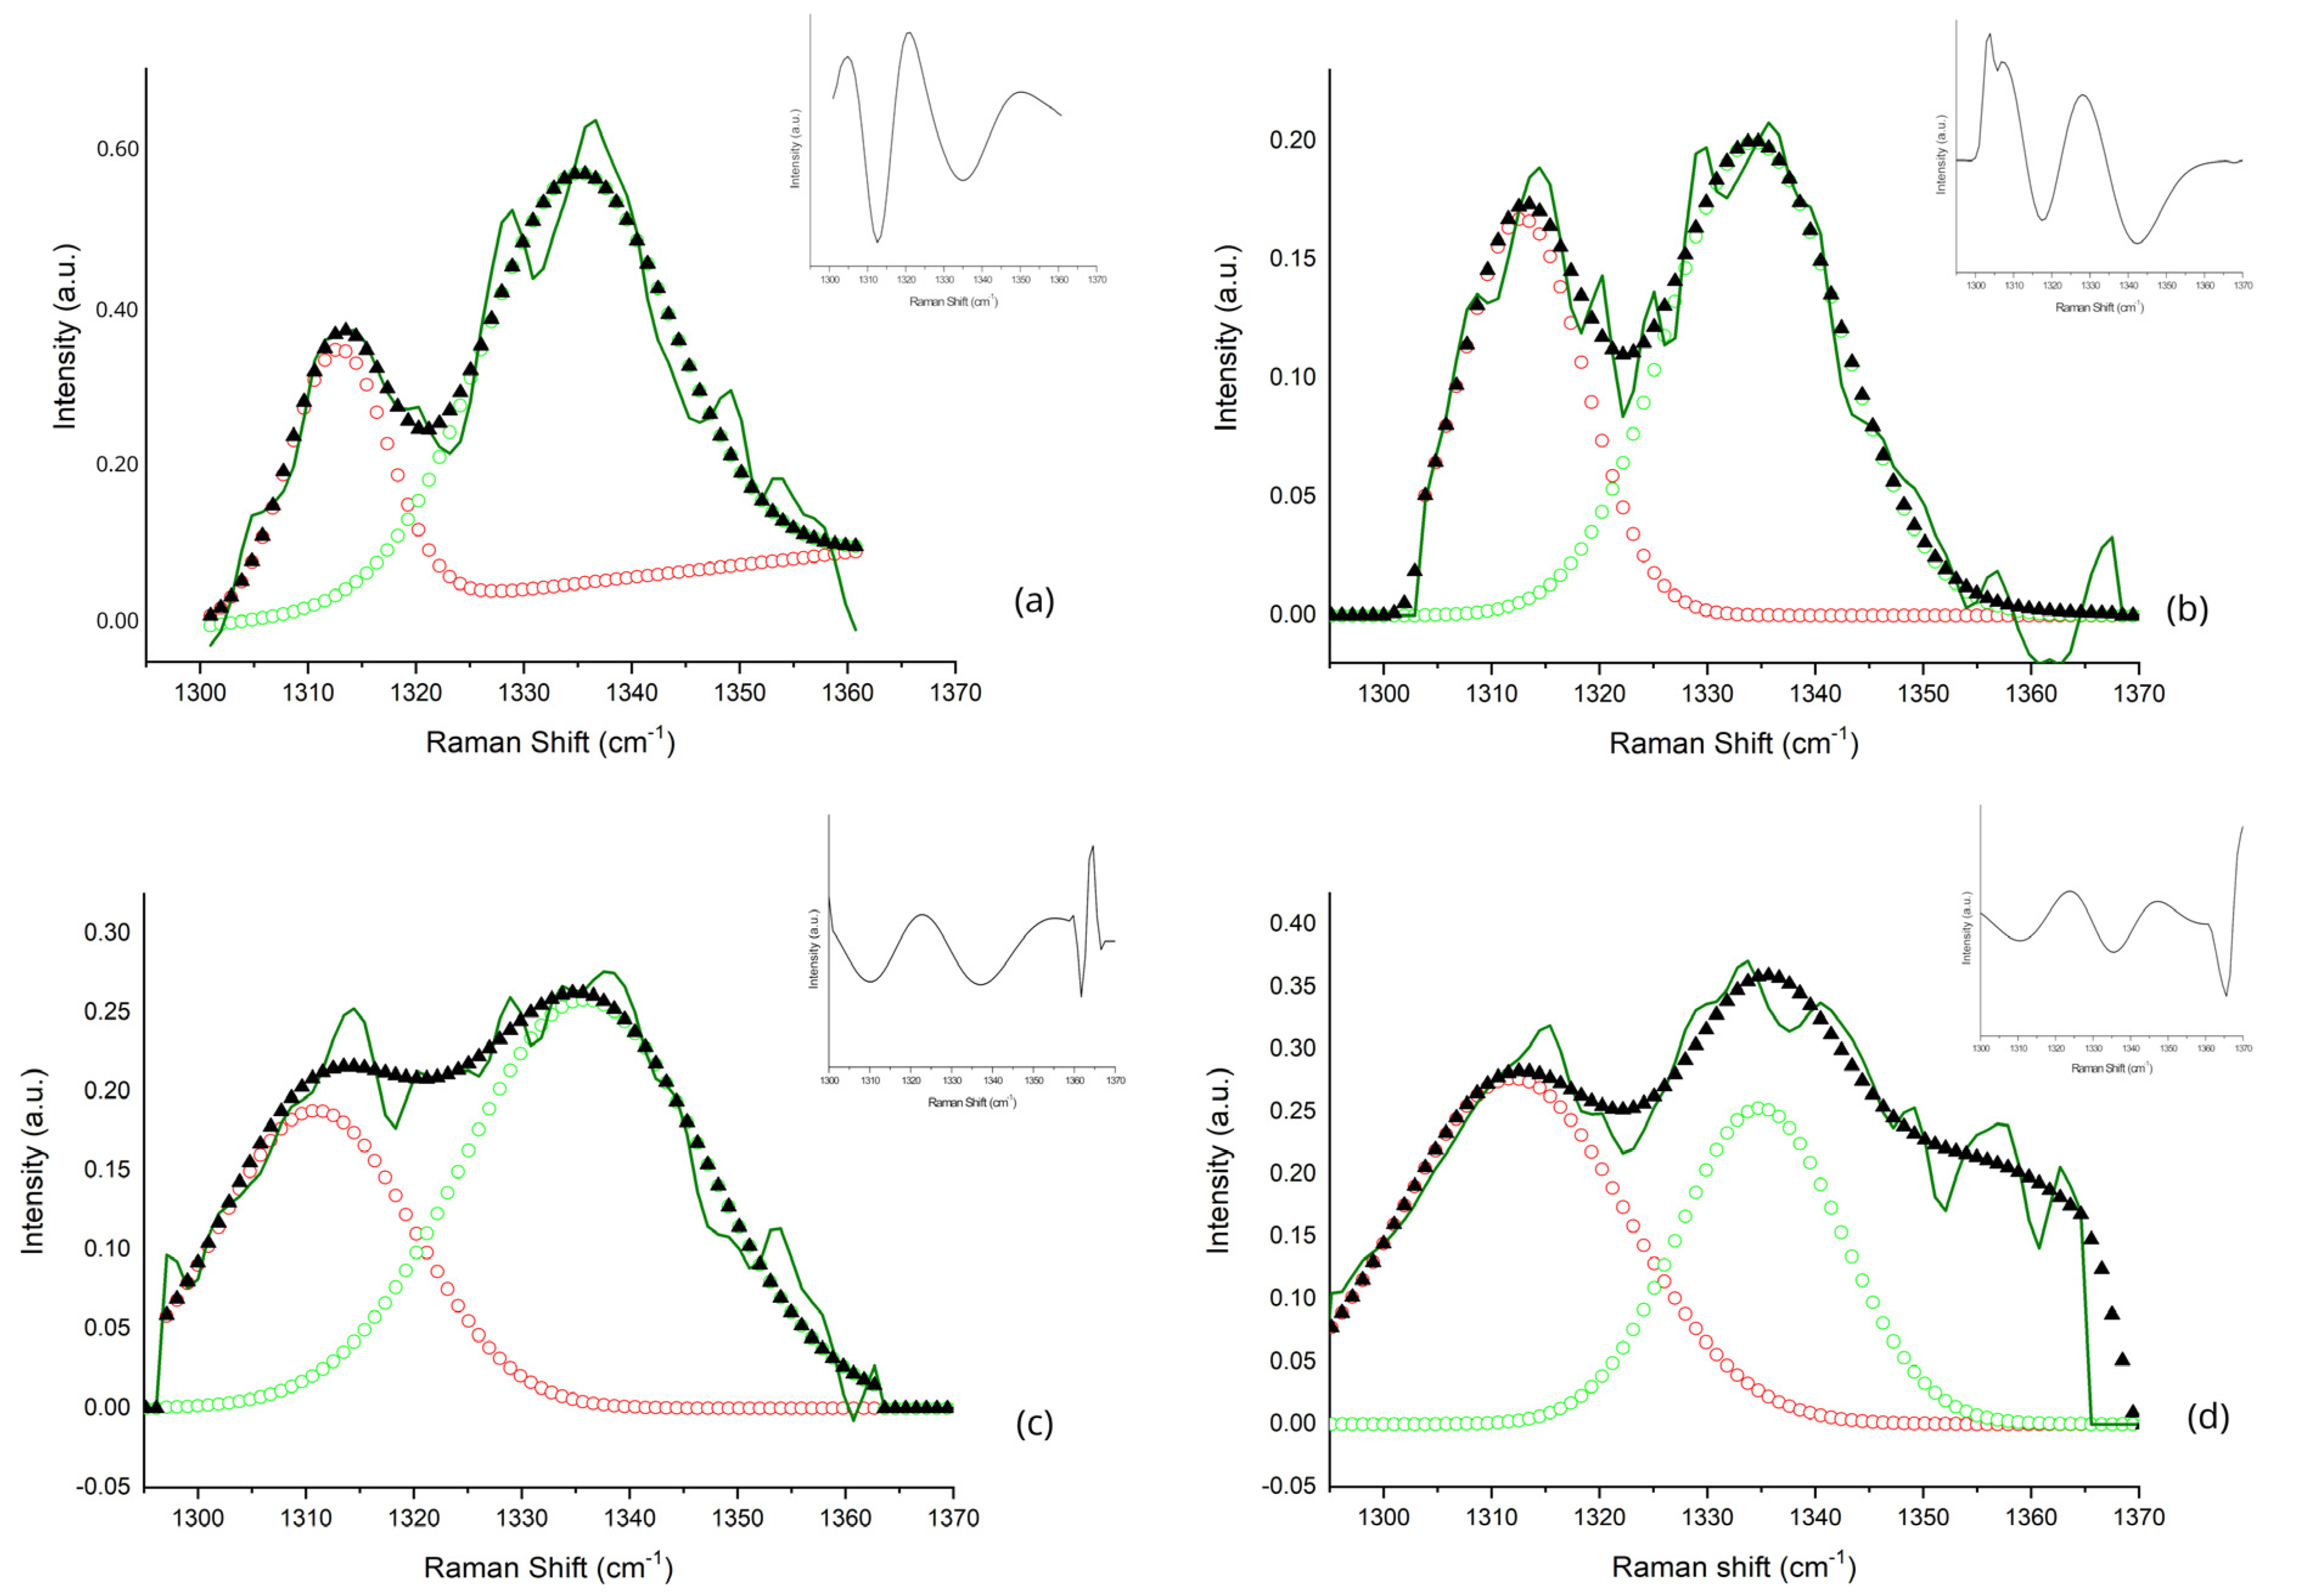
| Sub-Band ID | Center Frequency (cm−1) | Metabolic Biomarker | Vibrational Mode | References |
|---|---|---|---|---|
| A | 1312 | Lipids | τ(CH3CH2) | [31,33,34] |
| B | 1336 | Tryptophan | γ(CH2) | [35,36] |
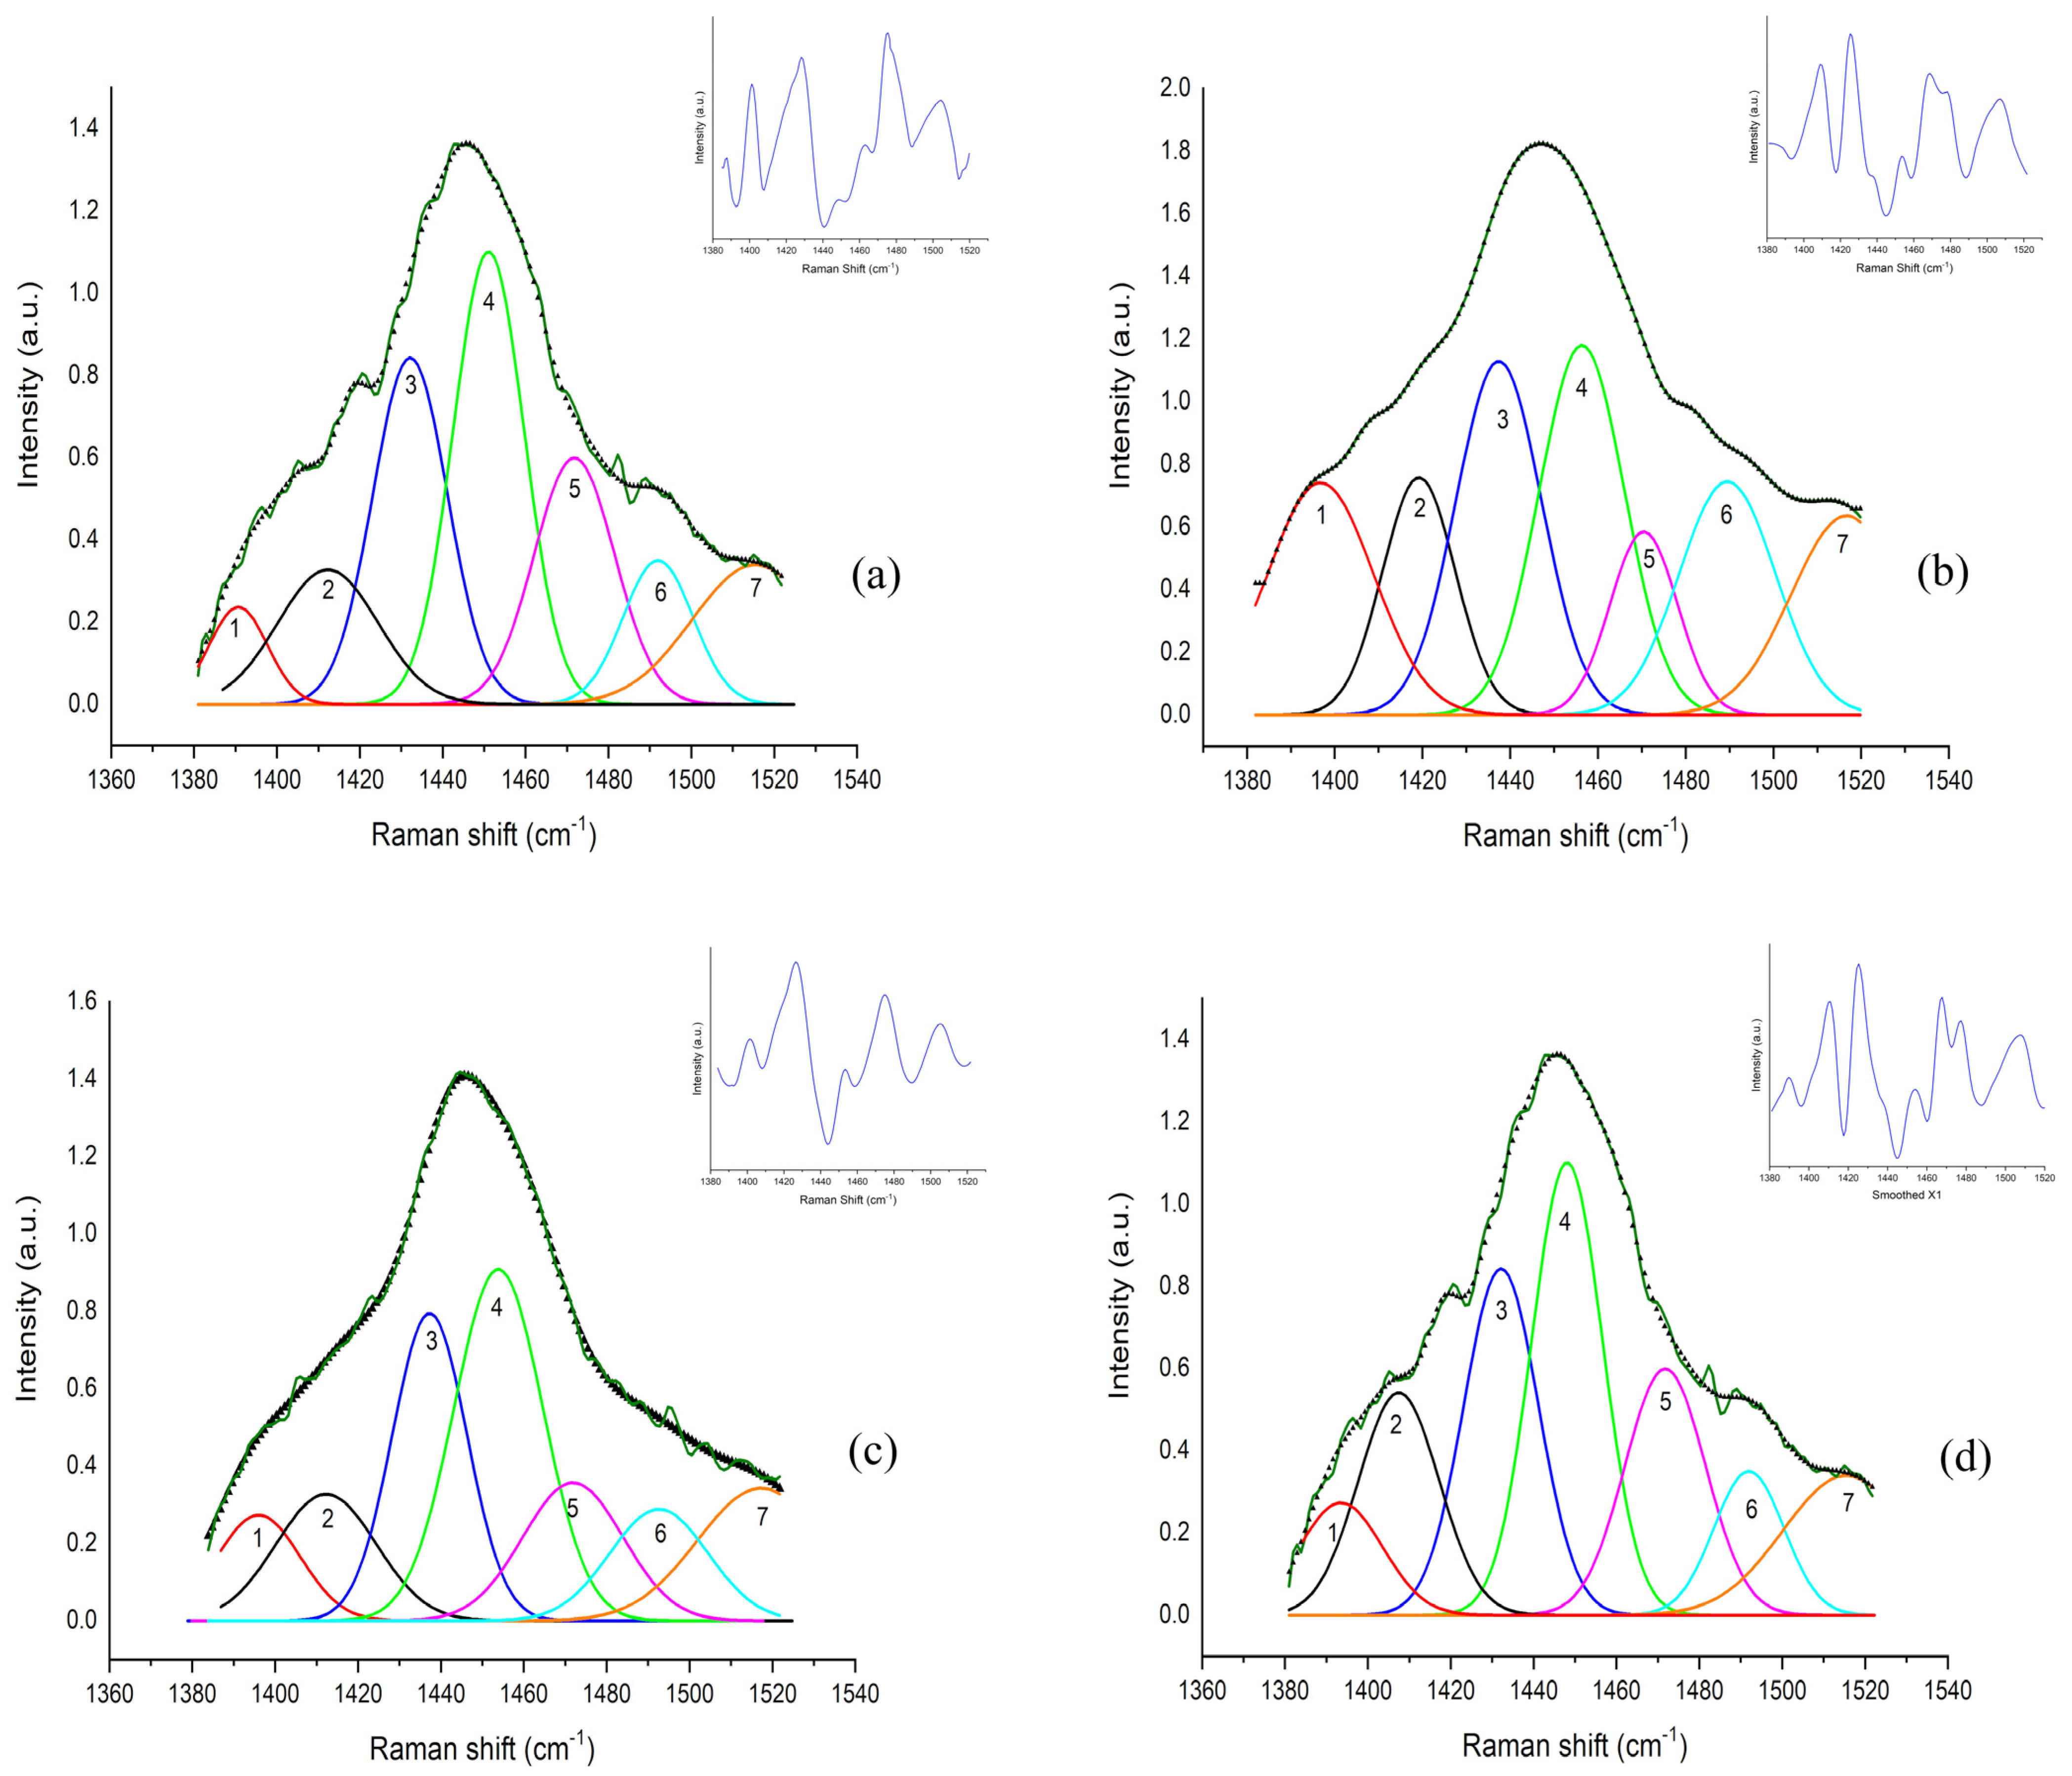
| Sub-Band ID | Center Frequency (cm−1) | Metabolic Biomarker | Vibrational Mode | References |
|---|---|---|---|---|
| 1 | 1393 | Leucine | γ(CH2), δ(CCH) | [32,36,37] |
| 2 | 1413 | Glycine | s(COO−) | [36,38] |
| 3 | 1437 | Isoleucine | Cγ—asym rock; C δsym bend | [32,37,38,39] |
| 4 | 1455 | Lactic Acid, Lipids | CH3 asym bend; CH3 rock | [40,41,42,43,44,45] |
| 5 | 1470 | Tripeptide | σ(CH2); γ(NH3+) | [36] |
| 6 | 1489 | Adenosine | σ(CH2) | [46] |
| 7 | 1516 | Beta Carotene | C-C sym; s(C=C) | [47] |
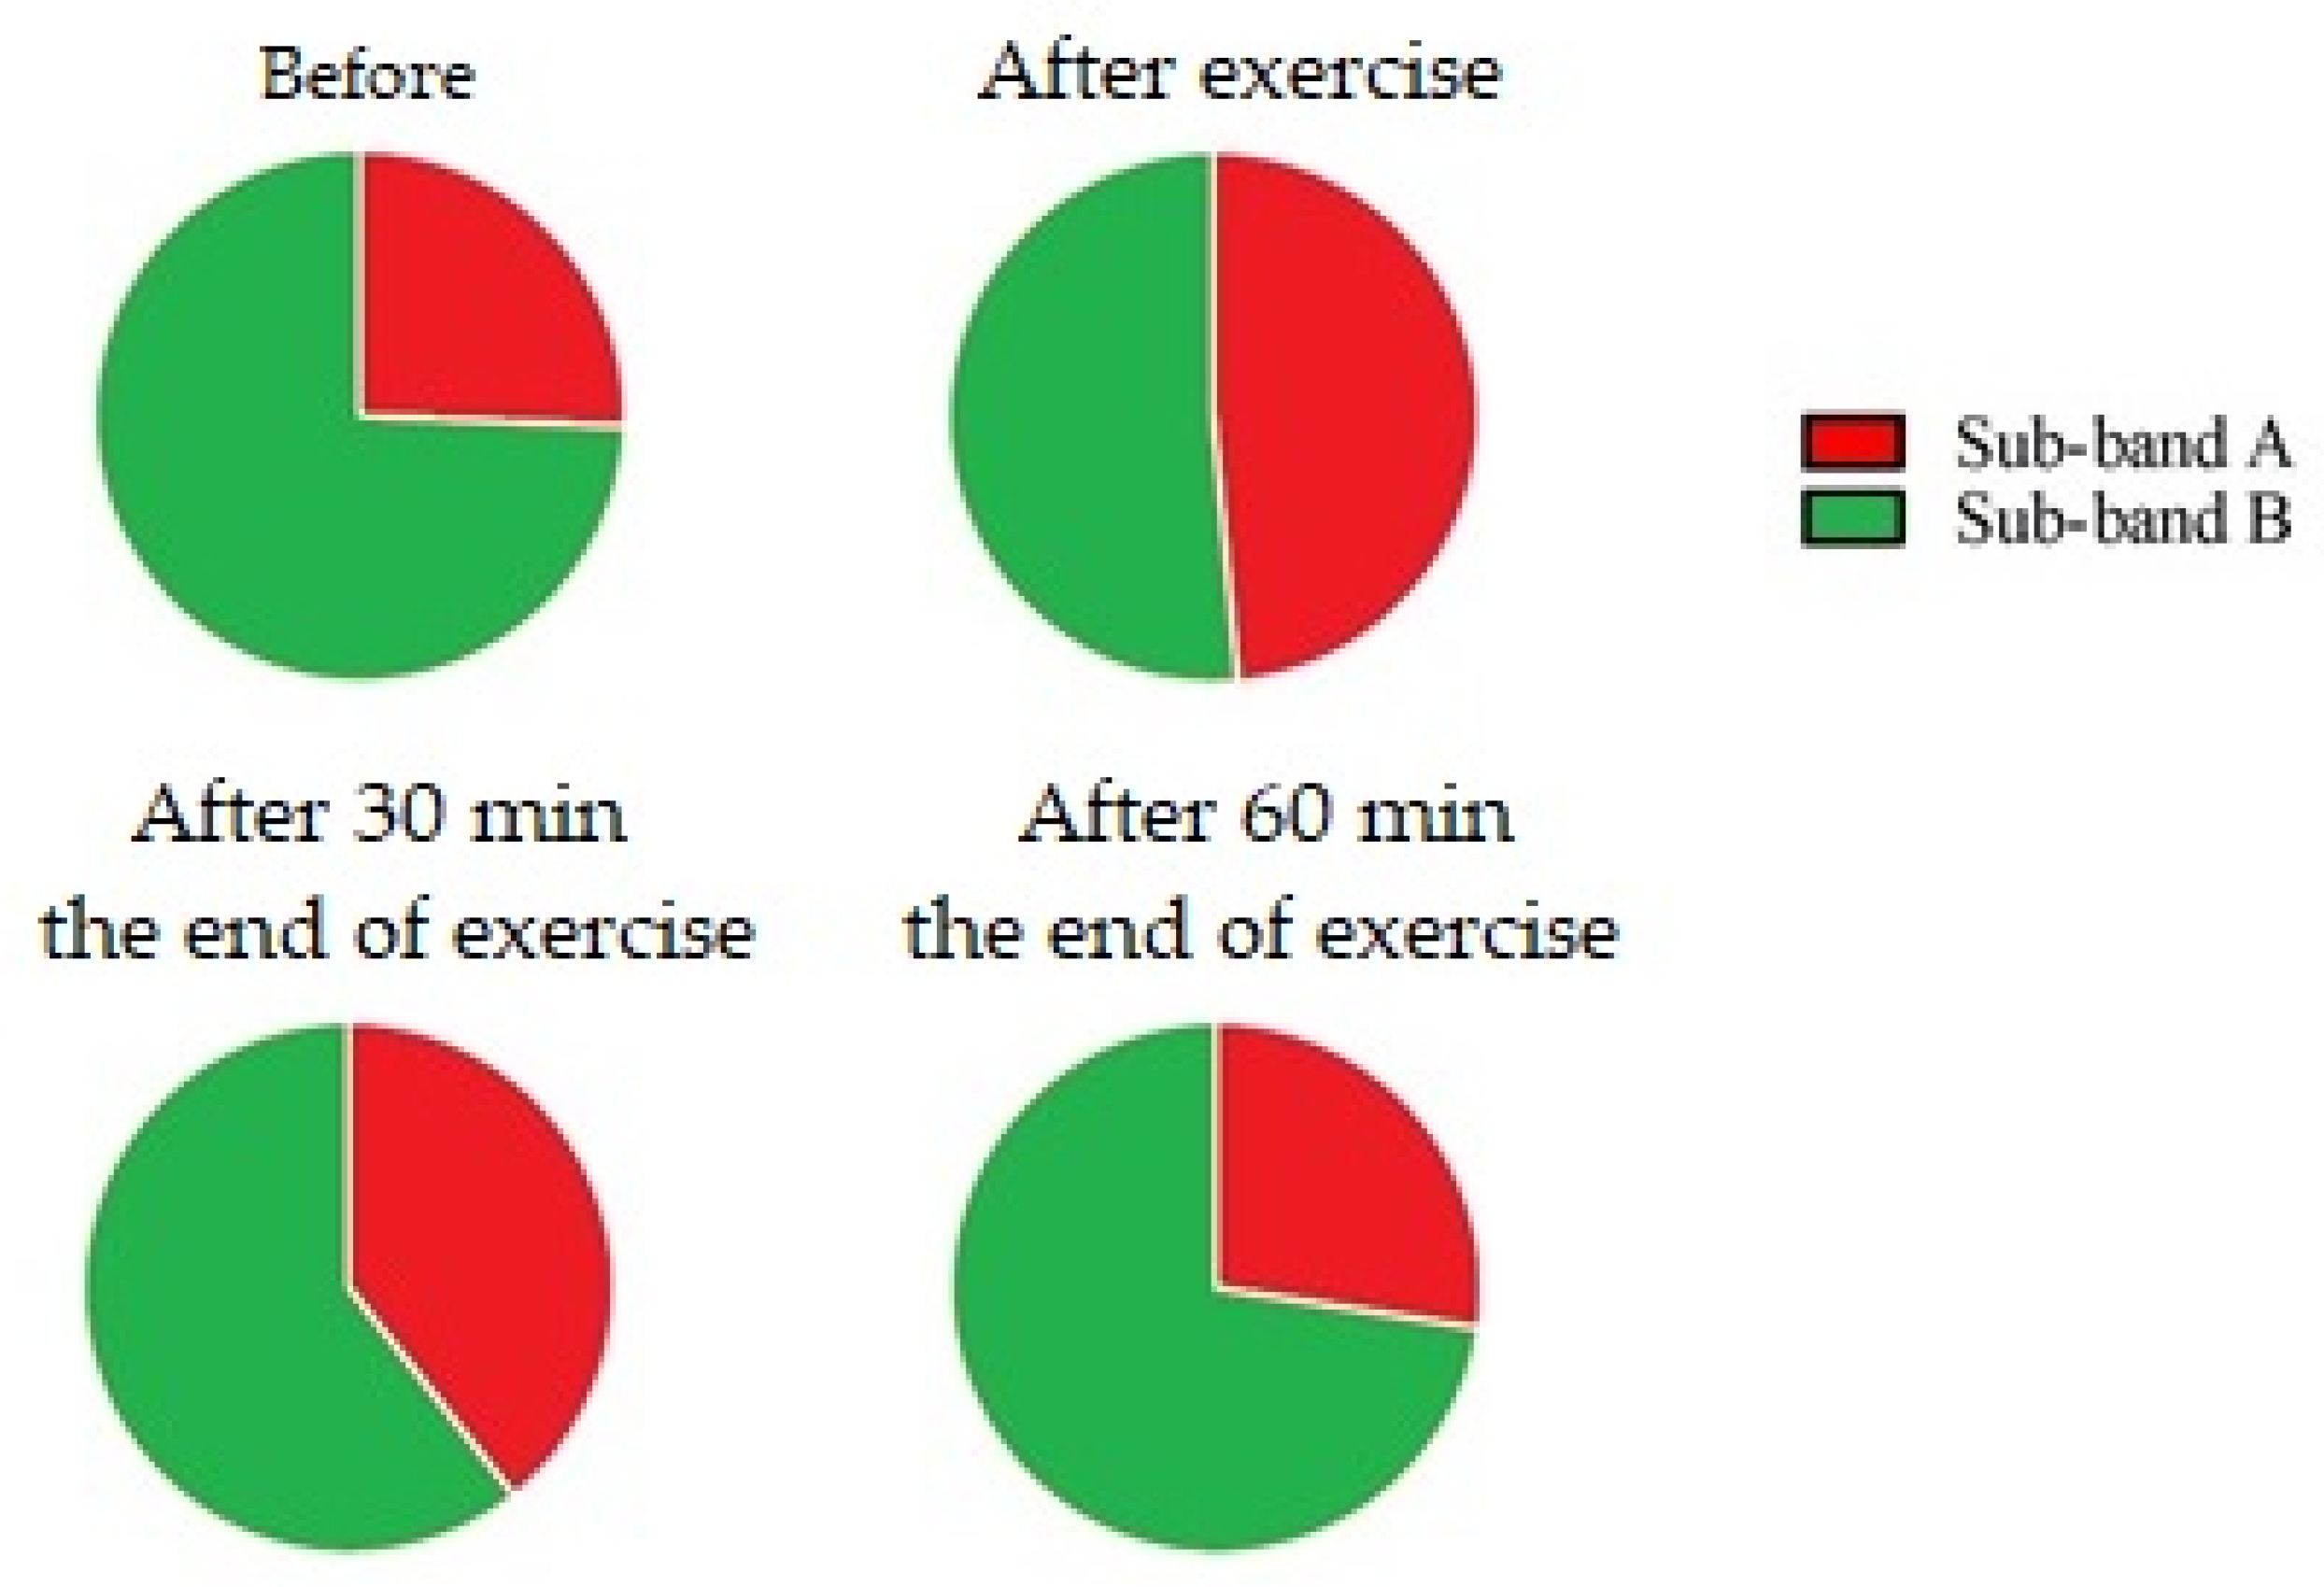
| 1300–1360 cm−1 Range | ||||
|---|---|---|---|---|
| Sub-band A (Collagen/lipids) | ||||
| Data points | ||||
| Before | After exercise | After 30 min | After 60 min | |
| Mean ± SD | 16.92 ± 3.26 | 47.37 ± 9.87 | 25.81 ± 14.35 | 10.46 ± 3.21 |
| Before | 0.0001 | 0.01 | NS | |
| After exercise | 0.0001 | 0.001 | 0.0001 | |
| After 30 min | 0.01 | 0.001 | 0.001 | |
| After 60 min | NS | 0.0001 | 0.001 | |
| Sub-band B (Tryptophan) | ||||
| Data points | ||||
| Before | After exercise | After 30 min | After 60 min | |
| Mean ± SD | 36.77 ± 2.86 | 43.16 ± 5.40 | 52.98 ± 6.63 | 24.74 ± 6.50 |
| Before | NS | 0.001 | 0.01 | |
| After exercise | NS | 0.01 | 0.0001 | |
| After 30 min | 0.001 | 0.01 | 0.0001 | |
| After 60 min | 0.01 | 0.0001 | 0.0001 | |
| 1385–1520 cm−1 Range | |||||
|---|---|---|---|---|---|
| Data Points | |||||
| Before | After Exercise | After 30 min | After 60 min | ||
| Sub-band 1 (Leucine) | Mean ± SD | 96.38 ± 18.61 | 154.70 ± 27.84 | 94.06 ± 3.56 | 74.43 ± 0.71 |
| Before | 0.0001 | NS | NS | ||
| After exercise | 0.0001 | 0.0001 | 0.0001 | ||
| After 30 min | NS | 0.0001 | NS | ||
| After 60 min | NS | 0.0001 | NS | ||
| Sub-band 2 (Glycine) | Mean ± SD | 63.68 ± 12.28 | 29.26 ± 5.02 | 58.90 ± 4.24 | 59.46 ± 14.94 |
| Before | 0.001 | NS | NS | ||
| After exercise | 0.001 | 0.01 | 0.001 | ||
| After 30 min | NS | 0.01 | NS | ||
| After 60 min | NS | 0.001 | NS | ||
| Sub-band 3 (Isoleucine) | Mean ± SD | 171.80 ± 43.51 | 81.80 ± 15.08 | 190.50 ± 29.00 | 200.70 ± 60.85 |
| Before | 0.01 | NS | NS | ||
| After exercise | 0.01 | 0.001 | 0.001 | ||
| After 30 min | NS | 0.001 | NS | ||
| After 60 min | NS | 0.001 | NS | ||
| Sub-band 4 (Lactic acid) | Mean ± SD | 115.10 ± 29.62 | 184.80 ± 27.36 | 123.10 ± 16.79 | 85.34 ± 9.97 |
| Before | 0.001 | NS | NS | ||
| After exercise | 0.001 | 0.01 | 0.001 | ||
| After 30 min | NS | 0.01 | NS | ||
| After 60 min | NS | 0.001 | NS | ||
| Sub-band 5 (Tripeptide) | Mean ± SD | 29.48 ± 9.15 | 44.70 ± 14.39 | 34.16 ± 7.98 | 31.72 ± 8.91 |
| Before | 0.001 | NS | NS | ||
| After exercise | 0.001 | 0.01 | 0.001 | ||
| After 30 min | NS | 0.01 | NS | ||
| After 60 min | NS | 0.001 | NS | ||
| Sub-band 6 (Adenosine) | Mean ± SD | 73.93 ± 8.36 | 58.24 ± 5.66 | 57.16 ± 8.02 | 61.68 ± 8.49 |
| Before | 0.01 | 0.01 | NS | ||
| After exercise | 0.01 | NS | NS | ||
| After 30 min | 0.01 | NS | NS | ||
| After 60 min | NS | NS | NS | ||
| Sub-band 7 (Beta carotene) | Mean ± SD | 29.61 ± 9.08 | 23.35 ± 6.48 | 20.28 ± 5.91 | 35.05 ± 15.42 |
| Before | NS | NS | NS | ||
| After exercise | NS | NS | 0.05 | ||
| After 30 min | NS | NS | 0.01 | ||
| After 60 min | NS | 0.05 | 0.01 | ||
Disclaimer/Publisher’s Note: The statements, opinions and data contained in all publications are solely those of the individual author(s) and contributor(s) and not of MDPI and/or the editor(s). MDPI and/or the editor(s) disclaim responsibility for any injury to people or property resulting from any ideas, methods, instructions or products referred to in the content. |
© 2023 by the authors. Licensee MDPI, Basel, Switzerland. This article is an open access article distributed under the terms and conditions of the Creative Commons Attribution (CC BY) license (https://creativecommons.org/licenses/by/4.0/).
Share and Cite
Acri, G.; Testagrossa, B.; Piccione, G.; Arfuso, F.; Giudice, E.; Giannetto, C. Central and Peripheral Fatigue Evaluation during Physical Exercise in Athletic Horses by Means of Raman Spectroscopy. Animals 2023, 13, 2201. https://doi.org/10.3390/ani13132201
Acri G, Testagrossa B, Piccione G, Arfuso F, Giudice E, Giannetto C. Central and Peripheral Fatigue Evaluation during Physical Exercise in Athletic Horses by Means of Raman Spectroscopy. Animals. 2023; 13(13):2201. https://doi.org/10.3390/ani13132201
Chicago/Turabian StyleAcri, Giuseppe, Barbara Testagrossa, Giuseppe Piccione, Francesca Arfuso, Elisabetta Giudice, and Claudia Giannetto. 2023. "Central and Peripheral Fatigue Evaluation during Physical Exercise in Athletic Horses by Means of Raman Spectroscopy" Animals 13, no. 13: 2201. https://doi.org/10.3390/ani13132201
APA StyleAcri, G., Testagrossa, B., Piccione, G., Arfuso, F., Giudice, E., & Giannetto, C. (2023). Central and Peripheral Fatigue Evaluation during Physical Exercise in Athletic Horses by Means of Raman Spectroscopy. Animals, 13(13), 2201. https://doi.org/10.3390/ani13132201