Article

Mitochondrial DNA and Distribution Modelling Evidenced the Lost Genetic Diversity and Wild-Residence of Star Tortoise, Geochelone elegans (Testudines: Testudinidae) in India

1
Department of Marine Biology, Pukyong National University, Busan 48513, Republic of Korea
2
Agricultural and Ecological Research Unit, Indian Statistical Institute, Kolkata 700108, India
3
Research Center for Marine Integrated Bionics Technology, Pukyong National University, Busan 48513, Republic of Korea
4
Agricultural and Ecological Research Unit, Indian Statistical Institute, Giridih 815301, India
*
Author to whom correspondence should be addressed.
These authors contributed equally to this work.
Animals 2023, 13(1), 150; https://doi.org/10.3390/ani13010150
Submission received: 29 November 2022 / Revised: 20 December 2022 / Accepted: 26 December 2022 / Published: 30 December 2022
(This article belongs to the Special Issue Evolution, Diversity, and Conservation of Herpetofauna)

Abstract

:

Simple Summary

Genetic diversity and habitat suitability of the star tortoise, Geochelone elegans is poorly understood throughout its range in South Asian countries. The mitochondrial gene sequence and distribution modeling analyses demonstrated lower intraspecific genetic diversity and more highly fragmented habitats in India than in Sri Lanka. The present study recommends the intensive genetic screening of wild and trade/captive individuals before translocation, effective enforcement to prohibit wildlife trafficking, and habitat restoration urgently demanded to conserve this highly-threatened species in the wild.

Abstract

The Indian star tortoise (Geochelone elegans) is a massively traded animal in South Asia. To mitigate this risk, the conservation agencies recommended guidelines to safeguard this charismatic species in nature. We adopted mitochondrial DNA-based investigation and performed species distribution modeling of G. elegans throughout its distribution range in the Indian subcontinent. The genetic analyses revealed weak genetic landscape shape interpolations, low intraspecific distances (0% to 1.5%) with mixed haplotype diversity, and a single molecular operational taxonomic unit (MOTU) in the cytochrome b gene dataset. The star tortoise, G. elegans, and its sister species Geochelone platynota showed a monophyletic clustering in the Bayesian (BA) phylogeny. We also attempt to understand the habitat suitability and quality of G. elegans in its distribution range. Our results suggest that, out of the extant area, only 56,495 km2 (9.90%) is suitable for this species, with regions of highest suitability in Sri Lanka. Comparative habitat quality estimation suggests the patch shape complexity and habitat fragmentation are greater in the western and southern ranges of India, which have been greatly influenced by an increased level of urbanization and agriculture practices. We have also provided a retrospect on the potential threat to G. elegans related to the wildlife trade on the regional and international spectrum. Our results detected multiple trading hubs and junctions overlying within the suitable ranges which need special attention in the vicinity. The present study calls for a proper conservation strategy to combat the fragmented distribution and explicitly recommends intensive genetic screening of founder individuals or isolated adult colonies, implementing scientific breeding, and subsequent wild release to restore the lost genetic diversity of star tortoises.

1. Introduction

The Indian star tortoise, Geochelone elegans is a medium-sized reptile species classified under the family Testudinidae (order Testudines). The species was originally described under the genus Testudo and later on transferred to Geochelone with its closest relative, the Burmese star tortoise (Geochelone platynota) [1]. This land tortoise can be easily distinguished by its unique geometric pattern of carapace and plastron with light radiating lines on a dark background and vice versa. The star tortoise prefers to live in the grasslands and scrub forests of arid and semi-arid regions. The species is largely herbivorous; nevertheless, they are also known to scavenge on animal matter and play an important role in ecosystems [2]. In the recent past, G. elegans confronts habitat loss, anthropogenic threats, and severe menaces due to illegal hunting, with approximately one hundred thousand individuals traded every year [3,4]. Hence, the species is enlisted to CITES ‘Appendix I’ in 2019 to prohibit all international trade and safeguard them in the wild. The Tortoise and Freshwater Turtle Specialist Group (TFTSG) categorized G. elegans under the ‘vulnerable’ category in the IUCN Red List of Threatened Species [5].
Several studies have aimed to comprehend the morphology, ecology, captive care, and breeding of G. elegans from different regions [6,7]. More recently, a few molecular studies have been conducted with the intent to illuminate the genetic diversity of G. elegans in a restricted manner. The first approach aimed to elucidate the phylogenetic assessment of G. elegans (live and trade materials) through nuclear and mitochondrial DNA analyses [8]. Consecutively, three mitochondrial protein-coding genes were analyzed to clarify the genetic diversity of G. elegans from Pakistan, India, and Sri Lanka, and a comprehensive systematic screening was recommended across the entire distribution range [9].
In response to illegal wildlife trafficking, successful enforcement often involves immediate confiscation of animals and their holistic management to make them born free [10]. To avoid the risk of losing the genetic makeup and other attributes of confiscated animals, conservation organizations (CITES, IUCN, WWF, etc.) have recommended several guidelines for the management and placement of confiscated or live organisms [11,12,13,14]. The TFTSG member declares that G. elegans is endemic to the Indian subcontinent and demarcated its distribution range in three broadly isolated geographic areas viz., north-western India and adjacent south-eastern Pakistan, southern and south-eastern India, and Sri Lanka [5]. However, recognition of the most suitable habitat within the distribution range for the release of confiscated G. elegans into the wild for sustainable conservation is still poorly known.
The genetic data has been evidenced as a successful tool in conservation genetics and facilitating the rapid return of trafficked turtles back to the wild [15]. In this milieu, the present study aimed to examine the genetic diversity of G. elegans throughout its distribution range. In addition, species distribution modeling is often able to develop substantial knowledge of the habitat and biogeography of many chelonian species under past, current, and future climate conditions [16,17,18]. These spatial data also provide an appropriate means of reintroducing many threatened species after successful breeding or confiscation and help establish effective conservation management [19,20]. Owing to the guidelines of a multilateral conservation treaty, the present study further aimed to determine the suitable habitat of G. elegans through distribution modeling (SDM) to forecast a piece of vital information regarding the prioritized area for developing conservation and management in the Indian subcontinent.

2. Materials and Methods

2.1. Sampling and Ethics Statement

The biological samples were collected from 13 star tortoises, kept locally as pets, from seven different localities. After communicating with the pet keepers, we came to understand that seven individuals were collected from the inside of the known distribution range (20.30 N 85.76 E, 19.83 N 85.77 E, 17.40 N 78.62 E, and 13.61 N 78.44 E); however, the remaining were collected outside of this range (26.16 N 91.69 E, 26.42 N 88.25 E, and 22.60 N 88.37 E). The species was identified as G. elegans based on its unique geometric pattern of carapace with light radiating lines on a dark background and plastron with dark radiating lines on a light background [2]. The biological samples (a drop of blood) were collected from the hind limb of each individual using a sterile needle and preserved in the blood collection cards. All experiments were performed in accordance with the relevant guidelines and regulations of the host institutes and ARRIVE 2.0. (https://arriveguidelines.org) rules [21]. No ethics committee or institutional review board approval was required for this work as no animals were killed or encountered in the wild.

2.2. Molecular Experiments

The genomic DNA was extracted using a Qiagen DNeasy Blood & Tissue Kit (QIAGEN Inc., Germantown MD, Hilden, Germany). To compare the genetic diversity from earlier and present distant localities, a partial fragment of the cytochrome b (Cytb) gene was amplified using a published primer pair (mcb398/mcb869) [22]. The PCR was performed in a 25 µL reaction mixture of 1× PCR buffer, 2 mM of MgCl2, 10 pmol of each primer, 0.25 mM of dNTPs, 0.25 U of high-fidelity polymerase, and 20 ng of template DNA in a Veriti Thermal Cycler (Applied Biosystems, Waltham, MA, USA) with specific thermal profiles. The amplified DNA was purified using a QIAquick Gel Extraction Kit (QIAGEN) following the standard protocol. The cycle sequencing was performed using a BigDye Terminator v3.1 Cycle Sequencing Kit (Applied Biosystems) with 3.2 pmol of each primer. Subsequently, the PCR products were purified using a BigDye X-terminator kit (Applied Biosystems, Waltham, NJ, USA) and sequenced bi-directionally by a 3730 Genetic Analyzer (Applied Biosystems, Waltham, NJ, USA).

2.3. Genetic Analyses

The bi-directional chromatograms were screened using a SeqScanner version 1.0 (Applied Biosystems Inc., Waltham, CA, USA), and the noisy parts were trimmed from both ends to avoid the nuclear mitochondrial DNA segments (NUMTs). The consensus sequences were reviewed through the nucleotide BLAST (https://blast.ncbi.nlm.nih.gov, accessed on 25 November 2022) and ORF finder (https://www.ncbi.nlm.nih.gov/orffinder/, accessed on 25 November 2022) search tools to confirm the appropriate amino acid array of the vertebrate mitochondrial genome. The spatial patterns of genetic divergences were investigated through a genetic landscape shape interpolation analysis using the Alleles in Space v1.0 program [23]. The Kimura-2 parameter (K2P) genetic distances were calculated through the MEGA11 program [24]. The representation of intraspecific genetic distances was plotted through BoxPlot in RStudio (https://posit.co/). To estimate the molecular operational taxonomic units (MOTUs), the Automatic Barcode Gap Discovery (ABGD) and Poisson Tree Processes (PTP) were applied [25,26]. The ABGD analysis was executed on the web server (www.abi.snv.jussieu.fr/public/abgd/, accessed on 25 November 2022) using the Jukes-Cantor (JC69) model. The maximum-likelihood tree was constructed in RAxML v2.0.1 to perform the PTP analysis (http://species.h-its.org/ptp/, accessed on 25 November 2022) [27]. The number of unique haplotypes, the number of polymorphic sites, and haplotype diversity (Hd) were estimated by DnaSP 6 [28]. The TCS networks of all haplotypes were constructed in POP-ART [29,30].

2.4. Phylogenetic Inference

A total of 46 mtCytb sequences of G. elegans and 7 sequences of G. platynota were acquired from GenBank and aligned by ClustalX to build a final dataset (458 bp) [31]. The sequence of Manouria emys (DQ080040) was also acquired from GenBank and used as an outgroup in the phylogenetic inference. The suitable model was confirmed using Mr. MODELTEST v2 with the lowest BIC (Bayesian information criterion) score [32]. The Bayesian (BA) phylogeny was built in MrBayes v3.1.2 with a GTR  +  G + I model with one cold and three hot chains and run for 600,000 generations with 25% burn-in, trees saving at every 100 generations, and other default parameters [33]. The generated BA tree was illustrated through the web-based iTOL tool (https://itol.embl.de/) [34].

2.5. Species Occurrence Data

The spatial occurrence records of G. elegans were collected from the TFTSG assessment and associated literature, as well as from the GBIF online data repository (https://doi.org/10.15468/dl.uwhqg8, accessed on 25 November 2022) [2]. We identified (n = 205) spatially independent occurrence points for G. elegans (Figure 1). We used the SDMtoolbox to remove the spatial autocorrelation, using the locality points with a search radius of 1 km based on the raster resolution of the predictor variable, to reduce the overfitting of the model [35].

2.6. Model Covariate Selection

The variables, which may play a significant role in predicting suitable habitats, were selected for primary screening by considering the ecological requirements of G. elegans [36]. We started with a set of 24 habitat variables grouped into 4 types: bioclimatic, land cover and land use (LULC), topographic, and anthropogenic (Table S1, Figure S1). The climatic variables were represented by 19 bioclimatic variables from Worldclim v2.0 (https://www.worldclim.org/, accessed on 25 November 2022) [37]. The aridity variable within the study area was acquired from Version 3 of the Global Aridity Index and Potential Evapotranspiration Database [38]. The LULC was acquired from Copernicus Global Land Service (https://lcviewer.vito.be/download, accessed on 25 November 2022). Further, we used the Human Influence Index (HII) to understand human influences on the target species [39]. The topographic variables, i.e., elevation and slope, were generated using the 90 m Shuttle Radar Topography Mission (SRTM) data (http://srtm.csi.cgiar.org/srtmdata/, accessed on 25 November 2022). For the final model run, predictors were resampled at 1 km spatial resolution using spatial analysis within ArcGIS 10.6. We used SDMtoolbox v2.4 to check the spatial multicollinearity among the predictors, and the variables with r > 0.8 Pearson’s correlation were dropped from the final modeling environment (Figure S1).

2.7. Model Building and Evaluation

We implemented maximum entropy modeling (MaxEnt) v3.4.4 for the present study, as it is a widely used predictive modeling tool that is known to perform well even if the number of covariates exceeds the number of occurrences for a predictive model [40,41]. We used the bootstrapping replication method and Bernoulli generalized linear model with the ClogLog link function for the present model development [42]. The model used the training data on each occurrence point as n-1 and tested the model performance with the remaining points and 50 runs as replicates [40,43]. The final results generated a probability distribution output as a continuous probability surface raster of the study extent ranging from 0–1, with ‘1’ being the most suitable habitat and ‘0’ being the most unsuitable habitat area for G. elegans. The variable influence was estimated using the Jackknife test of developed regularized training gain [44]. For model evaluation, we used the area under the curve (AUC) statistics of the receiver operating characteristic (ROC) curves [45]. The AUC test statistic values ranged from 0 to 1, where a value <0.5 indicated minimum discrimination between the predictive presence and absence areas and was considered to be worse than random, 0.5 indicated a random prediction, 0.7–0.8 indicated an acceptable model, 0.8–0.9 indicated an excellent model, and >0.9 indicated an exceptional model [46,47]. We prepared the binary maps based on a test sensitivity and specificity (SES) threshold equal to the predicted suitable habitat for G. elegans to evaluate the zonal statistics and area calculations.

2.8. Habitat Quality Assessment

For the habitat quality assessment, we compared the suitable areas of distinct suitable ranges of G. elegans. The study used FRAGSTATS v4.2.1 to calculate the class-level landscape metrics using the PLAND (percentage of landscape), the number of patches (NP), patch density (PD), aggregation (AI), largest patch (LPI), total edge (TE), interspersion and juxtaposition (IJI), edge density (ED), and landscape shape (LSI) as the indices of the level of habitat quality and level of fragmentation indicators in the present area [48,49,50].

3. Results

3.1. Molecular Characterization

The generated sequences of G. elegans were contributed to the global GenBank database under the accession numbers (OP684115–OP684127). The generated sequences showed 99–100% similarity with the database sequences of the same species. The overall mean K2P genetic distance was 0.6% in the G. elegans dataset. The genetic landscape analysis also revealed small zones of low genetic differentiation across the distribution range of G. elegans (Table S2, Figure 2A). On a distant geographical scale, the analysis strengthens the earlier hypothesis and enlightens the mixed genetic diversity of G. elegans in India and Sri Lanka. The intra-species genetic distance ranged from 0% to 1.5% in the present dataset (Figure 2B). Remarkably, an unexpectedly high intra-species genetic distance (5.2–6.5%) and a high number of segregating sites (n = 17) were observed compared with the database sequences (DQ497299) of G. elegans vouchered in the Ambrose Monell Cryo Collection, American Museum of Natural History. Hence, this database sequence was not incorporated into multiple species delimitation and phylogenetic analyses. The ABGD and PTP analyses revealed a single MOTU of G. elegans in the initial partitioning and maximum-likelihood-supported solutions, respectively (Table S3, Figure 2C). The present dataset of G. elegans revealed 13 haplotypes with 22 segregating sites and haplotype diversity (Hd) = 0.7195. The TCS network depicted a mixed haplotypic distribution of G. elegans in terms of their collection sites (Figure 2D). The Bayesian (BA) phylogeny showed monophyletic clustering of all generated and database sequences of G. elegans. Both G. elegans and G. platynota showed distinct clustering in the BA phylogeny (Figure 3). Both species delimitation methods revealed similar results with a single MOTU of G. elegans, which is concordant with the genetic distance and tree analyses.

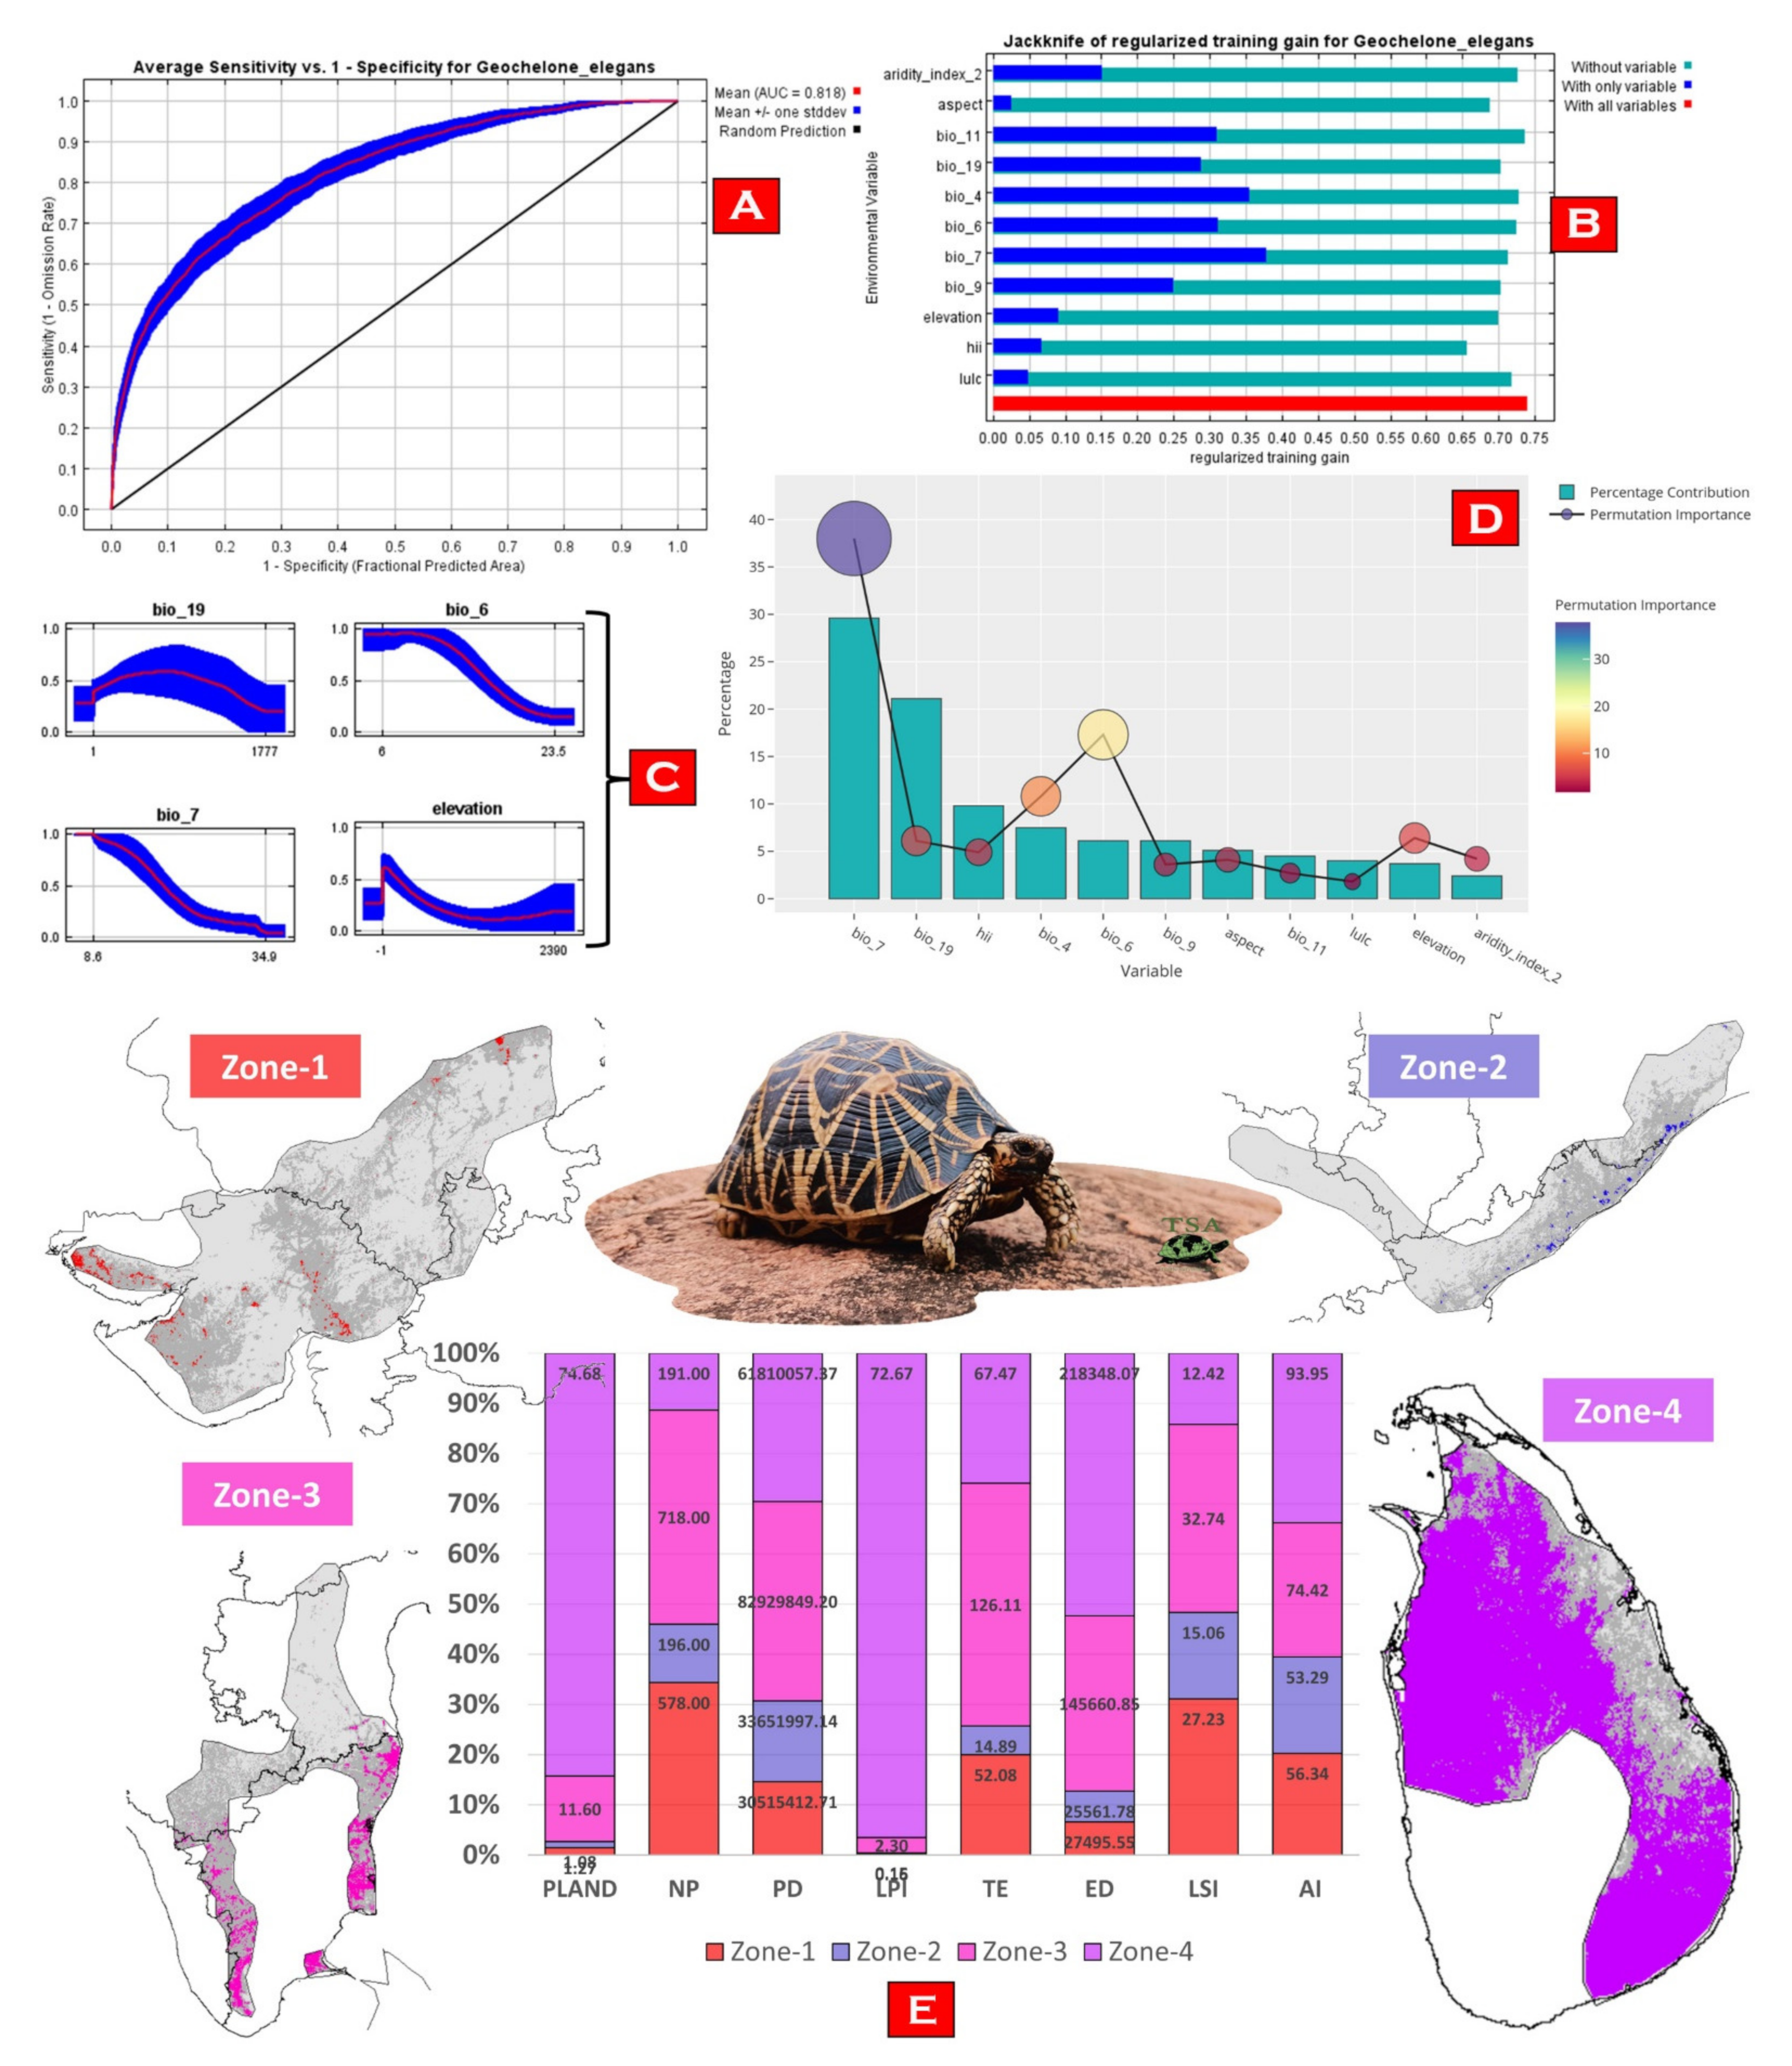
3.2. Model Performance and Habitat Suitability

The model predicted the suitable habitats for G. elegans within the study landscape with excellent accuracy (Figure 4). The average training AUC for replicate runs for the model was found to be 0.818 ± 0.017 (SD) (Figure 5A). Out of the total distribution range extent (570,254 km2), about 56,495 km2 (9.90%) is suitable for G. elegans (Figure 4). The results also suggest the most suitable habitats in Sri Lanka and the southern region of India. The biggest and continuous habitat patch for G. elegans was found in the north-western and south-eastern portions of Sri Lanka (36,060 km2). Further, in India, the most suitable and continuous habitat patches were distributed in the far southern portion of Andhra Pradesh and Tamil Nadu, with a total area of 15,699 km2 (Figure 4). The model suggests that the distribution of habitat patches for G. elegans was strongly influenced by temperature annual range, with a relative contribution of 29.6%, followed by the contribution of precipitation of the coldest quarter by 21.1% (Figure 5). Further, human influence was also found to influence the distribution of G. elegans, with a percentage contribution of 9.8% (Figure 5).

3.3. Habitat Quality Estimation

For the comparative habitat quality estimation between the ranges, we have designated the ranges into a total of four zones, i.e., zone 1 (comprising the western range within Gujarat and Rajasthan in India); zone 2 (comprising the eastern range within Odisha and Telangana, and the north-eastern portion of Andhra Pradesh in India); zone-3 (comprising the southern range of Tamil Nadu and Karnataka, and the central part of Andhra Pradesh in India); and zone 4 (comprising the north-western and south-eastern portions of Sri Lanka) (Figure 5E). Our results suggest that zone 4 constitutes about 74% of the total suitable areas for the species, followed by zone 3 with 11.60%. Habitats within the Sri Lankan range were found to be the best for G. elegans, with the lowest score of NP (191) and high values of LPI (72.67), suggesting habitat continuity and less habitat fragmentation (Figure 5E). Moreover, the continuity and habitat quality can be also observed through the comparatively high value of AI (93.95) within the Sri Lankan range. However, zone 3 and zone 1 depicted high NP, PD, TE, and LSI, suggesting a substantial level of habitat fragmentation in the region (Figure 5E).

4. Discussion

The Convention on Biological Diversity (CBD) and the Intergovernmental Science-Policy Platform on Biodiversity and Ecosystem Services (IPBES) made us aware of the significant reduction in the rate of biodiversity loss and extinction risks to earth life, driven by anthropogenic activity, invasive alien species, overexploitation, climate change impacts, and ecological collapse [51,52]. To reduce the risks and support the ecosystems, several new unifying concepts and their implementation have been recommended in recent years to achieve worthy conservation actions [53,54]. The global assessments indicate that 25.4% of mammals, 13.6% of birds, 21.1% of reptiles, and 40.7% of amphibians are threatened with extinction [55]. Notably, the conservation priority of reptiles among other tetrapods has always been overlooked, and specific conservation needs have been claimed due to their extraordinary diversity in arid regions [56]. At the same time, some reptiles, such as Testudines, are the most threatened vertebrates, facing high anthropogenic pressure worldwide and requiring urgent and targeted action plans [57]. In many cases, seized turtles and tortoises are moved far from their place of capture and returned to the wild without knowing their true origin. However, finding preferable sites for their translocation is often challenging considering the ecological demands, genetic make-up, competition, and hybridization of confiscated animals. Releasing live animals seized from the illegal wildlife trade into unknown wild populations or close to their distribution range causes the admixture of distinct genetic lineages and increases the potential conservation risks of reintroduction [58,59].
The molecular data have proven to be a successful tool for illuminating various biological questions of Testudines around the globe. The genetic architecture of land tortoises is often used to identify new species [60], detect cryptic variants [61], understand phylogeographic patterns [62,63,64], as well as infer diversity- and evolutionary-based relationships [65,66,67,68]. Complete mitochondrial genome and whole genome data also provide evidence revealing the phylogenetic relationships of these enigmatic species and insights into their longevity [69,70,71]. Because of the historical background of land tortoises, ancient DNA-based analyses also play a special role in determining their evolutionary history [72,73]. The nuclear and mitochondrial gene sequences of G. elegans and G. platynota were irrespectively generated to examine the evolutionary relationships of Testudines [74,75,76,77,78]. However, a few studies were executed specifically on G. elegans and exhibited the loss of genetic diversity among the different populations due to their enormous trade volume [8,9,79,80]. The generated molecular data will be utilized as a reference DNA sequence for examining the confiscated G. elegans in near future as well as utilized in wildlife forensics. Nevertheless, the present genetic analysis reveals lost genetic diversity across the distribution range of G. elegans with weak intraspecific differences, which is congruent with previous studies. The partial mitochondrial cytochrome b gene sequences were inadequate to distinguish the different populations of G. elegans from distant localities. Due to the unscientific release of confiscated animals in the wild, and the subsequent hybridization between different populations over the years, star tortoises have lost genetic diversity and have experienced increases in the vulnerability of wild populations. Beyond the legal restrictions of global biodiversity research, we suggest that the genetic screening of G. elegans by other genes be required for Pakistan, India, and Sri Lanka, which would provide a better genetic explanation for their phylogeographic footmark across their distribution range [81,82]. Current research recommends genetic screening to identify founder individuals or isolated adult colonies, in the wild or captive for scientific breeding, to preserve maximum genetic diversity, avoid inbreeding depression, and support the successful reintroduction of captively bred offspring to the wild to recover the lost heterozygosity of G. elegans.
The massive unlawful trade of reptiles, including the Indian star tortoise (G. elegans), has reached an alarming level [83,84]. To protect these highly threatened animals in wild, a joint endeavor of the Turtle Survival Alliance (TSA)—a United States-based organization—and associate partners across South Asia is underway to rescue this tortoise species from extinction and involves trade control, captive breeding, head-starting, and a reintroduction to the wild [85]. Our result suggests that about 10% of the area with the IUCN range of the Indian star tortoise is suitable for habitation; however, this area is further subjected to the impacts of human-mediated habitat degradation (Figure 5E). Areas within the states of Gujrat and Rajasthan, followed by Tamil Nadu, Karnataka, and Andhra Pradesh, suffer the most with the highest levels of habitat fragmentation due to the rapid development of urbanization and croplands. The present study elucidates that most of the suitable habitats of G. elegans are under significant human pressure, which is an issue that requires special attention for their conservation [86]. Further, to mitigate the existing anthropogenic threats to G. elegans, it is also important to have species-specific knowledge about their habits and habitats as well as their trade routes. Previous studies have suggested that areas near Ahmedabad, Bengaluru, and Chennai are illegal trading hubs for Indian star tortoises [3]. While integrating the present SDM results with the findings of D’Cruze et al. (2015), we suspect multiple wildlife trade hubs are overlapped within the suitable range (Figure 6). Hence, we recommend active cooperation between national (state level) and international organizations to prioritize these conflict hotspots. These molecular and habitat-suitability data will be key components in developing improved conservation action plans for the successful reintroduction of captively bred and confiscated star tortoises into the wild. The present study will not only help in understanding the genetic diversity of star tortoises in India and beyond but will also help us understand the genetic impacts of the decimation of this oldest-living animal by humans and provide important guidance for the conservation of the remaining genetic diversity of this threatened species.

5. Conclusions

Due to habitat fragmentation, anthropogenic threats, and illegal hunting, star tortoise populations have declined significantly in South Asian countries. Unscientific translocations have led to genetic admixture between different populations and wiped out their phylogeographic differentiation throughout the range. Both mitochondrial Cytb genetic data and MaxEnt species distribution modeling corroborated these facts. We recommend that a comprehensive genetic survey be required to search the isolated wild colonies and subsequent scientific breeding to retrieve their lost genetic diversity. More effective conservation action plans by the Turtle Survival Alliance and other organizations are needed to reduce habitat destruction and precisely identify suitable protected areas for the conservation of this species.

Supplementary Materials

The following supporting information can be downloaded at: https://www.mdpi.com/article/10.3390/ani13010150/s1, Figure S1: Representing the final set of variables maps used for the distribution modeling of G. elegans; Table S1: Primary environmental and topographical variables used for modeling; Table S2: ABGD and PTP results of the present dataset of G. elegans and G. platynota; Table S3: Genetic landscape shape interpolation analysis results showing the residual genetic distances used as landscape heights.

Author Contributions

Conceptualization, S.K. and H.-W.K.; methodology, S.K. and T.M.; software, S.K. and T.M.; validation, S.K., T.M., A.R.K. and S.-R.L.; formal analysis, S.K. and T.M.; investigation, S.K., T.M. and A.M.; resources, A.M. and H.-W.K.; data curation: S.K., T.M., A.R.K. and S.-R.L.; writing—original draft, S.K. and T.M.; writing—review & editing, S.K., T.M., A.M. and H.-W.K.; visualization, S.K., T.M. and A.M.; supervision, A.M. and H.-W.K.; project administration, W.-K.J. and H.-W.K.; funding acquisition, W.-K.J. and H.-W.K. All authors have read and agreed to the published version of the manuscript.

Funding

This research was supported by the Basic Science Research Program through the National Research Foundation of Korea (NRF) funded by the Ministry of Education (2021R1A6A1A03039211). The funder had no role in the study design.

Institutional Review Board Statement

Not applicable.

Informed Consent Statement

Not applicable.

Data Availability Statement

The nucleotide sequence data that support the findings of this study are openly available in the NCBI GenBank database (https://www.ncbi.nlm.nih.gov) under accession no. OP684115-OP684127.

Acknowledgments

The first author (S.K.) acknowledges the Global Postdoc Program fellowship grant received from the Pukyong National University, Republic of Korea. The second author (T.M.) thanks the Department of Science & Technology INSPIRE Faculty Award and Fellowship (sanction no: DST/INSPIRE/04/2021/001149) of the Government of India.

Conflicts of Interest

The authors declare that they have no competing interests.

References

  1. De Silva, A.; Bauer, A. Origin of the name Geochelone elegans. Wildlanka 2016, 4, 22–28. [Google Scholar]
  2. D’Cruze, N.; Mookerjee, A.; Vyas, R.; Macdonald, D.W.; de Silva, A. Geochelone elegans (Schoepff 1795)-Indian Star Tortoise, Star Tortoise. In Conservation Biology of Freshwater Turtles and Tortoises: A Compilation Project of the IUCN/SSC Tortoise and Freshwater Turtle Specialist Group; Rhodin, A.G.J., Iverson, J.B., van Dijk, P.P., Stanford, C.B., Goode, E.V., Buhlmann, K.A., Pritchard, P.C.H., Mittermeier, R.A., Eds.; Chelonian Research Foundation: Arlington, VT, USA, 2018; Volume 5, p. 106.1–106.13. [Google Scholar]
  3. D’Cruze, N.; Singh, B.; Morrison, T.; Schmidt-Burbach, J.; Macdonald, D.W.; Mookerjee, A. A star attraction: The illegal trade in Indian Star Tortoises. Nat. Conserv. 2015, 13, 1–19. [Google Scholar] [CrossRef] [Green Version]
  4. Mendiratta, U.; Sheel, V.; Singh, S. Enforcement seizures reveal large-scale illegal trade in India’s tortoises and freshwater turtles. Biol. Conserv. 2017, 207, 100–105. [Google Scholar] [CrossRef]
  5. Choudhury, B.C.; de Silva, A.; Shepherd, C. Geochelone elegans—In The IUCN Red List of Threatened Species 2020: e.T39430A123815345. Available online: https://dx.doi.org/10.2305/IUCN.UK.2020-2.RLTS.T39430A123815345.en (accessed on 25 November 2022).
  6. De Silva, A. The Biology and Status of the Star Tortoise in Sri Lanka; Ministry of Environment and Natural Resources, AMP Print Shop: Gampola, Sri Lanka, 2003; 100p.
  7. Fyfe, J.D. Star Tortoises: The Natural History, Captive Care and Breeding; Living Art Publishing: Ada, OK, USA, 2007. [Google Scholar]
  8. Gaur, A.; Reddy, A.; Annapoorni, S.; Satyarebala, B.; Shivaji, S. The origin of Indian Star tortoises (Geochelone elegans) based on nuclear and mitochondrial DNA analysis: A story of rescue and repatriation. Conserv. Genet. 2006, 7, 231–240. [Google Scholar] [CrossRef]
  9. Vamberger, M.; Spitzweg, C.; de Silva, A.; Masroor, R.; Praschag, P.; Fritz, U. Already too late? Massive trade in Indian star tortoises (Geochelone elegans) might have wiped out its phylogeographic differentiation. Amphib.-Reptil. 2020, 41, 133–138. [Google Scholar] [CrossRef]
  10. Gray, T.N.; Marx, N.; Khem, V.; Lague, D.; Nijman, V.; Gauntlett, S. Holistic management of live animals confiscated from illegal wildlife trade. J. Appl. Ecol. 2017, 54, 726–730. [Google Scholar] [CrossRef] [Green Version]
  11. Robinson, J.E.; Sinovas, P. Challenges of analyzing the global trade in CITES-listed wildlife. Conserv. Biol. 2018, 32, 1203–1206. [Google Scholar] [CrossRef] [Green Version]
  12. International Union for Conservation of Nature (IUCN). Guidelines for the Management of Confiscated, Live Organisms; IUCN: Gland, Switzerland, 2019. [Google Scholar]
  13. International Union for Conservation of Nature (IUCN). IUCN Guidelines for the Placement of Confiscated Animals. In Proceedings of the 51st Meeting of The IUCN Council, Gland, Switzerland, 8–11 February 2010. [Google Scholar]
  14. TRAFFIC. Wildlife Trade in Southeast Asia. CoP 13 Briefing TRAFFIC International. 2004. Available online: http://www.trafficj.org/cop13/pdf/cop13briefing_SoutheastAsia.pdf (accessed on 25 November 2022).
  15. Le, M.D.; McCormack, T.E.M.; Hoang, H.V.; Duong, H.T.; Nguyen, T.Q.; Ziegler, T.; Nguyen, H.D.; Ngo, H.T. Threats from wildlife trade: The importance of genetic data in safeguarding the endangered Four-eyed Turtle (Sacalia quadriocellata). Nat. Conserv. 2020, 41, 91–111. [Google Scholar] [CrossRef]
  16. Mothes, C.C.; Howell, H.J.; Searcy, C.A. Habitat suitability models for the imperiled wood turtle (Glyptemys insculpta) raise concerns for the species’ persistence under future climate change. Glob. Ecol. Conserv. 2020, 24, e01247. [Google Scholar] [CrossRef]
  17. Willey, L.L.; Jones, M.T.; Sievert, P.R.; Akre, T.S.B.; Marchand, M.; deMaynadier, P.; Yorks, D.; Mays, J.; Dragon, J.; Erb, L.; et al. Distribution models combined with standardized surveys reveal widespread habitat loss in a threatened turtle species. Biol. Conserv. 2022, 266, 109437. [Google Scholar] [CrossRef]
  18. Escoriza, D.; Ben Hassine, J. Niche diversification of Mediterranean and southwestern Asian tortoises. PeerJ 2022, 10, e13702. [Google Scholar] [CrossRef]
  19. Gibbs, J.P.; Hunter, E.A.; Shoemaker, K.T.; Tapia, W.H. Frtoise reintroduction to Española Island, Galapagos. PLoS ONE 2014, 9, e110742. [Google Scholar] [CrossRef] [Green Version]
  20. Munro, N.T.; McIntyre, S.; Macdonald, B.; Cunningham, S.A.; Gordon, I.J.; Cunningham, R.B.; Manning, A.D. Returning a lost process by reintroducing a locally extinct digging marsupial. PeerJ 2019, 7, e6622. [Google Scholar] [CrossRef] [Green Version]
  21. Percie du Sert, N.; Hurst, V.; Ahluwalia, A.; Alam, S.; Avey, M.T.; Baker, M.; Browne, W.J.; Clark, A.; Cuthill, I.C.; Dirnagl, U.; et al. The ARRIVE guidelines 2.0: Updated guidelines for reporting animal research. PLoS Biol. 2020, 18, e3000410. [Google Scholar]
  22. Verma, S.K.; Singh, L. Novel universal primers establish identity of an enormous number of animal species for forensic application. Mol. Ecol. Notes. 2002, 3, 28–31. [Google Scholar] [CrossRef]
  23. Miller, M.P. Alleles In Space (AIS): Computer software for the joint analysis of individual spatial and genetic information. J. Hered. 2005, 96, 722–724. [Google Scholar] [CrossRef] [Green Version]
  24. Tamura, K.; Stecher, G.; Kumar, S. MEGA11: Molecular Evolutionary Genetics Analysis Version 11. Mol. Biol. Evol. 2021, 38, 3022–3027. [Google Scholar] [CrossRef]
  25. Puillandre, N.; Lambert, A.; Brouillet, S.; Achaz, G. ABGD, Automatic Barcode Gap Discovery for primary species delimitation. Mol. Ecol. 2012, 21, 1864–1877. [Google Scholar] [CrossRef]
  26. Zhang, J.; Kapli, P.; Pavlidis, P.; Stamatakis, A. A general species delimitation method with applications to phylogenetic placements. Bioinformatics 2013, 29, 2869–2876. [Google Scholar] [CrossRef] [Green Version]
  27. Stamatakis, A. RAxML-VI-HPC: Maximum likelihood-based phylogenetic analyses with thousands of taxa and mixed models. Bioinformatics 2006, 22, 2688–2690. [Google Scholar] [CrossRef] [Green Version]
  28. Rozas, J.; Ferrer-Mata, A.; Sanchez-DelBarrio, J.; Guirao-Rico, S.; Librado, P.; Ramos-Onsins, S.; Sanchez-Gracia, A. DnaSP 6: DNA sequence polymorphism analysis of large data sets. Mol. Biol. Evol. 2017, 34, 3299–3302. [Google Scholar] [CrossRef] [PubMed]
  29. Clement, M.; Snell, Q.; Walker, P.; Posada, D.; Crandall, K. TCS: A computer program to estimate gene genealogies. Mol. Ecol. 2000, 9, 1657–1659. [Google Scholar] [CrossRef] [PubMed]
  30. Leigh, J.W.; Bryant, D. Popart: Full-feature software for haplotype network construction. Methods Ecol. Evol. 2015, 6, 1110–1116. [Google Scholar] [CrossRef]
  31. Thompson, J.D.; Gibson, T.J.; Plewniak, F.; Jeanmougin, F.; Higgins, D.G. The CLUSTAL_X windows interface: Flexible strategies for multiple sequence alignment aided by quality analysis tools. Nucleic Acids Res. 1997, 25, 4876–4882. [Google Scholar] [CrossRef] [PubMed] [Green Version]
  32. Nylander, J.A.A. MrModeltest v2, Program Distributed by the Author; Evolutionary Biology Centre, Uppsala University: Uppsala, Sweden, 2004. [Google Scholar]
  33. Ronquist, F.; Huelsenbeck, J.P. MrBayes 3: Bayesian phylogenetic inference under mixed models. Bioinformatics 2003, 19, 1572–1574. [Google Scholar] [CrossRef] [Green Version]
  34. Letunic, I.; Bork, P. Interactive Tree of Life (iTOL): An online tool for phylogenetic tree display and annotation. Bioinformatics 2007, 23, 127–128. [Google Scholar] [CrossRef] [Green Version]
  35. Brown, J.L. SDM toolbox: A python-based GIS toolkit for landscape genetic, biogeographic and species distribution model analyses. Methods Ecol. Evol. 2014, 5, 694–700. [Google Scholar] [CrossRef]
  36. Peterson, A.T.; Soberón, J.; Pearson, R.G.; Anderson, R.P.; Martínez-Meyer, E.; Nakamura, M.; Araújo, M.B. Ecological Niches and Geographic Distributions; Princeton University Press: Princeton, NJ, USA, 2011; 328p. [Google Scholar]
  37. Fick, S.E.; Hijmans, R.J. Worldclim 2: New 1-km spatial resolution climate surfaces for global land areas. Int. J. Climatol. 2017, 37, 4302–4315. [Google Scholar] [CrossRef]
  38. Zomer, R.J.; Xu, J.; Trabucco, A. Version 3 of the global aridity index and potential evapotranspiration database. Sci. Data. 2022, 9, 409. [Google Scholar] [CrossRef]
  39. Socioeconomic Data and Applications Center (SEDAD); Wildlife Conservation Society (WCS); Columbia University Center for International Earth Science Information Network (CIESIN). Last of the Wild Project, Version 2, 2005 (LWP-2): Global Human Footprint Dataset (Geographic); NASA Socioeconomic Data and Applications Center (SEDAC): Palisades, NY, USA, 2005. [CrossRef]
  40. Peacock, H. Assessment of the Protected Areas Network in Madagascar for Lemur Conservation; University of Calgary: Calgary, AB, Canada, 2011. [Google Scholar]
  41. Erinjery, J.J.; Singh, M.; Kent, R. Diet-dependent habitat shifts at different life stages of two sympatric primate species. J. Biosci. 2019, 44, 43. [Google Scholar] [CrossRef]
  42. Phillips, S.J.; Anderson, R.P.; Dudík, M.; Schapire, R.E.; Blair, M.E. Opening the black box: An open-source release of Maxent. Ecography 2017, 40, 887–893. [Google Scholar] [CrossRef]
  43. Elith, J.; Phillips, S.J.; Hastie, T.; Dudık, M.; Chee, Y.E.; Yates, C.J. A statistical explanation of MaxEnt for ecologists. Divers. Distrib 2011, 17, 43–57. [Google Scholar] [CrossRef]
  44. Phillips, S.J.; Dudık, M. Modeling of species distributions with MaxEnt: New extensions and a comprehensive evaluation. Ecography 2008, 31, 161–175. [Google Scholar] [CrossRef]
  45. Halvorsen, R.; Mazzoni, S.; Dirksen, J.W.; Næsset, E.; Gobakken, T.; Ohlson, M. How important are choice of model selection method and spatial autocorrelation of presence data for distribution modelling by MaxEnt? Ecol. Modell. 2016, 328, 108–118. [Google Scholar] [CrossRef]
  46. Kamilar, J.M.; Tecot, S.R. Anthropogenic and climatic effects on the distribution of eulemur species: An ecological niche modelling approach. Int. J. Primatol. 2016, 37, 47–68. [Google Scholar] [CrossRef]
  47. Johnson, S.E.; Delmore, K.E.; Brown, K.A.; Wyman, T.M.; Louis, E.E. Niche divergence in a brown lemur (Eulemur spp.) hybrid zone: Using ecological niche models to test models of stability. Int. J. Primatol. 2016, 37, 69–88. [Google Scholar] [CrossRef] [Green Version]
  48. McGarigal, K. FRAGSTATS Help; University of Massachusetts: Amherst, MA, USA, 2015. [Google Scholar]
  49. Mukherjee, T.; Sharma, L.K.; Saha, G.K.; Thakur, M.; Chandra, K. Past, present and future: Combining habitat suitability and future landcover simulation for long-term conservation management of Indian rhino. Sci. Rep. 2020, 10, 606. [Google Scholar] [CrossRef] [Green Version]
  50. Mukherjee, T.; Sharma, V.; Sharma, L.K.; Thakur, M.; Joshi, B.D.; Sharief, A.; Thapa, A.; Dutta, R.; Dolker, S.; Tripathy, B.; et al. Landscape-level habitat management plan through geometric reserve design for critically endangered Hangul (Cervus hanglu hanglu). Sci. Total Environ. 2021, 777, 146031. [Google Scholar] [CrossRef]
  51. Butchart, S.H.; Walpole, M.; Collen, B.; van Strien, A.; Scharlemann, J.P.; Almond, R.E.; Baillie, J.E.; Bomhard, B.; Brown, C.; Bruno, J.; et al. Global biodiversity: Indicators of recent declines. Science 2010, 328, 1164–1168. [Google Scholar] [CrossRef]
  52. IPBES. Global Assessment Report on Biodiversity and Ecosystem Services; Brondizio, E.S., Ed.; Intergovernmental Science-Policy Platform on Biodiversity and Ecosystem Services: Bonn, Germany, 2019. [Google Scholar]
  53. Tilman, D.; Clark, M.; Williams, D.R.; Kimmel, K.; Polasky, S.; Packer, C. Future threats to biodiversity and pathways to their prevention. Nature 2017, 546, 73–81. [Google Scholar] [CrossRef]
  54. Conde, D.A.; Staerk, J.; Colchero, F.; da Silva, R.; Schöley, J.; Baden, H.M.; Jouvet, L.; Fa, J.E.; Syed, H.; Jongejans, E.; et al. Data gaps and opportunities for comparative and conservation biology. Proc. Natl. Acad. Sci. USA 2019, 116, 9658–9664. [Google Scholar] [CrossRef] [PubMed]
  55. Cox, N.; Young, B.E.; Bowles, P.; Fernandez, M.; Marin, J.; Rapacciuolo, G.; Böhm, M.; Brooks, T.M.; Hedges, S.B.; Hilton-Taylor, C.; et al. A global reptile assessment highlights shared conservation needs of tetrapods. Nature 2022, 605, 285–290. [Google Scholar] [CrossRef] [PubMed]
  56. Roll, U.; Feldman, A.; Novosolov, M.; Allison, A.; Bauer, A.M.; Bernard, R.; Böhm, M.; Castro-Herrera, F.; Chirio, L.; Collen, B.; et al. The global distribution of tetrapods reveals a need for targeted reptile conservation. Nat. Ecol. Evol. 2017, 1, 1677–1682. [Google Scholar] [CrossRef] [PubMed]
  57. Stanford, C.B.; Iverson, J.B.; Rhodin, A.G.J.; van Dijk, P.P.; Mittermeier, R.A.; Kuchling, G.; Berry, K.H.; Bertolero, A.; Bjorndal, K.A.; Blanck, T.E.G.; et al. Turtles and Tortoises Are in Trouble. Curr. Biol. 2020, 30, R721–R735. [Google Scholar] [CrossRef] [PubMed]
  58. Robinson, J.E.; St John, F.A.V.; Griffiths, R.A.; Roberts, D.L. Captive reptile mortality rates in the home and implications for the wildlife trade. PLoS ONE 2016, 11, e0157519. [Google Scholar] [CrossRef] [Green Version]
  59. Teixeira, J.C.; Huber, C.D. The inflated significance of neutral genetic diversity in conservation genetics. Proc. Natl. Acad. Sci. USA 2021, 118, e2015096118. [Google Scholar] [CrossRef]
  60. Poulakakis, N.; Edwards, D.L.; Chiari, Y.; Garrick, R.C.; Russello, M.A.; Benavides, E.; Watkins-Colwell, G.J.; Glaberman, S.; Tapia, W.; Gibbs, J.P.; et al. Description of a New Galapagos Giant Tortoise Species (Chelonoidis; Testudines: Testudinidae) from Cerro Fatal on Santa Cruz Island. PLoS ONE 2015, 10, e0138779. [Google Scholar] [CrossRef] [Green Version]
  61. Russello, M.A.; Glaberman, S.; Gibbs, J.P.; Marquez, C.; Powell, J.R.; Caccone, A. A cryptic taxon of Galápagos tortoise in conservation peril. Biol. Lett. 2005, 1, 287–290. [Google Scholar] [CrossRef]
  62. Caccone, A.; Gentile, G.; Gibbs, J.P.; Frirts, T.H.; Snell, H.L.; Betts, J.; Powell, J.R. Phylogeography and history of giant Galápagos tortoises. Evolution 2002, 56, 2052–2066. [Google Scholar]
  63. Van der Kuyl, A.C.; Ballasina, D.L.; Zorgdrager, F. Mitochondrial haplotype diversity in the tortoise species Testudo graeca from North Africa and the Middle East. BMC Evol. Biol. 2005, 5, 29. [Google Scholar] [CrossRef] [Green Version]
  64. Loire, E.; Chiari, Y.; Bernard, A.; Cahais, V.; Romiguier, J.; Nabholz, B.; Lourenço, J.M.; Galtier, N. Population genomics of the endangered giant Galápagos tortoise. Genome Biol. 2013, 14, R136. [Google Scholar] [CrossRef] [Green Version]
  65. Poulakakis, N.; Russello, M.; Geist, D.; Caccone, A. Unravelling the peculiarities of island life: Vicariance, dispersal and the diversification of the extinct and extant giant Galápagos tortoises. Mol. Ecol. 2012, 21, 160–173. [Google Scholar] [CrossRef]
  66. Caccone, A.; Amato, G.; Gratry, O.C.; Behler, J.; Powell, J.R. A molecular phylogeny of four endangered Madagascar tortoises based on MtDNA sequences. Mol. Phylogenet. Evol. 1999, 12, 1–9. [Google Scholar] [CrossRef]
  67. Van der Kuyl, A.C.; Ph Ballasina, D.L.; Dekker, J.T.; Maas, J.; Willemsen, R.E.; Goudsmit, J. Phylogenetic relationships among the species of the genus Testudo (Testudines: Testudinidae) inferred from mitochondrial 12S rRNA gene sequences. Mol. Phylogenet. Evol. 2002, 22, 174–183. [Google Scholar] [CrossRef]
  68. Fritz, U.; Bininda-Emonds, O.R. When genes meet nomenclature: Tortoise phylogeny and the shifting generic concepts of Testudo and Geochelone. Zoology 2007, 110, 298–307. [Google Scholar] [CrossRef]
  69. Parham, J.F.; Macey, J.R.; Papenfuss, T.J.; Feldman, C.R.; Türkozan, O.; Polymeni, R.; Boore, J. The phylogeny of Mediterranean tortoises and their close relatives based on complete mitochondrial genome sequences from museum specimens. Mol. Phylogenet. Evol. 2006, 38, 50–64. [Google Scholar] [CrossRef] [Green Version]
  70. Zhang, X.; Unmack, P.J.; Kuchling, G.; Wang, Y.; Georges, A. Resolution of the enigmatic phylogenetic relationship of the critically endangered Western Swamp Tortoise Pseudemydura umbrina (Pleurodira: Chelidae) using a complete mitochondrial genome. Mol. Phylogenet. Evol. 2017, 115, 58–61. [Google Scholar] [CrossRef]
  71. Quesada, V.; Freitas-Rodríguez, S.; Miller, J.; Pérez-Silva, J.G.; Jiang, Z.F.; Tapia, W.; Santiago-Fernández, O.; Campos-Iglesias, D.; Kuderna, L.F.K.; Quinzin, M.; et al. Giant tortoise genomes provide insights into longevity and age-related disease. Nat. Ecol. Evol. 2019, 3, 87–95. [Google Scholar] [CrossRef] [Green Version]
  72. Poulakakis, N.; Glaberman, S.; Russello, M.; Beheregaray, L.B.; Ciofi, C.; Powell, J.R.; Caccone, A. Historical DNA analysis reveals living descendants of an extinct species of Galápagos tortoise. Proc. Natl. Acad. Sci. USA 2008, 105, 15464–15469. [Google Scholar] [CrossRef] [Green Version]
  73. Kehlmaier, C.; Barlow, A.; Hastings, A.K.; Vamberger, M.; Paijmans, J.L.; Steadman, D.W.; Albury, N.A.; Franz, R.; Hofreiter, M.; Fritz, U. Tropical ancient DNA reveals relationships of the extinct Bahamian giant tortoise Chelonoidis alburyorum. Proc. Biol. Sci. 2017, 284, 20162235. [Google Scholar] [CrossRef] [Green Version]
  74. Austin, J.J.; Arnold, E.N. Ancient mitochondrial DNA and morphology elucidate an extinct island radiation of Indian Ocean giant tortoises (Cylindraspis). Proc. Biol. Sci. 2001, 268, 2515–2523. [Google Scholar] [CrossRef] [PubMed] [Green Version]
  75. Palkovacs, E.P.; Gerlach, J.; Caccone, A. The evolutionary origin of Indian Ocean tortoises (Dipsochelys). Mol. Phylogenet. Evol. 2002, 24, 216–227. [Google Scholar] [CrossRef] [PubMed]
  76. Le, M.; Raxworthy, C.J.; McCord, W.P.; Mertz, L. A molecular phylogeny of tortoises (Testudines: Testudinidae) based on mitochondrial and nuclear genes. Mol. Phylogenet. Evol. 2006, 40, 517–531. [Google Scholar] [CrossRef] [PubMed]
  77. Reid, B.N.; Le, M.; McCord, W.P.; Iverson, J.B.; Georges, A.; Bergmann, T.; Amato, G.; Desalle, R.; Naro-Maciel, E. Comparing and combining distance-based and character-based approaches for barcoding turtles. Mol. Ecol. Resour. 2011, 11, 956–967. [Google Scholar] [CrossRef] [PubMed] [Green Version]
  78. Thomson, R.C.; Spinks, P.Q.; Shaffer, H.B. A global phylogeny of turtles reveals a burst of climate-associated diversification on continental margins. Proc. Natl. Acad. Sci. USA 2021, 118, e2012215118. [Google Scholar] [CrossRef]
  79. Chang, C.H.; Dai, W.Y.; Chen, T.Y.; Lee, A.H.; Hou, H.Y.; Liu, S.H.; Jang-Liaw, N.H. DNA barcoding reveals CITES-listed species among Taiwanese government-seized chelonian specimens. Genome 2018, 61, 615–624. [Google Scholar] [CrossRef]
  80. Das, S.; Rakib, T.M.; Islam, M.S.; Rahaman, M.M.; Das, T.; Hossain, M.A.; Sarker, S.; Raidal, S.R. The first complete mitogenome of Indian star tortoise (Geochelone elegans). Mitochondrial DNA B Resour. 2018, 3, 1112–1113. [Google Scholar] [CrossRef] [Green Version]
  81. Neumann, D.; Borisenko, A.V.; Coddington, J.A.; Häuser, C.L.; Butler, C.R.; Casino, A.; Vogel, J.C.; Haszprunar, G.; Giere, P. Global biodiversity research tied up by juridical interpretations of access and benefit sharing. Org. Divers. Evol. 2018, 18, 1–18. [Google Scholar] [CrossRef]
  82. Prathapan, K.D.; Pethiyagoda, R.; Bawa, K.S.; Raven, P.H.; Rajan, D. And 172 Co-Signatories from 35 Countries. When the cure kills—CBD limits biodiversity research. National laws fearing biopiracy squelch taxonomy studies. Science 2018, 360, 1405–1406. [Google Scholar] [CrossRef] [Green Version]
  83. D’Cruze, N.; Macdonald, D.W. A review of global trends in CITES live wildlife confiscations. Nat. Conserv. 2016, 15, 47–63. [Google Scholar] [CrossRef] [Green Version]
  84. Marshall, B.M.; Strine, C.; Hughes, A.C. Thousands of reptile species threatened by under-regulated global trade. Nat. Commun. 2020, 11, 4738. [Google Scholar] [CrossRef]
  85. Rhodin, A.G.J.; Stanford, C.B.; van Dijk, P.P.; Eisemberg, C.; Luiselli, L.; Mittermeier, R.A.; Hudson, R.; Horne, B.D.; Goode, E.; Kuchling, G.; et al. Global conservation status of turtles and tortoises (order Testudines). Chelonian Conserv. Biol. 2018, 17, 135–161. [Google Scholar] [CrossRef]
  86. Gumbs, R.; Gray, C.L.; Böhm, M.; Hoffmann, M.; Grenyer, R.; Jetz, W.; Meiri, S.; Roll, U.; Owen, N.R.; Rosindell, J. Global priorities for conservation of reptilian phylogenetic diversity in the face of human impacts. Nat. Commun. 2020, 11, 2616. [Google Scholar] [CrossRef]
Figure 1. Map showing the distribution of Geochelone elegans. The Map is prepared in the ArcGIS 10.6 platform using polygons (shp file) from the IUCN Red List of Threatened Species, which was assessed on 13 March 2018 (IUCN version 2022-1 acquired on 22 November 2022). The known distribution and collection sites of G. elegans are marked by red dots. The locations of the G. elegans genetic data generated during the current and previous studies are marked by green dots. The species photograph was acquired from the Turtle Survival Alliance India with prior permission.
Animals 13 00150 g001
Figure 2. (A) Results of the genetic landscape shape interpolation analysis of G. elegans with the distance weight parameter α = 1, projected on a grid size of 1 × 1 degree. The high values denote high, and low values denote low, genetic diversity corresponding to their locality information; (B) a box plot showing the weak intra-species genetic distance; (C) the ABGD web interface of the present dataset showing a histogram and ranked distances; and (D) a TCS haplotypic network showing the relationship among all the haplotypes of G. elegans. Circle sizes are proportional to the number of individuals that belong to each haplotype, and mutational steps are symbolized by dashes. The median vectors (hypothetical haplotypes) are denoted by black circles.
Animals 13 00150 g002
Figure 3. Unified Bayesian (BA) phylogenetic tree, based on the mitochondrial Cytb gene, shows the clustering pattern of G. elegans and G. platynota. The BA posterior probability support of each node was superimposed and marked by differently sized blue triangles. NCBI accession numbers and collection information are represented, with each node in parentheses. The red- and blue-colored bars indicate delineated MOTUs by ABGD and PTP, respectively.
Animals 13 00150 g003
Figure 4. Representing the probability of suitable habitats of G. elegans within the distribution range. (A) Zone-1 comprising the western range within Gujarat and Rajasthan of India; (B) Zone-2 comprising the eastern range within Odisha and Telangana, and the north-eastern portion of Andhra Pradesh of India; (C) Zone-3 comprising the southern range within Tamil Nadu and Karnataka, and the central to southern parts of Andhra Pradesh; (D) Zone-4 comprising the north-western to south-eastern regions within Sri Lanka.
Animals 13 00150 g004
Figure 5. Represents model evaluation, variable influence, and habitat quality assessment of G. elegans. (A) The average training ROC for the final model replicates. (B) Jackknife tests for all ten variables. The Blue bar shows each variable’s importance in explaining the data variation when used separately. The green bar shows the loss in total model gain when the particular variable was dropped, which signifies the unique information necessary for explaining the model. The red bar shows the total model gain. (C) Response curves of the important variables for the habitat suitability of G. elegans. (D) Percentage contribution is represented by a column graph (the color ramp represents the percentage contribution), and permutation importance is represented by the circular plot (size and color ramps represent permutation importance). (E) Represents the percentage stack of class-level matrices used for the habitat quality assessment of G. elegans in four zones. (PLAND = percentage of landscape; NP = number of patches; PD = patch density; LPI = largest patch index; TE = total edge; ED = edge density; LSI = landscape shape index; IJI = interspersion and juxtaposition index; AI = aggregation index).
Animals 13 00150 g005
Figure 6. Comparative visualization of the suitable ranges for G. elegans, along with illegal wildlife trade hotspots (https://www.wpsi-india.org/crime_maps/trade_hotspots.php, accessed on 25 November 2022) and the domestic and international illegal export trade routes of G. elegans (D’Cruze et al., 2015). The species photograph was acquired from the free media repository Wikimedia Commons.
Animals 13 00150 g006
Disclaimer/Publisher’s Note: The statements, opinions and data contained in all publications are solely those of the individual author(s) and contributor(s) and not of MDPI and/or the editor(s). MDPI and/or the editor(s) disclaim responsibility for any injury to people or property resulting from any ideas, methods, instructions or products referred to in the content.

