

Evaluation of a Comprehensive Profile of Salivary Analytes for the Diagnosis of the Equine Gastric Ulcer Syndrome

 ,
, 
 , , ,
, , ,  ,
,
Abstract
Simple Summary
Abstract
1. Introduction
2. Materials and Methods
2.1. Animals and Diagnosis
- EGUS group. The animals showed clinical signs and gastroscopy images compatible with EGUS, according to the criteria previously stated [3]. This group was further stratified into ESGD (and scored by using the 4-point scale indicated above), EGGD or both ESGD and EGGD. Only animals that were diagnosed with EGUS and had no evidence of other diseases were included in this group.
- Horses presenting with clinical signs compatible with EGUS but without gastroscopy images compatible with EGUS. These horses were further diagnosed with another disease or no specific diagnosis was found.
- The healthy population, which was composed of horses admitted for castration or routine health check. Those animals showed no clinical signs of abdominal pain or any other abnormality during physical examination; hematological and biochemical results were within reference values, and had no signs of EGUS after gastroscopy examination.
2.2. Sampling
2.3. Saliva Biochemistry Profile
- Enzymes: adenosine deaminase 1 (ADA1) and 2 (ADA2) isoenzymes, alkaline phosphatase (ALP), aspartate aminotransferase (AST), butyrylcholinesterase (BChE), creatine kinase (CK), γ-glutamyl transferase (gGT), lipase (LIP), lactate dehydrogenase (LDH), and α-amylase (sAA).
- Metabolites and proteins: creatinine (Creat), d-dimer, ferritin (Ferr), total cholesterol (TChol), total proteins (TP), triglycerides (Trig), and urea.
- Redox biomarkers: the advanced oxidation protein products (AOPP), the ferric reducing activity of saliva (FRAS), and uric acid (UA).
- Minerals: total calcium (Ca) and phosphorus (P).
2.4. Statistical Analysis
3. Results
3.1. Animals Included in the Study
3.2. Results of the Salivary Biomarkers
4. Discussion
5. Conclusions
Supplementary Materials
Author Contributions
Funding
Institutional Review Board Statement
Informed Consent Statement
Data Availability Statement
Conflicts of Interest
References
- Sandin, A.; Skidell, J.; Häggström, J.; Girma, K.; Nilsson, G. Post-Mortem Findings of Gastric Ulcers in Swedish Horses up to One Year of Age: A Retrospective Study 1924–1996. Acta Vet. Scand. 1999, 40, 109–120. [Google Scholar] [CrossRef] [PubMed]
- Busechian, S.; Sgorbini, M.; Orvieto, S.; Pisello, L.; Zappulla, F.; Briganti, A.; Nocera, I.; Conte, G.; Rueca, F. Evaluation of a Questionnaire to Detect the Risk of Developing ESGD or EGGD in Horses. Prev. Vet. Med. 2021, 188, 105285. [Google Scholar] [CrossRef] [PubMed]
- Sykes, B.W.; Hewetson, M.; Hepburn, R.J.; Luthersson, N.; Tamzali, Y. European College of Equine Internal Medicine Consensus Statement-Equine Gastric Ulcer Syndrome in Adult Horses. J. Vet. Intern. Med. 2015, 29, 1288–1299. [Google Scholar] [CrossRef] [PubMed]
- Sykes, B.W.; Bowen, M.; Habershon-Butcher, J.L.; Green, M.; Hallowell, G.D. Management Factors and Clinical Implications of Glandular and Squamous Gastric Disease in Horses. J. Vet. Intern. Med. 2019, 33, 233–240. [Google Scholar] [CrossRef] [PubMed]
- Zavoshti, F.R.; Andrews, F.M. Therapeutics for Equine Gastric Ulcer Syndrome. Vet. Clin. N. Am. Equine Pract. 2017, 33, 141–162. [Google Scholar] [CrossRef]
- Aronson, J.K.; Ferner, R.E. Biomarkers-A General Review. Curr. Protoc. Pharmacol. 2017, 76, 9.23.1–9.23.17. [Google Scholar] [CrossRef] [PubMed]
- Cerón, J.J.; Contreras-Aguilar, M.D.; Escribano, D.; Martínez-Miró, S.; López-Martínez, M.J.; Ortín-Bustillo, A.; Franco-Martínez, L.; Rubio, C.P.; Muñoz-Prieto, A.; Tvarijonaviciute, A.; et al. Basics for the Potential Use of Saliva to Evaluate Stress, Inflammation, Immune System, and Redox Homeostasis in Pigs. BMC Vet. Res. 2022, 18, 81. [Google Scholar] [CrossRef]
- Contreras-Aguilar, M.D.; Rubio, C.P.; González-Arostegui, L.G.; Martín-Cuervo, M.; Cerón, J.J.; Ayala, I.; Henriksen, I.M.H.; Jacobsen, S.; Hansen, S. Changes in Oxidative Status Biomarkers in Saliva and Serum in the Equine Gastric Ulcer Syndrome and Colic of Intestinal Aetiology: A Pilot Study. Animals 2022, 12, 667. [Google Scholar] [CrossRef] [PubMed]
- Muñoz-Prieto, A.; Contreras-Aguilar, M.D.; Cerón, J.J.; Ayala, I.; Martin-Cuervo, M.; Gonzalez-Sanchez, J.C.; Jacobsen, S.; Kuleš, J.; Beletić, A.; Rubić, I.; et al. Changes in Proteins in Saliva and Serum in Equine Gastric Ulcer Syndrome Using a Proteomic Approach. Animals 2022, 12, 1169. [Google Scholar] [CrossRef] [PubMed]
- Contreras-Aguilar, M.; Escribano, D.; Martínez-Subiela, S.; Martín-Cuervo, M.; Lamy, E.; Tecles, F.; Cerón, J. Changes in Saliva Analytes in Equine Acute Abdominal Disease: A Sialochemistry Approach. BMC Vet. Res. 2019, 15, 187. [Google Scholar] [CrossRef]
- Contreras-Aguilar, M.D.; Martínez-Subiela, S.; Cerón, J.J.; Martín-Cuervo, M.; Tecles, F.; Escribano, D. Salivary Alpha-Amylase Activity and Concentration in Horses with Acute Abdominal Disease: Association with Outcome. Equine Vet. J. 2019, 51, 569–574. [Google Scholar] [CrossRef] [PubMed]
- Shawaf, T.; El-Deeb, W.M.; Elgioushy, M. The Contribution of Specific and Nonspecific Biomarkers in Diagnosis of Equine Gastric Ulcer Syndrome (EGUS) Under Field Condition. J. Equine Vet. Sci. 2020, 84, 102853. [Google Scholar] [CrossRef]
- Contreras-Aguilar, M.D.; Hevia, M.L.; Escribano, D.; Lamy, E.; Tecles, F.; Cerón, J.J. Effect of Food Contamination and Collection Material in the Measurement of Biomarkers in Saliva of Horses. Res. Vet. Sci. 2020, 129, 90–95. [Google Scholar] [CrossRef]
- Benzie, I.; Strain, J. The Ferric Reducing Ability of Plasma (FRAP) as a Measure of “Antioxidant Power”: The FRAP Assay. Anal. Biochem. 1996, 239, 70–76. [Google Scholar] [CrossRef]
- Witko-Sarsat, V.; Friedlander, M.; Capeillère-Blandin, C.; Nguyen-Khoa, T.; Nguyen, A.; Zingraff, J.; Jungers, P.; Descamps-Latscha, B. Advanced Oxidation Protein Products as a Novel Marker of Oxidative Stress in Uremia. Kidney Int. 1996, 49, 1304–1313. [Google Scholar] [CrossRef] [PubMed]
- Contreras-Aguilar, M.; Tvarijonaviciute, A.; Monkeviciene, I.; Martín-Cuervo, M.; González-Arostegui, L.; Franco-Martínez, L.; Cerón, J.; Tecles, F.; Escribano, D. Characterization of Total Adenosine Deaminase Activity (ADA) and Its Isoenzymes in Saliva and Serum in Health and Inflammatory Conditions in Four Different Species: An Analytical and Clinical Validation Pilot Study. BMC Vet. Res. 2020, 16, 384. [Google Scholar] [CrossRef] [PubMed]
- Perkins, N.J.; Schisterman, E.F. The Inconsistency of “Optimal” Cutpoints Obtained Using Two Criteria Based on the Receiver Operating Characteristic Curve. Am. J. Epidemiol. 2006, 163, 670–675. [Google Scholar] [CrossRef]
- Faul, F.; Erdfelder, E.; Lang, A.G.; Buchner, A. G*Power 3: A Flexible Statistical Power Analysis Program for the Social, Behavioral, and Biomedical Sciences. Behav. Res. Methods 2007, 39, 175–191. [Google Scholar] [CrossRef]
- Cook, N.J.; Schaefer, A.L.; Lepage, P.; Morgan Jones, S. Salivary vs. Serum Cortisol for the Assessment of Adrenal Activity in Swine. Can. J. Anim. Sci. 1996, 76, 329–335. [Google Scholar] [CrossRef]
- Nater, U.M.; Rohleder, N. Salivary Alpha-Amylase as a Non-Invasive Biomarker for the Sympathetic Nervous System: Current State of Research. Psychoneuroendocrinology 2009, 34, 486–496. [Google Scholar] [CrossRef] [PubMed]
- Sullivan, J.; Osborne, W.; Wedgewood, R. Adenosine Deaminase Activity in Lymphocytes. Br. J. Haematol. 1977, 37, 157–158. [Google Scholar] [CrossRef] [PubMed]
- Namiot, Z.; Marcinkiewicz, M.; Jaroszewicz, W.; Stasiewicz, J.; Gorski, J. Mucosal Adenosine Deaminase Activity and Gastric Ulcer Healing. Eur. J. Pharmacol. 1993, 243, 301–303. [Google Scholar] [CrossRef]
- Thorén-Tolling, K. Serum Alkaline Phosphatase Isoenzymes in the Horse--Variation with Age, Training and in Different Pathological Conditions. Zentralbl. Veterinarmed. A 1988, 35, 13–23. [Google Scholar] [CrossRef] [PubMed]
- Ellison, R.; Jacobs, R. The Isoelectric Focusing Properties of Serum Alkaline Phosphatase in Disease and Following Prednisolone and Phenylbutazone Administration in the Horse. Can. J. Vet. Res. 1990, 54, 126–131. [Google Scholar] [PubMed]
- Vatistas, N.J.; Snyder, J.R.; Carlson, G.; Johnson, B.; Arthur, R.M.; Thurmond, M.; Zhou, H.; Lloyd, K.L. Cross-Sectional Study of Gastric Ulcers of the Squamous Mucosa in Thoroughbred Racehorses. Equine Vet. J. Suppl. 1999, 29, 34–39. [Google Scholar] [CrossRef] [PubMed]
- Ono, S.; Kurata, C.; Nishimura, N.; Kawashima, H.; Yoneima, R.; Tai, Y.; Tatsumi, E.; Miyamoto, M.; Yada, N.; Yoshimoto, K.; et al. Importance Of Laboratory Detection Of Macro-Aspartate Aminotransferase. Int. J. Gen. Med. 2019, 12, 433–436. [Google Scholar] [CrossRef]
- Jaroszewicz, L.; Zwierz, K.; Popowicz, J. Aminotransferases in Cases of Gastric Ulcers. I. “Aminotransferase Pattern” of a Native Homogenate and Subcellular Fractions of the Human Gastric Mucous Membrane. Digestion 1969, 2, 323–328. [Google Scholar] [CrossRef] [PubMed]
- Kubota, T.; Fujioka, T.; Nasu, M. Cytotoxic Effects of Helicobacter Pylori on Guinea Pig Gastric Glands. Kansenshogaku Zasshi. 1995, 69, 7–14. [Google Scholar] [CrossRef] [PubMed][Green Version]
- Savabi, F. Interaction of Creatine Kinase and Adenylate Kinase Systems in Muscle Cells. Mol. Cell. Biochem. 1994, 133–134, 145–152. [Google Scholar] [CrossRef] [PubMed]
- Kato, A.; Naitou, H.; Namioka, M.; Akimoto, M.; Ishii, T.; Sakakibara, H.; Shimoi, K.; Nakayama, T.; Ohashi, N. Proteomic Identification of Serum Proteins Associated with Stress-Induced Gastric Ulcers in Fasted Rats. Biosci. Biotechnol. Biochem. 2010, 74, 812–818. [Google Scholar] [CrossRef] [PubMed]
- Tvarijonaviciute, A.; Barranco, T.; Rubio, M.; Carrillo, J.M.; Martinez-Subiela, S.; Tecles, F.; Carrillo, J.D.; Cerón, J.J. Measurement of Creatine Kinase and Aspartate Aminotransferase in Saliva of Dogs: A Pilot Study. BMC Vet. Res. 2017, 13, 168. [Google Scholar] [CrossRef]
- Contreras-Aguilar, M.D.; Cerón, J.J.; Muñoz, A.; Ayala, I. Changes in Saliva Biomarkers during a Standardized Increasing Intensity Field Exercise Test in Endurance Horses. Animal 2021, 15, 100236. [Google Scholar] [CrossRef] [PubMed]
- Cabrera-Abreu, J.C.; Green, A. γ-Glutamyltransferase: Value of Its Measurement in Paediatrics. Ann. Clin. Biochem. 2002, 39, 22–25. [Google Scholar] [CrossRef] [PubMed]
- Dominici, S.; Valentini, M.; Maellaro, E.; Del Bello, B.; Paolicchi, A.; Lorenzini, E.; Tongiani, R.; Comporti, M.; Pompella, A. Redox Modulation of Cell Surface Protein Thiols in U937 Lymphoma Cells: The Role of γ-Glutamyl Transpeptidase-Dependent H2O2 Production and S-Thiolation. Free Radic. Biol. Med. 1999, 27, 623–635. [Google Scholar] [CrossRef] [PubMed]
- Hong, S.W.; Lee, H.J.; Han, K.; Moon, J.M.; Park, S.; Soh, H.; Kang, E.A.; Chun, J.; Im, J.P.; Kim, J.S. Risk of Gastrointestinal Cancer in Patients with an Elevated Level of γ-Glutamyltransferase: A Nationwide Population-Based Study. PLoS ONE 2021, 16, e0245052. [Google Scholar] [CrossRef]
- Gong, M.; Ling, S.S.M.; Lui, S.Y.; Yeoh, K.G.; Ho, B. Helicobacter Pylori γ-Glutamyl Transpeptidase Is a Pathogenic Factor in the Development of Peptic Ulcer Disease. Gastroenterology 2010, 139, 564–573. [Google Scholar] [CrossRef] [PubMed]
- Contreras, M.; Morales, A.; García-Amado, M.A.; De Vera, M.; Bermúdez, V.; Gueneau, P. Detection of Helicobacter-like DNA in the Gastric Mucosa of Thoroughbred Horses. Lett. Appl. Microbiol. 2007, 45, 553–557. [Google Scholar] [CrossRef]
- Yuan, J.; Du, Z.; Wu, Z.; Yang, Y.; Cheng, X.; Liu, X.; Jia, J. A Novel Diagnostic Predictive Model for Idiopathic Short Stature in Children. Front. Endocrinol. 2021, 12, 721812. [Google Scholar] [CrossRef] [PubMed]
- Bergantini, L.; Bargagli, E.; d’Alessandro, M.; Refini, R.M.; Cameli, P.; Galasso, L.; Scapellato, C.; Montagnani, F.; Scolletta, S.; Franchi, F.; et al. Prognostic Bioindicators in Severe COVID-19 Patients. Cytokine 2021, 141, 155455. [Google Scholar] [CrossRef] [PubMed]
- Montero-Chacón, L.B.; Padilla-Cuadra, J.I.; Chiou, S.H.; Torrealba-Acosta, G. High-Density Lipoprotein, Mean Platelet Volume, and Uric Acid as Biomarkers for Outcomes in Patients With Sepsis: An Observational Study. J. Intensive Care Med. 2020, 35, 636–642. [Google Scholar] [CrossRef]
- Tsukada, K.; Hasegawa, T.; Miyazaki, T.; Katoh, H.; Yoshikawa, M.; Masuda, N.; Ojima, H.; Tajima, K.; Fukai, Y.; Nakajima, M.; et al. Predictive Value of Uric Acid in Gastric Mucosal Damage in Hemodialysis Patients. Hepatogastroenterology 2003, 50, 1708–1711. [Google Scholar] [PubMed]
- Chen, Z.; Xu, C.; Luo, L.; Xiao, J.; Yang, P.T.; Liu, C. Helicobacter Pylori Infection and Gastric Mucosa Change and Blood-Lipid in People Undergoing the Physical Examination in Changsha. Zhong Nan Da Xue Xue Bao. Yi Xue Ban 2014, 39, 265–269. [Google Scholar] [CrossRef] [PubMed]
- Kim, H.L.; Jeon, H.H.; Park, I.Y.; Choi, J.M.; Kang, J.S.; Min, K.W. Helicobacter Pylori Infection Is Associated with Elevated Low Density Lipoprotein Cholesterol Levels in Elderly Koreans. J. Korean Med. Sci. 2011, 26, 654–658. [Google Scholar] [CrossRef]
- Megha, R.; Farooq, U.; López, P. Stress-Induced Gastritis. In StatPearls, [Internet]; StatPearls Publishing: Treasure Island, FL, USA, 2022. [Google Scholar]
- Zaniewski, M.; Jordan Jr, P.; Yip, B.; Thornby, J.; Mallette, L. Serum Gastrin Level Is Increased by Chronic Hypercalcemia of Parathyroid or Nonparathyroid Origin. Arch. Intern. Med. 1986, 146, 478–482. [Google Scholar] [CrossRef] [PubMed]
- Sun, F.P.; Song, Y.G.; Cheng, W.; Zhao, T.; Yao, Y.L. Gastrin, Somatostatin, G and D Cells of Gastric Ulcer in Rats. World J. Gastroenterol. 2002, 8, 375–378. [Google Scholar] [CrossRef] [PubMed]
- Campana, D.; Piscitelli, L.; Mazzotta, E.; Bonora, M.; Serra, C.; Salomone, L.; Corinaldesi, R.; Tomassetti, P. Zollinger-Ellison Syndrome. Diagnosis and Therapy. Minerva Med. 2005, 96, 187–206. [Google Scholar] [PubMed]
- Furr, M.; Taylor, L.; Kronfeld, D. The Effects of Exercise Training on Serum Gastrin Responses in the Horse. Cornell Vet. 1994, 84, 41–45. [Google Scholar] [PubMed]
- Fomina, L. The Role of Calcium-Regulating System in the Pathogenesis and Sanogenesis of Peptic Ulcer Disease and Possibility of Its Changes Correction in the Treatment of Recurrent Disease. Exp. Clin. Gastroenterol. 2016, 10, 19–24. [Google Scholar]
- Toribio, R. Disorders of the Endocrine System. In Equine Internal Medicine; Reed, S., Bayly, W., Sellon, D., Eds.; Elsevier: Amsterdam, The Netherlands, 2004; pp. 1295–1379. [Google Scholar]
- Lepage, O.; DesCôteaux, L.; Marcoux, M.; Tremblay, A. Circadian Rhythms of Osteocalcin in Equine Serum. Correlation with Alkaline Phosphatase, Calcium, Phosphate and Total Protein Levels. Can. J. Vet. Res. 1991, 55, 5–10. [Google Scholar]
- Contreras-Aguilar, M.D.; Lamy, E.; Escribano, D.; Cerón, J.J.; Tecles, F.; Quiles, A.J.; Hevia, M.L. Changes in Salivary Analytes of Horses Due to Circadian Rhythm and Season: A Pilot Study. Animals 2020, 10, 1486. [Google Scholar] [CrossRef] [PubMed]


| Healthy | EGUS | OD | p Value | 1 − β | Size Effect | |
|---|---|---|---|---|---|---|
| Enzymes | ||||||
| ADA1 (IU/L) | 17.7 (21.7) | 170.8 (170.3) *** | 103.7 (282.1) ** | <0.001 | 1.00 | 1.01 |
| ADA2 (IU/L) | 0.4 (0.6) | 4.2 (6.5) *** | 3.1 (7.1) *** | <0.001 | 1.00 | 0.95 |
| ALP (IU/L) | 49.5 (71.8) | 130.0 (280.8) ** | 104.8 (214.4) | 0.004 | 0.99 | 0.46 |
| AST (IU/L) | 48.1 (28.5) | 290.4 (455.8) *** | 201.2 (731.3) *** | <0.001 | 1.00 | 0.97 |
| BChE (IU/mL) | 6.0 (5.4) | 40.4 (52.1) *** | 48.0 (76.3) *** | <0.001 | 1.00 | 1.02 |
| CK (IU/L) | 3.9 (4.6) | 36.7 (58.6) *** | 27.2 (55.7) *** | <0.001 | 1.00 | 0.99 |
| gGT (IU/L) | 9.8 (15.8) | 95.5 (130.2) *** | 64.2 (161.7) ** | <0.001 | 1.00 | 0.98 |
| LIP (IU/L) | 40.5 (19.4) | 43.9 (45.5) | 83.1 (145.3) | 0.222 | 0.90 | 0.24 |
| LDH (IU/L) | 171.0 (221.9) | 1102.4 (1443.5) *** | 714.0 (1873.4) ** | <0.001 | 1.00 | 0.70 |
| sAA (IU/L) | 4.3 (2.7) | 6.8 (19.2) ** | 7.2 (5.8) | 0.011 | 0.98 | 0.40 |
| Metabolites and proteins | ||||||
| Creat (µmol/L) | 13.3 (11.5) | 17.7 (24.6) | 17.7 (24.6) | 0.249 | 0.93 | 0.23 |
| d-dimer (µg/mL) | 0.2 (0.1) | 0.5 (2.2) | 0.5 (1.6) | 0.175 | 0.94 | 0.29 |
| Ferr (pmol/L) | 19.6 (32.6) | 41.8 (25.4) ** a | 52.8 (45.2) *** | <0.001 | 0.98 | 0.42 |
| TChol (µmol/L) | 70.2 (2.6) | 70.2 (15.6) | 70.2 (2.6) | 0.245 | 0.91 | 0.13 |
| TP (mg/dL) | 50.5 (55.4) | 471.3 (703.8) *** | 269.2 (612.6) ** | <0.001 | 1.00 | 0.80 |
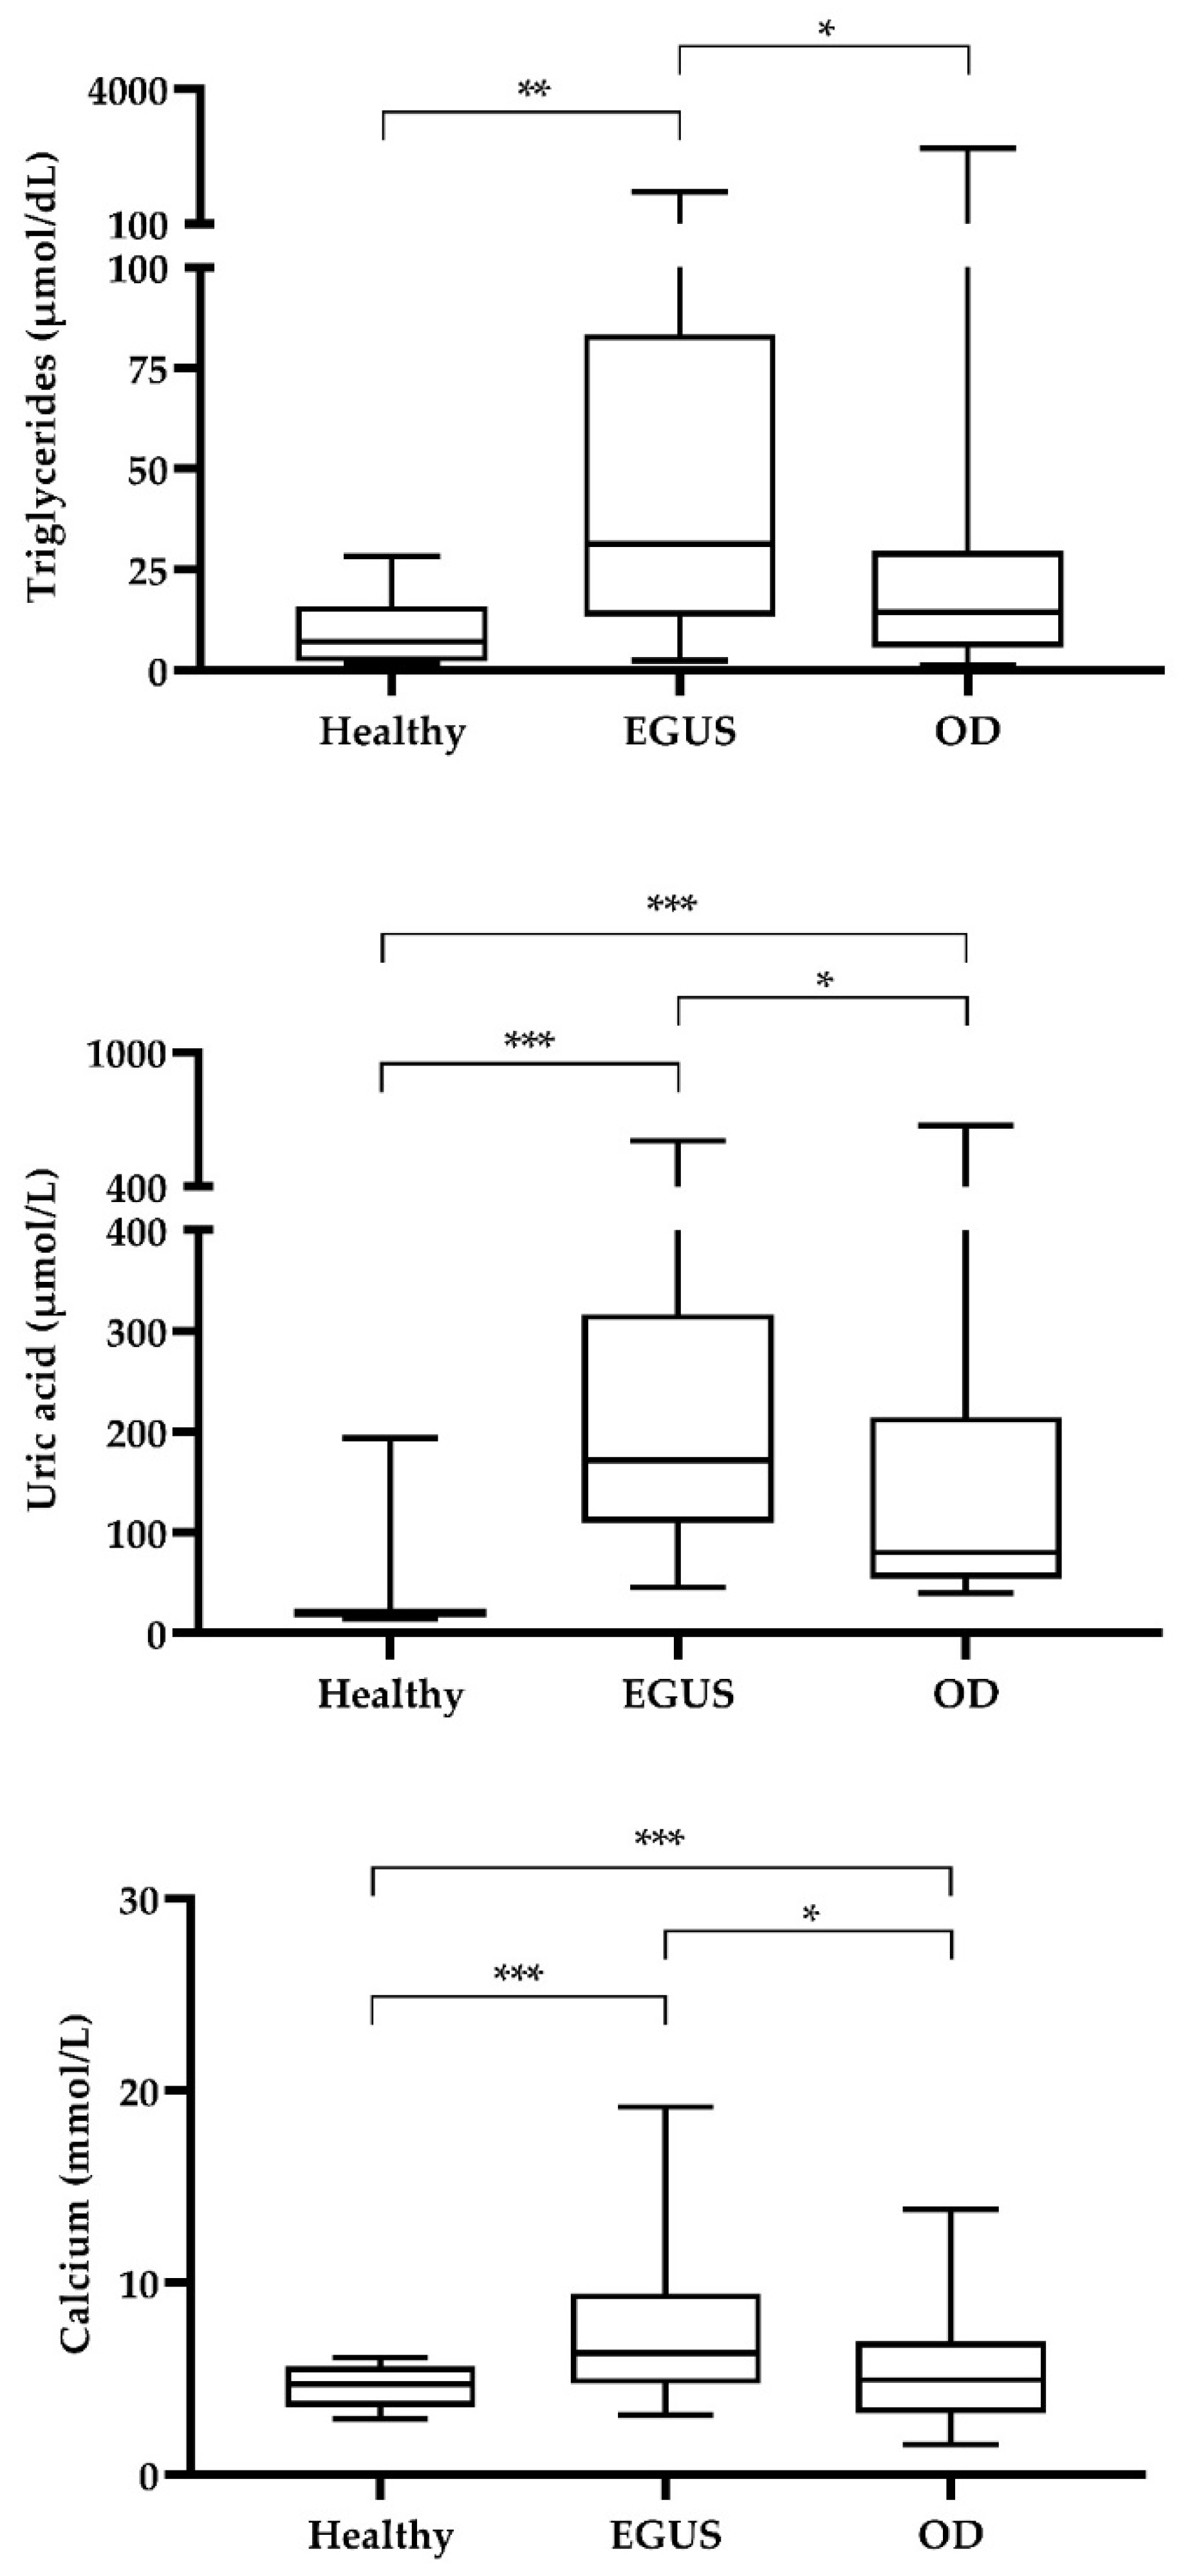
| Trig (µmol/dL) | 7.2 (13.8) | 31.2 (69.9) ** a | 14.4 (23.9) | <0.001 | 0.99 | 0.49 |
| Urea (mmol/L) | 2.7 (3.2) | 5.6 (7.1) * | 7.5 (9.7) ** | 0.007 | 0.99 | 0.49 |
| Redox biomarkers | ||||||
| AOPP (µmol/L) | 94.0 (181.4) | 222.8 (307.2) | 230.0 (322.3) * | 0.032 | 0.99 | 0.44 |
| FRAS (µmol/L) | 226.7 (487.0) | 656.0 (590.0) ** | 452.0 (833.2) | 0.002 | 0.96 | 0.34 |
| UA (µmol/L) | 21.2 (7.1) | 171.7 (207.1) ***a | 80.2 (15.9) ** | <0.001 | 1.00 | 0.90 |
| Minerals | ||||||
| Ca (mmol/L) | 4.8 (2.1) | 6.4 (4.7) * a | 5.0 (3.8) | 0.002 | 0.99 | 0.41 |
| P (mmol/L) | 0.2 (0.1) | 0.3 (0.5) ** | 0.3 (0.2) | 0.007 | 0.97 | 0.36 |
| Enzymes | Metabolites and Proteins | Redox Biomarkers | |||
|---|---|---|---|---|---|
| ADA1: | 0.759 ** | Creat: | 0.385* | AOPP: | 0.257 |
| ADA2: | 0.745 ** | d-dimer: | 0.341* | FRAS: | 0.493 ** |
| ALP: | 0.519 ** | Ferr: | 0.600 ** | UA: | 0.703 ** |
| AST: | 0.734 ** | TChol: | 0.243 | ||
| BChE: | 0.647 ** | TP: | 0.623 ** | Minerals | |
| CK: | 0.602 ** | Trig: | 0.240 | Ca: | 0.410 * |
| gGT: | 0.682 ** | Urea: | 0.450 ** | P: | 0.340 * |
| LIP: | 0.555 ** | ||||
| LDH: | 0.597 ** | ||||
| sAA: | 0.304 | ||||
Publisher’s Note: MDPI stays neutral with regard to jurisdictional claims in published maps and institutional affiliations. |
© 2022 by the authors. Licensee MDPI, Basel, Switzerland. This article is an open access article distributed under the terms and conditions of the Creative Commons Attribution (CC BY) license (https://creativecommons.org/licenses/by/4.0/).
Share and Cite
Muñoz-Prieto, A.; Cerón, J.J.; Rubio, C.P.; Contreras-Aguilar, M.D.; Pardo-Marín, L.; Ayala-de la Peña, I.; Martín-Cuervo, M.; Holm Henriksen, I.-M.; Arense-Gonzalo, J.J.; Tecles, F.; et al. Evaluation of a Comprehensive Profile of Salivary Analytes for the Diagnosis of the Equine Gastric Ulcer Syndrome. Animals 2022, 12, 3261. https://doi.org/10.3390/ani12233261
Muñoz-Prieto A, Cerón JJ, Rubio CP, Contreras-Aguilar MD, Pardo-Marín L, Ayala-de la Peña I, Martín-Cuervo M, Holm Henriksen I-M, Arense-Gonzalo JJ, Tecles F, et al. Evaluation of a Comprehensive Profile of Salivary Analytes for the Diagnosis of the Equine Gastric Ulcer Syndrome. Animals. 2022; 12(23):3261. https://doi.org/10.3390/ani12233261
Chicago/Turabian StyleMuñoz-Prieto, Alberto, José J. Cerón, Camila P. Rubio, María Dolores Contreras-Aguilar, Luis Pardo-Marín, Ignacio Ayala-de la Peña, María Martín-Cuervo, Ida-Marie Holm Henriksen, Julián J. Arense-Gonzalo, Fernando Tecles, and et al. 2022. "Evaluation of a Comprehensive Profile of Salivary Analytes for the Diagnosis of the Equine Gastric Ulcer Syndrome" Animals 12, no. 23: 3261. https://doi.org/10.3390/ani12233261
APA StyleMuñoz-Prieto, A., Cerón, J. J., Rubio, C. P., Contreras-Aguilar, M. D., Pardo-Marín, L., Ayala-de la Peña, I., Martín-Cuervo, M., Holm Henriksen, I.-M., Arense-Gonzalo, J. J., Tecles, F., & Hansen, S. (2022). Evaluation of a Comprehensive Profile of Salivary Analytes for the Diagnosis of the Equine Gastric Ulcer Syndrome. Animals, 12(23), 3261. https://doi.org/10.3390/ani12233261