
Prognostic Role of Red Cell Distribution Width and Other Routine Clinico-Pathological Parameters in Dogs with Acute Pancreatitis

 , ,
, ,  , and
, and
Abstract
Simple Summary
Abstract
1. Introduction
2. Material and Methods
2.1. Study Design and Inclusion Criteria
2.2. Data Collection
2.3. Laboratory Findings
2.4. Statistical Analyses
3. Results
3.1. Study Population and Laboratory Parameters
3.2. Univariate and Multivariable Regression Analysis
4. Discussion
5. Conclusions
Author Contributions
Funding
Institutional Review Board Statement
Informed Consent Statement
Data Availability Statement
Conflicts of Interest
References
- Kuzi, S.; Mazor, R.; Segev, G.; Nivy, R.; Mazaki-Tovi, M.; Chen, H.; Rimer, D.; Duneyevitz, A.; Yas, E.; Lavy, E.; et al. Prognostic Markers and Assessment of a Previously Published Clinical Severity Index in 109 Hospitalised Dogs with Acute Presentation of Pancreatitis. Vet. Rec. 2020, 187, e13. [Google Scholar] [CrossRef] [PubMed]
- Fabrès, V.; Dossin, O.; Reif, C.; Campos, M.; Freiche, V.; Maurey, C.; Pilot-Storck, F.; Desquilbet, L.; Benchekroun, G. Development and Validation of a Novel Clinical Scoring System for Short-Term Prediction of Death in Dogs with Acute Pancreatitis. J. Vet. Intern. Med. 2019, 33, 499–507. [Google Scholar] [CrossRef] [PubMed]
- Mansfield, C.S.; James, F.E.; Robertson, I.D. Development of a Clinical Severity Index for Dogs with Acute Pancreatitis. J. Am. Vet. Med. Assoc. 2008, 233, 936–944. [Google Scholar] [CrossRef] [PubMed]
- Watson, P. Pancreatitis in Dogs and Cats: Definitions and Pathophysiology. J. Small Anim. Pract. 2015, 56, 3–12. [Google Scholar] [CrossRef] [PubMed]
- Watson, P. Canine and Feline Pancreatitis: A Challenging and Enigmatic Disease. J. Small Anim. Pract. 2015, 56, 1–2. [Google Scholar] [CrossRef]
- Neumann, S. Neutrophil-to-Lymphocyte and Platelet-to-Lymphocyte Ratios in Dogs and Cats with Acute Pancreatitis. Vet. Clin. Pathol. 2021, 50, 45–51. [Google Scholar] [CrossRef]
- Sato, T.; Ohno, K.; Tamamoto, T.; Oishi, M.; Kanemoto, H.; Fukushima, K.; Goto-Koshino, Y.; Takahashi, M.; Tsujimoto, H. Assessment of Severity and Changes in C-Reactive Protein Concentration and Various Biomarkers in Dogs with Pancreatitis. J. Vet. Med. Sci. 2017, 79, 35–40. [Google Scholar] [CrossRef]
- Gori, E.; Pierini, A.; Lippi, I.; Ceccherini, G.; Perondi, F.; Marchetti, V. Evaluation of C-Reactive Protein/Albumin Ratio and Its Relationship with Survival in Dogs with Acute Pancreatitis. N. Z. Vet. J. 2020, 68, 345–348. [Google Scholar] [CrossRef]
- Kuzi, S.; Mazaki-Tovi, M.; Suchodolski, J.S.; Rimer, D.; Lidbury, J.A.; Steiner, J.M.; Buono, A.; Nivy, R.; Segev, G.; Aroch, I. Protease Inhibitors, Inflammatory Markers, and Their Association with Outcome in Dogs with Naturally Occurring Acute Pancreatitis. J. Vet. Intern. Med. 2020, 34, 1801–1812. [Google Scholar] [CrossRef]
- Wolfer, L.A.; Howard, J.; Peters, L.M. Accuracy of 1,2-o-Dilauryl-Rac-Glycero-3-Glutaric Acid-(6′-Methylresorufin) Ester (DGGR)-Lipase to Predict Canine Pancreas-Specific Lipase (CPL) and Diagnostic Accuracy of Both Tests for Canine Acute Pancreatitis. Vet. Sci. 2022, 9, 177. [Google Scholar] [CrossRef]
- Hope, A.; Bailen, E.L.; Shiel, R.E.; Mooney, C.T. Retrospective Study Evaluation of DGGR Lipase for Diagnosis, Agreement with Pancreatic Lipase and Prognosis in Dogs with Suspected Acute Pancreatitis. J. Small Anim. Pract. 2021, 62, 1092–1100. [Google Scholar] [CrossRef] [PubMed]
- Gori, E.; Lippi, I.; Guidi, G.; Perondi, F.; Pierini, A.; Marchetti, V. Acute Pancreatitis and Acute Kidney Injury in Dogs. Vet. J. 2019, 245, 77–81. [Google Scholar] [CrossRef] [PubMed]
- Marchetti, V.; Gori, E.; Lippi, I.; Luchetti, E.; Manca, M.L.; Pierini, A. Elevated Serum Creatinine and Hyponatraemia as Prognostic Factors in Canine Acute Pancreatitis. Aust. Vet. J. 2017, 95, 444–447. [Google Scholar] [CrossRef] [PubMed]
- Gori, E.; Pierini, A.; Lippi, I.; Meucci, V.; Perondi, F.; Marchetti, V. Evaluation of Asymmetric Dimethylarginine as an Inflammatory and Prognostic Marker in Dogs with Acute Pancreatitis. J. Vet. Intern. Med. 2020, 34, 1144–1149. [Google Scholar] [CrossRef] [PubMed]
- Gori, E.; Pierini, A.; Lippi, I.; Boffa, N.; Perondi, F.; Marchetti, V. Urinalysis and Urinary GGT-to-Urinary Creatinine Ratio in Dogs with Acute Pancreatitis. Vet. Sci. 2019, 6, 27. [Google Scholar] [CrossRef] [PubMed]
- Zhang, L.; Wang, Y.; Han, J.; Shen, H.; Zhao, M.; Cai, S. Neutrophil-Lymphocyte Ratio, Gamma-Glutamyl Transpeptidase, Lipase, High-Density Lipoprotein as a Panel of Factors to Predict Acute Pancreatitis in Pregnancy. Medicine 2018, 97, e11189. [Google Scholar] [CrossRef]
- Liu, G.; Tao, J.; Zhu, Z.; Wang, W. The Early Prognostic Value of Inflammatory Markers in Patients with Acute Pancreatitis. Clin. Res. Hepatol. Gastroenterol. 2019, 43, 330–337. [Google Scholar] [CrossRef]
- Wang, Y.; Fuentes, H.E.; Attar, B.M.; Jaiswal, P.; Demetria, M. Evaluation of the Prognostic Value of Neutrophil to Lymphocyte Ratio in Patients with Hypertriglyceridemia-Induced Acute Pancreatitis. Pancreatology 2017, 17, 893–897. [Google Scholar] [CrossRef]
- Goyal, H.; Awad, H.; Hu, Z.-D. Prognostic Value of Admission Red Blood Cell Distribution Width in Acute Pancreatitis: A Systematic Review. Ann. Transl. Med. 2017, 5, 342. [Google Scholar] [CrossRef]
- O’Connell, R.M.; Boland, M.R.; O’Driscoll, J.; Salih, A.; Arumugasamy, M.; Walsh, T.N.; Allen, M.J.; Beddy, D.J. Red Cell Distribution Width and Neutrophil to Lymphocyte Ratio as Predictors of Outcomes in Acute Pancreatitis: A Retrospective Cohort Study. Int. J. Surg. 2018, 55, 124–127. [Google Scholar] [CrossRef]
- Gravito-Soares, M.; Gravito-Soares, E.; Gomes, D.; Almeida, N.; Tomé, L. Red Cell Distribution Width and Red Cell Distribution Width to Total Serum Calcium Ratio as Major Predictors of Severity and Mortality in Acute Pancreatitis. BMC Gastroenterol. 2018, 18, 108. [Google Scholar] [CrossRef] [PubMed]
- Guglielmini, C.; Poser, H.; Pria, A.D.; Drigo, M.; Mazzotta, E.; Berlanda, M.; Luciani, A. Red Blood Cell Distribution Width in Dogs with Chronic Degenerative Valvular Disease. J. Am. Vet. Med. Assoc. 2013, 243, 858–862. [Google Scholar] [CrossRef] [PubMed]
- Swann, J.W.; Sudunagunta, S.; Covey, H.L.; English, K.; Hendricks, A.; Connolly, D.J. Evaluation of Red Cell Distribution Width in Dogs with Pulmonary Hypertension. J. Vet. Cardiol. 2014, 16, 227–235. [Google Scholar] [CrossRef]
- Mazzotta, E.; Guglielmini, C.; Menciotti, G.; Contiero, B.; Baron Toaldo, M.; Berlanda, M.; Poser, H. Red Blood Cell Distribution Width, Hematology, and Serum Biochemistry in Dogs with Echocardiographically Estimated Precapillary and Postcapillary Pulmonary Arterial Hypertension. J. Vet. Intern. Med. 2016, 30, 1806–1815. [Google Scholar] [CrossRef] [PubMed]
- Guglielmini, C.; Valentini, C.M.; Contiero, B.; Valente, C.; Poser, H. Red Cell Distribution Width Has a Negative Prognostic Role in Dogs with Myxomatous Mitral Valve Disease. Animals 2021, 11, 778. [Google Scholar] [CrossRef]
- Fish, E.J.; Hansen, S.C.; Spangler, E.A.; Gaillard, P.R.; Fan, S.; Bacek, L.M. Retrospective Evaluation of Serum/Plasma Iron, Red Blood Cell Distribution Width, and Nucleated Red Blood Cells in Dogs with Acute Trauma (2009–2015): 129 Cases. J. Vet. Emerg. Crit. Care 2019, 29, 521–527. [Google Scholar] [CrossRef] [PubMed]
- Martinez, C.; Mooney, C.T.; Shiel, R.E.; Tang, P.K.; Mooney, L.; O’Neill, E.J. Evaluation of Red Blood Cell Distribution Width in Dogs with Various Illnesses. Can. Vet. J. 2019, 60, 964–971. [Google Scholar]
- Kim, S.-J.; Suh, S.-I.; Hyun, C. Evaluation of Red Blood Cell Profiles in Dogs with Heartworm Disease. Can. J. Vet. Res. 2020, 84, 265–271. [Google Scholar]
- Ludwik, T.M.; Heinrich, D.A.; Rendahl, A.; Friedenberg, S.G. Red Cell Distribution Width Is a Predictor of All-Cause Mortality in Hospitalized Dogs. J. Vet. Emerg. Crit. Care 2021, 32, 9–17. [Google Scholar] [CrossRef]
- Pfeifer, M.E.; Prittie, J.E.; Zollo, A.M.; Weltman, J.G. Red Cell Distribution Width, Illness Severity, and All-Cause Mortality in Dogs Admitted to the ICU. J. Vet. Emerg. Crit. Care 2022, 32, 168–172. [Google Scholar] [CrossRef]
- Pierini, A.; Gori, E.; Lippi, I.; Ceccherini, G.; Lubas, G.; Marchetti, V. Neutrophil-to-Lymphocyte Ratio, Nucleated Red Blood Cells and Erythrocyte Abnormalities in Canine Systemic Inflammatory Response Syndrome. Res. Vet. Sci 2019, 126, 150–154. [Google Scholar] [CrossRef] [PubMed]
- Hodgson, N.; Llewellyn, E.A.; Schaeffer, D.J. Utility and Prognostic Significance of Neutrophil-to-Lymphocyte Ratio in Dogs with Septic Peritonitis. J. Am. Anim. Hosp. Assoc. 2018, 54, 351–359. [Google Scholar] [CrossRef] [PubMed]
- Cridge, H.; Twedt, D.C.; Marolf, A.J.; Sharkey, L.C.; Steiner, J.M. Advances in the Diagnosis of Acute Pancreatitis in Dogs. J. Vet. Intern. Med. 2021, 35, 2572–2587. [Google Scholar] [CrossRef] [PubMed]
- Moritz, A.; Fickenscher, Y.; Meyer, K.; Failing, K.; Weiss, D.J. Canine and Feline Hematology Reference Values for the ADVIA 120 Hematology System. Vet. Clin. Pathol. 2004, 33, 32–38. [Google Scholar] [CrossRef]
- Welles, E.G.; Hall, A.S.; Carpenter, D.M. Canine Complete Blood Counts: A Comparison of Four in-Office Instruments with the ADVIA 120 and Manual Differential Counts. Vet. Clin. Pathol. 2009, 38, 20–29. [Google Scholar] [CrossRef]
- Becker, M.; Moritz, A.; Giger, U. Comparative Clinical Study of Canine and Feline Total Blood Cell Count Results with Seven In-Clinic and Two Commercial Laboratory Hematology Analyzers. Vet. Clin. Pathol. 2008, 37, 373–384. [Google Scholar] [CrossRef]
- Storey, J.D. A Direct Approach to False Discovery Rates. J. R. Stat. Soc. Ser. B Stat. Methodol. 2002, 64, 479–498. [Google Scholar] [CrossRef]
- Cetinkaya, E.; Senol, K.; Saylam, B.; Tez, M. Red Cell Distribution Width to Platelet Ratio: New and Promising Prognostic Marker in Acute Pancreatitis. World J. Gastroenterol. 2014, 20, 14450–14454. [Google Scholar] [CrossRef]
- Şenol, K.; Saylam, B.; Kocaay, F.; Tez, M. Red Cell Distribution Width as a Predictor of Mortality in Acute Pancreatitis. Am. J. Emerg. Med. 2013, 31, 687–689. [Google Scholar] [CrossRef]
- Gülen, B.; Sonmez, E.; Yaylaci, S.; Serinken, M.; Eken, C.; Dur, A.; Turkdogan, F.T.; Söğüt, Ö. Effect of Harmless Acute Pancreatitis Score, Red Cell Distribution Width and Neutrophil/Lymphocyte Ratio on the Mortality of Patients with Nontraumatic Acute Pancreatitis at the Emergency Department. World J. Emerg. Med. 2015, 6, 29–33. [Google Scholar] [CrossRef]
- Lippi, G.; Targher, G.; Montagnana, M.; Salvagno, G.L.; Zoppini, G.; Guidi, G.C. Relation between Red Blood Cell Distribution Width and Inflammatory Biomarkers in a Large Cohort of Unselected Outpatients. Arch. Pathol. Lab. Med. 2009, 133, 628–632. [Google Scholar] [CrossRef] [PubMed]
- Morceau, F.; Dicato, M.; Diederich, M. Pro-Inflammatory Cytokine-Mediated Anemia: Regarding Molecular Mechanisms of Erythropoiesis. Mediat. Inflamm. 2009, 2009, 405016. [Google Scholar] [CrossRef] [PubMed]
- Han, T.; Cheng, T.; Liao, Y.; He, Y.; Liu, B.; Lai, Q.; Pan, P.; Liu, J.; Cao, Y.; Yu, H. The Ratio of Red Blood Cell Distribution Width to Serum Calcium Predicts Severity of Patients with Acute Pancreatitis. Am. J. Emerg. Med. 2022, 53, 190–195. [Google Scholar] [CrossRef] [PubMed]
- Holowaychuk, M.K. Hypocalcemia of Critical Illness in Dogs and Cats. Vet. Clin. N. Am. Small Anim. Pract. 2013, 43, 1299–1317, vi–vii. [Google Scholar] [CrossRef]
- Lippi, G.; Pavesi, F.; Bardi, M.; Pipitone, S. Lack of Harmonization of Red Blood Cell Distribution Width (RDW). Evaluation of Four Hematological Analyzers. Clin. Biochem. 2014, 47, 1100–1103. [Google Scholar] [CrossRef]
- Rejec, A.; Butinar, J.; Gawor, J.; Petelin, M. Evaluation of Complete Blood Count Indices (NLR, PLR, MPV/PLT, and PLCRi) in Healthy Dogs, Dogs With Periodontitis, and Dogs With Oropharyngeal Tumors as Potential Biomarkers of Systemic Inflammatory Response. J. Vet. Dent. 2017, 34, 231–240. [Google Scholar] [CrossRef]
- Jeon, T.J.; Park, J.Y. Clinical Significance of the Neutrophil-Lymphocyte Ratio as an Early Predictive Marker for Adverse Outcomes in Patients with Acute Pancreatitis. World J. Gastroenterol. 2017, 23, 3883–3889. [Google Scholar] [CrossRef]
- Jenne, C.N.; Kubes, P. Platelets in Inflammation and Infection. Platelets 2015, 26, 286–292. [Google Scholar] [CrossRef]
- Zimmerman, M.K.; Friesen, L.R.; Nice, A.; Vollmer, P.A.; Dockery, E.A.; Rankin, J.D.; Zmuda, K.; Wong, S.H. Multi-Center Evaluation of Analytical Performance of the Beckman Coulter AU5822 Chemistry Analyzer. Clin. Biochem. 2015, 48, 881–885. [Google Scholar] [CrossRef]
- Mansfield, C.; Beths, T. Management of Acute Pancreatitis in Dogs: A Critical Appraisal with Focus on Feeding and Analgesia. J. Small Anim. Pract. 2015, 56, 27–39. [Google Scholar] [CrossRef]


| Variable | Total Cohort (n = 70) | Non-Survivors (n = 19) | Survivors (n = 51) | p Value |
|---|---|---|---|---|
| Age (years) | 10 ± 4 | 10 ± 4 | 10 ± 4 | 0.98 |
| Weight (kg) | 14 ± 11 | 11 ± 5 | 15 ±12 | 0.11 |
| Sex (F/M) | 48/22 | 14/5 | 34/16 | 0.79 |
| Purebred (%) | 27 (53%) | 7 (37%) | 30 (59%) | 0.17 |
| Concurrent diseases (%) | 48 (69%) | 15 (79%) | 33 (65%) | 0.39 |
| Previous treatment (%) | 35 (50%) | 12 (63%) | 23 (45%) | 0.28 |
| CRP (mg/dL) | 4.9 (0.0–55.4) | 3.8 (0.0–36.7) | 5.7 (0.3–55.4) | 0.44 |
| BUN (mg/dL) | 42 (15–734) | 66 (17–734) | 39 (15–267) | 0.02 |
| Creatinine (mg/dL) | 1.0 (0.4–14.3) | 1.0 (0.4–14.3) | 1.0 (0.5–7.5) | 0.27 |
| Total protein (g/L) | 64.9 (34.9–98.0) | 68.0 (34.9–90.0) | 64.6 (38.2–98.0) | 0.48 |
| Albumin (g/L) | 29.2 (8.2–39.0) | 29.9 (8.2–39.0) | 27.3 (18.7–37.6) | 0.14 |
| Bilirubin (mg/dL) | 0.20 (0.01–3.20) | 0.30 (0.01–3.20) | 0.2 (0.1–1.2) | 0.05 |
| Cholesterol (mg/dL) | 280 (108–779) | 277 (147–779) | 285 (109–663) | 0.59 |
| Triglycerides (mg/dL) | 95 (28–1090) | 95 (33–1090) | 98 (28–704) | 0.43 |
| Calcium (mg/dL) | 9.7 (7.0–13.7) | 9.6 (7.0–13.7) | 9.7 (8.0–11.6) | 0.90 |
| Phosphate (mg/dL) | 4.7 (2.2–29.0) | 5.3 (2.9–29.0) | 4.5 (2.2–15.2) | 0.17 |
| Glucose (mg/dL) | 97 (11–893) | 100 (11–618) | 96 (37–893) | 0.89 |
| ALT (U/L) | 93.5 (11–11463) | 107 (19–1988) | 86 (11–11463) | 0.23 |
| SAP (U/L) | 401 (18–10664) | 410 (18–10246) | 399 (26–10664) | 0.23 |
| RBC (106/μL) | 6.3 (2.6–10.3) | 6.2 (3.6–10.3) | 6.6 (3.9–8.8) | 0.02 |
| Hemoglobin (g/dL) | 15.0 (8.1–24.7) | 14.9 (8.1–24.7) | 15.0 (8.6–22.0) | 0.19 |
| Hematocrit (%) | 42.7 (23.8–61.9) | 42.1 (24.0–61.9) | 43.3 (23.8–61.8) | 0.08 |
| MCV (fL) | 68.5 (54.3–81.0) | 69.8 (54.3–81.0) | 67.2 (56.1–80.0) | 0.07 |
| WBC (103/μL) | 15.3 (4.5–56.3) | 16.7 (5.0–56.3) | 13.1 (4.5–41.3) | 0.53 |
| Neutrophils (103/μL) | 12.3 (2.9–42.8) | 13.9 (3.0–42.8) | 10.2 (2.9–33.8) | 0.56 |
| Lymphocytes (103/μL) | 1.2 (0.3–5.6) | 1.1 (0.3–5.6) | 1.4 (0.3–4.6) | 0.59 |
| N/L | 8.6 (2.6–52.3) | 9.4 (2.6–52.2) | 8.2 (2.9–39.4) | 0.22 |
| RDW (%) | 13.1 (10.9–20.8) | 14.2 (11.9–20.8) | 12.5 (10.9–19.8) | 0.01 |
| RDW/Ca | 1.3 (1.1–2.4) | 1.4 (1.1–2.4) | 1.3 (1.1–2.2) | 0.03 |
| Platelets (103/μL) | 310 (34–777) | 414 (34–742) | 266 (106–777) | 0.96 |
| MPV (fL) | 11.7 (8.5–25.9) | 11.8 (8.9–24.4) | 11.7 (8.5–25.9) | 0.29 |
| P/L | 270 (13–1227) | 325 (13–833) | 234 (38.7–1227) | 0.53 |
| Variable | RDW | p Value | RDW/Ca | p Value | N/L | p Value | P/L | p Value |
|---|---|---|---|---|---|---|---|---|
| CRP (mg/dL) | −0.202 | 0.10 | −0.122 | 0.33 | 0.102 | 0.41 | −0.079 | 0.52 |
| BUN (mg/dL) | 0.172 | 0.16 | 0.003 | 0.98 | 0.024 | 0.84 | 0.110 | 0.37 |
| Creatinine (mg/dL) | 0.156 | 0.20 | −0.132 | 0.28 | 0.018 | 0.89 | 0.044 | 0.72 |
| Protein (g/L) | 0.176 | 0.14 | −0.124 | 0.31 | 0.158 | 0.19 | 0.330 | 0.01 |
| Albumin (g/L) | −0.028 | 0.82 | −0.207 | 0.09 | 0.050 | 0.68 | 0.304 | 0.01 |
| Bilirubin (mg/dL) | 0.038 | 0.75 | −0.006 | 0.96 | 0.074 | 0.54 | 0.085 | 0.48 |
| Cholesterol (mg/dL) | 0.010 | 0.93 | −0.121 | 0.33 | 0.245 | 0.04 | 0.346 | <0.01 |
| Triglycerides (mg/dL) | −0.083 | 0.51 | −0.147 | 0.25 | 0.261 | 0.04 | 0.064 | 0.61 |
| Calcium (mg/dL) | 0.061 | 0.62 | −0.658 | <0.01 | −0.021 | 0.87 | 0.015 | 0.90 |
| Phosphate (mg/dL) | 0.305 | 0.01 | 0.054 | 0.66 | 0.229 | 0.06 | 0.117 | 0.34 |
| Glucose (mg/dL) | −0.254 | 0.04 | −0.098 | 0.43 | 0.028 | 0.82 | 0.288 | 0.02 |
| ALT (U/L) | 0.085 | 0.48 | −0.056 | 0.65 | 0.211 | 0.08 | 0.047 | 0.70 |
| SAP (U/L) | 0.264 | 0.03 | 0.160 | 0.19 | 0.347 | <0.01 | 0.268 | 0.03 |
| RBC (106/μL) | −0.225 | 0.05 | −0.158 | 0.20 | 0.055 | 0.65 | 0.008 | 0.95 |
| Hemoglobin (g/dL) | −0.217 | 0.07 | −0.211 | 0.09 | 0.064 | 0.60 | 0.054 | 0.66 |
| Hematocrit (%) | −0.256 | 0.03 | −0.178 | 0.15 | 0.075 | 0.54 | 0.056 | 0.65 |
| MCV (fL) | −0.027 | 0.82 | −0.019 | 0.89 | 0.008 | 0.95 | 0.195 | 0.11 |
| WBC (103/μL) | 0.358 | <0.01 | 0.268 | 0.03 | 0.471 | <0.01 | −0.023 | 0.85 |
| Neutrophils (103/μL) | 0.352 | <0.01 | 0.258 | 0.03 | 0.558 | <0.01 | 0.016 | 0.89 |
| Lymphocytes (103/μL) | 0.021 | 0.86 | 0.022 | 0.86 | −0.516 | <0.01 | −0.542 | <0.01 |
| Platelet (103/μL) | 0.085 | 0.49 | 0.080 | 0.52 | 0.173 | 0.15 | 0.775 | <0.01 |
| MPV (fL) | 0.255 | 0.03 | 0.284 | 0.02 | −0.109 | 0.35 | −0.405 | <0.01 |
| RDW (%) | NA | NA | 0.650 | <0.01 | 0.256 | 0.03 | 0.035 | 0.77 |
| RDW/Ca | 0.650 | <0.01 | NA | NA | 0.171 | 0.16 | 0.049 | 0.69 |
| N/L | 0.256 | 0.03 | 0.171 | 0.16 | NA | NA | 0.467 | <0.01 |
| P/L | 0.035 | 0.77 | 0.049 | 0.69 | 0.467 | <0.01 | NA | NA |
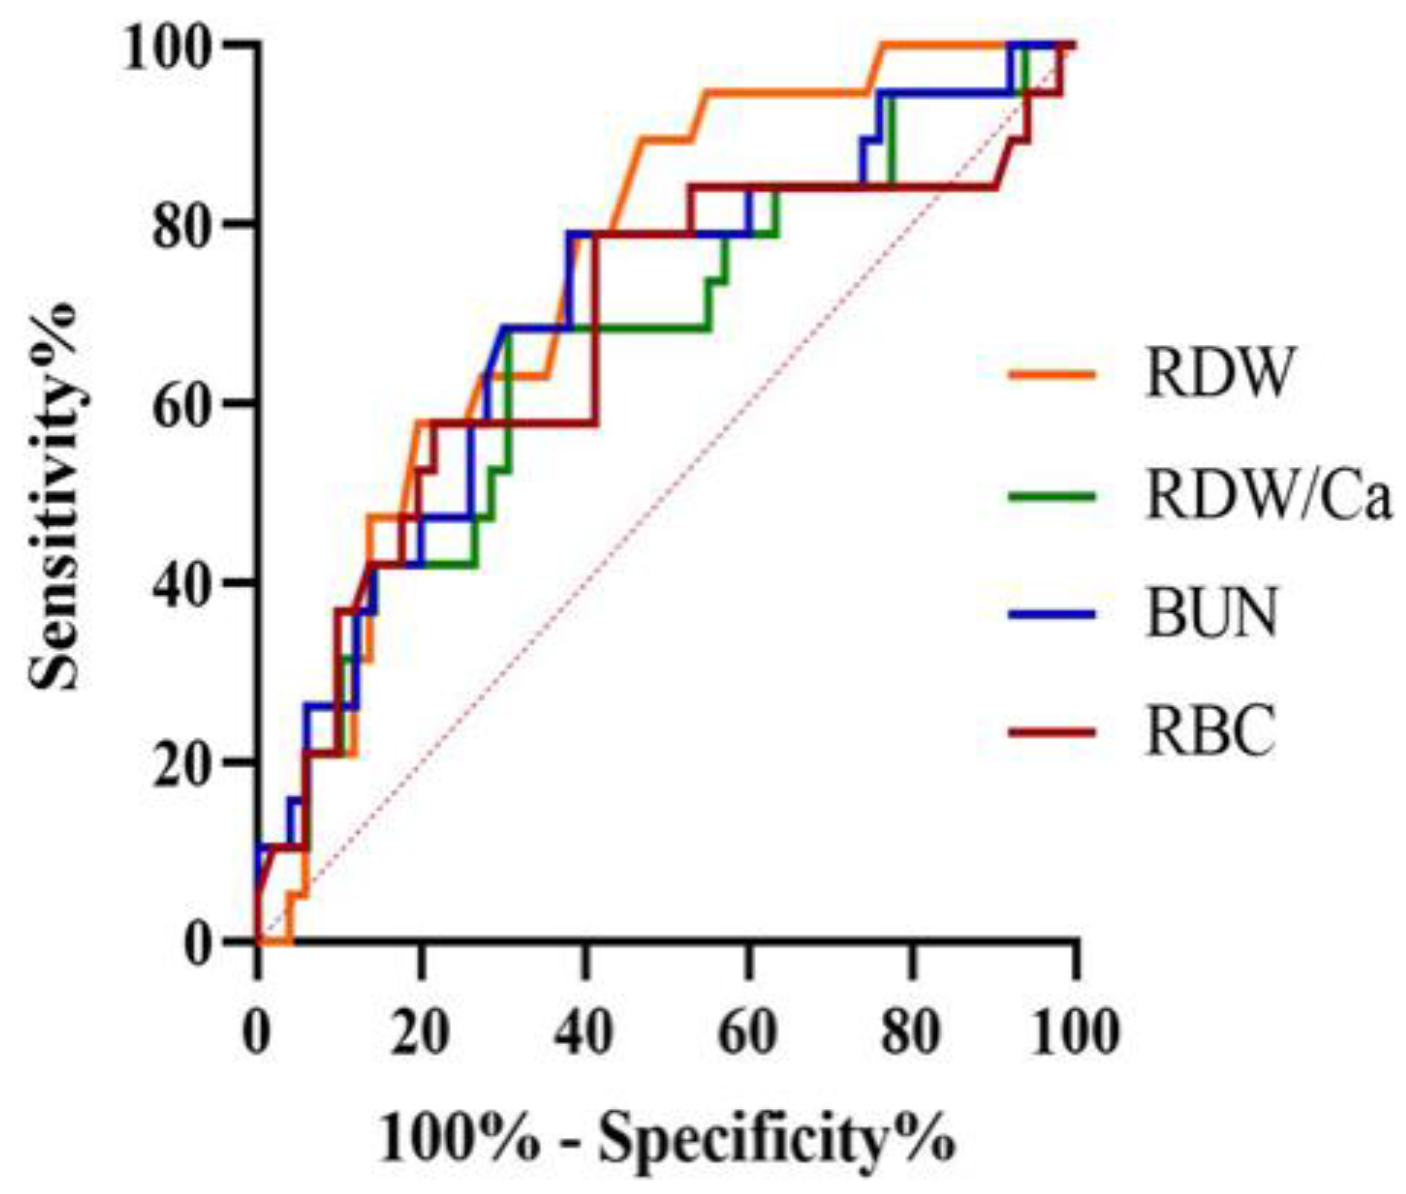
| Variable | AUC (95% CI) | p Value | Cut-Off | Sensitivity (95% CI) | Specificity (95% CI) |
|---|---|---|---|---|---|
| RDW (%) | 0.74 (0.63–0.84) | <0.01 | >12.7 | 89 (67–99) | 53 (39–67) |
| RDW/Ca | 0.67 (0.54–0.78) | 0.03 | >1.4 | 68 (43–87) | 69 (55–82) |
| BUN (mg/dL) | 0.70 (0.58–0.81) | <0.01 | >42 | 79 (54–94) | 62 (47–75) |
| RBC (106/μL) | 0.68 (0.55–0.78) | 0.03 | ≤6.3 | 79 (54–94) | 59 (44–72) |
| Variable | Hazard Ratio | 95% CI | Chi-Square | p Value | Q Value |
|---|---|---|---|---|---|
| BUN (mg/dL) | 1.00 | 1.00–1.01 | 10.57 | <0.01 | 0.01 |
| Creatinine (mg/dL) | 1.15 | 1.03–1.28 | 6.54 | 0.01 | 0.053 |
| Bilirubin (mg/dL) | 2.70 | 1.56–4.69 | 12.45 | <0.01 | <0.01 |
| Phosphate (mg/dL) | 1.10 | 1.03–1.17 | 7.76 | <0.01 | 0.03 |
| SAP (U/L) | 1.00 | 1.00–1.00 | 4.66 | 0.03 | 0.078 |
| RBC (106/μL) | 0.68 | 0.50–0.97 | 4.62 | 0.03 | 0.078 |
| RDW (%) | 1.22 | 1.04–1.43 | 6.09 | 0.01 | 0.054 |
| RDW/Ca | 4.49 | 1.27–15.89 | 5.43 | 0.02 | 0.065 |
| RDW > 12.7% | 7.14 | 1.65–30.93 | 6.90 | <0.01 | 0.04 |
| RDW/Ca > 1.4 | 3.75 | 1.42–9.90 | 7.14 | <0.01 | 0.04 |
| Predictors | Hazard Ratio | 95% CI | Chi-Square | p Value |
|---|---|---|---|---|
| Bilirubin (mg/dL) | 2.46 | 1.38–4.39 | 9.31 | <0.01 |
| BUN (mg/dL) | 1.00 | 1.00–1.01 | 9.48 | <0.01 |
| RDW > 12.7% | 5.08 | 1.14–22.67 | 4.52 | 0.03 |
Publisher’s Note: MDPI stays neutral with regard to jurisdictional claims in published maps and institutional affiliations. |
© 2022 by the authors. Licensee MDPI, Basel, Switzerland. This article is an open access article distributed under the terms and conditions of the Creative Commons Attribution (CC BY) license (https://creativecommons.org/licenses/by/4.0/).
Share and Cite
Guglielmini, C.; Crisi, P.E.; Tardo, A.M.; Di Maggio, R.; Contiero, B.; Boari, A.; Fracassi, F.; Miglio, A. Prognostic Role of Red Cell Distribution Width and Other Routine Clinico-Pathological Parameters in Dogs with Acute Pancreatitis. Animals 2022, 12, 3483. https://doi.org/10.3390/ani12243483
Guglielmini C, Crisi PE, Tardo AM, Di Maggio R, Contiero B, Boari A, Fracassi F, Miglio A. Prognostic Role of Red Cell Distribution Width and Other Routine Clinico-Pathological Parameters in Dogs with Acute Pancreatitis. Animals. 2022; 12(24):3483. https://doi.org/10.3390/ani12243483
Chicago/Turabian StyleGuglielmini, Carlo, Paolo Emidio Crisi, Antonio Maria Tardo, Roberta Di Maggio, Barbara Contiero, Andrea Boari, Federico Fracassi, and Arianna Miglio. 2022. "Prognostic Role of Red Cell Distribution Width and Other Routine Clinico-Pathological Parameters in Dogs with Acute Pancreatitis" Animals 12, no. 24: 3483. https://doi.org/10.3390/ani12243483
APA StyleGuglielmini, C., Crisi, P. E., Tardo, A. M., Di Maggio, R., Contiero, B., Boari, A., Fracassi, F., & Miglio, A. (2022). Prognostic Role of Red Cell Distribution Width and Other Routine Clinico-Pathological Parameters in Dogs with Acute Pancreatitis. Animals, 12(24), 3483. https://doi.org/10.3390/ani12243483