
Genomic Evidence for Rare Hybridization and Large Demographic Changes in the Evolutionary Histories of Four North American Dove Species


Abstract
:Simple Summary
Abstract
1. Introduction
2. Materials and Methods
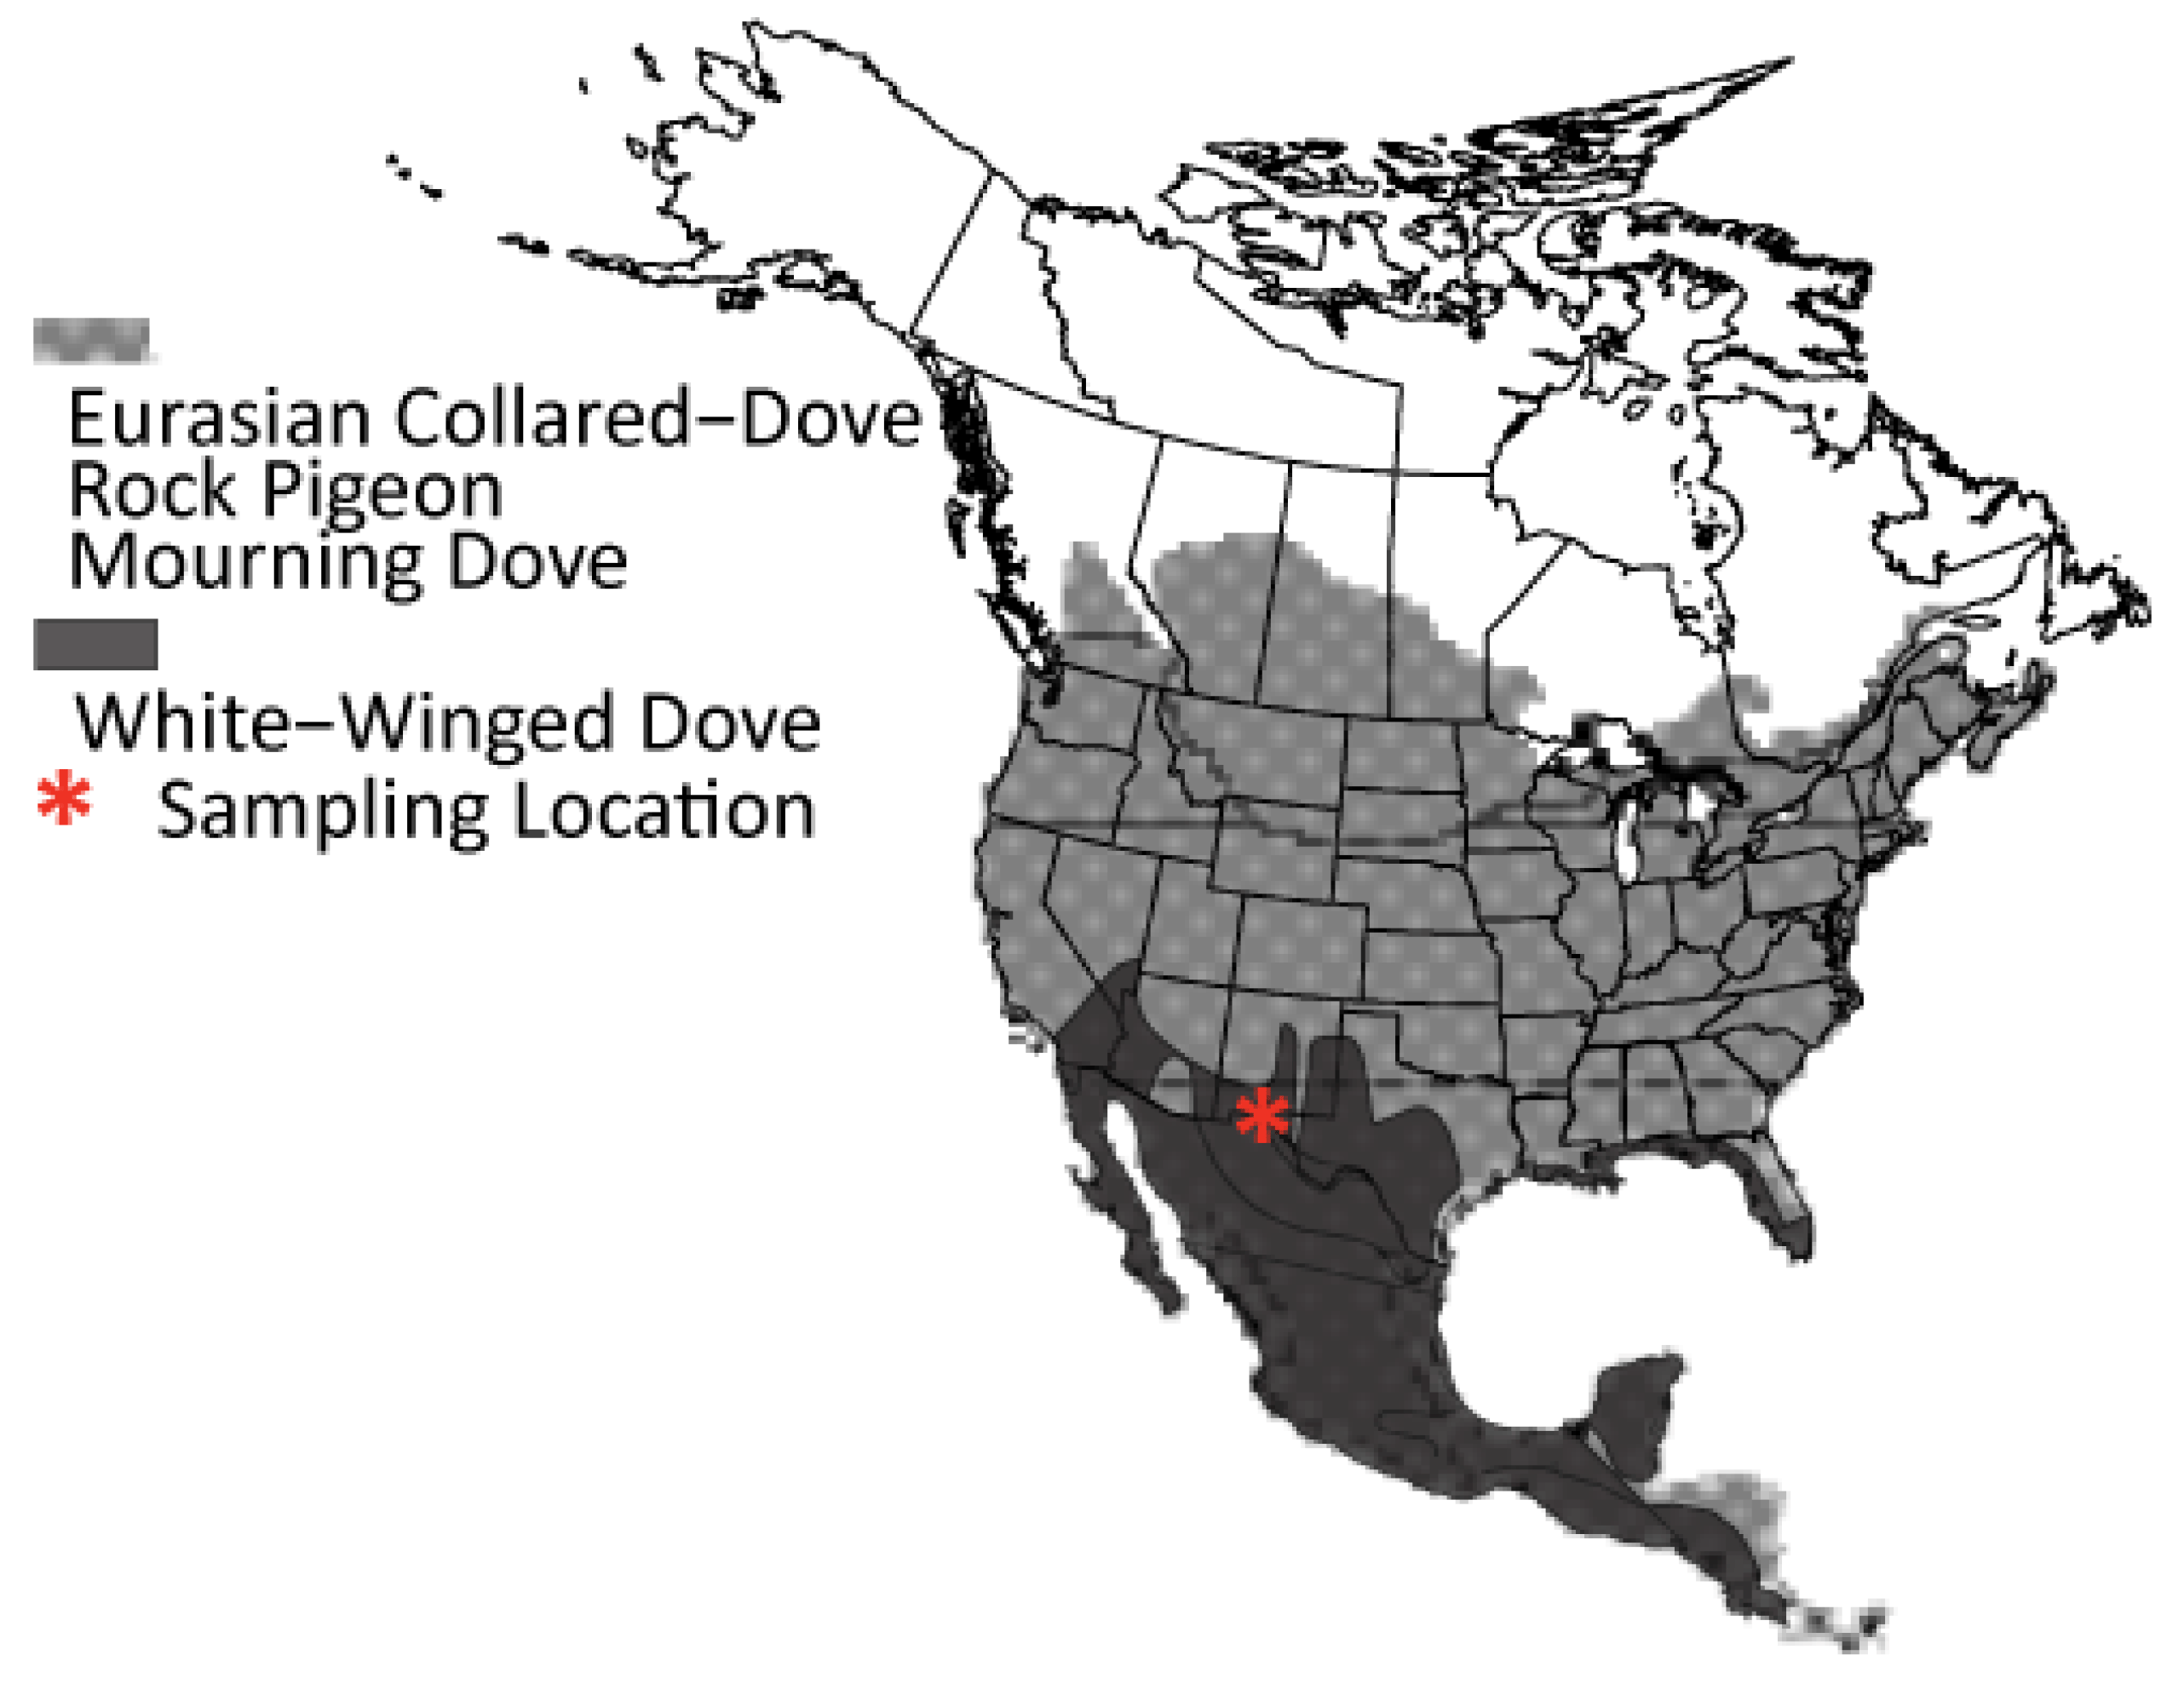
2.1. Sampling and DNA Extraction
2.2. Mitochondrial DNA
2.3. ddRAD-Seq Library Preparation
2.4. Bioinformatics of ddRAD-Seq Data
2.5. Phylogenetic Analyses
2.6. Population Structure & Diversity Statistics
2.7. Effective Population Size, Divergence Time, and Migration Rates
2.8. Historical Population Demography through Time
3. Results
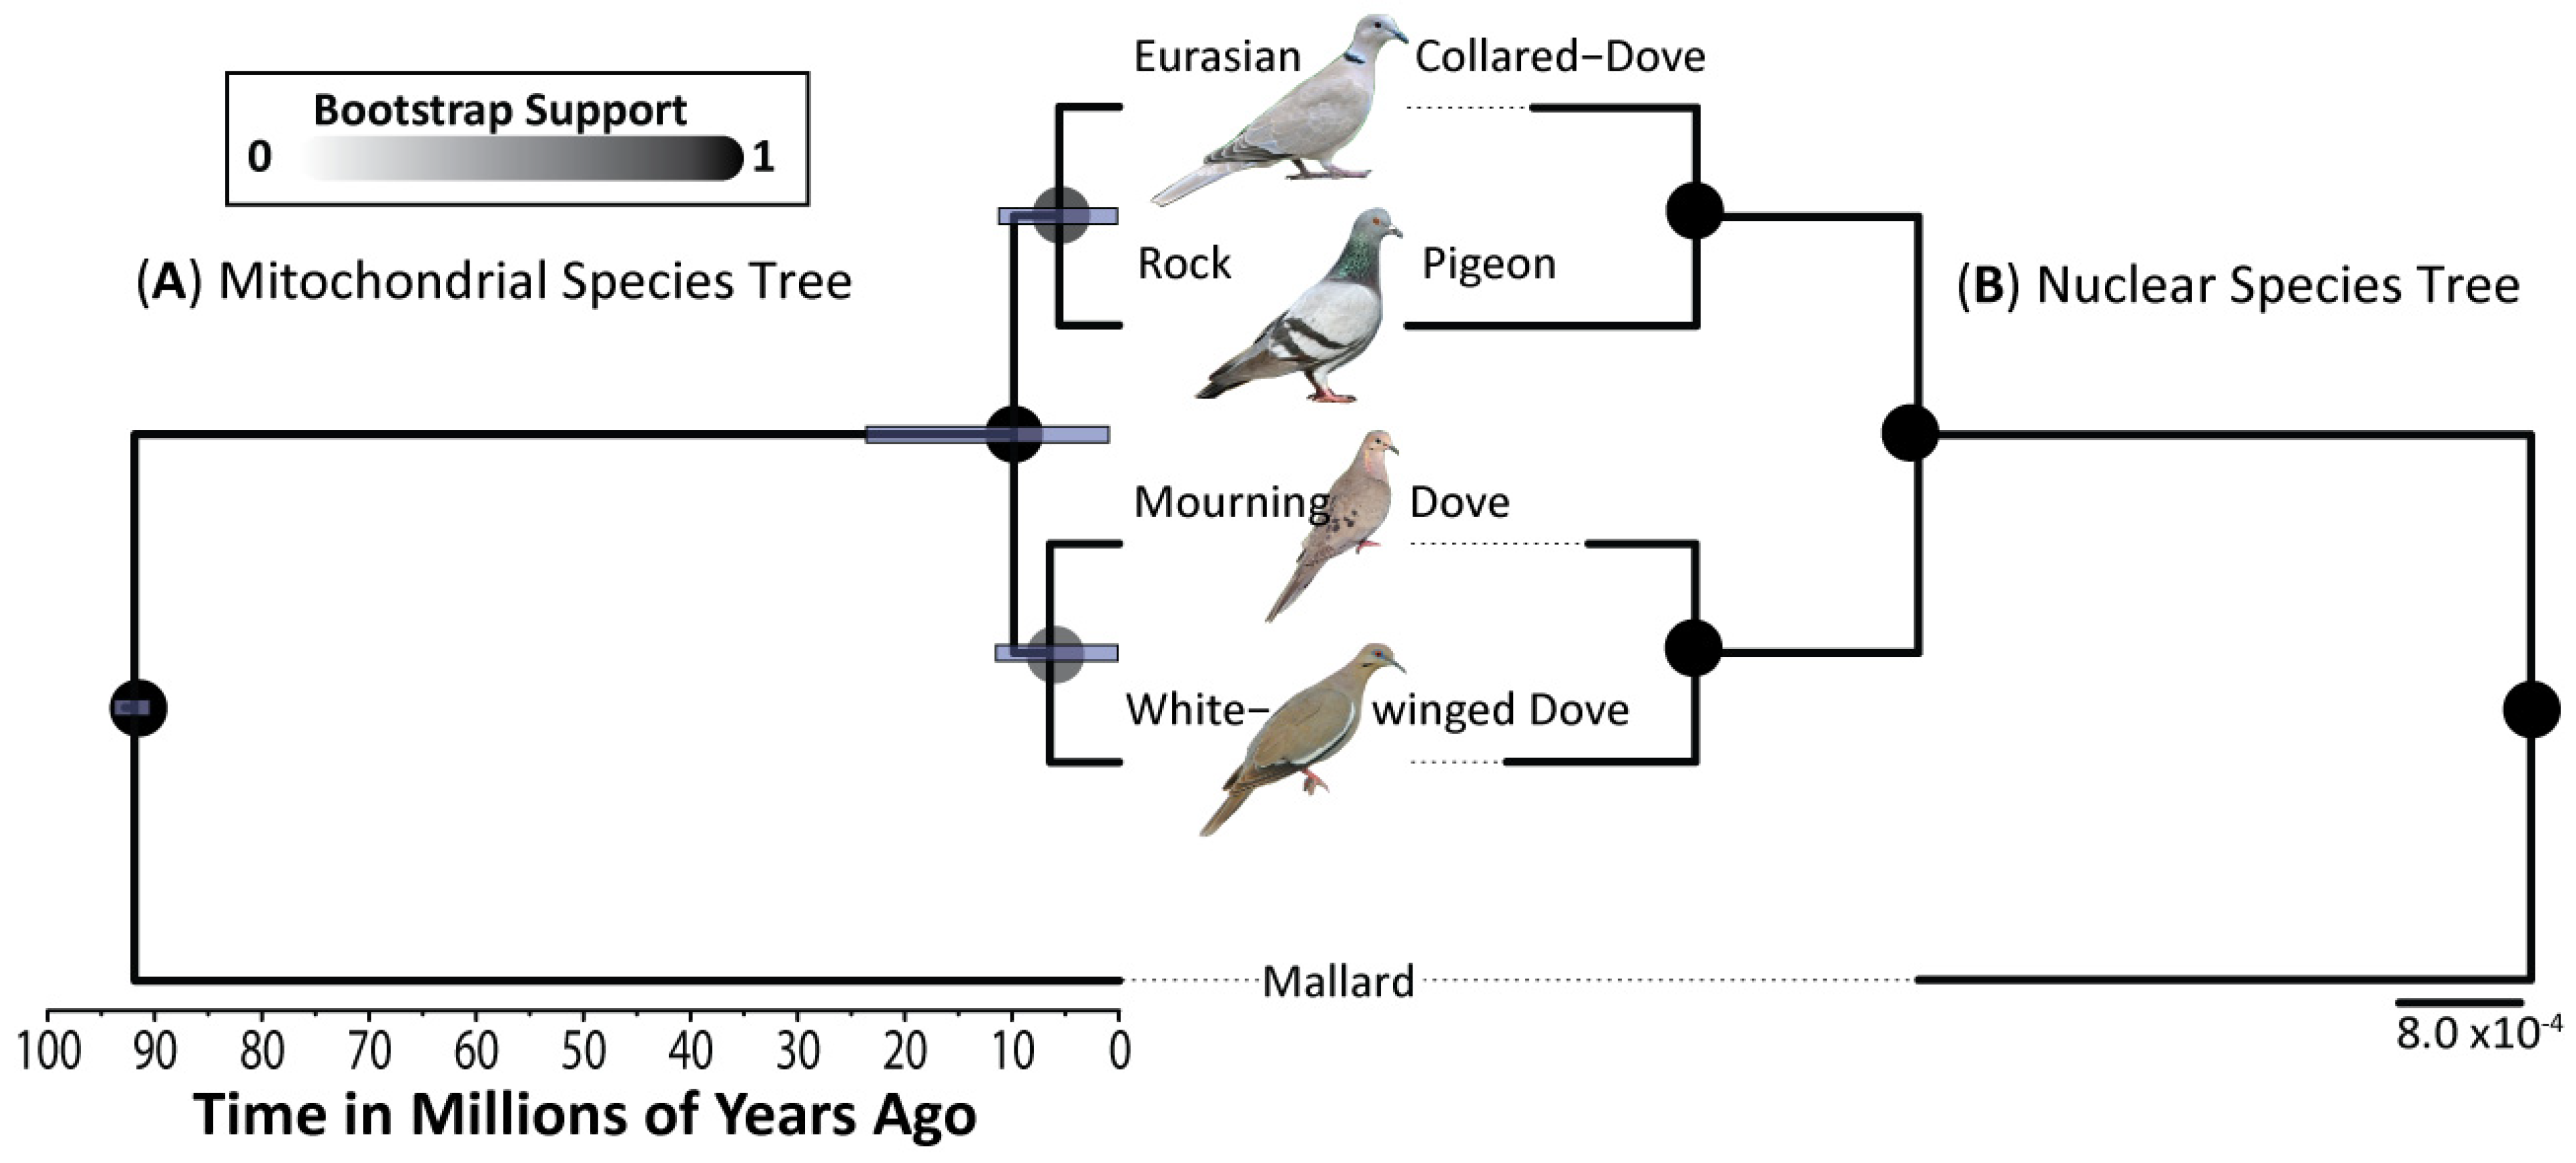
3.1. Phylogenetics
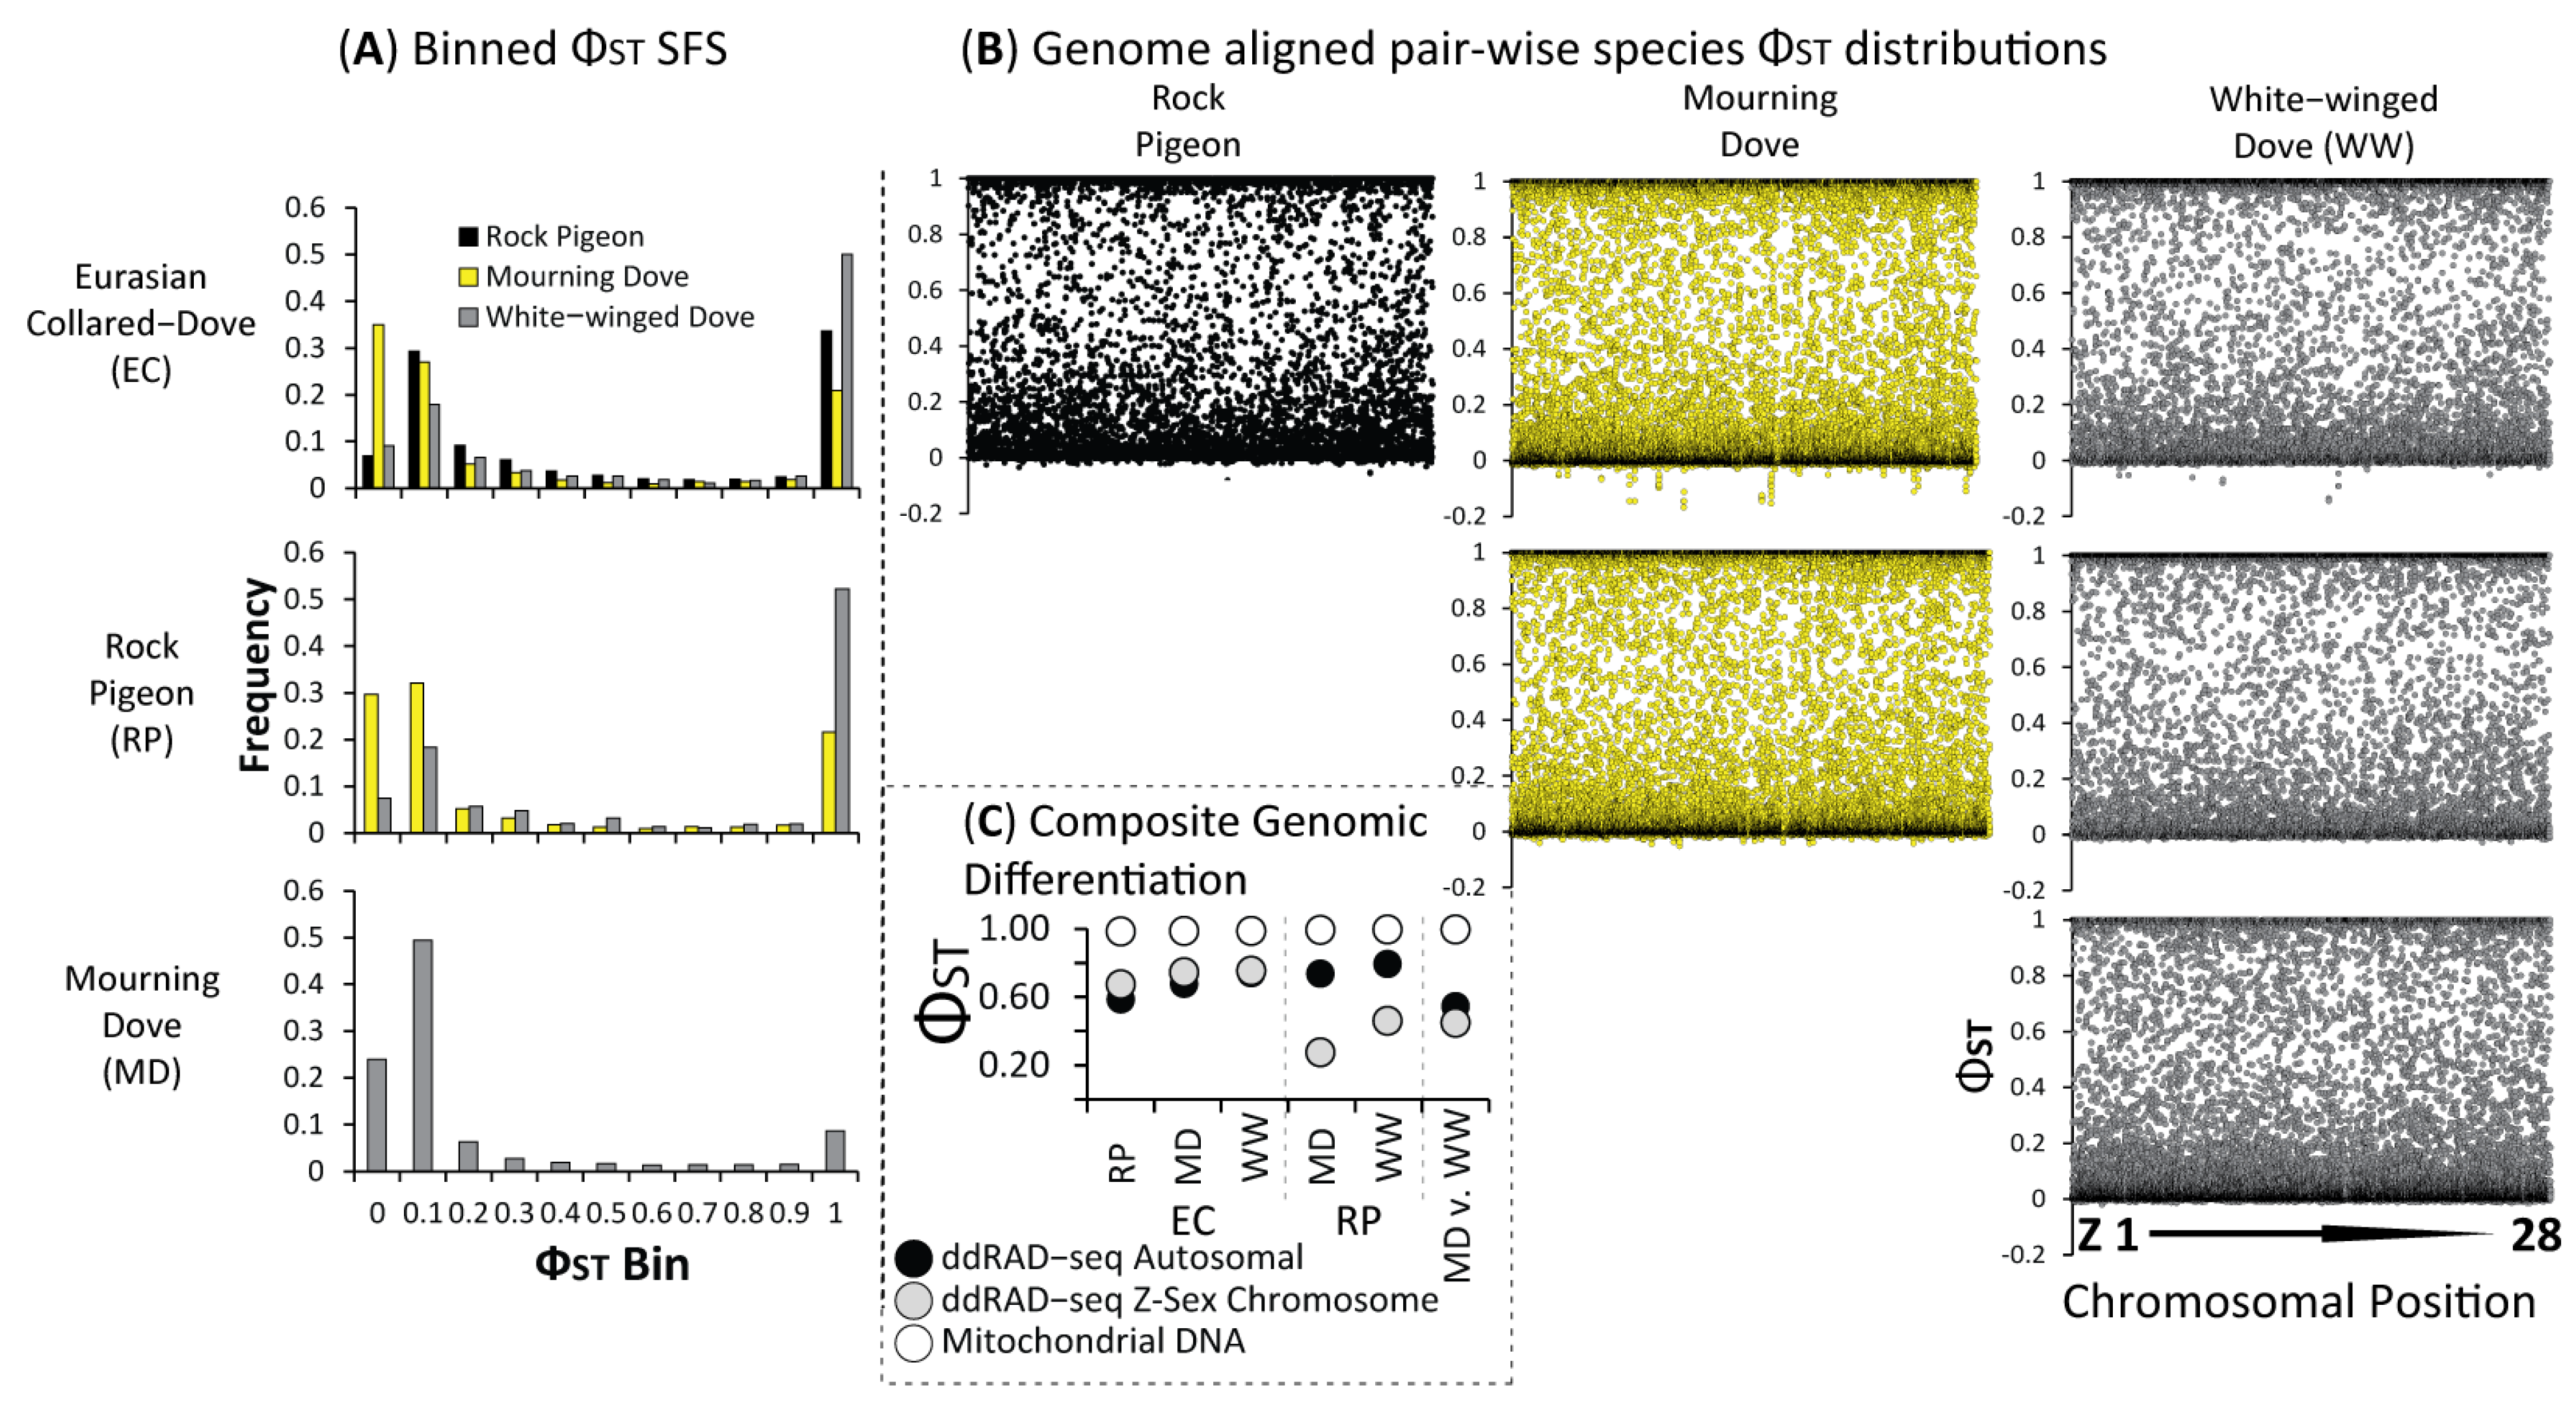
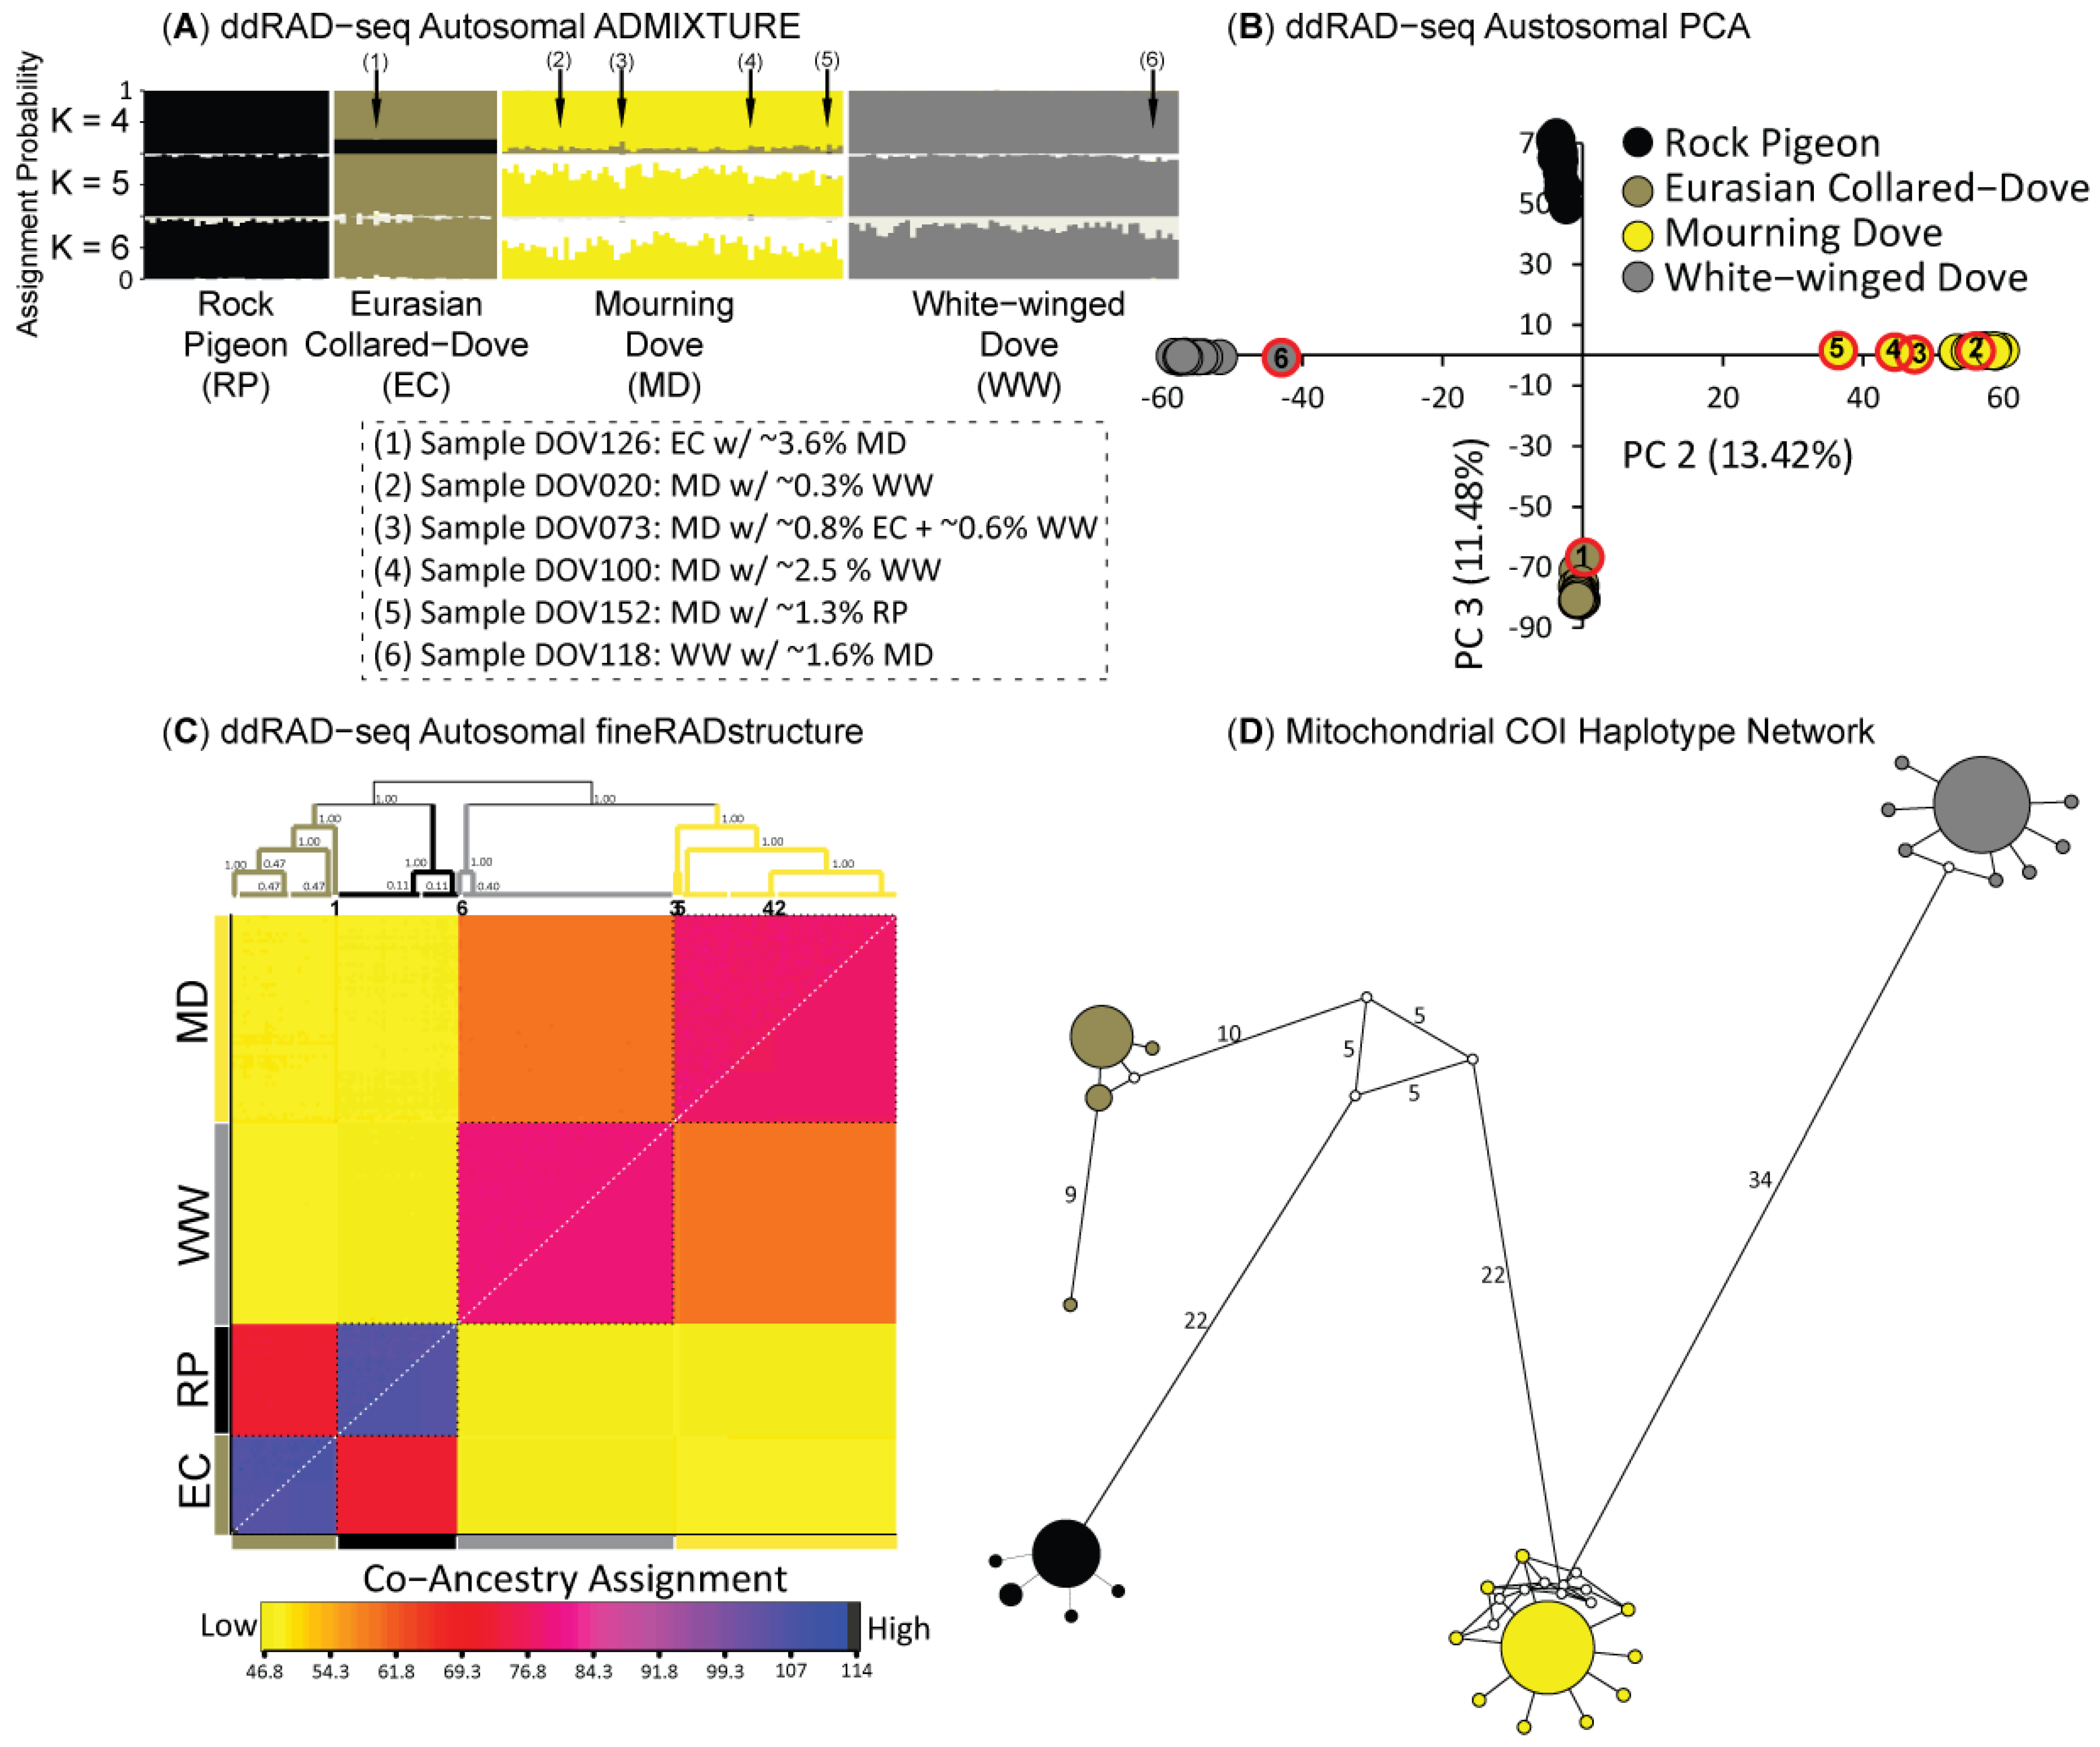
3.2. Population Structure & Recent Hybridization
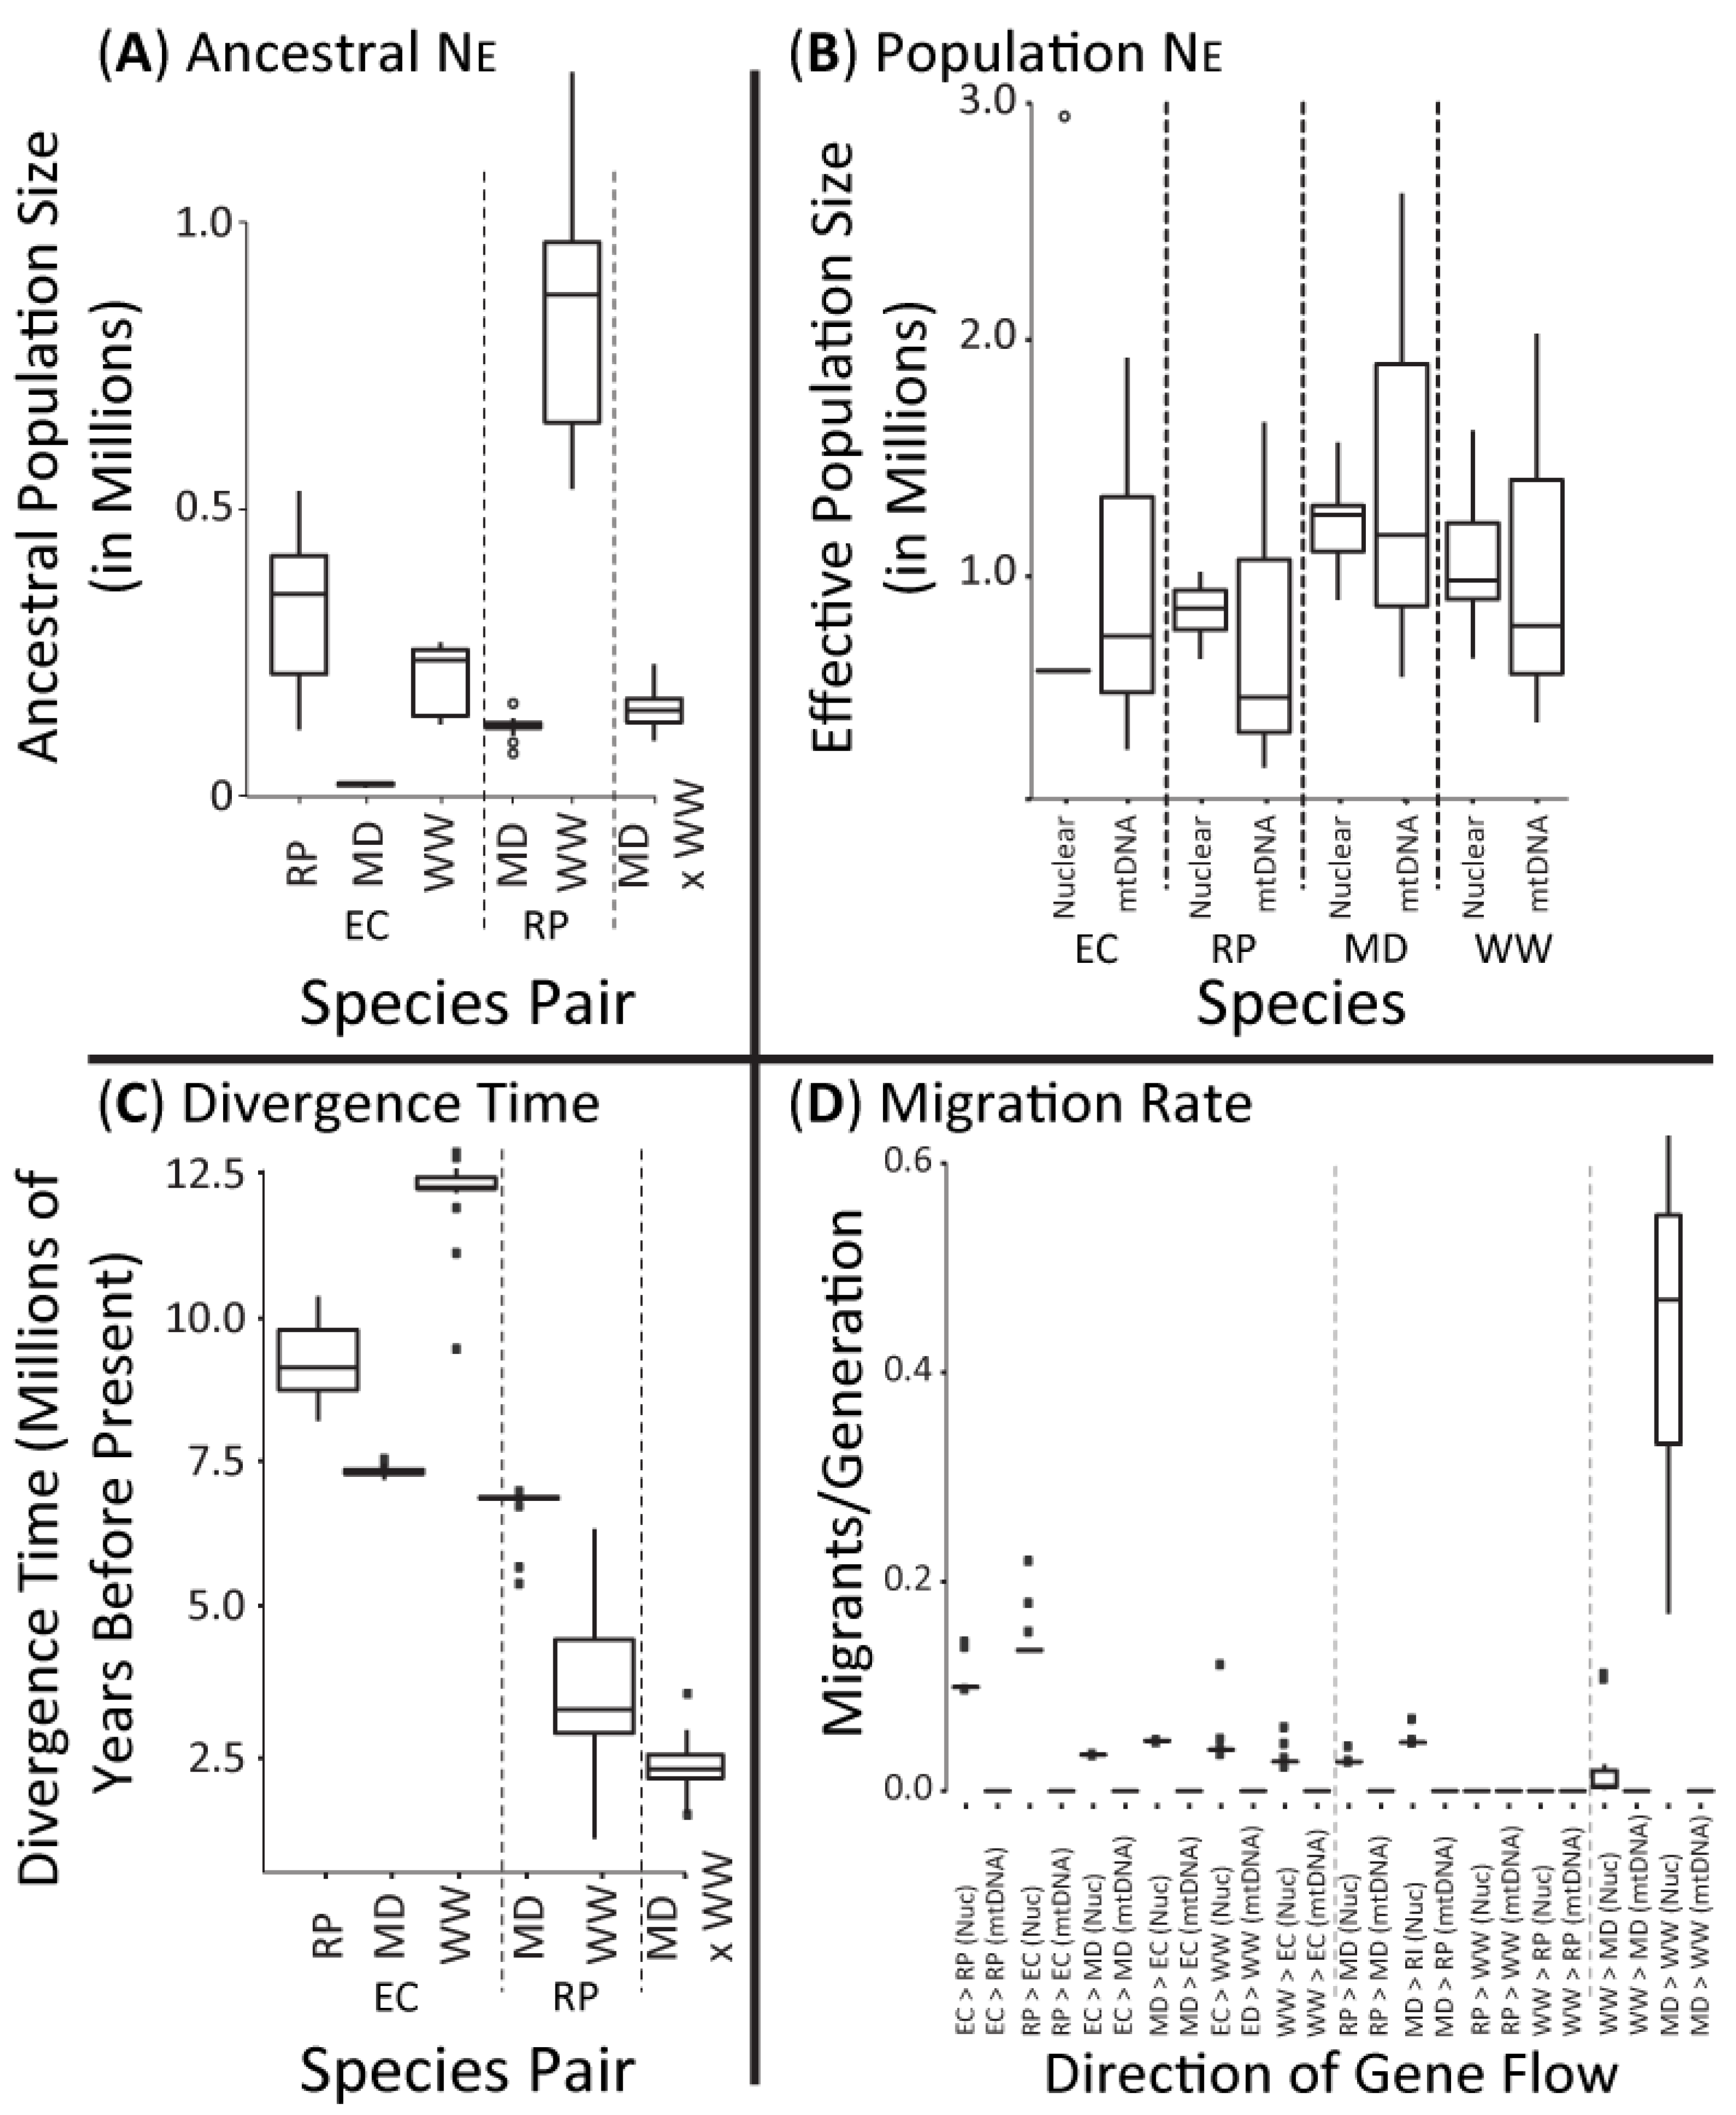
3.3. Optimum Evolutionary Models and Estimated Parameters
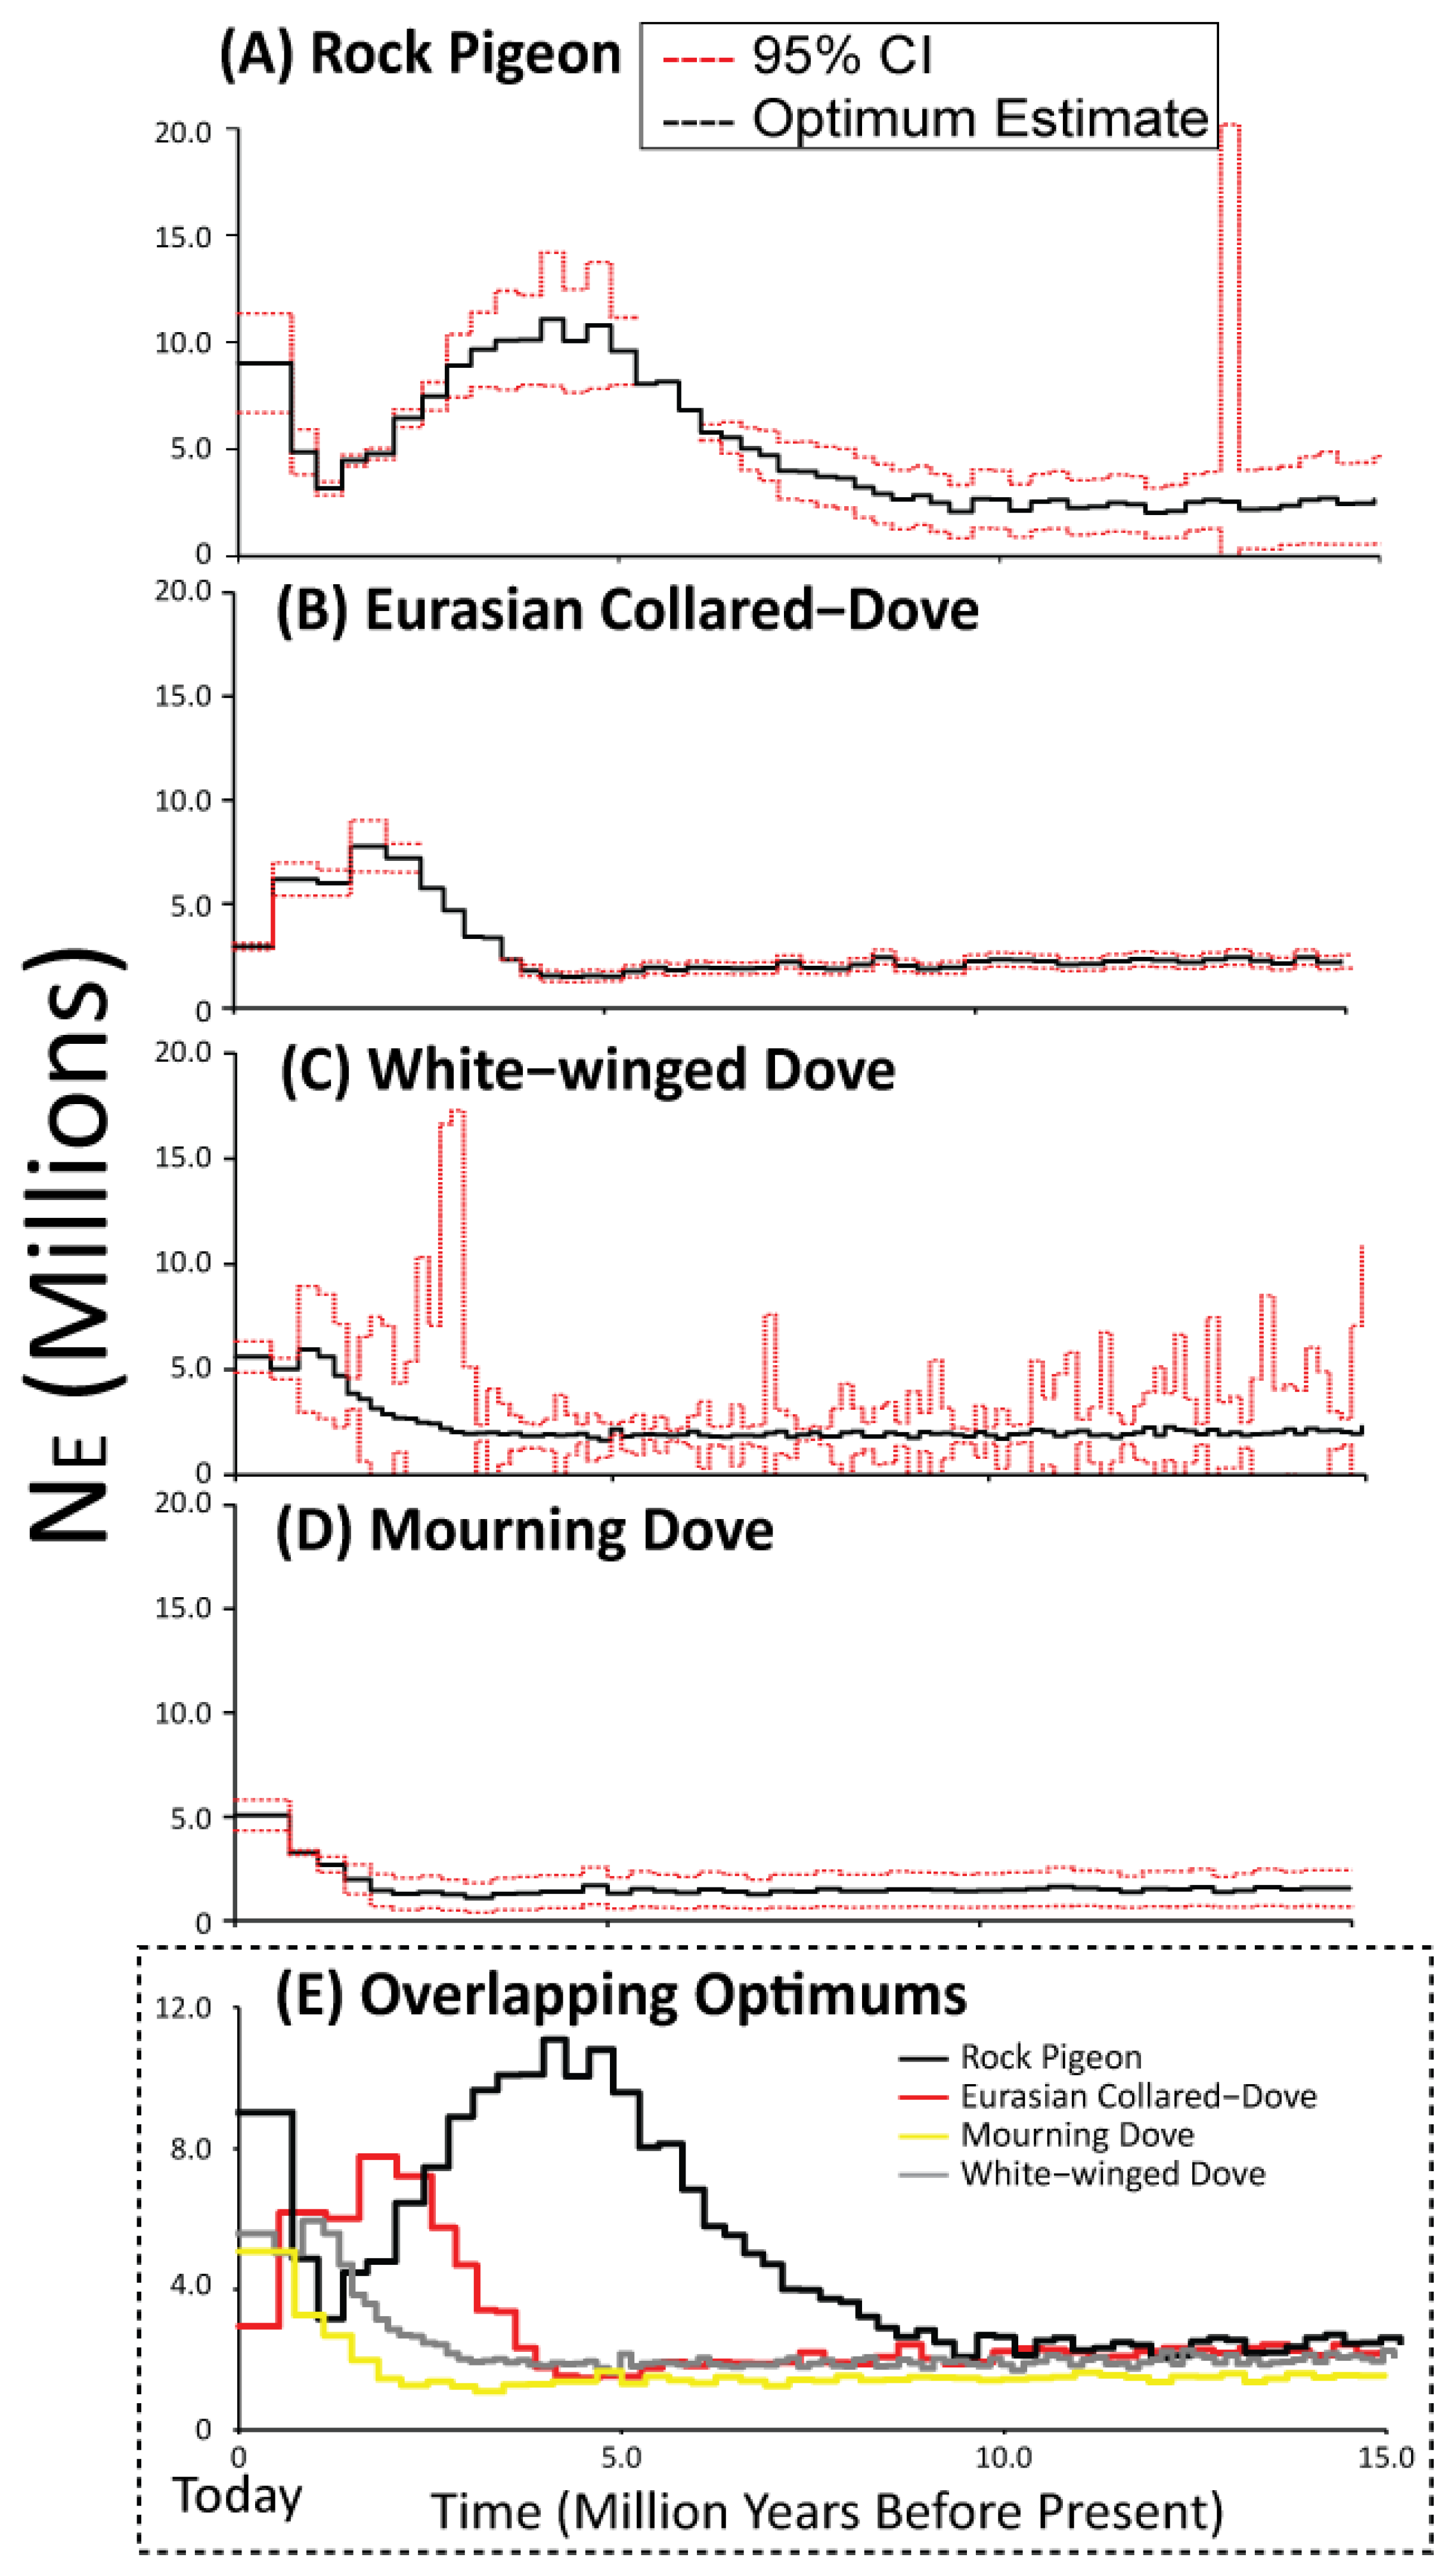
3.4. Historical Population Sizes
4. Discussion
4.1. Largely Allopatric Evolutionary Histories Lead to Highly Divergent Genomes among Four Dove Species
4.2. Limited Anthropogenic Gene Flow Today among Four Dove Species
4.3. Demographic Histories Differentially Impact the Genomes of the Four Dove Species
5. Conclusions
Supplementary Materials
Author Contributions
Funding
Institutional Review Board Statement
Informed Consent Statement
Data Availability Statement
Acknowledgments
Conflicts of Interest
References
- Buckley, Y.M.; Catford, J. Does the biogeographic origin of species matter? Ecological effects of native and non-native species and the use of origin to guide management. J. Ecol. 2016, 104, 4–17. [Google Scholar] [CrossRef] [Green Version]
- Hulme, P.E. Invasion pathways at a crossroad: Policy and research challenges for managing alien species introductions. J. Appl. Ecol. 2015, 52, 1418–1424. [Google Scholar] [CrossRef]
- Tabak, M.A.; Piaggio, A.J.; Miller, R.S.; Sweitzer, R.A.; Ernest, H.B. Anthropogenic factors predict movement of an invasive species. Ecosphere 2017, 8, e01844. [Google Scholar] [CrossRef] [Green Version]
- Vallin, N.; Rice, A.M.; Arntsen, H.; Kulma, K.; Qvarnström, A. Combined effects of interspecific competition and hybridization impede local coexistence of Ficedula flycatchers. Evol. Ecol. 2012, 927–942. [Google Scholar] [CrossRef]
- Hedrick, P.W. Adaptive introgression in animals: Examples and comparison to new mutation and standing variation as sources of adaptive variation. Mol. Ecol. 2013, 22, 4606–4618. [Google Scholar] [CrossRef] [PubMed]
- Valencia-Montoya, W.A.; Elfekih, S.; North, H.L.; Meier, J.I.; Warren, I.A.; Tay, W.T.; Gordon, K.H.J.; Specht, A.; Paula-Moraes, S.V.; Rane, R.; et al. Adaptive introgression across semipermeable species boundaries between local helicoverpa zea and invasive helicoverpa armigera moths. Mol. Biol. Evol. 2020, 37, 2568–2583. [Google Scholar] [CrossRef] [PubMed]
- Rhymer, J.M.; Simberloff, D. Extinction by hybridization and intrgression. Annu. Rev. Ecol. Syst. 1996, 27, 83–109. [Google Scholar] [CrossRef]
- Todesco, M.; Pascual, M.A.; Owens, G.L.; Ostevik, K.L.; Moyers, B.T.; Hübner, S.; Heredia, S.M.; Hahn, M.A.; Caseys, C.; Bock, D.G.; et al. Hybridization and extinction. Evol. Appl. 2016, 9, 892–908. [Google Scholar] [CrossRef]
- Huxel, G.R. Rapid displacement of native species by invasive species: Effects of hybridization. Biol. Conserv. 1999, 89, 143–152. [Google Scholar] [CrossRef] [Green Version]
- Kearns, A.M.; Restani, M.; Szabo, I.; Schrøder-nielsen, A.; Kim, J.A.; Richardson, H.M.; Marzluff, J.M.; Fleischer, R.C.; Johnsen, A.; Omland, K.E. Genomic evidence of speciation reversal in ravens. Nat. Commun. 2018, 9, 906. [Google Scholar] [CrossRef] [Green Version]
- Lepage, D. Avibase—The World Bird Database. Available online: https://avibase.bsc-eoc.org/avibase.jsp?lang=EN (accessed on 9 May 2020).
- Schorger, A. Introduction of the domestic pigeon. Auk 1952, 69, 462–463. [Google Scholar] [CrossRef]
- Small, M.; Baccus, J.; Schwertner, T. Historic and current distribution and abundance of White-winged Doves (Zenaida asiatica) in the United States. Texas Ornitol. Soc. 2006, 6, 1–22. [Google Scholar]
- Robbins, C.; Bruun, B.; Zim, H. Birds of North America: A Guide to Field Identification; Golden Guides from St. Martin’s Press: New York, NY, USA, 2014. [Google Scholar]
- Hengeveldeld, R. What to do about the North American invasion by the Collared Dove? J. Field Ornithol. 1993, 64, 477–489. [Google Scholar]
- Smith, P.W. The Eurasian Collared-Dove arrives in the Americas. Am. Birds 1987, 41, 1371–1380. [Google Scholar]
- Scheidt, S.N.; Hurlbert, A.H. Range expansion and population dynamics of an invasive species: The eurasian collared-dove (Streptopelia decaocto). PLoS ONE 2014, 9, e111510. [Google Scholar] [CrossRef] [Green Version]
- Saunders, G.B. The origin of White-winged Doves breeding in south Florida. Florida Field Nat. 1980, 8, 50–51. [Google Scholar]
- Aldrich, J.W.; Aldrich, J.W. Geographic Variation in White-Winged Doves Zenaida asiatica with Reference to a Possible Source of a New Florida USA Population. Proc. Biol. Soc. Wash. 1981, 94, 641–651. [Google Scholar]
- Butcher, J.A.; Collier, B.A.; Silvy, N.J.; Roberson, J.A.; Mason, C.D.; Peterson, M.J. Spatial and temporal patterns of range expansion of white-winged doves in the USA from 1979 to 2007. J. Biogeogr. 2014, 41, 1947–1956. [Google Scholar] [CrossRef]
- Pruett, C.L.; Tanksley, S.M.; Small, M.F.; Taylor, J.F.; Forstner, M.R.J.; Taylor, J.F. The Effects of Range Expansion on the Population Genetics of White-Winged Doves in Texas the Effects of Range Expansion on the Population Genetics of White-Winged Doves in Texas. Am. Mimdl. Nat. 2011, 166, 415–425. [Google Scholar] [CrossRef]
- Veech, J.A.; Small, M.F.; Baccus, J.T. The effect of habitat on the range expansion of a native and an introduced bird species. J. Biogeogr. 2011, 38, 69–77. [Google Scholar] [CrossRef]
- Poling, T.D.; Hayslette, S.E. Dietary Overlap and Foraging Competition between Mourning Doves and Eurasian Collared-Doves. J. Wildl. Manag. 2004, 70, 998–1004. [Google Scholar] [CrossRef]
- Hayslette, S.E. Seed-Size Selection in Mourning Doves and Eurasian Collared-Doves. Wilson Ornithol. Soc. 2006, 118, 64–69. [Google Scholar] [CrossRef]
- Ottenburghs, J.; Ydenberg, R.C.; Van Hooft, P.; Van Wieren, S.E.; Prins, H.H.T. The Avian Hybrids Project: Gathering the scientific literature on avian hybridization. IBIS 2015, 157, 892–894. [Google Scholar] [CrossRef] [Green Version]
- Greenwood, P.J. Mating systems, philopatry and dispersal in birds and mammals. Anim. Behav. 1980, 28, 1140–1162. [Google Scholar] [CrossRef]
- Ellegren, H. Evolutionary stasis: The stable chromosomes of birds. Trends Ecol. Evol. 2010, 25, 283–291. [Google Scholar] [CrossRef]
- Grant, P.R.; Grant, B.R. Hybridization of bird species. Science 1992, 256, 193–197. [Google Scholar] [CrossRef] [PubMed]
- Price, D.K.; Muir, C. Conservation implications of hybridization in Hawaiian picture-winged Drosophila. Mol. Phylogenet. Evol. 2008, 47, 1217–1226. [Google Scholar] [CrossRef]
- Uy, J.A.C.; Irwin, D.E.; Webster, M.S. Behavioral Isolation and Incipient Speciation in Birds. Annu. Rev. Ecol. Evol. Syst. 2018, 49, 1–24. [Google Scholar] [CrossRef] [Green Version]
- Fitzpatrick, B. Rates of Evolution of Hybrid invibility in birds and mammals. Evolution 2004, 58, 1865–1870. [Google Scholar] [CrossRef]
- Lijtmaer, D.A.; Mahler, B.; Tubaro, P.L. Hybridization and postzygotic isolation patterns in pigeons and doves. Evolution 2003, 57, 1411–1418. [Google Scholar] [CrossRef]
- Price, J.P.; Clague, D.A. How old is the Hawaiian biota? Geology and phylogeny suggest recent divergence. Proc. R. Soc. B Biol. Sci. 2002, 269, 2429–2435. [Google Scholar] [CrossRef] [PubMed] [Green Version]
- Mccarthy, E.M. Handbook of Avian Hybrids of the World; Oxford University Press: New York, NY, USA, 2006. [Google Scholar]
- Hartman, P.J.; Wetzel, D.P.; Crowley, P.H.; Westneat, D.F. The impact of extra-pair mating behavior on hybridization and genetic introgression. Theor. Ecol. 2012, 5, 219–229. [Google Scholar] [CrossRef]
- Lavretsky, P.; Janzen, T.; McCracken, K.G. Identifying hybrids & the genomics of hybridization: Mallards & American black ducks of Eastern North America. Ecol. Evol. 2019, 9, 3470–3490. [Google Scholar] [CrossRef] [PubMed] [Green Version]
- Omland, K.E.; Kondo, B. S18-2 Phylogenetic studies of plumage evolution and speciation in New World orioles (Icterus). Acta Zool. Sin. 2006, 52, 320–326. [Google Scholar]
- Nadachowska-Brzyska, K.; Burri, R.; Olason, P.I.; Kawakami, T.; Smeds, L. Demographic Divergence History of Pied Flycatcher and Collared Flycatcher Inferred from Whole-Genome Re-sequencing Data. PLoS Genet. 2013, 9, 1003942. [Google Scholar] [CrossRef] [Green Version]
- Johnson, K.P.; Weckstein, J.D. The Central American land bridge as an engine of diversification in New World doves. J. Biogeogr. 2011, 38, 1069–1076. [Google Scholar] [CrossRef]
- Johnson, K.P.; Kort, S.D.E.; Dinwoodey, K.; Mateman, A.C.; Cate, C.T.E.N.; Lessells, C.M.; Clayton, D.H. A molecular phylogeny of the dove genera Streptopelia and Columba. Auk 2001, 118, 874–887. [Google Scholar] [CrossRef]
- Discover a New World of Birding. Available online: Https://ebird.orgeBird (accessed on 3 March 2021).
- Domyan, E.T.; Shapiro, M.D. Pigeonetics takes flight: Evolution, development, and genetics of intraspecific variation. Dev. Biol. 2017, 427, 241–250. [Google Scholar] [CrossRef] [Green Version]
- Dacosta, J.M.; Sorenson, M.D. Amplification Biases and Consistent Recovery of Loci in a Double-Digest RAD-seq Protocol. PLoS ONE 2014, 9, e106713. [Google Scholar] [CrossRef] [PubMed]
- Lavretsky, P.; McInerney, N.R.; Mohl, J.E.; Brown, J.I.; James, H.F.; McCracken, K.G.; Fleischer, R.C. Assessing changes in genomic divergence following a century of human-mediated secondary contact among wild and captive-bred ducks. Mol. Ecol. 2020, 29, 578–595. [Google Scholar] [CrossRef]
- Bolger, A.M.; Lohse, M.; Usadel, B. Trimmomatic: A flexible trimmer for Illumina sequence data. Bioinformatics 2014, 30, 2114–2120. [Google Scholar] [CrossRef] [PubMed] [Green Version]
- Damas, J.; O’Connor, R.; Farré, M.; Panagiotis, V.; Lenis, E.; Martell, H.J.; Mandawala, A.; Fowler, K.; Joseph, S.; Swain, M.T.; et al. Upgrading short-read animal genome assemblies to chromosome level using comparative genomics and a universal probe set. Genome Res. 2017, 27, 875–884. [Google Scholar] [CrossRef] [PubMed] [Green Version]
- Li, H.; Durbin, R. Inference of Human Population History from Whole Genome Sequence of a Single Individual. Nature 2011, 475, 493–496. [Google Scholar] [CrossRef] [Green Version]
- Li, H.; Handsaker, B.; Wysoker, A.; Fennell, T.; Ruan, J.; Homer, N.; Marth, G.; Abecasis, G.; Durbin, R.; Data, G.P.; et al. The Sequence Alignment/Map format and SAMtools. Bioinformatics 2009, 25, 2078–2079. [Google Scholar] [CrossRef] [Green Version]
- Lischer, H.E.L.; Excoffier, L. PGDSpider: An automated data conversion tool for connecting population genetics and genomics programs. Bioinformatics 2012, 28, 298–299. [Google Scholar] [CrossRef] [Green Version]
- Marees, A.T.; de Kluiver, H.; Stringer, S.; Vorspan, F.; Curis, E.; Marie-Claire, C.; Derks, E.M. A tutorial on conducting genome-wide association studies: Quality control and statistical analysis. Int. J. Methods Psychiatr. Res. 2018, 27. [Google Scholar] [CrossRef]
- Danecek, P.; Auton, A.; Abecasis, G.; Albers, C.A.; Banks, E.; DePristo, M.A.; Handsaker, R.E.; Lunter, G.; Marth, G.T.; Sherry, S.T.; et al. The variant call format and VCFtools. Bioinformatics 2011, 27, 2156–2158. [Google Scholar] [CrossRef] [PubMed]
- Puritz, J.B.; Hollenbeck, C.M.; Gold, J.R. dDocent: A RADseq, variant-calling pipeline designed for population genomics of non-model organisms. PeerJ 2014, 2014, e431. [Google Scholar] [CrossRef] [Green Version]
- Drummond, A.J.; Suchard, M.A.; Xie, D.; Rambaut, A. Bayesian Phylogenetics with BEAUti and the BEAST 1.7. Mol. Biol. Evol. 2012, 29, 1969–1973. [Google Scholar] [CrossRef] [Green Version]
- Tizard, J.; Patel, S.; Waugh, J.; Tavares, E.; Bergmann, T.; Gill, B.; Norman, J.; Christidis, L.; Scofield, P.; Haddrath, O.; et al. DNA barcoding a unique avifauna: An important tool for evolution, systematics and conservation. BMC Evo. Biol. 2019, 19, 52. [Google Scholar] [CrossRef] [PubMed]
- Tamura, K.; Ursula, F.; Billing-Ross, P.; Murillo, O.; Filipski, A.; Kumar, S. Estimating divergence times in large molecular phylogenies. Proc. Natl. Acad. Sci. USA 2012, 109, 19333–19338. [Google Scholar] [CrossRef] [Green Version]
- Kumar, S.; Stecher, G.; Suleski, M.; Hedges, S.B. TimeTree: A Resource for Timelines, Timetrees, and Divergence Times. Mol. Biol. Evol. 2017, 34, 1812–1819. [Google Scholar] [CrossRef] [PubMed]
- Pickrell, J.K.; Pritchard, J.K. Inference of Population Splits and Mixtures from Genome-Wide Allele Frequency Data. PLoS Genet. 2012, 8, e1002967. [Google Scholar] [CrossRef] [PubMed] [Green Version]
- Bandelt, H.-J.; Forster, P.; Rohl, A. Median-Joining Networks for Inferring Intraspecific Phylogenies. Mol. Biol. Evol. 1999, 16, 37–48. [Google Scholar] [CrossRef] [PubMed]
- Dray, S.; Dufour, A.-B. The ad4 Package: Implementing the Duality Diagram for Ecologist. J. Stat. Softw. 2007, 22, 1–20. [Google Scholar] [CrossRef] [Green Version]
- Jombart, T.; Lyon, D.; Biome, L. De adegenet: A R package for the multivariate analysis of genetic markers. Bioinformatics 2008, 24, 1403–1405. [Google Scholar] [CrossRef] [Green Version]
- Alexander, D.H.; Lange, K. Enhancements to the ADMIXTURE algorithm for individual ancestry estimation. BMC Bioinform. 2011, 12, 246. [Google Scholar] [CrossRef] [PubMed] [Green Version]
- Alexander, D.H.; Novembre, J.; Lange, K. Fast model-based estimation of ancestry in unrelated individuals. Gennome Res. 2009, 19, 1655–1664. [Google Scholar] [CrossRef] [Green Version]
- Jakobsson, M.; Rosenberg, N.A. CLUMPP: A cluster matching and permutation program for dealing with label switching and multimodality in analysis of population structure. Bioinformatics 2007, 23, 1801–1806. [Google Scholar] [CrossRef] [Green Version]
- Malinsky, M.; Trucchi, E.; Lawson, D.J.; Falush, D. RADpainter and fineRADstructure: Population Inference from RADseq Data. Mol. Biol. Evol. 2018, 35, 1284–1290. [Google Scholar] [CrossRef]
- Rozas, J.; Ferrer-Mata, A.; Sanchez-DelBarrio, J.C.; Guirao-Rico, S.; Librado, P.; Ramos-Onsins, S.E.; Sanchez-Gracia, A. DnaSP 6: DNA sequence polymorphism analysis of large data sets. Mol. Biol. Evol. 2017, 34, 3299–3302. [Google Scholar] [CrossRef]
- Hey, J.; Nielsen, R. Multilocus methods for estimating population sizes, migration rates and divergence time, with applications to the divergence of Drosophila pseudoobscura and D. persimilis. Genetics 2004, 167, 747–760. [Google Scholar] [CrossRef] [Green Version]
- Hey, J.; Nielsen, R. Integration within the Felsenstein equation for improved Markov chain Monte Carlo methods in population genetics. Proc. Natl. Acad. Sci. USA 2007, 104, 2785–2790. [Google Scholar] [CrossRef] [PubMed] [Green Version]
- Nielsen, R.; Wakeley, J. Distinguishing Migration from Isolation: A Markov Chain Monte Carlo Approach. Genetics 2001, 158, 885–896. [Google Scholar] [CrossRef]
- Gutenkunst, R.N.; Hernandez, R.D.; Williamson, S.H.; Bustamante, C.D. Inferring the Joint Demographic History of Multiple Populations from Multidimensional SNP Frequency Data. PLoS Genet. 2009, 5, e1000695. [Google Scholar] [CrossRef] [Green Version]
- Gutenkunst, R.N.; Hernandez, R.D.; Williamson, S.H.; Bustamante, C.D. Diffusion Approximations for Demographic Inference: DaDi. Nat. Preced. 2010, 5, 1. [Google Scholar] [CrossRef]
- Coffman, A.J.; Hsieh, P.H.; Gravel, S.; Gutenkunst, R.N. Computationally efficient composite likelihood statistics for demographic inference. Mol. Biol. Evol 2016, 33, 591–593. [Google Scholar] [CrossRef] [PubMed] [Green Version]
- Liu, D.; Hunt, M.; Tsai, I.J. Inferring synteny between genome assemblies: A systematic evaluation. BMC Bioinform. 2018, 19, 26. [Google Scholar] [CrossRef]
- Nam, K.; Mugal, C.; Nabholz, B.; Schielzeth, H.; Wolf, J.B.W.; Backström, N.; Künstner, A.; Balakrishnan, C.N.; Heger, A.; Ponting, C.P.; et al. Molecular evolution of genes in avian genomes. Genome Biol. 2010, 11, R68. [Google Scholar] [CrossRef] [Green Version]
- Nabholz, B.; Glémin, S.; Galtier, N. The erratic mitochondrial clock: Variations of mutation rate, not population size, affect mtDNA diversity across birds and mammals. BMC Evol. Biol. 2009, 9, 54. [Google Scholar] [CrossRef] [Green Version]
- Oswald, J.A.; Harvey, M.G.; Depaul, R.C.R.; Donna, U.F.; Steven, L.D.; Robb, W.C. Evolutionary dynamics of hybridization and introgression following the recent colonization of Glossy Ibis (Aves: Plegadis falcinellus) into the New World. Mol. Ecol. 2019, 28, 1675–1691. [Google Scholar] [CrossRef] [PubMed]
- Liu, Y.; Liu, S.; Yeh, C.; Zhang, N.; Chen, G.; Que, P.; Dong, L. The first set of universal nuclear protein-coding loci markers for avian phylogenetic and population genetic studies. Sci. Rep. 2018, 8, 15723. [Google Scholar] [CrossRef] [Green Version]
- McCracken, K.G.; Johnson, W.P.; Sheldon, F.H. Molecular population genetics, phylogeography, and conservation biology of the mottled duck (Anas fulvigula). Conserv. Genet. 2001, 2, 87–102. [Google Scholar] [CrossRef]
- Soares, A.E.R.; Novak, B.J.; Haile, J.; Heupink, T.H.; Fjeldså, J.; Gilbert, M.T.P.; Poinar, H.; Church, G.M.; Shapiro, B. Complete mitochondrial genomes of living and extinct pigeons revise the timing of the columbiform radiation. BMC Evol. Biol. 2016, 16, 230. [Google Scholar] [CrossRef] [PubMed] [Green Version]
- Pereira, S.L.; Johnson, K.P.; Clayton, D.H.; Baker, A.J. Mitochondrial and Nuclear DNA Sequences Support a Cretaceous Origin of Columbiformes and a Dispersal-Driven Radiation in the Paleogene. Syst. Biol. 2007, 56, 656–672. [Google Scholar] [CrossRef] [Green Version]
- Gonzalez, J.; Delgado Castro, G.; Garcia-del-Rey, E.; Berger, C.; Wink, M. Use of mitochondrial and nuclear genes to infer the origin of two endemic pigeons from the Canary Islands. J. Ornithol. 2009, 150, 357–367. [Google Scholar] [CrossRef]
- Bonnet, I.; Leblois, R.; Rousset, F.; Chrochet, P. A reassessment of explanations for discordant introgressions of mitochondrial. Evolution 2017, 71, 2140–2158. [Google Scholar] [CrossRef] [PubMed]
- Humphries, E.M.; Winker, K. Discord reigns among nuclear, mitochondrial and phenotypic estimates of divergence in nine lineages of trans-Beringian birds. Mol. Ecol. 2011, 20, 573–583. [Google Scholar] [CrossRef] [PubMed]
- Jacobsen, F.; Omland, K.E. Species tree inference in a recent radiation of orioles (Genus Icterus): Multiple markers and methods reveal cytonuclear discordance in the northern oriole group. Mol. Phylogenet. Evol. 2011, 61, 460–469. [Google Scholar] [CrossRef] [PubMed]
- Lavretsky, P.; McCracken, K.G.; Peters, J.L. Phylogenetics of a recent radiation in the mallards and allies (Aves: Anas): Inferences from a genomic transect and the multispecies coalescent. Mol. Phylogenet. Evol. 2014, 70, 402–411. [Google Scholar] [CrossRef]
- Peters, J.L.; Winker, K.; Millam, K.C.; Lavretsky, P.; Kulikova, I.; Wilson, R.E.; Zhuravlev, Y.N.; McCracken, K.G. Mito-nuclear discord in six congeneric lineages of Holarctic ducks (genus Anas). Mol. Ecol. 2014, 23, 2961–2974. [Google Scholar] [CrossRef]
- Toews, D.P.L.; Brelsford, A. The biogeography of mitochondrial and nuclear discordance in animals. Mol. Ecol. 2012, 21, 3907–3930. [Google Scholar] [CrossRef]
- Parkes, K.C. Intergeneric hybrids in the family Pipridae. Condor 1961, 63, 345–350. [Google Scholar] [CrossRef]
- Peterle, T.J. Intergeneric Galliform Hybrids: A Review. Wilson Bull. 1951, 63, 219–224. [Google Scholar]
- Toews, D.P.L.; Kramer, G.R.; Jones, A.W.; Brennan, C.L.; Cloud, B.E.; Andersen, D.E.; Lovette, I.J.; Streby, H. Genomic identification of intergeneric hybrids in New World wood-warblers (Aves: Parulidae). Biol. J. Linn. Soc. 2020, 131, 183–191. [Google Scholar] [CrossRef]
- Hubbs, C.L. Hybridization between Fish Species in Nature. Syst. Zool. 1955, 4, 1–20. [Google Scholar] [CrossRef]
- Haldane, M. Sex ratio and unisexual sterility in hybrid animals. J. Genet. 1922, 12, 101–109. [Google Scholar] [CrossRef] [Green Version]
- Irwin, M.R.; Cole, L.J. Immunogenetic studies of species and of species hybrids in doves, and the separation of species-specific substances in the backcross. J. Exp. Zool. 1936, 73, 85–108. [Google Scholar] [CrossRef]
- Miller, W.J. The Time of Appearance of Species-Specific Antigens of Columba guinea in the Embryos of Backcross Hybrids. Physiol. Zool. 1953, 26, 124–131. [Google Scholar] [CrossRef]
- Jarvis, E.D.; Mirarab, S.; Aberer, A.J.; Li, B.; Houde, P.; Li, C.; Ho, S.Y.W.; Faircloth, B.C.; Nabholz, B.; Howard, J.T.; et al. Whole-genome analyses resolve early branches in the tree of life of modern birds. Science 2014, 346, 1320–1331. [Google Scholar] [CrossRef] [Green Version]
- Prum, R.O.; Berv, J.S.; Dornburg, A.; Field, D.J.; Townsend, J.P.; Lemmon, E.M.; Lemmon, A.R. A comprehensive phylogeny of birds (Aves) using targeted next-generation DNA sequencing. Nature 2015, 526, 569–573. [Google Scholar] [CrossRef]
- Nadachowska-Brzyska, K.; Li, C.; Smeds, L.; Zhang, G.; Ellegren, H. Temporal Dynamics of Avian Populations during Pleistocene Revealed by Whole-Genome Sequences. Curr. Biol. 2015, 25, 1375–1380. [Google Scholar] [CrossRef] [PubMed] [Green Version]
- Hung, C.M.; Shaner, P.J.L.; Zink, R.M.; Liu, W.C.; Chu, T.C.; Huang, W.S.; Li, S.H. Drastic population fluctuations explain the rapid extinction of the passenger pigeon. Proc. Natl. Acad. Sci. USA 2014, 111, 10636–10641. [Google Scholar] [CrossRef] [PubMed] [Green Version]
- Murray, G.G.R.; Soares, A.E.R.; Novak, B.J.; Schaefer, N.K.; Cahill, J.A.; Baker, A.J.; Demboski, J.R.; Doll, A.; Da Fonseca, R.R.; Fulton, T.L.; et al. Natural selection shaped the rise and fall of passenger pigeon genomic diversity. Science 2017, 358, 951–954. [Google Scholar] [CrossRef] [PubMed] [Green Version]
- Bagi, Z.; Dimopoulos, E.A.; Loukovitis, D.; Eraud, C. MtDNA genetic diversity and structure of Eurasian Collared Dove (Streptopelia decaocto). PLoS ONE 2018, 13, e0193935. [Google Scholar] [CrossRef] [PubMed] [Green Version]
- Nagai, K.; Nagai, K.; Takahashi, Y.; Tokita, K.I.; Anzai, T.; Uchida, K.; Nakayama, F. Genetic diversity in Japanese populations of the Eurasian Collared Dove. Avian Res. 2020, 11, 21. [Google Scholar] [CrossRef]
- Shapiro, M.D.; Kronenberg, Z.; Li, C.; Domyan, E.T.; Pan, H.; Campbell, M.; Tan, H.; Huff, C.D.; Hu, H.; Vickrey, A.I.; et al. Genomic diversity and evolution of the head crest in the rock pigeon. Science 2013, 339, 1063–1067. [Google Scholar] [CrossRef] [PubMed] [Green Version]


| mtDNA COI Nucleotide Diversity (π) | ddRAD-Seq Z-Sex Nucleotide Diversity (π) | ddRAD-Seq Autosomal Nucleotide Diversity (π) | ∂a∂i ddRAD-Seq Autosomal Based NE (Millions) Paired Species | ∂a∂i ddRAD-Seq Autosomal Based NE (Millions) Single Species | Census (Millions) | |
|---|---|---|---|---|---|---|
| Eurasian Collared-Dove | 0.0024 | 0.0064 | 0.0088 | 0.60 | 2.95 | 85 1 |
| Rock Pigeon | 0.00084 | 0.0073 | 0.0081 | 0.95 | 9.03 | 140 1,2 |
| Mourning Dove | 0.00072 | 0.015 | 0.023 | 1.22 | 5.08 | 249 1,3 |
| White-winged Dove | 0.00057 | 0.0062 | 0.0089 | 1.04 | 5.58 | 14 1 |
Publisher’s Note: MDPI stays neutral with regard to jurisdictional claims in published maps and institutional affiliations. |
© 2021 by the authors. Licensee MDPI, Basel, Switzerland. This article is an open access article distributed under the terms and conditions of the Creative Commons Attribution (CC BY) license (https://creativecommons.org/licenses/by/4.0/).
Share and Cite
Hernández, F.; Brown, J.I.; Kaminski, M.; Harvey, M.G.; Lavretsky, P. Genomic Evidence for Rare Hybridization and Large Demographic Changes in the Evolutionary Histories of Four North American Dove Species. Animals 2021, 11, 2677. https://doi.org/10.3390/ani11092677
Hernández F, Brown JI, Kaminski M, Harvey MG, Lavretsky P. Genomic Evidence for Rare Hybridization and Large Demographic Changes in the Evolutionary Histories of Four North American Dove Species. Animals. 2021; 11(9):2677. https://doi.org/10.3390/ani11092677
Chicago/Turabian StyleHernández, Flor, Joshua I. Brown, Marissa Kaminski, Michael G. Harvey, and Philip Lavretsky. 2021. "Genomic Evidence for Rare Hybridization and Large Demographic Changes in the Evolutionary Histories of Four North American Dove Species" Animals 11, no. 9: 2677. https://doi.org/10.3390/ani11092677
APA StyleHernández, F., Brown, J. I., Kaminski, M., Harvey, M. G., & Lavretsky, P. (2021). Genomic Evidence for Rare Hybridization and Large Demographic Changes in the Evolutionary Histories of Four North American Dove Species. Animals, 11(9), 2677. https://doi.org/10.3390/ani11092677