
Training Convolutional Neural Networks to Score Pneumonia in Slaughtered Pigs

 , , ,
, , , 
Abstract
:Simple Summary
Abstract
1. Introduction
2. Materials and Methods
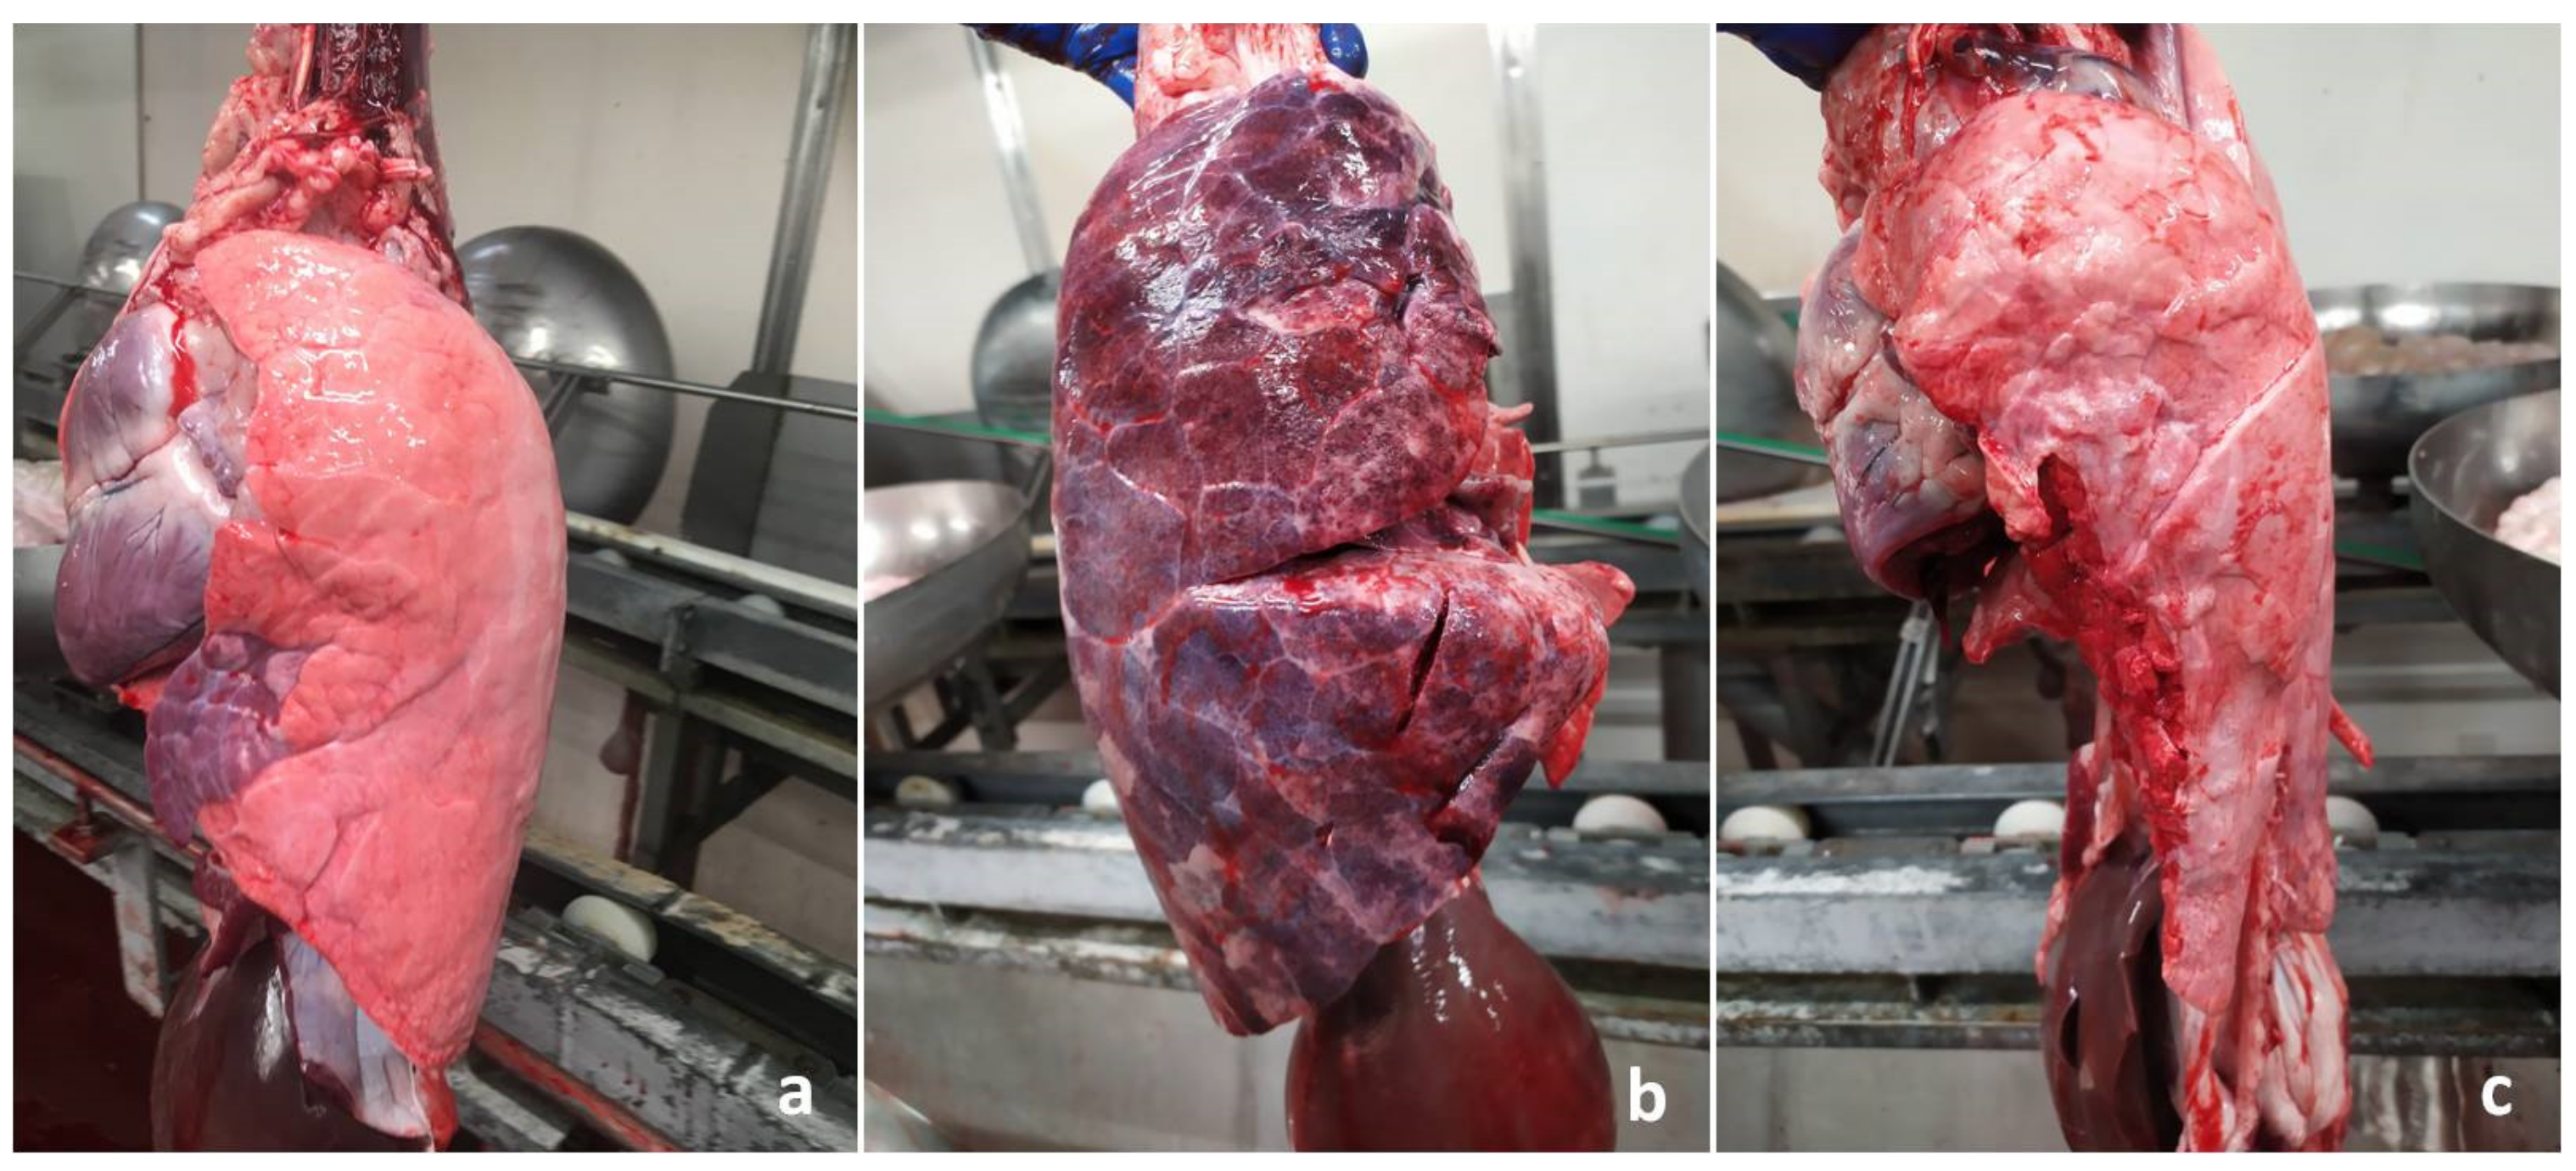
2.1. Animals and Photo Collection
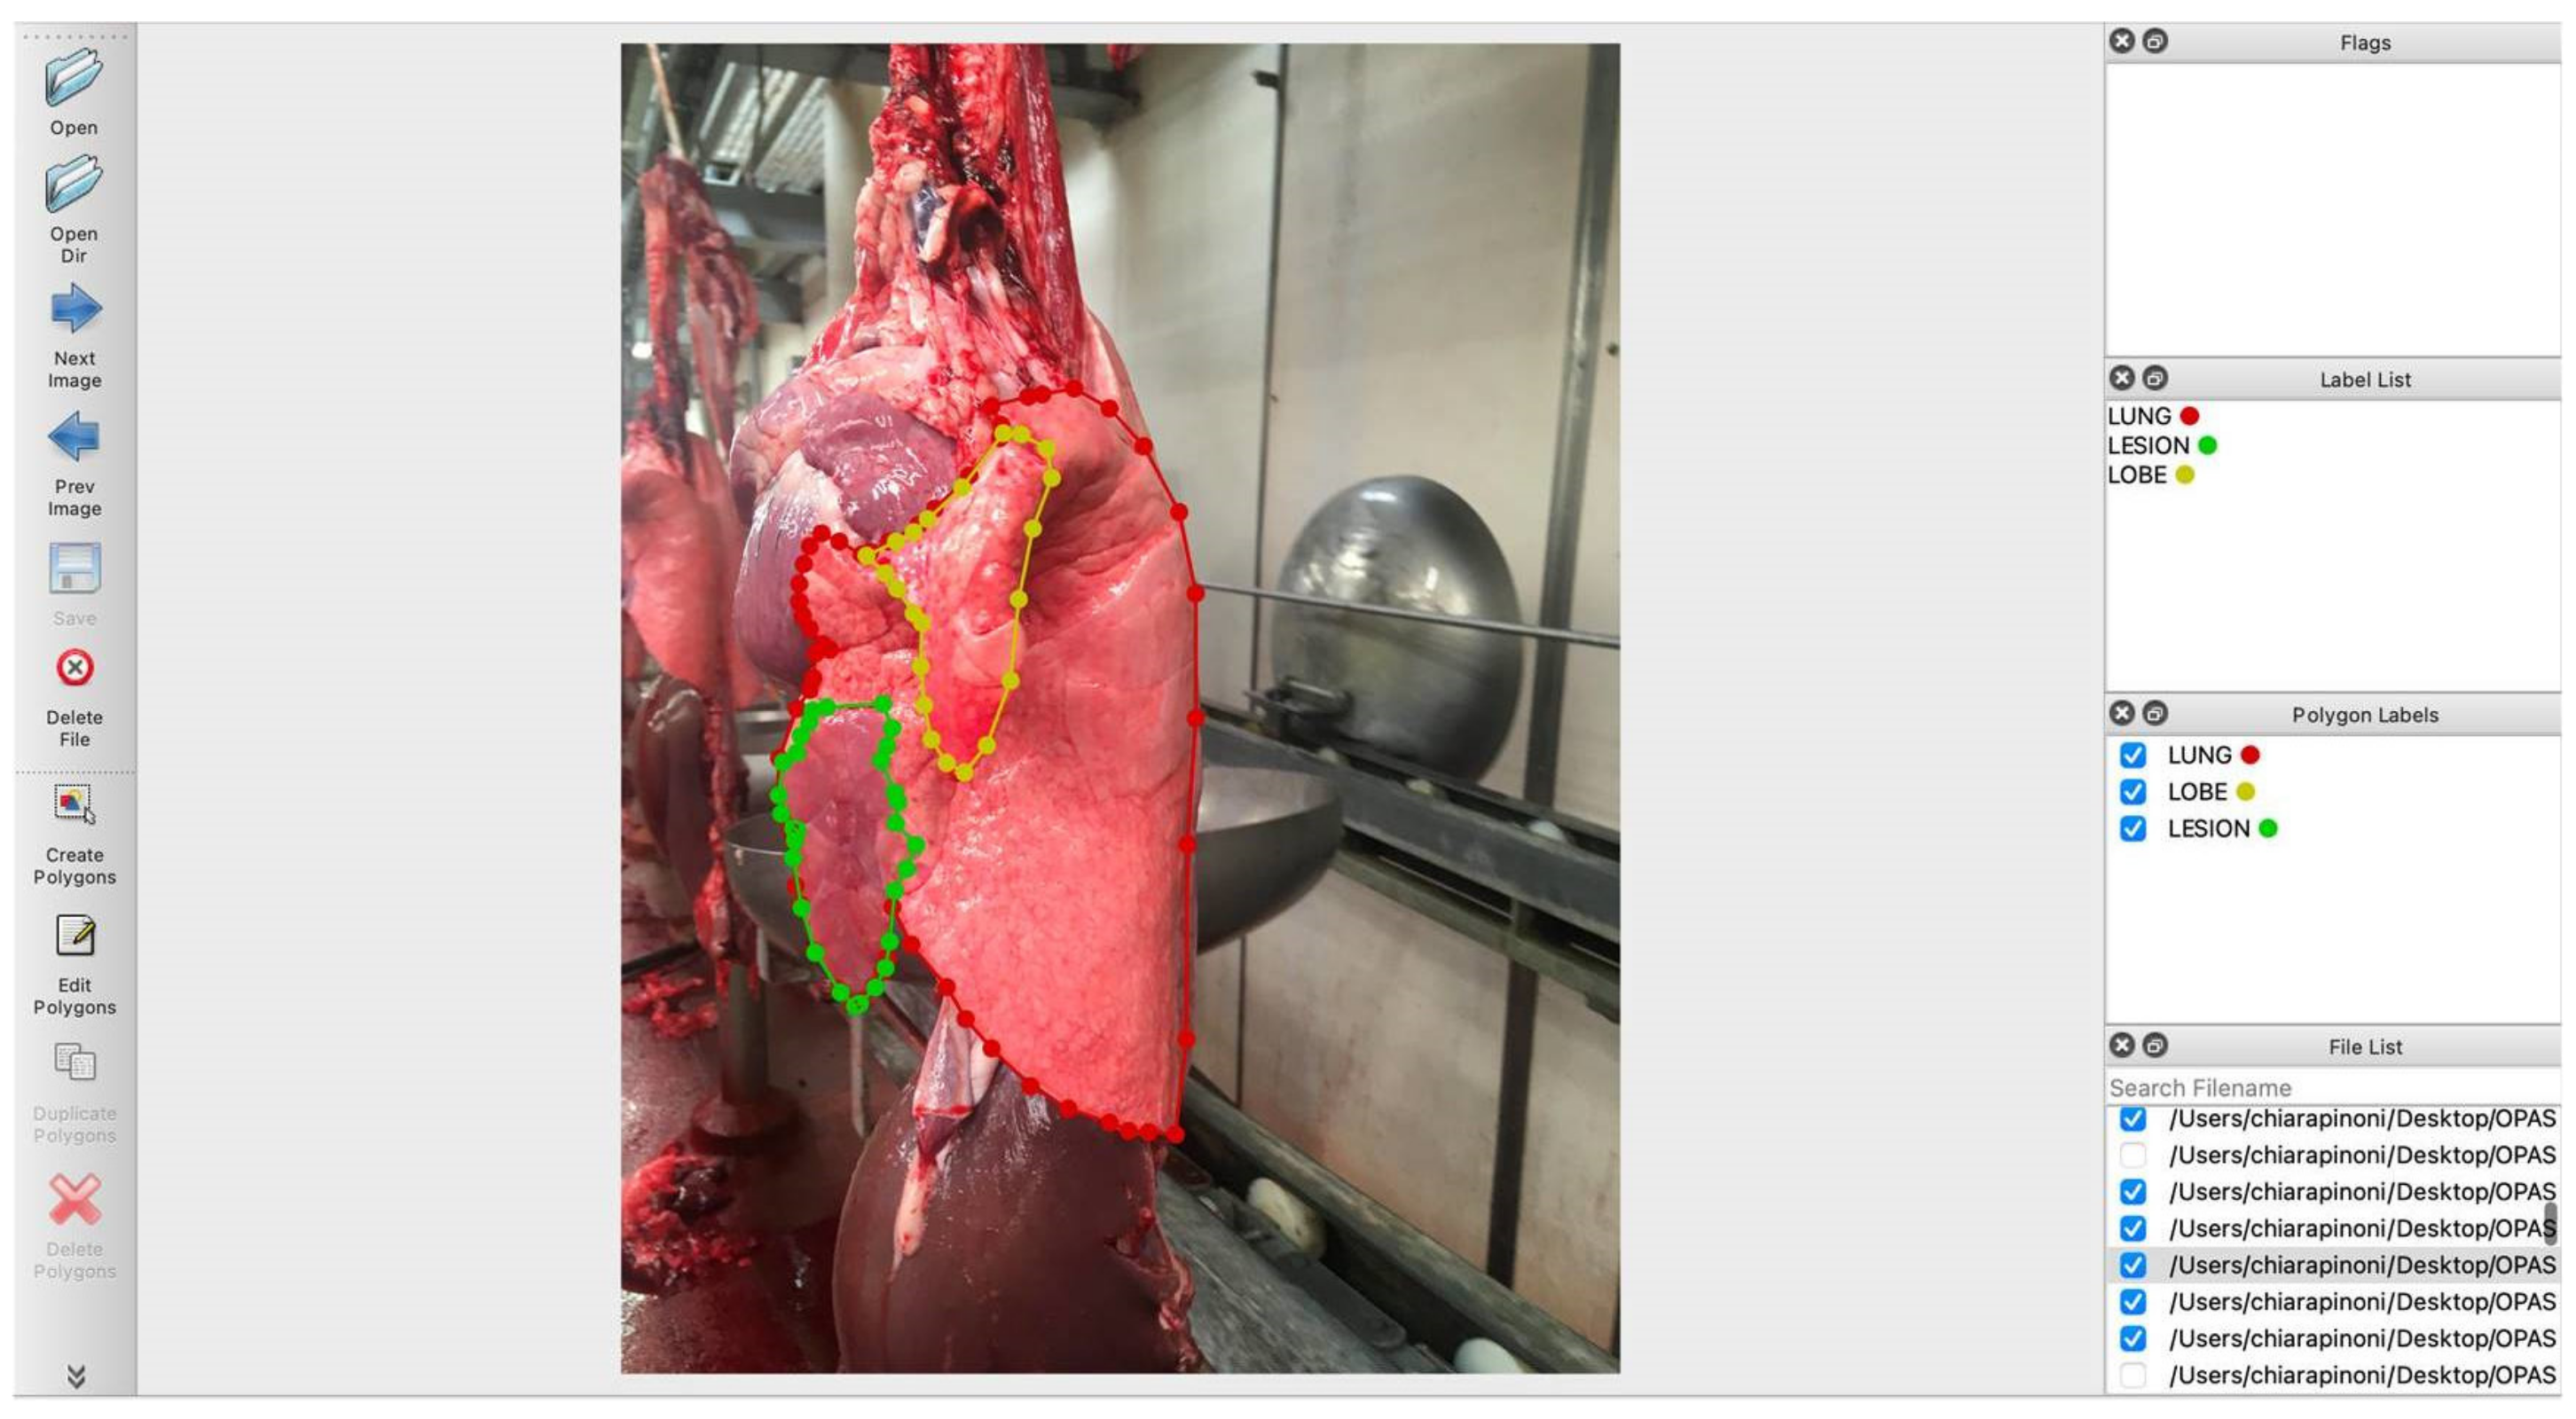
2.2. Photo Annotation
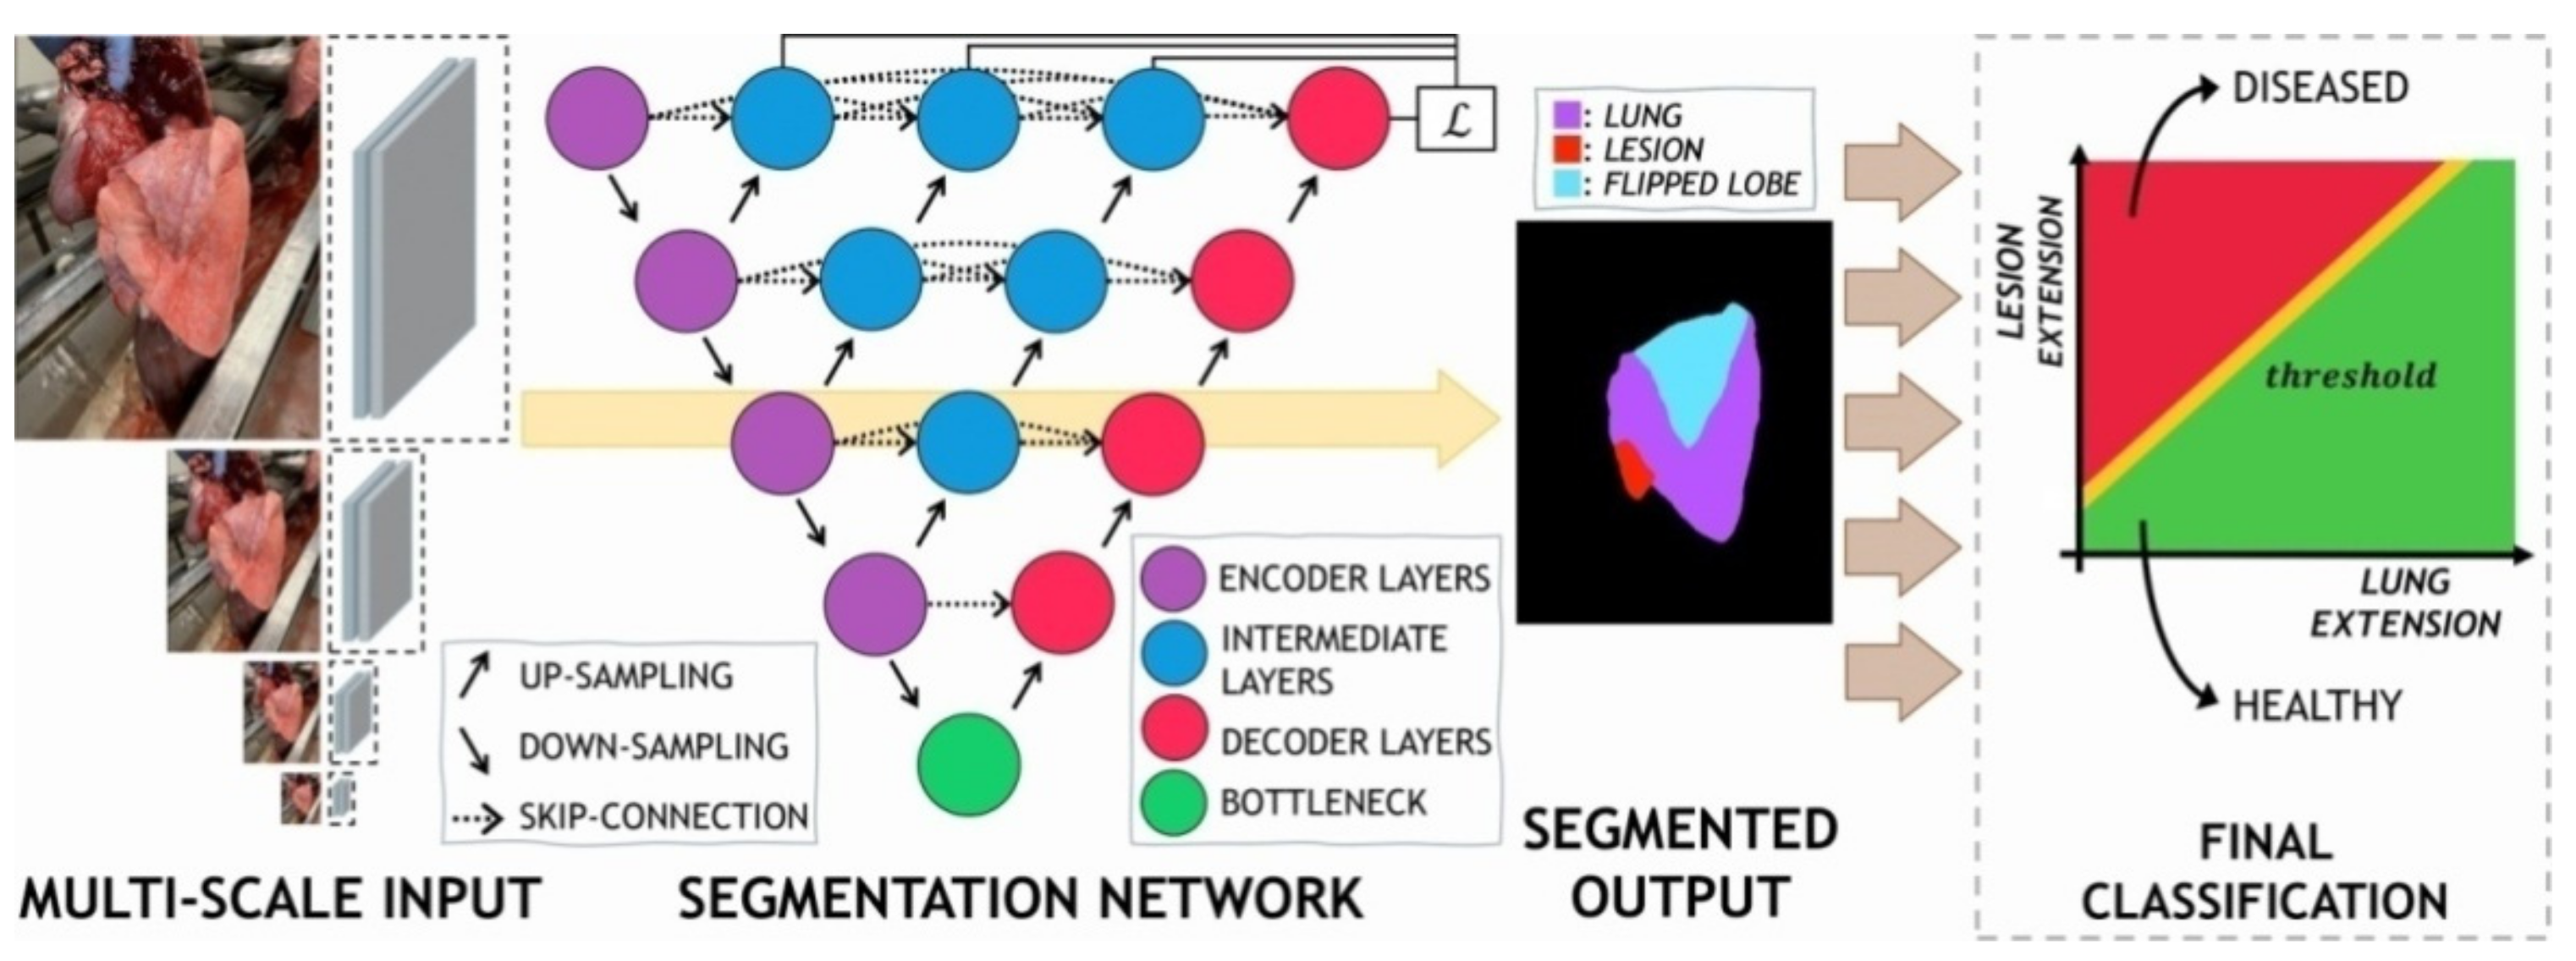
2.3. Architecture of the DL-Based Model Employed
2.4. Training Process
2.5. Dataset
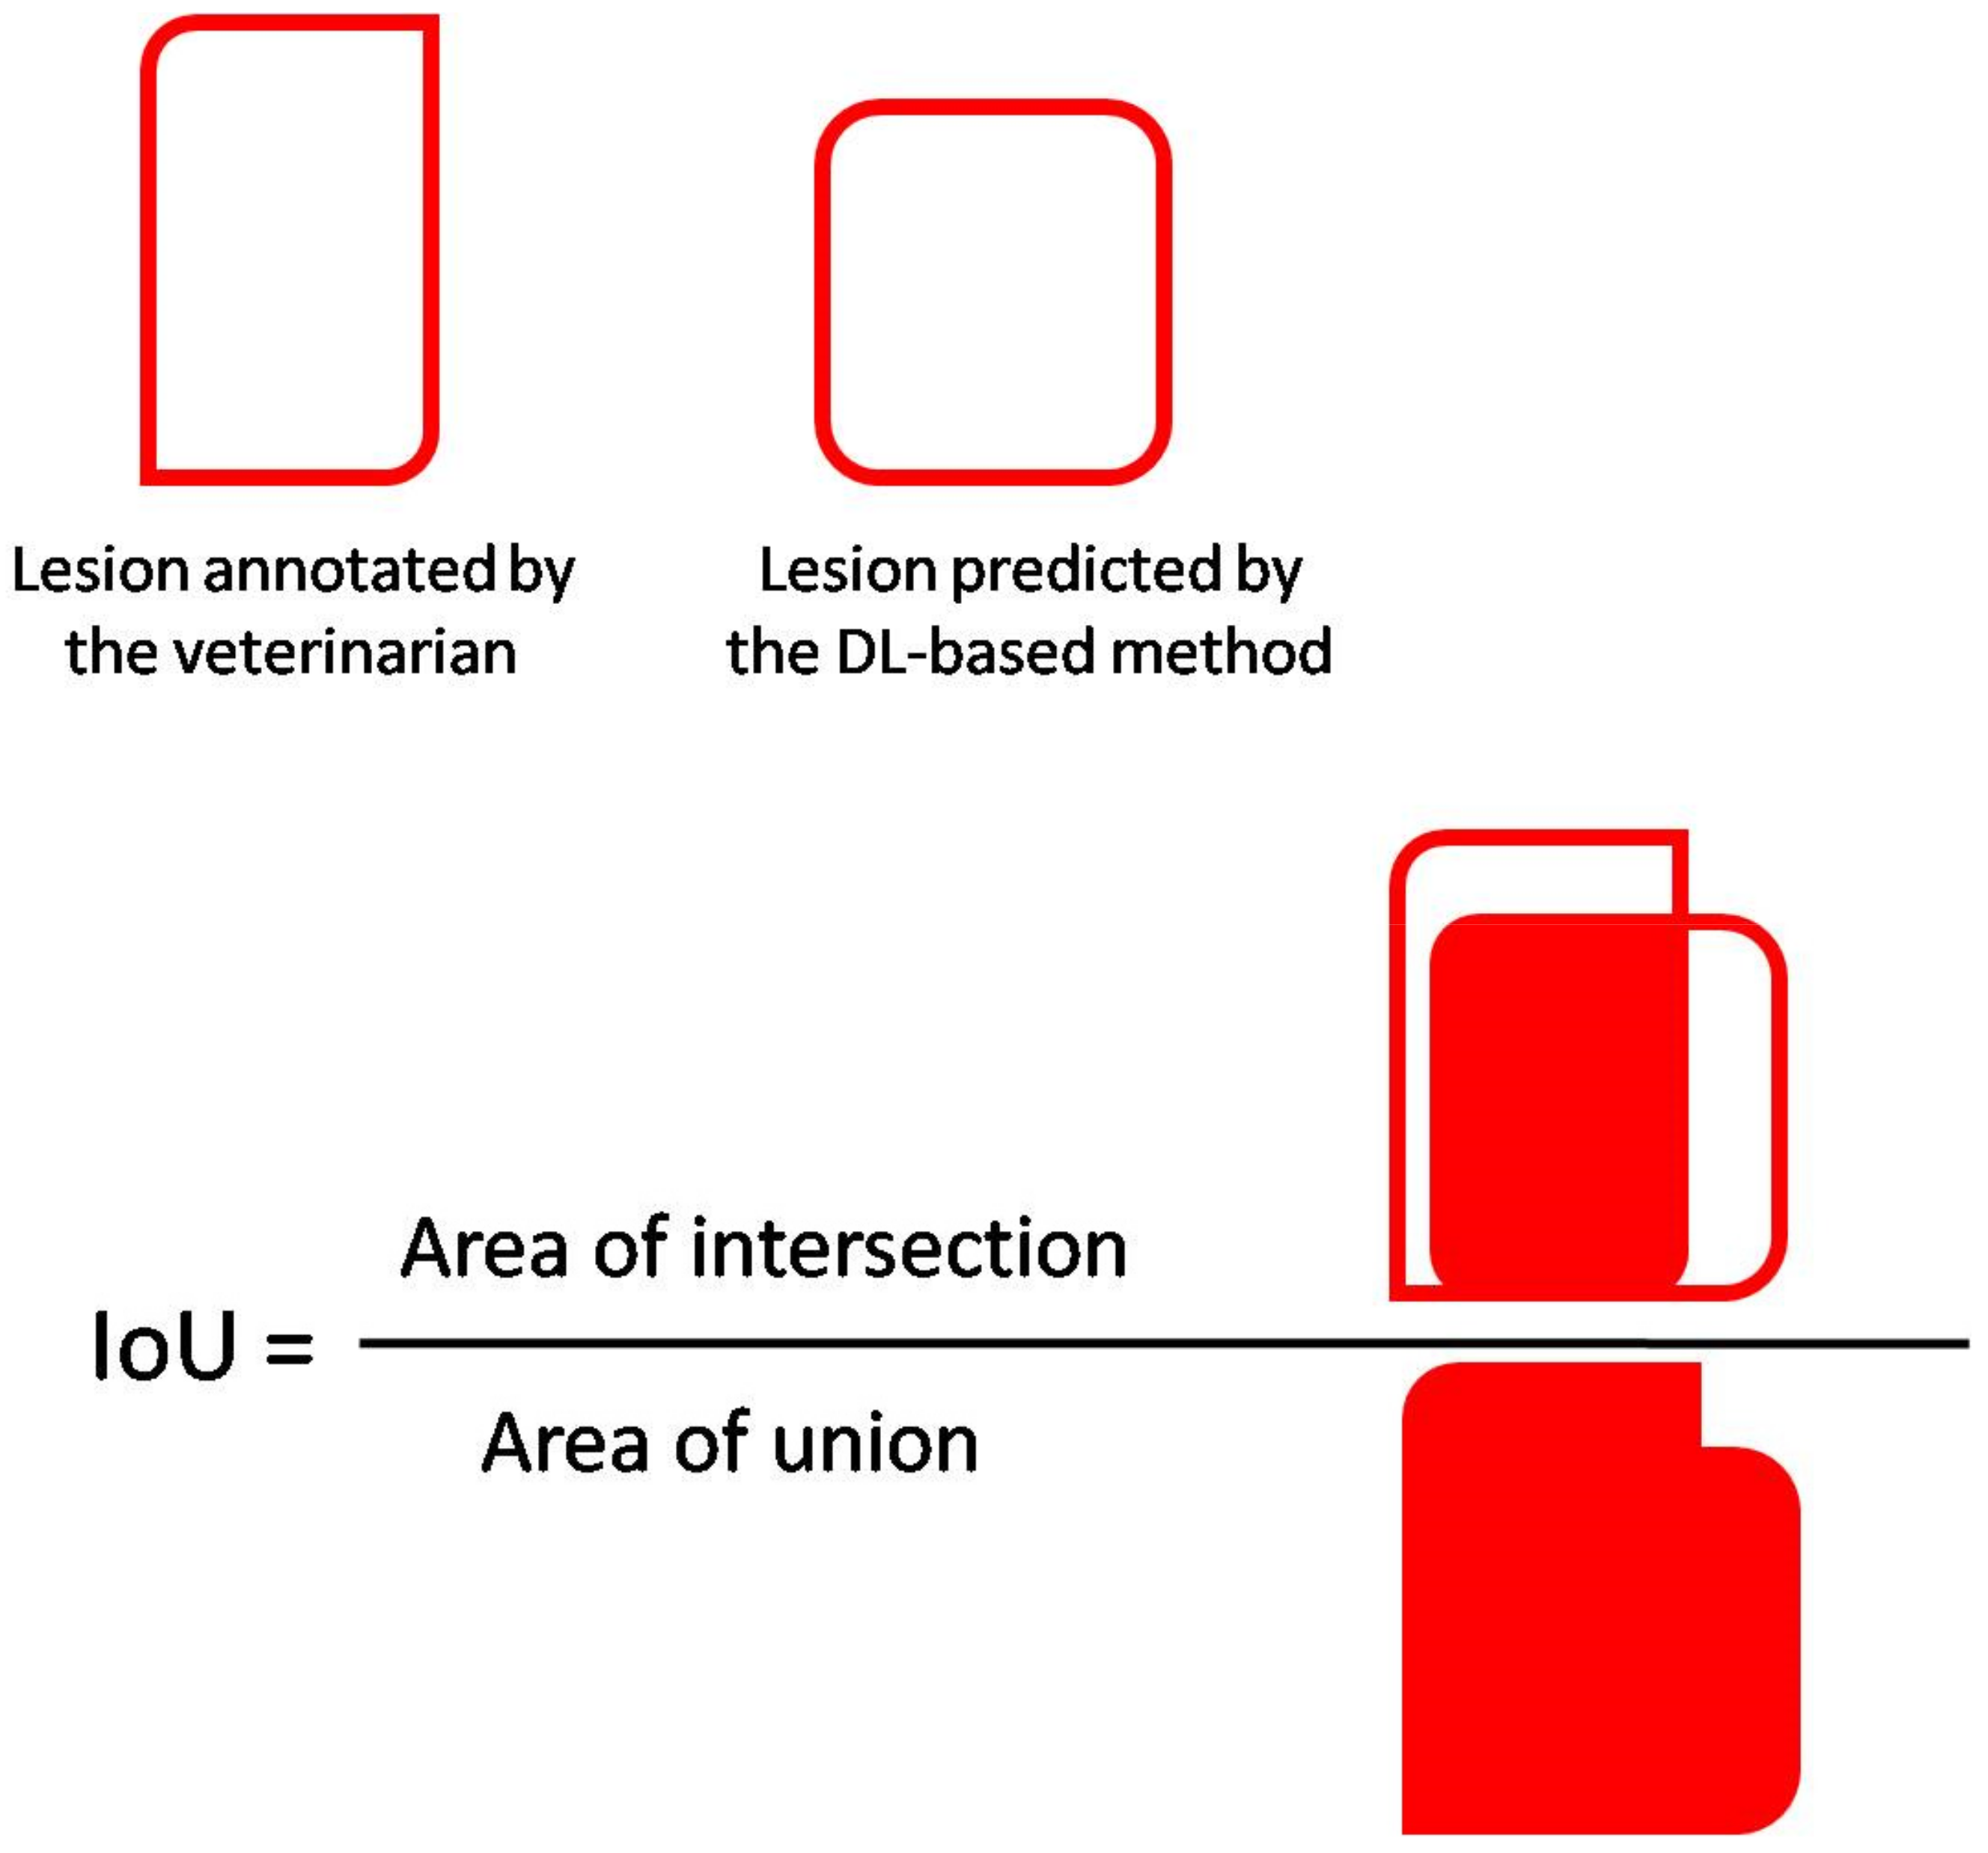
2.6. Metrics
3. Results
3.1. Training Set—Data Provided by the Veterinarians
3.2. Test Set—Data Provided by the Veterinarians
3.3. Test Set—Data Predicted by the DL-Based Method
4. Discussion
5. Conclusions
Supplementary Materials
Author Contributions
Funding
Institutional Review Board Statement
Data Availability Statement
Acknowledgments
Conflicts of Interest
References
- Yaeger, M.L.; Van Alstine, W.G. Respiratory system. In Diseases of Swine, 11th ed.; Zimmermann, J.J., Karriker, L.A., Ramirez, A., Schwartz, K.J., Stevenson, G.W., Zhang, J., Eds.; Wiley Blackwell: Hoboken, NJ, USA, 2019; pp. 393–407. [Google Scholar]
- Christensen, G.; Sørensen, V.; Mousing, J. Diseases of the respiratory system. In Diseases of Swine, 8th ed.; Straw, B.E., D’Allaire, S., Mengeling, W.L., Taylor, D.J., Eds.; Wiley Blackwell: Hoboken, NJ, USA, 1999; pp. 913–940. [Google Scholar]
- Martelli, P. Le vaccinazioni del suino. In Le Vaccinazioni in Medicina Veterinaria, 1st ed.; Ballarini, G., Cavirani, S., Martelli, P., Gallazzi, D., Lavazza, A., Prosperi, S., Spaterna, A., Buonavoglia, C., Pennisi, M.G., Eds.; Edagricole: Bologna, Italia, 2003; pp. 59–102. [Google Scholar]
- Pointon, A.M.; Davies, P.R.; Bahnson, P.B. Disease surveillance at slaughter. In Diseases of Swine, 8th ed.; Straw, B.E., D’Allaire, S., Mengeling, W.L., Taylor, D.J., Eds.; Wiley Blackwell: Hoboken, NJ, USA, 1999; pp. 1111–1132. [Google Scholar]
- Maes, D.; Sibila, M.; Kuhnert, P.; Segalés, J.; Haesebrouck, F.; Pieters, M. Update on Mycoplasma hyopneumoniae infections in pigs: Knowledge gaps for improved disease control. Transbound. Emerg. Dis. 2018, 65, 110–124. [Google Scholar] [CrossRef] [Green Version]
- Pieters, M.G.; Maes, D. Mycoplasmosis. In Diseases of Swine, 11th ed.; Zimmermann, J.J., Karriker, L.A., Ramirez, A., Schwartz, K.J., Stevenson, G.W., Zhang, J., Eds.; Wiley Blackwell: Hoboken, NJ, USA, 2019; pp. 863–883. [Google Scholar]
- Taylor, J.D. The lungs. In Pathology of the Pig, 1st ed.; Sims, L.D., Glastonbury, J.R.W., Eds.; The Pig Research and Development Corporation: Barton, Australia, 1996; pp. 219–237. [Google Scholar]
- Caswell, J.L.; Williams, K.J. Respiratory system. In Pathology of Domestic Animals, 6th ed.; Grant Maxie, M., Ed.; Elsevier: St. Louis, MO, USA, 2016; Volume 2, pp. 523–653. [Google Scholar]
- Luppi, A.; Merialdi, G. Lesioni al macello. In Le Patologie del Maiale, 1st ed.; Martelli, P., Ed.; Point Veterinaire Italie: Milano, Italia, 2013; pp. 199–218. [Google Scholar]
- Scollo, A.; Gottardo, F.; Contiero, B.; Mazzoni, C.; Leneveu, P.; Edwards, S.A. Benchmarking of pluck lesions at slaughter as a health monitoring tool for pigs slaughtered at 170 kg (heavy pigs). Prev. Vet. Med. 2017, 144, 20–28. [Google Scholar] [CrossRef] [Green Version]
- Garcia-Morante, B.; Segalés, J.; Fraile, L.; Pérez de Rozas, A.; Maiti, H.; Coll, T.; Sibila, M. Assessment of Mycoplasma hyopneumoniae-induced Pneumonia using Different Lung Lesion Scoring Systems: A Comparative Review. J. Comp. Pathol. 2016, 154, 125–134. [Google Scholar] [CrossRef]
- Madec, F.; Derrien, H. Fréquence, intensité et localization des lesion pulmonaires chez le porc charcutier: Resultants d’unepremiéreséried’observationsen abattoir. J. Rech. Porc. Fr. 1981, 13, 231–236. [Google Scholar]
- Morris, C.R.; Gardner, I.A.; Hietala, S.K.; Carpenter, T.E. Enzootic pneumonia: Comparison of cough and lung lesions as predictors of weight gain in swine. Can. J. Vet. Res. 1995, 59, 197–204. [Google Scholar] [PubMed]
- Krizhevsky, A.; Sutskever, I.; Hinton, G.E. ImageNet classification with deep convolutional neural networks. Commun. ACM 2017, 60, 84–90. [Google Scholar] [CrossRef]
- Voulodimos, A.; Doulamis, N.; Doulamis, A.; Protopapadakis, E. Deep learning for computer vision: A brief review. Comput. Intell. Neurosci. 2018, 7068349. [Google Scholar] [CrossRef]
- LeCun, Y.; Bengio, Y.; Hinton, G. Deep learning. Nature 2015, 521, 436–444. [Google Scholar] [CrossRef] [PubMed]
- Li, G.; Huang, Y.; Chen, Z.; Chesser, G.D.; Purswell, J.L.; Linhoss, J.; Zhao, Y. Practices and applications of convolutional neural network-based computer vision systems in animal farming: A review. Sensors 2021, 21, 1492. [Google Scholar] [CrossRef]
- Trachtman, A.R.; Bergamini, L.; Palazzi, A.; Porrello, A.; Capobianco Dondona, A.; Del Negro, E.; Paolini, A.; Vignola, G.; Calderara, S.; Marruchella, G. Scoring pleurisy in slaughtered pigs using convolutional neural networks. Vet. Res. 2020, 51, 51. [Google Scholar] [CrossRef] [Green Version]
- Wkentaro/labelme: Image Polygonal Annotation with Python (Polygon, Rectangle, Circle, Line, Point and Image-Level Flag Annotation). Available online: https://github.com/wkentaro/labelme (accessed on 8 October 2021).
- Ronneberger, O.; Fischer, P.; Brox, T. U-net: Convolutional networks for biomedical image segmentation. In International Conference on Medical Image Computing and Computer-Assisted Intervention; Navab, N., Hornegger, J., Wells, W., Frangi, A., Eds.; Springer: Cham, Switzerland, 2015; pp. 234–241. [Google Scholar] [CrossRef] [Green Version]
- He, K.; Zhang, X.; Ren, S.; Sun, J. Deep Residual Learning for Image Recognition. In Proceedings of the 2016 IEEE Conference on Computer Vision and Pattern Recognition (CVPR), Las Vegas, NV, USA, 27–30 June 2016; pp. 770–778. [Google Scholar] [CrossRef] [Green Version]
- Zhou, Z.; Rahman Siddiquee, M.M.; Tajbakhsh, N.; Liang, J. Unet++: A nested u-net architecture for medical image segmentation. In Proceedings of the Deep Learning in Medical Image Analysis and Multimodal Learning for Clinical Decision Support—4th International Workshop 2018, Granada, Spain, 20 September 2018; Maier-Hein, L., Syeda-Mahmood, T., Taylor, Z., Lu, Z., Stoyanov, D., Madabhushi, A.J., Tavares, M.R.S., Nascimento, J.C., Moradi, M., Martel, A., et al., Eds.; Springer: Berlin/Heidelberg, Germany, 2018; Volume 11045 LNCS, pp. 3–11. [Google Scholar] [CrossRef] [Green Version]
- Lin, G.; Shen, C.; Hengel, A.; Reid, I. Efficient Piecewise Training of Deep Structured Models for Semantic Segmentation. In Proceedings of the 2016 IEEE Conference on Computer Vision and Pattern Recognition (CVPR), Las Vegas, NV, USA, 26 June–1 July 2016; pp. 3194–3203. [Google Scholar] [CrossRef] [Green Version]
- Chen, L.; Yang, Y.; Wang, J.; Xu, W.; Yuille, A.L. Attention to Scale: Scale-Aware Semantic Image Segmentation. In Proceedings of the 2016 IEEE Conference on Computer Vision and Pattern Recognition (CVPR), Las Vegas, NV, USA, 26 June–1 July 2016; pp. 3640–3649. [Google Scholar] [CrossRef] [Green Version]
- Lee, C.; Xie, S.; Gallagher, P.; Zhang, Z.; Tu, Z. Deeply-Supervised Nets. In Proceedings of the Eighteenth International Conference on Artificial Intelligence and Statistics, San Diego, CA, USA, 10–12 May 2015; pp. 562–570. [Google Scholar]
- Pagot, E.; Pommier, P.; Keïta, A. Relationship between growth during the fattening period and lung lesions at slaughter inswine. Revue Méd. Vét. 2007, 158, 253–259. [Google Scholar]
- Merialdi, G.; Dottori, M.; Bonilauri, P.; Luppi, A.; Gozio, S.; Pozzi, P.; Spaggiari, B.; Martelli, P. Survey of pleuritis and pulmonary lesions in pigs at abattoir with a focus on the extent of the condition and herd risk factors. Vet. J. 2012, 193, 234–239. [Google Scholar] [CrossRef]
- De Luca, S.; Zanardi, E.; Alborali, G.L.; Ianieri, A.; Ghidini, S. Abattoir-Based Measures to Assess Swine Welfare: Analysis of the Methods Adopted in European Slaughterhouses. Animals 2021, 11, 226. [Google Scholar] [CrossRef]
- Pessoa, J.; Rodrigues da Costa, M.; García Manzanilla, E.; Norton, T.; McAloon, C.; Boyle, L. Managing respiratory disease in finisher pigs: Combining quantitative assessments of clinical signs and the prevalence of lung lesions at slaughter. Prev. Vet. Med. 2021, 186, 105208. [Google Scholar] [CrossRef] [PubMed]
- Willeberg, P.; Gerbola, M.A.; Petersen, B.K.; Andersen, J.B. The Danish pig health scheme: Nation-wide computer-based abattoir surveillance and follow-up at the herd level. Prev. Vet. Med. 1984, 3, 79–91. [Google Scholar] [CrossRef]
- Elbers, A.R.W.; Tielen, M.J.M.; Snijders, J.M.A.; Cromwijk, W.A.J.; Hunneman, W.A. Epidemiological studies on lesions in finishing pigs in the Netherlands. Prevalence, seasonality and interrelationship. Prev. Vet. Med. 1992, 14, 217–231. [Google Scholar] [CrossRef]
- Sanchez-Vazquez, M.J.; Strachan, W.D.; Armstrong, D.; Nielen, M.; Gunn, G.J. The British pig health schemes: Integrated systems for large-scale pig abattoir lesion monitoring. Vet. Rec. 2011, 169, 413. [Google Scholar] [CrossRef]
- Harley, S.; More, S.; Boyle, L.; Connell, N.O.; Hanlon, A. Good animal welfare makes economic sense: Potential of pig abattoir meat inspection as a welfare surveillance tool. Ir. Vet. J. 2012, 65, 11. [Google Scholar] [CrossRef] [PubMed]
- Van Staaveren, N.; Teixeira, D.L.; Hanlon, A.; Boyle, L.A. Pig Carcass Tail Lesions: The influence of record keeping through an advisory service and the relationship with farm performance parameters. Anim. Int. J. Anim. Biosci. 2017, 11, 140–146. [Google Scholar] [CrossRef] [Green Version]
- VomBrocke, A.L.; Karnholz, C.; Madey-Rindermann, D.; Gauly, M.; Leeb, C.; Winckler, C.; Schrader, L.; Dippel, S. Tail lesions infattening pigs: Relationships with postmortem meat inspection and influence of a tail biting management tool. Animal 2019, 13, 835–844. [Google Scholar] [CrossRef] [PubMed]
- Available online: www.classyfarm.it (accessed on 1 October 2021).
- Topol, E.J. High-performance medicine: The convergence of human and artificial intelligence. Nat. Med. 2019, 25, 44–56. [Google Scholar] [CrossRef] [PubMed]
- Brünger, J.; Dippel, S.; Koch, R.; Veit, C. ‘Tailception’: Using neural networks for assessing tail lesions on pictures of pig carcasses. Animal 2019, 13, 1030–1036. [Google Scholar] [CrossRef] [Green Version]
- McKenna, S.; Amaral, T.; Kyriazakis, I. Automated classification for visual-only postmortem inspection of porcine pathology. IEEE Trans. Autom. Sci. Eng. 2020, 17, 1005–1016. [Google Scholar] [CrossRef] [Green Version]
- Sibila, M.; Aragón, V.; Fraile, L.; Segalés, J. Comparison of four lung scoring systems for the assessment of the pathological outcomes derived from Actinobacilluspleuropneumoniae experimental infections. BMC Vet. Res. 2014, 10, 165. [Google Scholar] [CrossRef] [PubMed] [Green Version]
- Available online: https://eur-lex.europa.eu/legal-content/IT/TXT/HTML/?uri=CELEX:02019R0627-20211014&from=EN (accessed on 14 October 2021).
- Anonymous. EFSA Panels on Biological Hazards (BIOHAZ), on Contaminants in the Food Chain (CONTAM), and on Animal Health and Welfare (AHAW); Scientific Opinion on the public health hazards to be covered by inspection of meat (swine). EFSA J. 2011, 9, 2351. [Google Scholar] [CrossRef] [Green Version]
- Almqvist, A.; Berg, C.; Hultgren, J. Reliability of remote post-mortem veterinary meat inspections in pigs using augmented-reality live-stream video software. Food Control 2021, 125, 107940. [Google Scholar] [CrossRef]


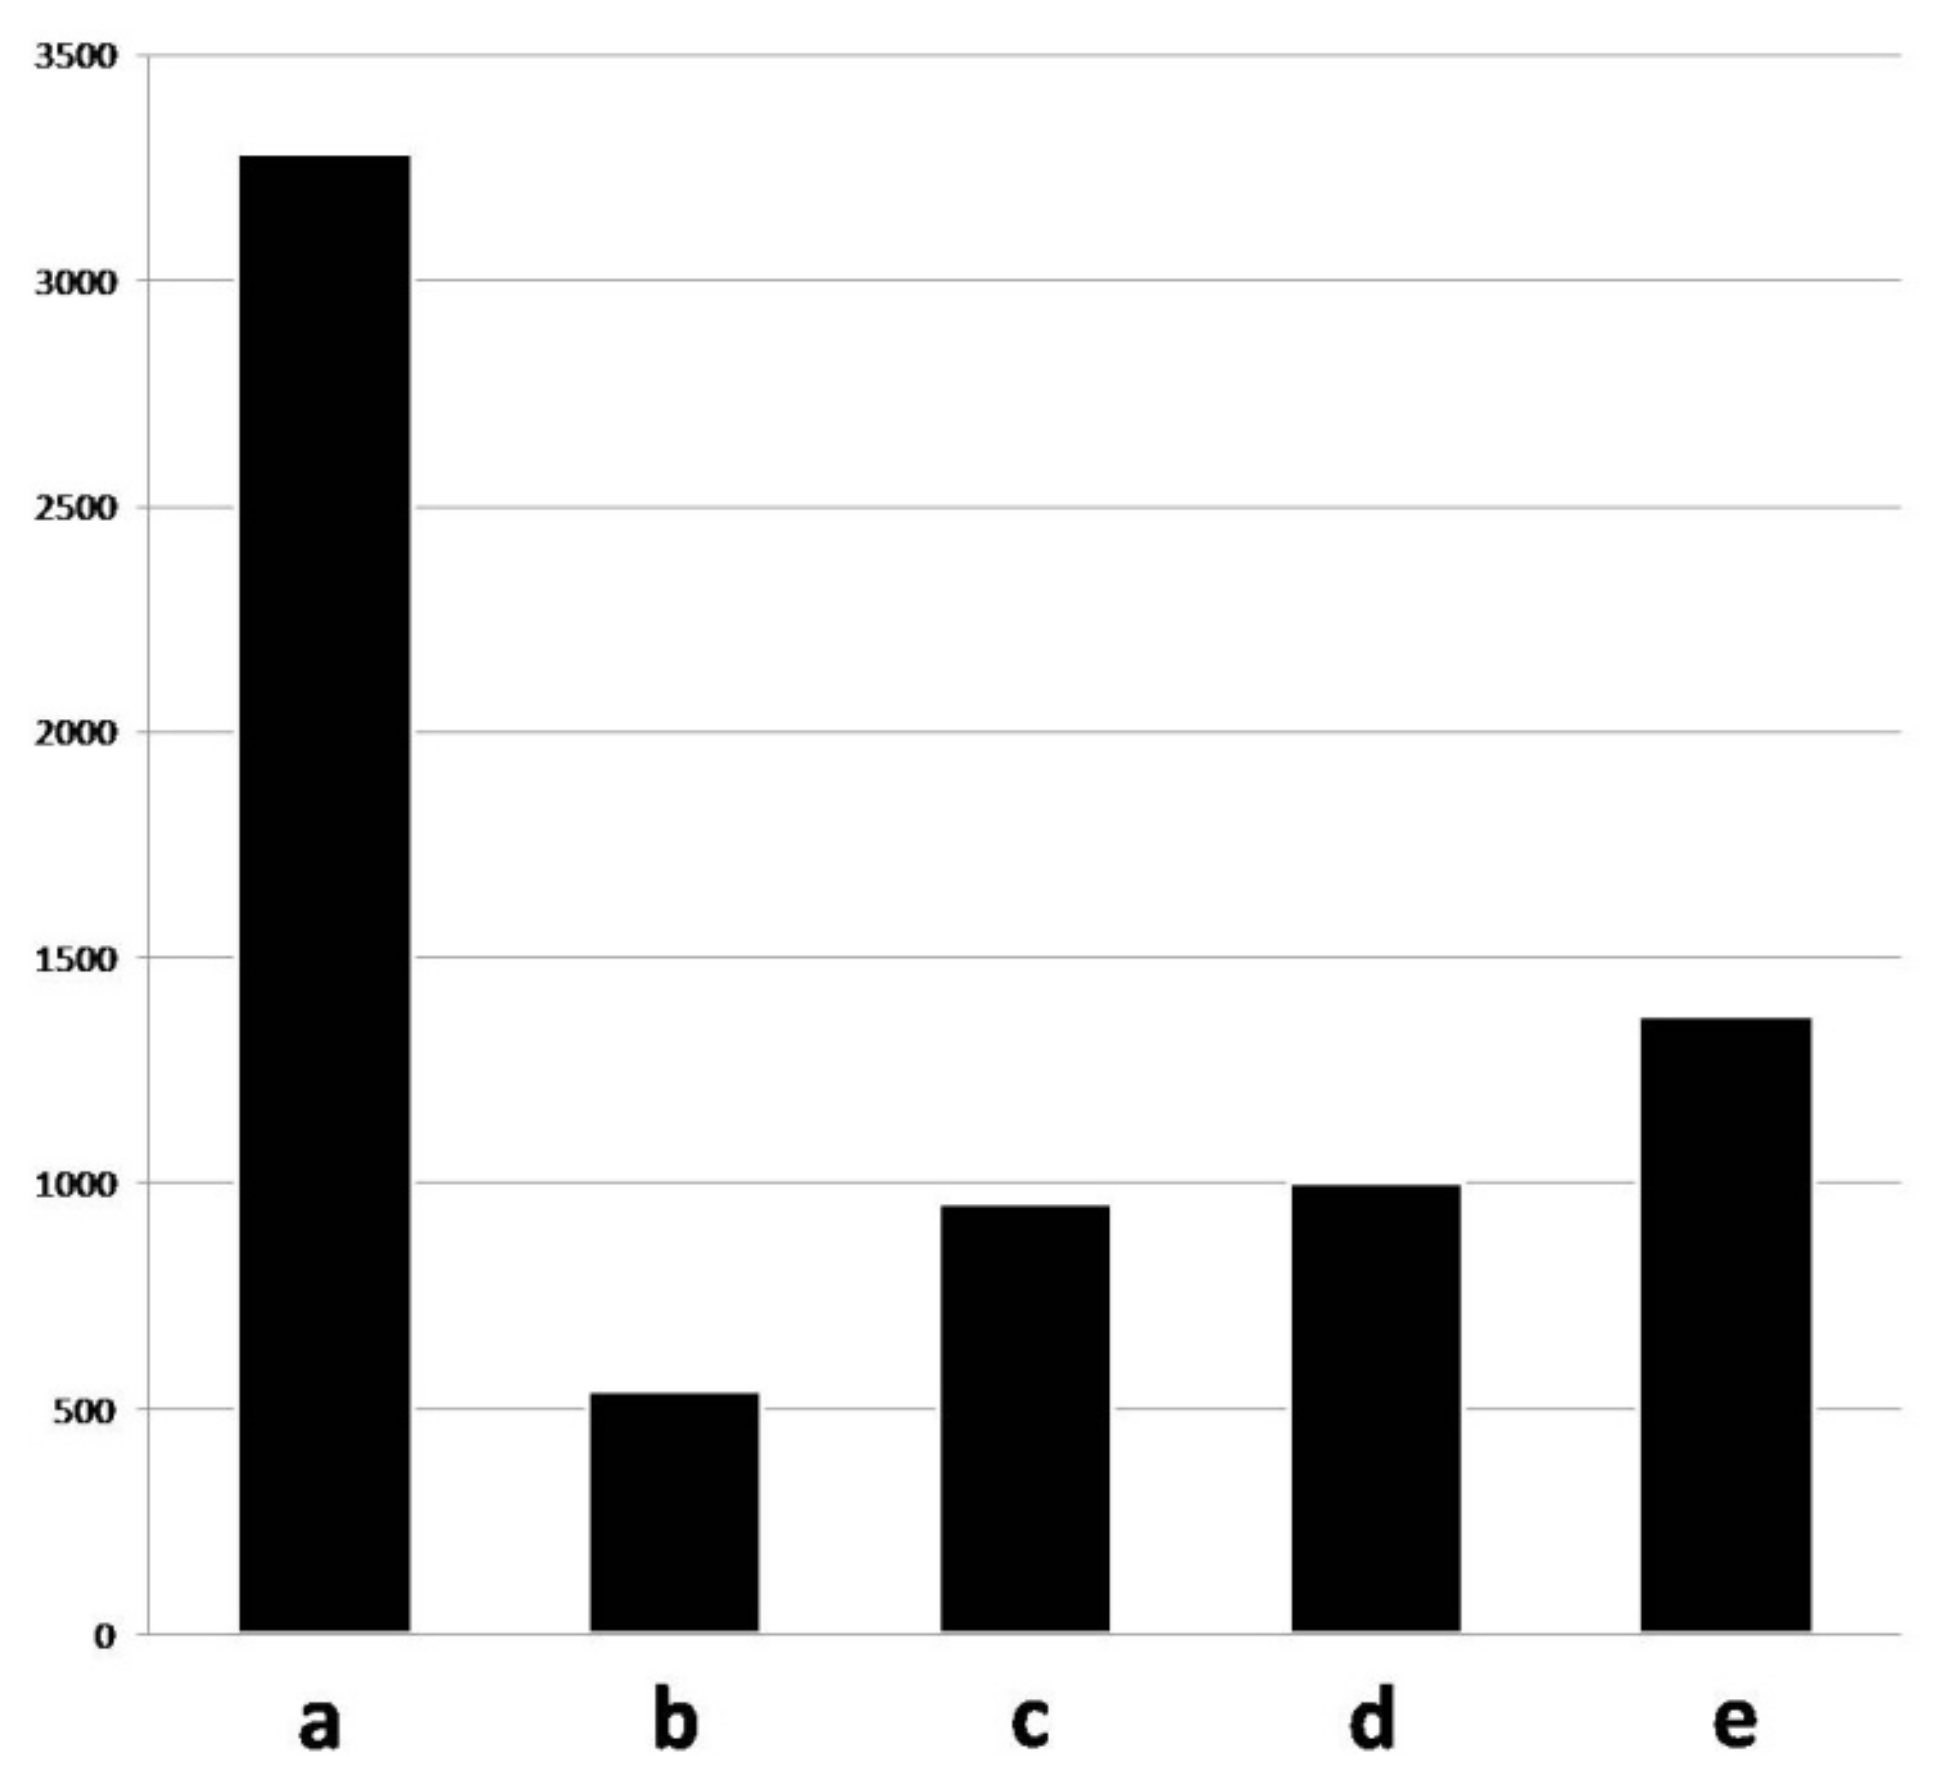
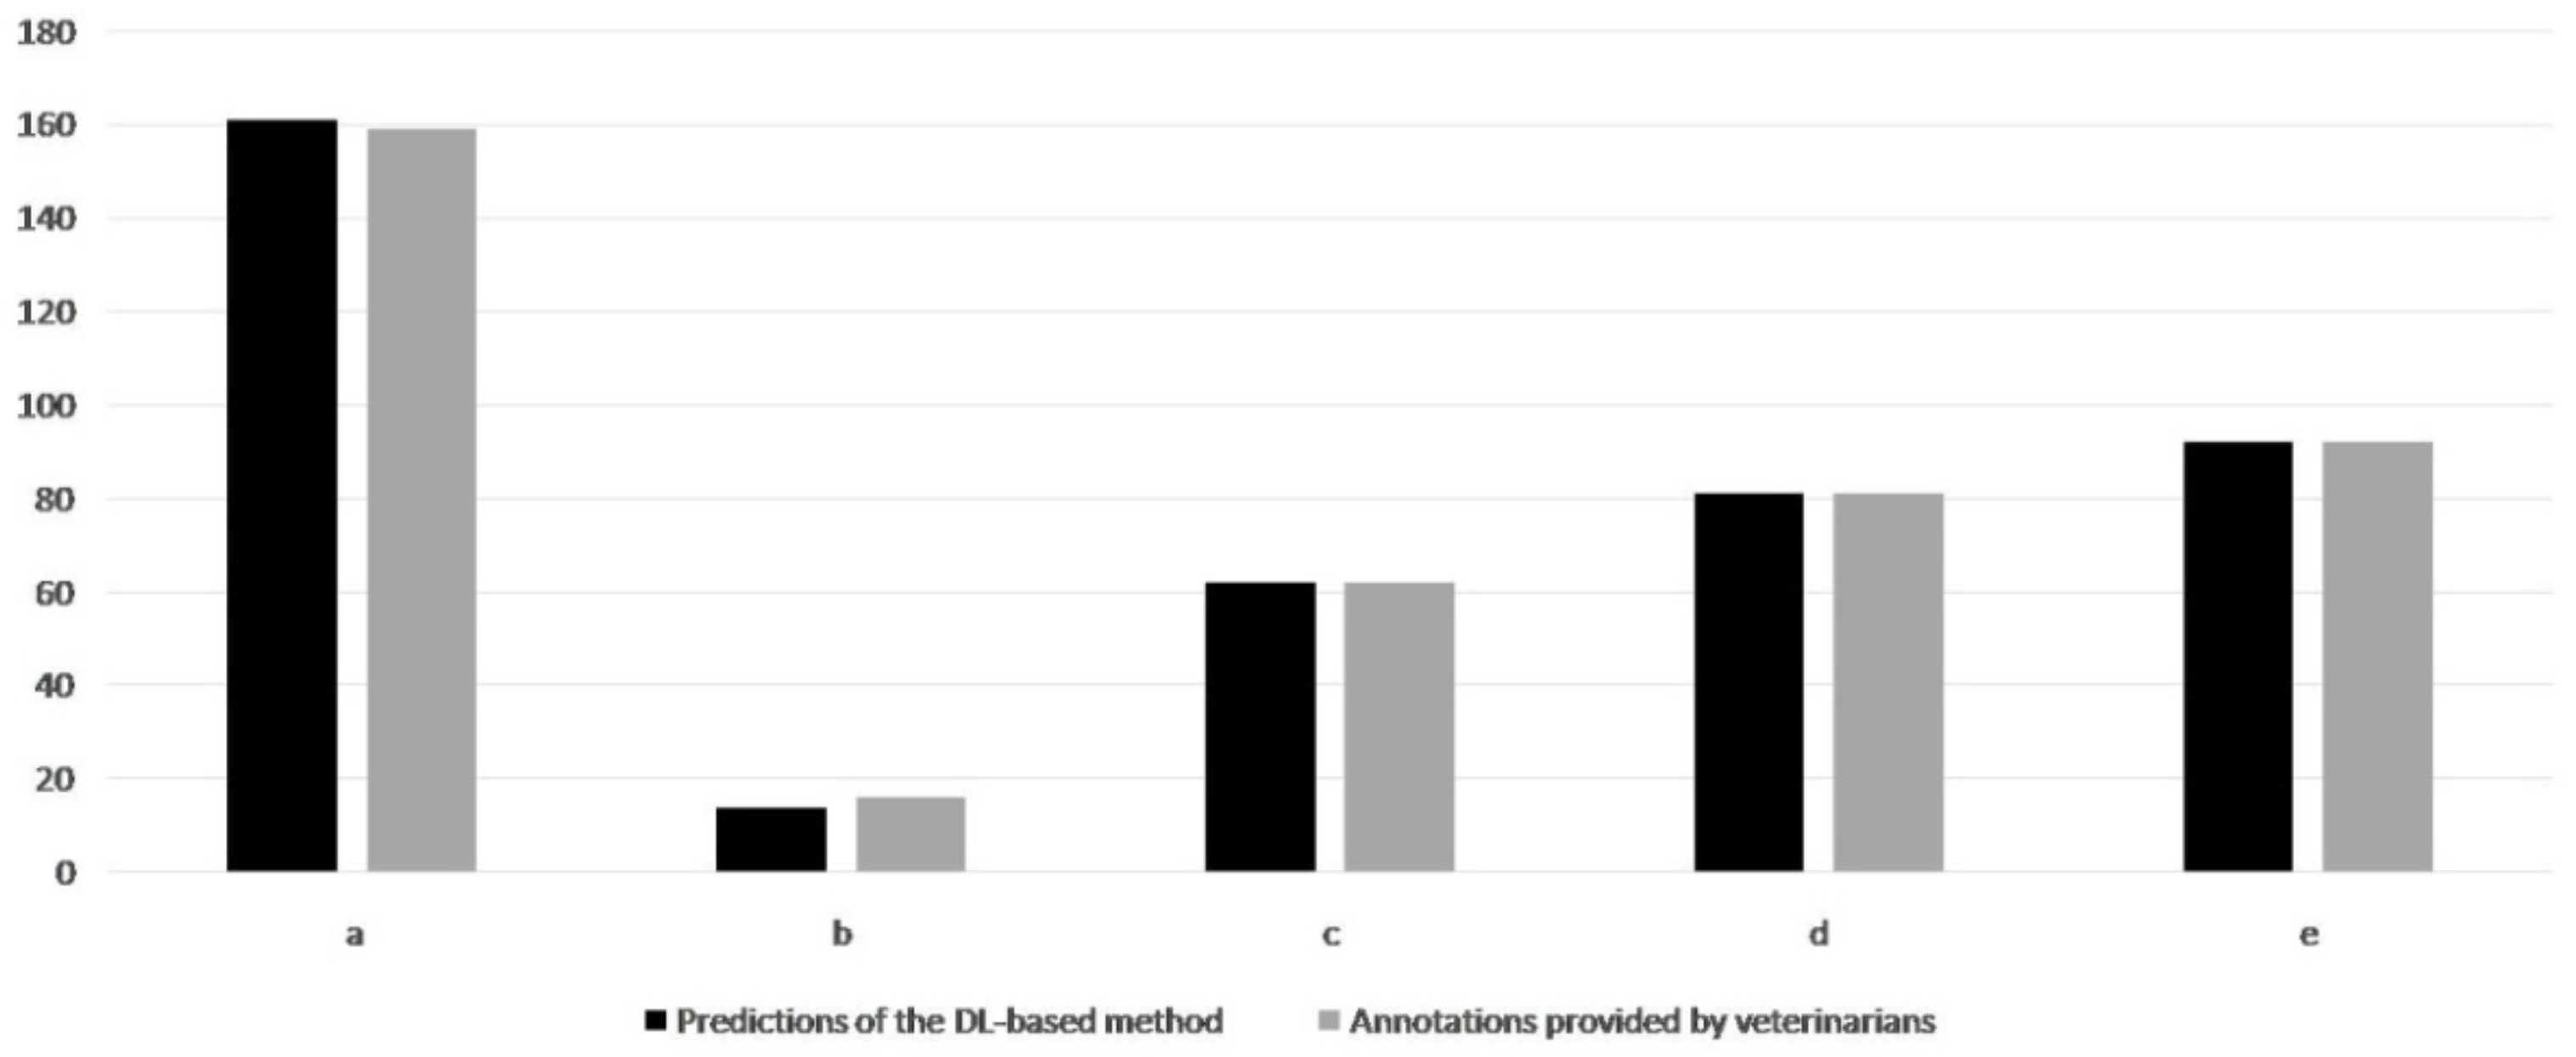
| Number of Pictures, as Interpreted and Annotated by the Veterinarians (Gold Standard) | Number of Pictures Correctly Predicted using the DL-Based Method | Sensitivity (%) | Specificity (%) | |
|---|---|---|---|---|
| Lesion size <2% of the entire lung surface | 16 | 13 | 81.25 | // |
| Lesion size between 2 and 5% of the entire lung surface | 62 | 62 | 100 | // |
| Lesion size between 5 and 10% of the entire lung surface | 81 | 81 | 100 | // |
| Lesions >10% of the entire lung surface | 92 | 92 | 100 | // |
| Healthy lungs | 159 | 158 | // | 99.38 |
| Class | Average Values of IoU |
|---|---|
| Lung | 0.97 |
| Lobe | 0.81 |
| Lesion | 0.80 |
| Lesion size <2% of the entire lung surface | 0.83 |
| Lesion size between 2 and 5% of the entire lung surface | 0.81 |
| Lesion size between 5 and 10% of the entire lung surface | 0.81 |
| Lesions >10% of the entire lung surface | 0.78 |
Publisher’s Note: MDPI stays neutral with regard to jurisdictional claims in published maps and institutional affiliations. |
© 2021 by the authors. Licensee MDPI, Basel, Switzerland. This article is an open access article distributed under the terms and conditions of the Creative Commons Attribution (CC BY) license (https://creativecommons.org/licenses/by/4.0/).
Share and Cite
Bonicelli, L.; Trachtman, A.R.; Rosamilia, A.; Liuzzo, G.; Hattab, J.; Mira Alcaraz, E.; Del Negro, E.; Vincenzi, S.; Capobianco Dondona, A.; Calderara, S.; et al. Training Convolutional Neural Networks to Score Pneumonia in Slaughtered Pigs. Animals 2021, 11, 3290. https://doi.org/10.3390/ani11113290
Bonicelli L, Trachtman AR, Rosamilia A, Liuzzo G, Hattab J, Mira Alcaraz E, Del Negro E, Vincenzi S, Capobianco Dondona A, Calderara S, et al. Training Convolutional Neural Networks to Score Pneumonia in Slaughtered Pigs. Animals. 2021; 11(11):3290. https://doi.org/10.3390/ani11113290
Chicago/Turabian StyleBonicelli, Lorenzo, Abigail Rose Trachtman, Alfonso Rosamilia, Gaetano Liuzzo, Jasmine Hattab, Elena Mira Alcaraz, Ercole Del Negro, Stefano Vincenzi, Andrea Capobianco Dondona, Simone Calderara, and et al. 2021. "Training Convolutional Neural Networks to Score Pneumonia in Slaughtered Pigs" Animals 11, no. 11: 3290. https://doi.org/10.3390/ani11113290
APA StyleBonicelli, L., Trachtman, A. R., Rosamilia, A., Liuzzo, G., Hattab, J., Mira Alcaraz, E., Del Negro, E., Vincenzi, S., Capobianco Dondona, A., Calderara, S., & Marruchella, G. (2021). Training Convolutional Neural Networks to Score Pneumonia in Slaughtered Pigs. Animals, 11(11), 3290. https://doi.org/10.3390/ani11113290