Article

Polymorphisms of the ACSL1 Gene Influence Milk Production Traits and Somatic Cell Score in Chinese Holstein Cows

1
Key Laboratory for Animal Genetics, Breeding, Reproduction and Molecular Design of Jiangsu Province, College of Animal Science and Technology, Yangzhou University, Yangzhou 225009, China
2
Joint International Research Laboratory of Agriculture and Agri-Product Safety of Ministry of Education of China, Yangzhou University, Yangzhou 225009, China
3
Center for Genetic Improvement of Livestock, Department of Animal Biosciences, University of Guelph, Guelph, ON N1G 2W1, Canada
*
Author to whom correspondence should be addressed.
Animals 2020, 10(12), 2282; https://doi.org/10.3390/ani10122282
Submission received: 23 November 2020 / Revised: 29 November 2020 / Accepted: 1 December 2020 / Published: 3 December 2020
(This article belongs to the Section Animal Genetics and Genomics)

Abstract

:

Simple Summary

Milk production traits of cows are important economic indicators of the livestock industry. Many dairy farms strive to improve the quality of their milk. Long-chain acyl-CoA synthetase 1 (ACSL1) is a gene related to lipid metabolism. It is widely found in various organisms and can affect fat content and protein content in milk. Single nucleotide polymorphisms (SNP) refers to the polymorphism of DNA sequence caused by a single nucleotide variation at the gene level, which plays a vital function in the genetic study of milk production traits in dairy cows. Our study identified six SNPs of the ACSL1 gene in Chinese Holstein cows, which were related to milk yield, milk fat content, milk protein content and somatic cell score (SCS) to some extent. In summary, the pleiotropic effects of bovine ACSL1 for milk production traits were found in this paper, which will provide a reference for Chinese Holstein cow breeding selection and high economic benefits.

Abstract

Improving the quality of milk is a challenge for zootechnicians and dairy farms across the globe. Long-chain acyl-CoA synthetase 1 (ACSL1) is a significant member of the long-chain acyl-CoA synthetase gene family. It is widely found in various organisms and influences the lactation performance of cows, including fat percentage, milk protein percentage etc. Our study was aimed to investigate the genetic effects of single nucleotide polymorphisms (SNPs) in ACSL1 on milk production traits. Twenty Chinese Holstein cows were randomly selected to extract DNA from their blood samples for PCR amplification and sequencing to identify SNPs of the bovine ACSL1 gene, and six SNPs (5’UTR-g.20523C>G, g.35446C>T, g.35651G>A, g.35827C>T, g.35941G>A and g.51472C>T) were discovered. Then, Holstein cow genotyping (n = 992) was performed by Sequenom MassARRAY based on former SNP information. Associations between SNPs and milk production traits and somatic cell score (SCS) were analyzed by the least-squares method. The results showed that SNP g.35827C>T was in high linkage disequilibrium with g.35941G>A. Significant associations were found between SNPs and test-day milk yield (TDMY), fat content (FC), protein content (PC) and SCS (p < 0.05). Among these SNPs, SNP 5’UTR-g.20523C>G showed an extremely significant effect on PC and SCS (p < 0.01). The SNP g.35446C>T showed a statistically significant effect on FC, PC, and SCS (p < 0.01), and also TDMY (p < 0.05). The SNP g.35651G>A had a statistically significant effect on PC (p < 0.01). The SNP g.35827C>T showed a highly significant effect on TDMY, FC, and SCS (p < 0.01) and significantly influenced PC (p < 0.05). Lastly, SNP g.51472C>T was significantly associated with TDMY, FC, and SCS (p < 0.05). In summary, the pleiotropic effects of bovine ACSL1 for milk production traits were found in this paper, but further investigation will be required on the intrinsic correlation to provide a theoretical basis for the research on molecular genetics of milk quality traits of Holstein cows.

1. Introduction

Holstein cow is the main breed of dairy cows distributed throughout China. Milk production traits are among the main economic characteristics of Holstein cows, as they are the most direct index to evaluate dairy farms’ management and can directly reflect many problems in the management of dairy cows. The milk production trait of dairy cows is affected by many factors, including genetic, physiological and environmental factors. Some of the key factors directly affect the milk yield level and production potential [1]. Among milk production traits, there was a significant correlation between fat content (FC) and milk yield, protein content (PC), milk urea nitrogen (MUN), and somatic cell count (SCC) [2]. Moreover, mastitis is the most prevalent disease of cows in the world and has led to great economic losses to the dairy industry due to reduced milk production and quality [3]. An indirect strategy of selection for reduced mastitis is based on milk somatic cell score (SCS), which is strongly and positively correlated with clinical mastitis [4].
Recently, significant research progress on the physiology of milk production of Holstein cows has been made [5]. Studies have shown that the detection of single nucleotide polymorphisms (SNPs) and genomes associated with milk production at 305 days could help identify genes associated with milk production traits in cows [6]. For instance, six genes (ACACA, GPAM, ACSL1, FASN, LPIN1 and ACSL6) were significantly up-regulated during lactation in Holstein cows [7]. In addition, 20 novel promising genes associated with milk fatty acid traits in Chinese Holstein cows have been identified through genome-wide association analysis; long-chain acyl-CoA synthetase 1 (ACSL1) is one of them [8].
ACSL1 of cattle (Bos Taurus), located on chromosome 27, contains 20 exons and 19 introns, with a total length of 64,883 bp. As a member of long-chain acyl-CoA synthetase, ACSL1 plays a crucial role in the synthesis of triglycerides, phospholipids and cholesterol esters and the oxidation of fatty acids, and is an important candidate gene for dairy quality traits [9,10]. About 98% of milk fat content is comprised of triglycerides and mainly composed of glycerin and long-chain fatty acids [11]. As a key enzyme in fatty acid metabolism, bovine ACSL1 can produce long-chain fatty acyl-CoA using long-chain fatty acids, adenosine triphosphate, and coenzyme A as substrates [12]. Furthermore, the ACSL1 gene is a candidate gene for the position and function of fatty acid composition in bovine skeletal muscle [13]; the expression level is the highest in buffalo mammary tissue [14]. Therefore, we hypothesized that the SNPs in ACSL1 might contribute to variation in milk production traits and SCS. Thus, this study was aimed to investigate potential associations of SNPs in ACSL1 with milk production traits and SCS in Holstein cows in southern China.

2. Materials and Methods

2.1. Data and Animal Sample Collection

Phenotypic data were comprised of 12,085 test-day records of 992 Chinese Holstein cows from six different farms located in Jiangsu Province, China. These cows were fed in free-tie stalls, milked three times per day, and fed based on a total mixed ration (TMR). The DC305 software (Valley Ag. software, San Francisco, CA, USA) was used for dairy cow management, including data collection. The data were selected to ensure both reliability and consistency for statistical analyses based on the following criteria: test-day milk yield (TDMY) was between 5 and 60 kg, FC was between 2% and 7%, PC was between 2% and 6%, and SCS was between 0 and 9. Finally, 9076 test-day records were included in this study.
The blood samples were obtained from healthy Chinese Holstein cows randomly selected from the above-mentioned 992 cows on dairy farms in Jiangsu province, China. A standard procedure and the traditional phenol–chloroform procedure were used to extract DNA from blood and dissolved it by TE buffer (Tris +EDTA buffer, used as a dissolving agent to protect nucleic acids from enzymatic degradation) [15]. After ensuring the quality and concentration of DNA, some DNA samples were diluted to 100 ng·µL−1 and stored frozen at −20 °C for later use.

2.2. SNP Discovery and Genotyping

Primers used for SNP identification within ACSL1 were designed by Designer software package (Primer Premier 5, PP5, Premier, Ottawa, Canada) according to the sequence provided in GenBank (accession No. NC_037354). PCR temperature gradient was determined by an optimal annealing temperature, (Table 1) and PCR reaction was carried out in a PTC-200 DNA Engine cycler (Bio-Rad, Big Sur, CA, USA). Twenty samples were randomly selected from 992 cow DNA samples to screen for the SNP site and its location. The primer and PCR amplification procedures (total size of the amplification was 8544 bp) were used to amplify the sequence of the selected sites. Finally, 8544 bp of 64,883 bp of the ACSL1 gene were genotyped. The amplification effect was detected by agarose gel electrophoresis and then sequenced by the Shanghai Sangon Company (Shanghai, China). Three software programs, SeqMan (Invitrogen, Carlsbad, CA, USA), SnapGene Viewer (Invitrogen, Carlsbad, CA, USA), and Vector NTI (Invitrogen, Carlsbad, CA, USA), were then used to analyze the sequences and to find the mutation sites and its location. After discovery of the SNP sites, all samples (992, including the previous 20 samples) were genotype by using the MassARRAy system (Sequenom Inc., San Diego, CA, USA). At the same time, twenty samples were repeated twice (the tester did not know that these twenty samples were repeated) in order to ensure the reliability of SNP analysis results. The results showed the accuracy of SNP genotyping to be 100%.

2.3. Statistical Analyses

The statistical chi-square test was used to determine whether the genotype frequencies deviated from the proportions of Hardy–Weinberg equilibrium (HWE). Conventional population genetics statistical analysis (including gene frequency, genotype frequency, HWE, linkage disequilibrium (LD) analysis, etc.) was performed using genetic online software SHEsis (http://analysis.bio-x.cn/ SHEsis Main.htm) [16,17]. The individual haplotype of each cow were inferred by software Beagle 5.1(Brian L. Browning, Washington, USA) [18]. The least-squares method and general linear model (GLM) of SPSS Ver26.0 (IBM, Armonk, New York, NY, USA) were used to analyze the associations between milk production traits /SCS and genotypes and haplotypes [18,19]. The model was as follows:
Yijklmnop = μ + Yeari + Seasonj + Parityk + CSl + DIMm + Fn + Go + eijklmnop
In the above model, Yijklmnop is the dependent variable (here refers to TDMY, FC, PC and SCS); μ is the overall mean; Yeari is the fixed-effect of the ith year (i = 2016 to 2018); Seasonj is the fixed-effect of the jth test season (spring is from March to May, summer is from June to August, autumn is from September to November, and winter is from December to January and February of the following year); Parityk is the fixed-effect of the kth parity (here, the parity of cows is 1 to 3); CSl is the fixed-effect of the lth calving season (here, the division of calving season coincides with the division in test season); DIMm is the fixed-effect of the mth DIM class (DIM is days in milk, here three levels we divided as <100 d, 100 d to 200 d, >200 d); Fn = the fixed-effect of the nth farm (n = 6, six different farms from Jiangsu Province, China); Go = the fixed effect of the oth genotype or haplotype; eijklmnop = the random residual effect. Differences were considered statistically significant at p < 0.05. Duncan’s method was used for multiple comparisons among different levels of factors.

3. Results

3.1. SNPs within ACSL1

Based on the sequencing of the whole gene, six new SNPs in Holstein ACLS1 were found. Among them, g.20523C>G was located in 5’UTR; g.35446C>T, g.35651G>A, g.35827C>T, and g.35941G>A were located in intron 2; and g.51472C>T was located in intron 11. Details of the six SNP positions in ACLS1 are illustrated in Figure 1. The observed genotypic and allelic frequencies of SNPs in ACSL1 are summarized in Table 2. The number of animals with six specific SNPs are 984, 987, 987, 986, 971 and 984 for g.20523C>G, g.35446C>T, g.35651G>A, g.35827C>T, g.35941G>A and g.51472C>T, respectively (Table 2). The r2 value was 0.98 between g.35827C>T and g.35941G>A, and the r2 values between other SNP pairs were all less than 0.4, as shown in Figure 2. Fifteen haplotypes were reconstructed for the SNPs (Table 3), and the frequency of haplotype CCGCGC was the highest (0.31), followed by haplotype CCGTAC (0.268).

3.2. Effects of Different Non-Genetical Factors on Milking Traits and SCS of Holstein Cows

The effects of different non-genetical factors on milk production traits and SCS is shown in Table 4. Test year, test season, parity, calving season, days in milk and different farms showed highly significant effects on TDMY, PC and SCS (p < 0.01). Test season, calving season, days in milk and different farms showed highly significant effects on FC (p < 0.01), and test year had significant effects on FC (p < 0.05).

3.3. Associations of SNPs in ACSL1 with Milking Traits and SCS

Since SNPs g.35827C>T and g.35941G>A were almost completely linked, we analyzed the association of five SNPs (5’UTR-g.20523C>G, g.35446C>T, g.35651G>A, g.35827C>T and g.51472C>T) with milking traits and SCS. The estimated effects of ACSL1 on milk production traits and SCS are presented in Table 5. The SNP 5’UTR-g.20523C>G showed a highly significant effect on PC and SCS (p < 0.01). The PC of the CC genotype was significantly lower than that of the CG and GG genotype (p < 0.05), and the SCS of the CC genotype was significantly higher than that of the CG and GG genotype (p < 0.05). With the increase in C>G, PC showed an upward tendency, while SCC showed a downward tendency. The SNP g.35446C>T showed a statistically significant effect on FC, PC and SCS (p < 0.01), and had a significant effect on TDMY (p < 0.05). Among them, the TDMY and PC of the TT genotype were significantly higher than those of the CC genotype (p < 0.05), and the FC and SCS of the TT genotype were significantly lower than those of the CC genotype (p < 0.05). Furthermore, with the increase in C>T, TDMY showed an upward tendency. The SNP g.35651G>A showed an extremely significant effect on PC (p < 0.01). Specifically, the PC of the GG genotype was significantly higher than that of the GA and AA genotype (p < 0.05); PC showed a downward tendency with the increase in G>A. The SNP g.35827C>T showed a highly significant effect on TDMY, FC, and SCS (p < 0.01) and significantly affected PC (p < 0.05). Moreover, TDMT, FC, PC and SCS all showed downward tendencies with the increase in C>T. For the SNP g.35827C>T, the TDMY and FC of the TT genotype were significantly lower than those of the CC and TC genotypes (p < 0.05), and the PC and SCS of the CC genotype were significantly higher than those of the TC and TT genotypes (p < 0.05). The SNP g.51472C>T showed significant effects on TDMY, FC and SCS (p < 0.05). For the SNP g.51472C>T, the TDMY and FC of the TT genotype were significantly lower than those of the CC and TC genotypes (p < 0.05), and TDMY and FC both showed upward tendencies with the increase in C>T.

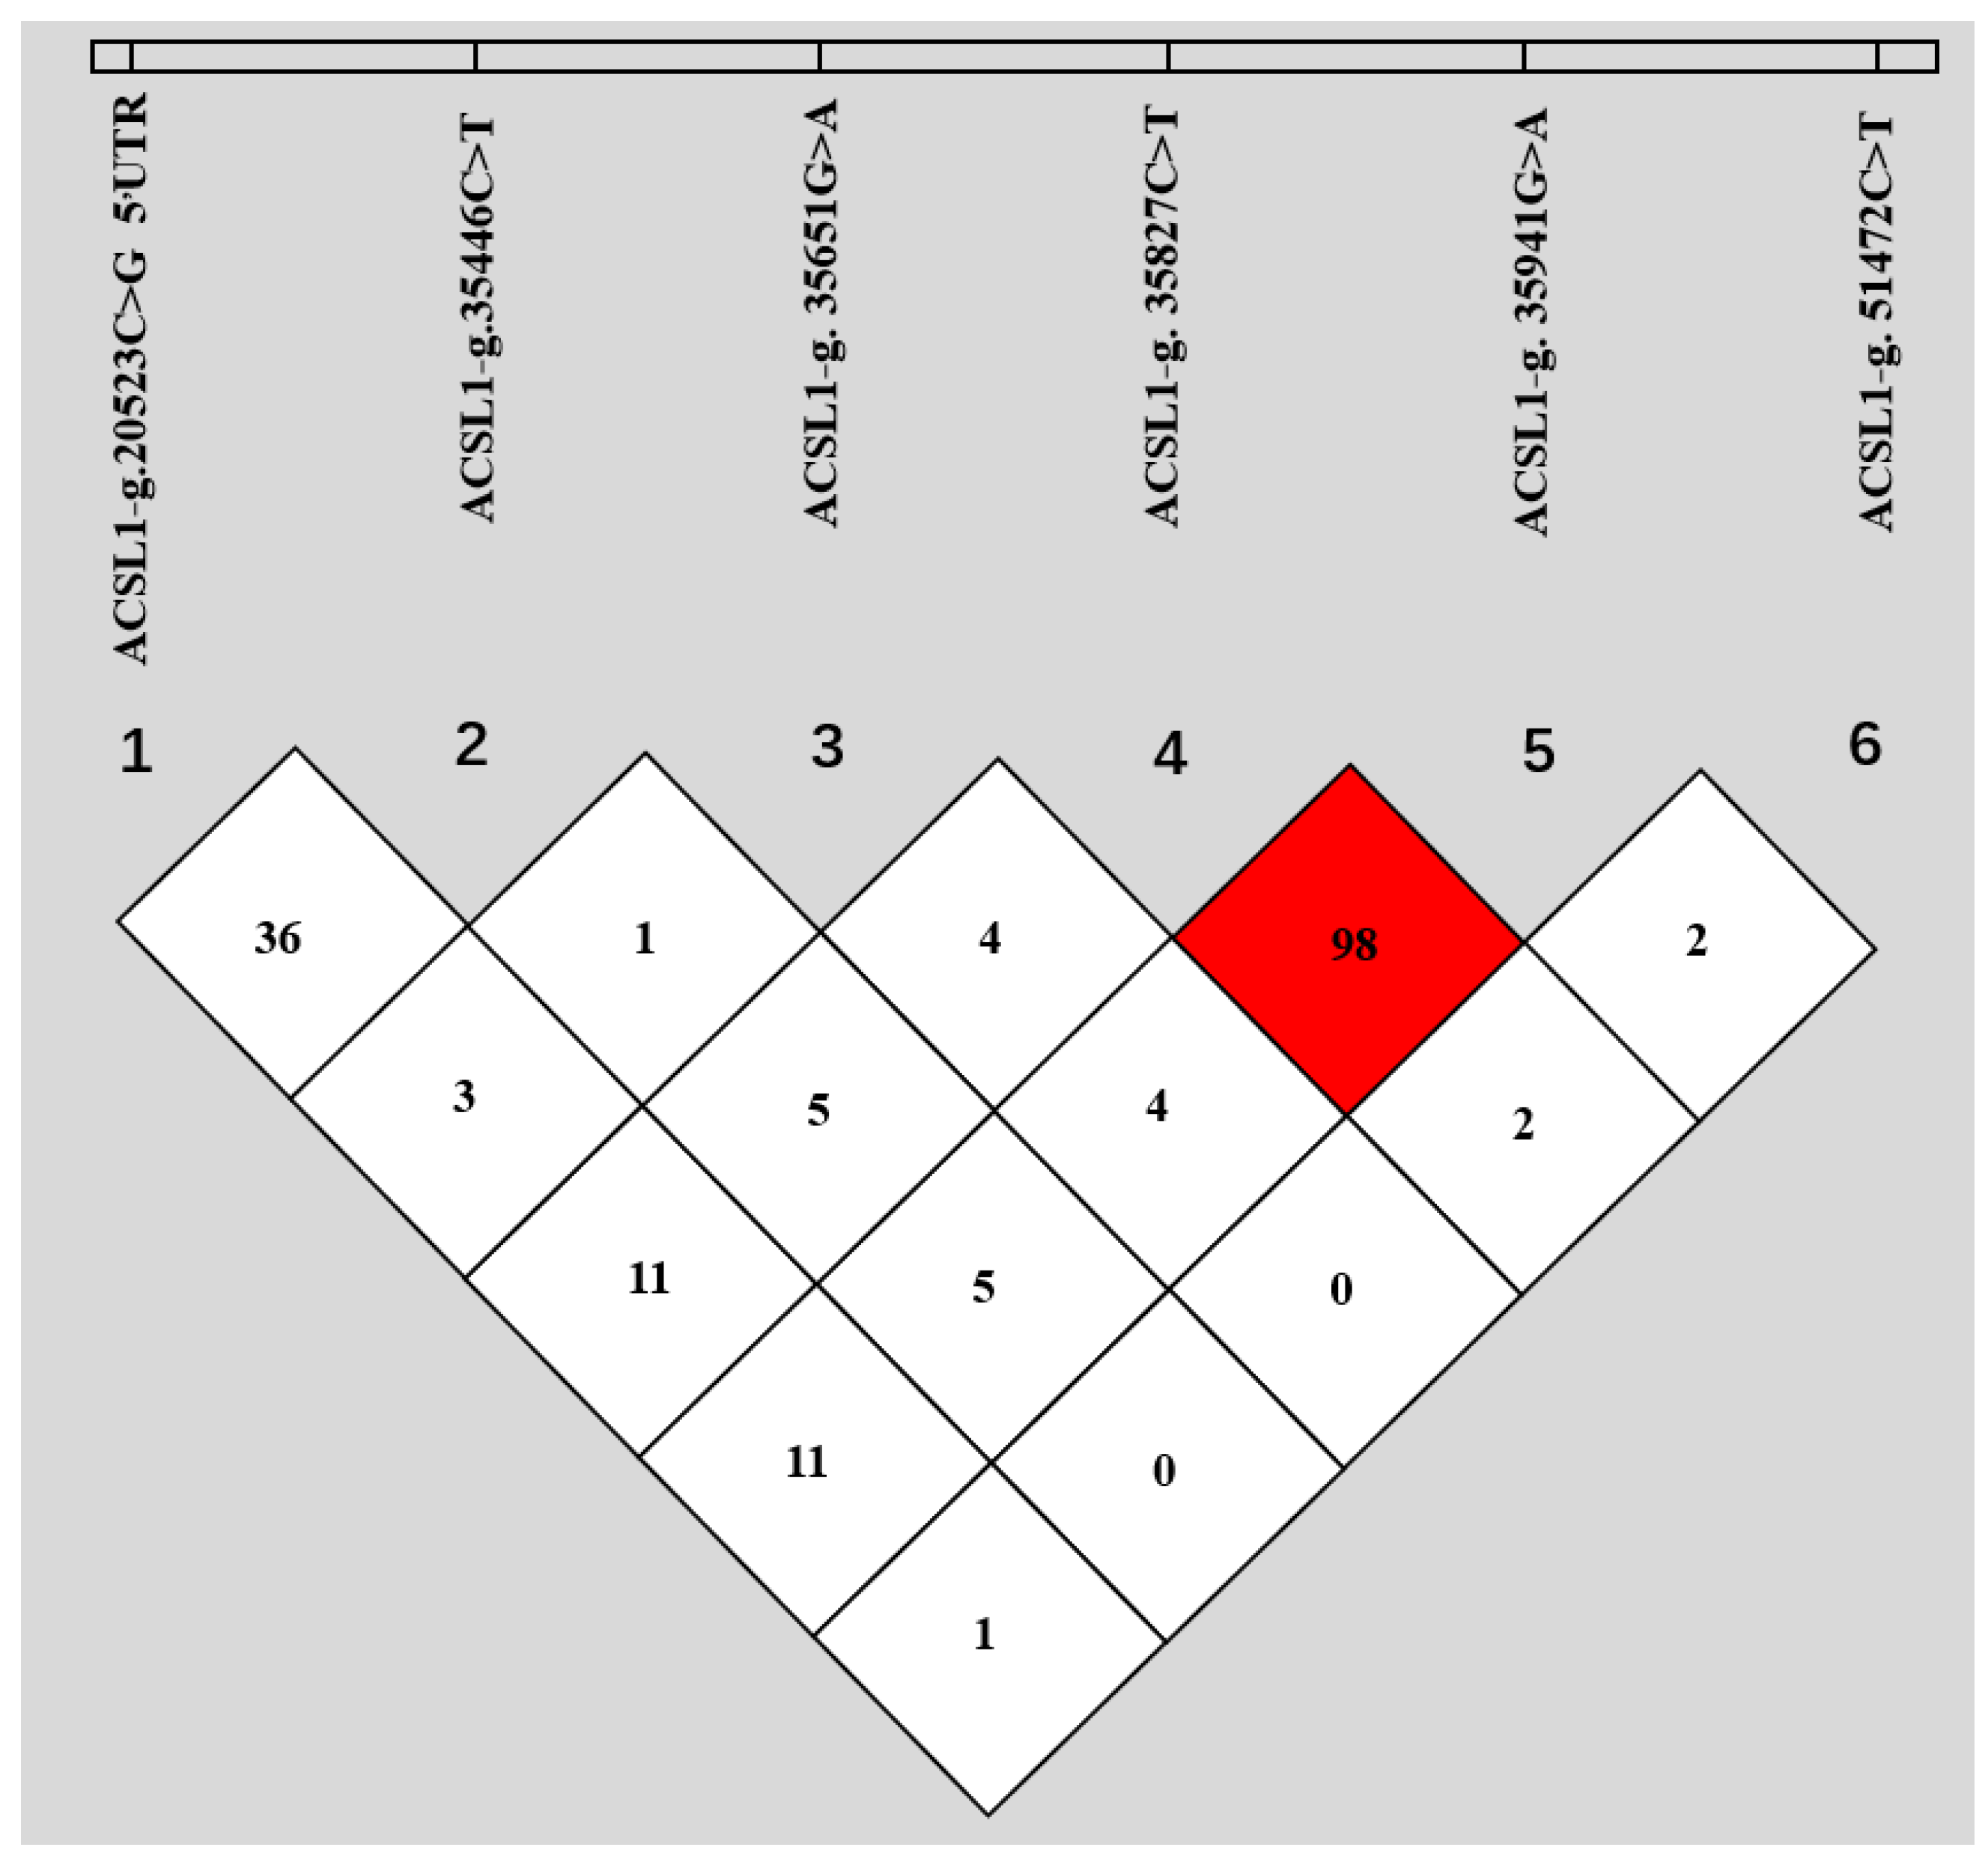
3.4. Associations of Haplotypes for SNPs in ACSL1 with Milking Traits and SCS

The estimated effects of haplotypes for SNPs of ACSL1 on milk production traits and SCS are presented in Table 6. We retained eleven haplotypes with higher frequencies to analyze and found that different haplotypes of SNPs in ACSL1 had extremely significant effects on TDMY, FC, PC and SCS (p < 0.01). The TDMY of cows with haplotype CCGCGT was 38.91 kg and significantly higher than the TDMY of haplotype CCGCGC, CCGTAC, GGCTGC, CCACGC, CTGCGC, GCCTGC and GCGCAC (p < 0.05). The FC of milk with haplotype GCGCAC was 4.15%, which was significantly higher than other haplotypes (p < 0.05); the FC of milk with haplotype GTGCGC was 3.49% and significantly lower than haplotype CTGCGC, CCGCGT and GCGCAC. For the PC of cows, the content of haplotype GCGCAC was the highest in all eleven haplotypes (3.38%), and haplotype CCGCAC was the lowest (3.21%). The SCS of milk with haplotype GCGTGC was 1.92, and was significantly lower than haplotype CCGCGC, CCGCAC, CCGTAC, CCGTGC, CCACGC, CTGCGC and CCGCGT (p < 0.05). Moreover, the dairy herd improvement (DHI) record number of haplotype CCGCGC was the maximum (4116), and that of haplotype GCGCAC was the minimum (55). In general, cows with haplotype GCGCAC had higher FC and PC, those with haplotype CCGCGT had higher TDMY, and those with haplotype GCGTGC had the lowest SCS.

4. Discussion

ACSL1 is highly expressed in tissues associated with energy metabolism, such as liver, fat, muscle, and breast tissue [13,20]. Hoashi etc. [21] found three polymorphic loci in the second exon (282 bp C/T, 516 bp C/G, 1938 bp T/G) of ACSL1 in Japanese black cattle. Still, there was no correlation analysis between the polymorphic locus and production traits or milk quality traits. To date, very little information is available about the importance of ACSL1 in milk production.
In our study, a total of six novel SNPs were identified in ACSL1 in Holsteins, and SNPs g.35827C>T and g.35941G>A were in LD. Therefore, five of these SNPs were chosen for further screening to evaluate their potential associations with milk production traits. These SNPs were found to be significantly associated with milk production traits. This research is the first study to examine SNPs’ associations in ACSL1 with the milk production traits of Holstein cows to the best of our knowledge. Bionaz et al. [22] reported the expression changes of ACSL1 during lactation in lactating cows and found that the expression of ACSL1 was upregulated with lactation. In the present study, we found that the SNPs in ACSL1 were significantly associated with milk production traits and SCS in Holstein cows. The SNPs g.35446C>T, g.35827C>T, and g.51472C>T showed significant associations with TDMY. Furthermore, we found that the SNPs g.35446C>T, g.35827C>T, and g.51472C>T showed significant effects on FC. In bovine mammary tissue, ACSL1 facilitates the absorption of esterified long-chain fatty acids in fat cells and plays a key role in bovine fat synthesis and fatty acid beta-oxidation [22]. A polymorphism in the yak ACSL1 gene promoter region also significantly affects FC [23,24]. The above results support the hypothesis that ACSL1 plays an important role in milk fat synthesis.
The above studies have shown that the SNPs in ACSL1 have significant effects on the lactation performance of Holstein cows. The 5’UTR-g.20523C>G is an SNP located in the 5’-nontranslated region, which contains an internal ribosome entry site that can mediate the internal translation initiation of messenger RNA [25]. Thus, the expression of ACSL1 may be affected by 5’UTR-g.20523C>G, which has an influence on the metabolism of milk fat in Holstein cows and ultimately affects some milk production traits. For the other five SNPs that we found in the intron region, they were all shear sites near the exons upstream and downstream. Mutations at intron splicing sites have been found to cause activation of adjacent covert splicing sites, allowing mature mRNA molecules to retain an intron or snip off an exon, thereby affecting gene expression [26,27]. Additionally, many studies have revealed that introns have positive and negative regulatory effects on gene expression and may have some functions of promoters, and intron mutations in some genes may also cause changes in gene expression levels [22,28]. Thus, although SNPs in the intron region do not cause changes in amino acids, they may affect protein formation by affecting gene splicing. Besides, due to the interaction between environment and genes, natural selection, and other factors (in this experiment, Holstein cows from southern China were selected), lactation performance and SCS of Holstein cows were different.

5. Conclusions

Six SNPs (5’UTR-g.20523C>G, g.35446C>T, g.35651G>A, g.35827C>T, g.35941G>A and g.51472C>T) of ACSL1 were investigated in Chinese Holstein cows. Associations between these SNPs and TDMY, FC, PC, and SCS were significant. However, these associations will require further investigation concerning their impact on biological and practical relevance because of these SNPs’ potential to alter gene expression.

Author Contributions

Conceptualization, Y.M.; data curation, Y.L.; formal analysis, Q.G.; funding acquisition, Y.M. and Z.Y.; investigation, Y.L., Q.G. and Q.Z.; methodology, M.L.; resources, Q.G. and Q.Z.; software, Y.L. and Q.G.; validation, Y.M.; writing original draft, Y.L.; writing review and editing, A.A.I.A., Y.M. and N.A.K. All authors have read and agreed to the published version of the manuscript.

Funding

The research received financial support from the National Natural Science Foundation of China (31972555), Natural Science Research Project of Colleges and Universities in Jiangsu Province(18KJA230003), Jiangsu Province “Six talent peaks” Project Funding (ny-093), and Modern Agricultural Development Project of Jiangsu Province (2019-SJ-039-08-04).

Conflicts of Interest

The authors declare that they have no conflict of interest.

References

  1. Oliveira, H.R.; Cant, J.P.; Brito, L.F.; Feitosa, F.L.B.; Chud, T.C.S.; Fonseca, P.A.S.; Jamrozik, J.; Silva, F.F.; Lourenco, D.A.L.; Schenkel, F.S. Genome-wide association for milk production traits and somatic cell score in different lactation stages of Ayrshire, Holstein, and Jersey dairy cattle. J. Dairy Sci. 2019, 102, 8159–8174. [Google Scholar] [CrossRef] [PubMed]
  2. Jattawa, D.; Koonawootrittriron, S.; Elzo, M.A.; Suwanasopee, T. Somatic cells count and its genetic association with milk yield in dairy cattle raised under Thai tropical environmental conditions. Asian Australas J. Anim. 2012, 25, 1216–1222. [Google Scholar] [CrossRef] [PubMed] [Green Version]
  3. Gussmann, M.; Steeneveld, W.; Kirkeby, C.; Hogeveen, H.; Farre, M.; Halasa, T. Economic and epidemiological impact of different intervention strategies for subclinical and clinical mastitis. Prev. Vet. Med. 2019, 166, 78–85. [Google Scholar] [CrossRef] [PubMed]
  4. Rupp, R.; Boichard, D. Genetic parameters for clinical mastitis, somatic cell score, production, udder type and milking easy in first lactation Holsteins. J. Dairy Sci. 1999, 82, 2198–2204. [Google Scholar] [CrossRef]
  5. Akers, R.M. A 100-Year Review: Mammary development and lactation. J. Dairy Sci. 2017, 100, 10332–10352. [Google Scholar] [CrossRef]
  6. Clancey, E.; Kiser, J.N.; Moraes, J.G.N.; Dalton, J.C.; Spencer, T.E.; Neibergs, H.L. Genome-wide association analysis and gene set enrichment analysis with SNP data identify genes associated with 305-day milk yield in Holstein dairy cows. Anim. Genet. 2019, 50, 254–258. [Google Scholar] [CrossRef]
  7. Bionaz, M.; Loor, J.J. Gene networks driving bovine mammary protein synthesis during the lactation cycle. Bioinform. Biol. Insights 2011, 5, 83–98. [Google Scholar] [CrossRef]
  8. Li, C.; Sun, D.X.; Zhang, S.L.; Wang, S.; Wu, X.P.; Zhang, Q.; Liu, L.; Li, Y.H.; Qiao, L. Genome Wide Association Study Identifies 20 Novel Promising Genes Associated with Milk Fatty Acid Traits in Chinese Holstein. PLoS ONE 2014, 9, e96186. [Google Scholar] [CrossRef] [Green Version]
  9. Soupene, E.; Dinh, N.P.; Siliakus, M.; Kuypers, F.A. Activity of the acyl-CoA synthetase ACSL6 isoforms: Role of the fatty acid Gate-domains. BMC Biochem. 2010, 11, 18. [Google Scholar] [CrossRef] [Green Version]
  10. Ellis, J.M.; Li, L.O.; Wu, P.C.; Koves, T.; Ilkayeva, O.; Stevens, R.D.; Watkins, S.M.; Muoio, D.M.; Coleman, R.A. Adipose Acyl-CoA Synthetase-1 Directs Fatty Acids toward β-Oxidation and Is Required for Cold Thermogenesis. Cell Metab. 2010, 12, 64. [Google Scholar] [CrossRef] [Green Version]
  11. Harris, C.A.; Haas, J.; Streeper, R.S.; Stone, S.J.; Kumari, M.; Yang, K.; Han, X.L.; Brownell, N.; Gross, R.W.; Zechner, R.; et al. DGAT enzymes are required for triacylglycerol synthesis and lipid droplets in adipocytes. J. Lipid Res. 2011, 52, 657–667. [Google Scholar] [CrossRef] [PubMed] [Green Version]
  12. Bernard, L.; Rouel, J.; Leroux, C.; Ferlay, A.; Faulconnier, Y.; Legrand, P.; Chilliard, Y. Mammary lipid metabolism and milk fatty acid secretion in alpine goats fed vegetable lipids. J. Dairy Sci. 2005, 88, 1478–1489. [Google Scholar] [CrossRef] [Green Version]
  13. Widmann, P.; Nuernberg, K.; Kuehn, C.; Weikard, R. Association of an ACSL1 gene variant with polyunsaturated fatty acids in bovine skeletal muscle. BMC Genet. 2011, 12, 96. [Google Scholar] [CrossRef] [PubMed] [Green Version]
  14. Liang, S.S.; Pang, C.Y.; Deng, T.X.; Ma, X.Y.; Lu, X.R.; Duan, A.Q.; Liang, X.W. Expression of ACSL1 and Its Effect on Expression Involved in Fatty Acid Metabolism in Buffalo. Chin. J. Anim. Sci. 2020, 56, 41–45. [Google Scholar] [CrossRef]
  15. Winfrey, M.R.; Rott, M.A.; Wortman, A. Unraveling DNA: Molecular Biology for the Laboratory, 1st ed.; Prentice Hall: Upper Saddle River, NJ, USA, 1997; pp. 234–248. [Google Scholar]
  16. Hill, W.G.; Robertson, A. Linkage disequilibrium in finite populations. Theor. Appl. Genet. 1968, 38, 226–231. [Google Scholar] [CrossRef]
  17. Shi, Y.Y.; He, L. SHEsis, a powerful software platform for analyses of linkage disequilibrium, haplotype construction, and genetics association at polymorphism loci. Cell Res. 2005, 15, 97–98. [Google Scholar] [CrossRef]
  18. Browning, B.L.; Zhou, Y.; Browning, S.R. A one-penny imputed genome from next generation reference panels. Am. J. Hum. Genet. 2018, 103, 338–348. [Google Scholar] [CrossRef] [Green Version]
  19. Mao, Y.J.; Zhu, X.R.; Xing, S.Y.; Zhang, M.R.; Zhang, H.M.; Wang, X.L.; Karrow, N.; Yang, L.G.; Yang, Z.P. Polymorphisms in the promoter region of the bovine lactoferrin gene influence milk somatic cell score and milk production traits in Chinese Holstein cows. Res. Vet. Sci. 2015, 103, 107–112. [Google Scholar] [CrossRef]
  20. Muoio, D.M.; Lewin, T.M.; Wiedmer, P.; Coleman, R.A. Acyl-CoAs are functionally channeled in liver: Potential role of acyl-CoA synthetase. Am. J. Physiol. Endocrinol. Metab. 2000, 279, E1366–E1373. [Google Scholar] [CrossRef]
  21. Hoashi, S.; Hinenoya, T.; Tanaka, A.; Ohsaki, H.; Mannen, H. Association between fatty acid compositions and genotypes of FABP4 and LXR-α in Japanese black cattle. BMC Genet. 2008, 9, 84. [Google Scholar] [CrossRef] [Green Version]
  22. Bionaz, M.; Loor, J.J. ACSL1, AGPAT6, FABP3, LPINI, and SLC27A6 are the most abundant isoforms in bovine mammary tissue and their expression is affected by stage of lactation. J. Nutr. 2008, 138, 1019–1024. [Google Scholar] [CrossRef] [PubMed]
  23. Zhao, Z.D.; Tian, H.S.; Jiang, Y.Y.; Shi, B.G.; Liu, X.; Li, X.P.; Wang, D.Z.; Chen, J.L.; Hu, J. Association analysis of ACSL1 gene promoter polymorphism and dairy quality traits in yak. J. Agric. Biol. 2019, 27, 1596–1630. [Google Scholar]
  24. Zhao, Z.D. Transcriptional Regulation Study of the Bovine ACSL1 Gene. Ph.D. Thesis, Northwest A & F University, Xianyang, China, 2016; pp. 1–2. [Google Scholar]
  25. Cullen, B.R. Nuclear RNA Export Pathways. Mol. Cell. Biol. 2000, 20, 4181–4187. [Google Scholar] [CrossRef] [PubMed] [Green Version]
  26. Rose, A.B. Intron-Mediated Regulation of Gene Expression. Curr. Top. Microbiol. 2008, 326, 277–290. [Google Scholar]
  27. Casas, E.; White, S.N.; Riley, D.G.A.; Smith, T.; Brenneman, R.; Olson, T.A.; Johnson, D.; Coleman, S.; Bennett, G.L.; Chase, C.C. Assessment of single nucleotide polymorphisms in genes residing on chromosomes 14 and 29 for association with carcass composition traits in Bos indicus cattle. J. Anim. Sci. 2005, 83, 13–19. [Google Scholar] [CrossRef] [PubMed] [Green Version]
  28. Ringnér, M.; Krogh, M. Folding Free Energies of 5’UTRs Impact Post-Transcriptional Regulation on a Genomic Scale in Yeast. PLoS Comput. Biol. 2005, 1, 72. [Google Scholar] [CrossRef]
Figure 1. Long-chain acyl-CoA synthetase 1 gene (ACSL1) with the localization of the six identified single nucleotide polymorphisms (SNPs).
Animals 10 02282 g001
Figure 2. Linkage disequilibrium (LD) among the six SNPs of bovine ACSL1. The values in boxes are pairwise SNP correlations (r2), and the bright red box indicates approximate complete LD (r2 = 1).
Animals 10 02282 g002
Table 1. Primer information of PCR amplification for long-chain acyl-CoA synthetase 1 (ACSL1) genes.
Primer NamePrimer Sequences (5′→3′)Size(bp)ExonPositionTm (°C)
P1F1: AACCCAGCGTGACCTGTTTCACCAG9635’UTR + Exon 1−484~+47969
R1: ATGAGCCTCTGCTCCGTGTGTAACG
P2F2: GTCCATGCAGCAAACACTCACCC1070Exon 2,3 + Intron 2,3+14,601~+15,64864
R2: CAACCTACAGAGGCTCCAGAAA
P3F3: ACTGGGCAAGTGTTTTGTTCATTAG1034Exon 5,6 + Intron 5,6+21,364~+22,37363
R3: TCGCTCAGTCATGTCCGACTCTTAG
P4F4: TCAGCTTGAACTGACTTGATGTGAC1382Exon 7–9 + Intron 7–9+24,637~+25,99464
R4: ATAGTCCGGGCCTAACATGATGGTG
P5F5: AAGTCCTGCATGGATTTACTTTGTC485Exon 10 + Intron 10+28,070~+28,53063
R5: GAACTGCCTACGGGGAAGATGG
P6F6: AAGCCACATTCCCTAGTTGCTG1028Exon 11 + Intron 11+30,241~+31,24760
R6: GCACTATGAAAGTGGAGGCATC
P7F7: TTCCAGTTTCTCCACATCTTCAC1291Exon 12,13 + Intron 12,13+32,505~+33,77359
R7: ACACATCCGAAGAAAAGAAGGG
P8F8: GGGTCTTTATCCCTTCAGAGGC1291Exon 19 + 3’UTR+42,584~+43,85360
R8: CCTATGTCCTAGAATTTTGGCTTG
Table 2. Genotypic and allelic frequency, and values of chi-square test significance for SNPs of ACSL1 genes in Chinese Holstein cows.
SNP LocusLocationNumberGenotypesGenotype FrequencyAlleleAllele FrequencyChi-Square Value for HWE Test
5’UTR-g.20523C>G 581CC0.590C0.764.700
5’UTR334CG0.339G0.24
69GG0.070
g.35446C>T 770CC0.780C0.87134.399
Intron 2180CT0.182T0.129
37TT0.037
g.35651G>A 12GG0.012G0.1070.042 *
Intron 2188GA0.190A0.893
787AA0.797
g.35827C>T 540CC0.548C0.729
Intron 2357CT0.362T0.2717.00
89TT0.090
g.35941G>A 525GG0.542G0.727
Intron 2357GA0.369A0.2734.93
87AA0.089
g.51472C>T 838CC0.852C0.922
Intron 11139CT0.141T0.0780.219
7TT0.007
*: p < 0.05. HWE is Hardy–Weinberg equilibrium.
Table 3. Haplotype reconstructions for SNPS of the ACSL1 gene and their frequencies.
HaplotypesNumberFrequencies
CCGCGC5980.31
CCGTAC5170.268
GTGCGC2300.119
GCGCGC2260.117
CCACGC2060.107
CCGCGT1160.06
CTGCGT190.01
CCGTAC80.004
GCGCGT50.003
CCACAC20.001
CCACGT10.001
CTGCGC10.001
GCGCAC10.001
GTGCAC10.001
GTGCGT10.001
Total19321
Table 4. Effects of different non-genetical factors on milking traits and somatic cell score (SCS) of Holstein cows.
FactorsMilking Traits and SCSF ValueSig
Test yearTDMY9.63 **0.00
FC4.39 *0.01
PC9.02 **0.00
SCS9.67 **0.00
Test seasonTDMY69.27 **0.00
FC99.59 **0.00
PC159.50 **0.00
SCS7.26 **0.00
ParityTDMY188.99 **0.00
FC0.520.60
PC10.80 **0.00
SCS83.49 **0.00
Calving seasonTDMY23.83 **0.00
FC5.50 **0.00
PC6.94 **0.00
SCS8.40 **0.00
Days in milkTDMY471.99 **0.00
FC97.49 **0.00
PC745.58 **0.00
SCS35.48 **0.00
FarmTDMY49.75 **0.00
FC65.90 **0.00
PC187.06 **0.00
SCS85.29 **0.00
Analysis of variance adopts the method of the joint hypotheses test (F test). The F value in the result represents a specific value obtained by using the formula of the F test. According to this value, the corresponding p value can be obtained by looking up tables or other methods, that is significance (Sig). TDMY is test-day milk yield; FC is fat content; PC is protein content; SCS is somatic cell score; *: p < 0.05; **: p < 0.01.
Table 5. Effects of SNPs in ACSL1 genes on milk production traits and SCS.
SNP LocusGenotypesDHI Record NumberTDMY (kg)FC (%)PC (%)SCS
5’UTR-ACSL1-g.20523C>GCC507034.65 ± 0.153.63 ± 0.013.22 ± 0.01 b2.84 ± 0.03 a
CG320435.40 ± 0.193.66 ± 0.023.25 ± 0.01 a2.68 ± 0.04 b
GG77435.70 ± 0.413.62 ± 0.033.27 ± 0.01a2.57 ± 0.07 b
Total904834.97 ± 0.113.64 ± 0.013.24 ± 0.002.76 ± 0.02
F value 2.7891.73414.797 **4.463 **
Sig 0.060.180.000.01
ACSL1-g.35446C>TCC689834.82 ± 0.13 b3.63 ± 0.01 a3.23 ± 0.00 b2.79 ± 0.03 a
CT176835.42 ± 0.26 a,b3.70 ± 0.02 a3.24 ± 0.01 b2.66 ± 0.05 a,b
TT41035.84 ± 0.52 a3.53 ± 0.05 b3.28 ± 0.02 a2.75 ± 0.10 b
Total907634.97 ± 0.113.64 ± 0.013.24 ± 0.002.76 ± 0.02
F value 4.220 *5.002 **6.279 **8.532 **
Sig 0.020.010.000.00
ACSL1-g.35651G>AAA7135.01 ± 1.433.75 ± 0.113.22 ± 0.04 b2.62 ± 0.25
GA166034.45 ± 0.273.64 ± 0.023.22 ± 0.01 b2.78 ± 0.05
GG733835.08 ± 0.133.64 ± 0.013.24 ± 0.00 a2.76 ± 0.02
Total906934.97 ± 0.113.64 ± 0.013.24 ± 0.002.76 ± 0.02
F value 1.2620.7047.016 **0.007
Sig 0.280.500.000.99
ACSL1-g.35827C>TCC514335.19 ± 0.15 a3.67 ± 0.01 a3.25 ± 0.01 a2.83 ± 0.03 a
TC318035.03 ± 0.19 a3.62 ± 0.02 a3.22 ± 0.01 b2.67 ± 0.04 b
TT74033.24 ± 0.38 b3.56 ± 0.03 b3.22 ± 0.01 b2.67 ± 0.08 b
Total906334.97 ± 0.113.64 ± 0.013.24 ± 0.002.76 ± 0.02
F value 4.869 **5.301 **3.984 *14.045 **
Sig 0.010.010.020.00
ACSL1-g.51472C>TCC759235.04 ± 0.13 b3.63 ± 0.01 b3.23 ± 0.002.78 ± 0.02 a
TC137634.56 ± 0.28 b3.70 ± 0.02 b3.27 ± 0.012.66 ± 0.06 b
TT7638.69 ± 1.23 a3.92 ± 0.10 a3.26 ± 0.042.81 ± 0.22 a,b
Total904434.97 ± 0.113.64 ± 0.013.24 ± 0.002.76 ± 0.02
F value 3.169 *4.359 *0.3713.412 *
Sig 0.040.010.690.03
Analysis of variance adopts the method of the F test. The F value in the result represents a specific value obtained by using the formula of the F test. According to this value, the corresponding p value can be obtained by looking up tables or other methods, that is, Sig. DHI is dairy herd improvement; TDMY is test-day milk yield; FC is fat content; PC is protein content; SCS is somatic cell score; *: p < 0.05; **: p < 0.01; a,b differences in the same column are significant at p < 0.05.
Table 6. Effects of haplotypes for SNPs on milk production traits and SCS.
HaplotypesDHI
Records Number
TDMY (kg)FC (%)PC (%)SCS
CCGCGC411634.89 ± 0.17 b,c3.64 ± 0.01 b,c3.23 ± 0.01 b2.91 ± 0.03 a,b
GCGCGC133535.56 ± 0.30 a,b,c3.69 ± 0.02 b,c3.26 ± 0.01 b2.48 ± 0.05 a,b,c,d
CCGCAC118235.63 ± 0.30 a,b,c3.59 ± 0.03 b,c3.21 ± 0.01 b2.69 ± 0.06 a,b,c
CCGTAC113334.05 ± 0.32 b,c3.59 ± 0.03 b,c3.22 ± 0.01 b2.73 ± 0.06 a,b,c
GTGCGC35536.10 ± 0.56 a,b3.49 ± 0.05 c3.29 ± 0.02 ab2.58 ± 0.10 a,b,c,d
CCGTGC35433.77 ± 0.51 b,c3.67 ± 0.05 b,c3.24 ± 0.02 b2.65 ± 0.12 a,b,c
CCACGC22534.12 ± 0.73 b,c3.71 ± 0.06 b,c3.26 ± 0.02 b3.00 ± 0.17 a
CTGCGC19834.27 ± 0.71 b,c3.88 ± 0.06 b3.24 ± 0.03 b3.07 ± 0.16 a
CCGCGT8538.91 ± 1.11 a3.81 ± 0.10 b3.26 ± 0.04 b2.64 ± 0.20 a,b,c
GCGTGC6132.31 ± 1.49 c3.61 ± 0.10 b,c3.30 ± 0.03 a,b1.92 ± 0.20 d
GCGCAC5533.41 ± 1.15 b,c4.15 ± 0.10 a3.38 ± 0.05 a2.17 ± 0.27 c,d
Total909934.97 ± 0.113.64 ± 0.013.24 ± 0.002.76 ± 0.02
F value 3.979 **5.136 **3.201 **6.749 **
Sig 0.000.000.000.00
Analysis of variance adopts the method of the F test. The F value in the result represents a specific value obtained by using the formula of the F test. According to this value, the corresponding p value can be obtained by looking up tables or other methods, that is, Sig. TDMY is test-day milk yield; FC is fat content; PC is protein content; SCS is somatic cell score; **: p < 0.01; a,b,c,d differences in the same column are significant at p < 0.05.
Publisher’s Note: MDPI stays neutral with regard to jurisdictional claims in published maps and institutional affiliations.

