Abstract
Fungal species delimitation was traditionally carried out with multicopy ribosomal RNA (rRNA) genes, principally for their ease of amplification. Since the efficacy of these markers has been questioned, single-copy protein-encoding genes have been proposed alone or in combination for Multi-Locus Sequence Typing (MLST). In this context, the role of the many sequences obtained with Next-Generation Sequencing (NGS) techniques, in both genomics and metagenomics, further pushes toward an analysis of the efficacy of NGS-derived markers and of the metrics to evaluate the marker efficacy in discriminating fungal species. This paper aims at proposing MeTRe (Mean Taxonomic Resolution), a novel index that could be used both for measuring marker efficacy and for assessing the actual resolution (i.e., the level of separation) between species obtained with different markers or their combinations. In this paper, we described and then employed this index to compare the efficacy of two rRNAs and four single-copy markers obtained from public databases as both an amplicon-based approach and genome-derived sequences. Two different groups of species were used, one with a pathogenic species of Candida that was characterized by relatively well-separated taxa, whereas the other, comprising some relevant species of the sensu stricto group of the genus Saccharomyces, included close species and interspecific hybrids. The results showed the ability of MeTRe to evaluate marker efficacy in general and genome-derived markers specifically.
1. Introduction
The advent of Next-Generation Sequencing (NGS) fostered genomic studies transforming genomics from highly specialized, expensive, community-based work [1] into a routine activity with several opportunities that go well beyond the study of genomes, per se [2]. Among the various possibilities offered, there is a better understanding of genome evolution and its usage in phylogeny and taxonomy [3,4,5]. In fact, genome analysis could replace the practice of single-locus markers, or the more accurate multi-locus analysis, for the definition of species boundaries and for the identification of strains at the species level [6,7,8,9,10,11,12].
In order to achieve this goal, the tools and approaches must be set up properly, because more data do not necessarily mean an increase in resolving power [13]. The long-lasting problem is an appropriate and applicable species concept [14] among the approaches that are currently used in both bacterial and fungal biology, including phylogeny, genetic segregation and phenetics [15]. Among these three approaches, phylogeny can be used for classification and for identification, although it is much more computer-intensive then phenetics. At the beginning of the sequencing era, DNA/DNA hybridization was still considered the “optimal method for measuring the degree of relatedness between highly related organisms” [11], and the same fixed homology thresholds were proposed to separate all species within the kingdom or the superkingdom. The interest was to establish whether two strains belonged to the same species using the same approach as the DNA/DNA-related analyses, resulting in sentences like: “at sequence homology values below about 97.5%, it is unlikely that two organisms have more than 60 to 70% DNA similarity and hence that they are related at the species level.” [11]. The same concept was taken over in a seminal paper on ascomycetous yeasts: “Conspecific strains generally had fewer than 1% nucleotide substitutions in this domain, whereas biological species were separated by greater than this number of substitutions, thus providing an empirical means for recognizing species.” [8]. These thresholds are obviously somewhat arbitrary; moreover, it is not even necessarily true that all taxa can be separated by applying the same distance reference values, although some consensus can be found when massive analyses are carried out [16].
The use of distances with fixed thresholds poses the problem of the relative distance within the species and the distance among closer species [17]. In general, problems can be expected with larger species, i.e., those with more marker variability, mainly when the intraspecific distance is equal to or larger than the threshold or the actual interspecific distances. Another aspect is the quality of the DNA sequence used; in fact, not all databases are appropriately curated, and only a portion of the marker sequences are carefully checked before publishing them in the appropriate repository [18,19]. These problems arise equally with traditional sequences obtained from single-strain DNA with an amplicon-based approach and with genomic-derived sequences achieved with some NGS platform, most often from short reads assembled or mapped to a reference database. Although apparently similar, the sequences obtained with these two approaches may present significant differences, especially when the loci of interest are highly repeated, as in the case of the DNA encoding the ribosomal RNA (rRNA) in eukaryotes like fungi [20,21,22,23]. The multicopy nature of rDNA implies some level of heterogeneity amongst the various copies, in spite of homogenizing mechanisms of concerted evolution by gene conversion or by putative birth-and-death mechanisms [24,25]. Whatever the reason, these markers give different outputs with Sanger or NGS; in fact, the former reports a sort of “mean sequence” in which the polymorphic sites are reduced to the most abundant nucleotide; conversely, the latter reports every single variation in the various reads spanning over the polymorphic sites [26].
The differences between the two approaches have been also investigated by cloning a portion of the DNA region and by sequencing the various clones separately [27]. Both NGS and cloning confirmed the presence of polymorphisms that obviously play a role when multicopy markers are taken from genomes. Meanwhile the evidence of the high internal variability of rDNA was accumulated; there was an active research of novel single-copy protein-encoding loci to be used as markers singularly or in combinations in the frame of multigene (or multi-locus) phylogenetic analyses [9,28]. Although these markers are quite promising in terms of fungal phylogenetic signal and taxonomic resolution power, the problem of their PCR amplification is quite difficult to overcome to the point that some of these markers require a precise and complex multistep amplification strategy with several regions of the same marker sequenced separately. Moreover, not many taxa have been analyzed for the presence and performance of such genes, so now their utility is questionable, although their potential remains high. In a genomic scenario, these single-copy markers would greatly benefit from NGS technology, overcoming the problems of difficult amplification and cumbersome sequencing experienced with Sanger sequencing [9,28].
Altogether, this rapid overview on the currently proposed markers shows that the passage from Sanger sequencing of individual strains to NGS of the genome is likely to produce some problems related to rRNA multicopy genes and to alleviate those of the single-copy markers.
In order to tackle this problem, the novel metric Mean Taxonomic Resolution (MeTRe) is proposed as a tool to determine the efficacy of markers. Using this index and other tools, the main goals of this paper are (i) to compare the performances of the standard barcodes (Internal Transcribed Spacer (ITS) and Large ribosomal subunit (LSU)) obtained with an amplicon-based approach and then sequenced with either Sanger or NGS techniques and those retrieved directly from complete genomes and (ii) to assess the ability of single-copy genes to be used as barcodes.
2. Materials and Methods
2.1. Collection of Sequences
All the Saccharomyces sensu stricto and Candida genomes were obtained from the National Center for Biotechnology Information (NCBI). A total of 58 genomic FASTA files for Saccharomyces and 26 genomic FASTA files for Candida were retrieved from the Assembly database using the filter [Organism] to get exclusive data from a determined species. Due to the limited number of available genomes in the NCBI, the species involved in this study were: S. bayanus, S. cerevisiae, S. kudriavzevii, S. paradoxus, S. pastorianus and S. uvarum for the Saccharomyces sensu stricto complex, while the analysis was restricted to C. albicans, C. auris, C. glabrata, C. metapsilosis, C. otrhopsilosis, C. parapsilosis and C. tropicalis for the Candida genus. To have a comparable number of genomes per species, 10 genomes per Saccharomyces species were randomly chosen among all the results, and 4 genomes for each Candida species were collected. Accession numbers of these genomes are listed in Table 1. Sequences of six commonly used markers were taken from the YeastIP database (http://genome.jouy.inra.fr/yeastip/) and the NCBI. These markers were used as probes for discovering the exact position of such sequences within the genome. Probe sequences used in this study were: Actin (ACT1), Internal Transcribed Spacer (ITS), Large ribosomal subunit (LSU), Translational Elongation Factor 1-alpha (TEF1α), RNA polymerase II Largest subunit (RPB1) and RNA polymerase II second-largest subunit (RPB2). For each species of the Saccharomyces sensu stricto complex, only type strain sequences were considered, while for the Candida genus, non-type strain sequences were also used where the type strain sequences were not present in any database. The probe sequences used in this study are reported in Table 2.

Table 1.
List of Saccharomyces and Candida genomes used for the analysis.
Table 2.
List of probe sequences used in the current study. ITS: Internal Transcribed Spacer and LSU: Large ribosomal subunit.
2.2. Capturing Markers from Genomes
Probe sequences (Table 2) were aligned to the genomes using the nucmer packages included in the MUMmer system [29]. It is an anchor-based multiple alignment that allows two multi-FASTA inputs to be aligned by using Maximal Unique Matches (MUMs), which are matches that occur once in each genome. To use all anchor matches, regardless of their uniqueness, the option -maxmatch was used as follows:
Nucmer -maxmatch [input_genome.fna] [probe_sequences.fasta] -p [output]
The output produced is a .delta file that was converted into a text file using the function show-coords, a submodule of the MUMmer package. The options -c (to show the coverage percentage of the alignment) and -l (to include sequence length information in the output) are also included. Another option used in the command is -r, which allows to sort output lines by reference IDs.
The coordinates obtained in the text file were used to select a specific region of the genomes with the utility samtools faidx of the package SAMtools. With this function, a subsequence is extracted from the indexed reference sequences. Each marker considered in the study was extracted from all the genomes, using the coordinates with tags [S1] and [E1] in the text file, which referred to the start and the end of the alignment region in the reference sequence. A total of 348 sequences for the Saccharomyces sensu stricto complex, and 145 sequences for the Candida genus were retrieved and stored in a separate FASTA file.
2.3. Alignment and Data Analysis
All the sequences of a specific marker, retrieved from the genomes of the species in the analysis, were merged in a FASTA file, for a total of 12 files (6 for Saccharomyces and 6 for Candida). The files also contained the sequences of the type strain for each specific marker. Similarly, amplicon-based sequences of ITS and LSU, for both the Saccharomyces sensu stricto complex and Candida genus, were collected in 2 different files (Supplementary Table S1). These sequences were retrieved from the NCBI database.
Each file was used for carrying out multiple alignment with the algorithm ClustalW in MEGA 7 [30]. The parameters chosen for the alignment were: Gap Opening Penalty 15 and Gap Extension Penalty 6.66 for both pairwise and multiple alignment, while the transition weight was considered equal to 0.3. The same parameters were applied for the multiple alignment of amplicon-based sequences. For each alignment, the distance matrix and Neighbor-Joining tree were calculated with the functions dist.dna and nj, respectively, of the ape package (v. 5.4.1) in R ( version 4.0.3, Platform: x86). The option used for distance matrixes was a “raw” model, which is the proportion of sites that differ between each pair of sequences. A Mantel test was carried out to compare the results obtained from type strain genomic markers against the corresponding amplicon-based sequences, with the function mantel.test (package Vegan, v. 2.5.6) that computes Mantel’s permutation test for the similarity of two matrices. Additionally, the trees obtained from the ITS, LSU and TEF-1α genomic sequences and amplicon-based sequences, separately, were compared with the package phylogram (v 2.1.0) in R.
2.4. Inter and Intra-Group Distances Analysis
Marker sequences retrieved from genomes were used to calculate both the distances (p-distances algorithm, MEGA 7) among the strains of the same species and among the different species. The functions Between Groups Mean Distances and Within Groups Mean Distances in MEGA 7 were used. The first algorithm computes the average distances between groups of taxa, which are the arithmetic means of all pairwise distances between two groups in the inter-group comparisons. While the Within Groups Mean Distances are arithmetic means of all individual pairwise distances between taxa within a group. For both analyses, the parameters used were p-distances as the substitutions model, which included Transition + Transversion and uniform rates for sequence evolution.
2.5. Calculation of MeTRe
Distances, obtained with MEGA 7 functions, represented the input of a Macro, written in MS Excel, to compute the resolution of each marker. The resolution index, called MeTRe, was calculated as the ratio between the value of interspecies distance and the sum of intraspecies distances of the two species compared as indicated in the two formulas:
In which the pedix (i − j) indicates the MeTRe deriving from the comparison of the ith with the jth species, and similarly, the Disti−j indicates the intraspecific distance, whereas Di and Dj indicate the mean internal variability of the ith and jth species. In Formula (2), the mean internal variability is substituted with the sum of the two-half threshold distance (Th) accepted for the marker in use.
In the square matrix reporting MeTRe data, the descending diagonal reported the intraspecific distances divided by themselves and, therefore, = 1. The intraspecific distances are the mean internal variability of the species (Formula (1)); alternatively, it can be half of the distance threshold accepted for that marker (Formula (2)). The upper and lower triangular matrixes contained the values of the Mean Taxonomic Resolution (MeTRe), which indicate no resolution with MeTRe ≤ 1 and resolution with MeTRe > 1. The possibility of using two different types of data for intraspecific distances was tested with ITS and LSU by calculating two different MeTRe matrices, one with values obtained with the algorithm Within Groups Mean Distances in MEGA 7, while the other with the threshold values, i.e., 0.7 for ITS and 0.5 for LSU (half of the accepted taxonomic thresholds) [16].
3. Results
3.1. Experimental Design
The present work aims at comparing the distances among strains with the variability within the species to evaluate the different taxonomic resolutions obtainable with various markers. The species and the strains selected respond to the double criterion of taxonomic models accommodating relatively close species and of species with enough genomes published from which taxonomic markers could be obtained. Using these two criteria, we selected several species belonging to the Saccharomyces genus and to the group of the pathogenic species of the Candida genus.
Along with LSU, ITS is well-known and used as “universal barcoding marker” for fungi [31], with several amplicon-based sequences available in public databases, some of which are under active curation [19]. Since there is not, to our knowledge, a repository of LSU or ITS sequences derived from genomes, we decided to retrieve them directly from published genomes. All distances analyses were carried out considering the amplicon-based sequence of the type strain as the reference sequence from which both intra- and interspecific distances were obtained and evaluated.
3.2. Distance Analysis among Saccharomyces Species
The distance analysis with ITS and LSU sequences, considering both standard barcodes and genome-derived sequences, was carried out by comparing all the strain sequences with the sequence of the type strain of each species under investigation. The results were aggregated by species, reporting the distances within and among groups of the three closest species, eliminating the others for the clarity of presentation (Figure 1).

Figure 1.
Distances among and within the Saccharomyces species. Distances obtained with standard and genomic Internal Transcribed Spacer (ITS) (expressed as % of substitution in comparison to the type strain) are displayed in panels (a,b), respectively. The standard and genomic distances from Large ribosomal subunit (LSU) markers are reported in panels (c,d), respectively. Each subpanel reports the distances of the strains belonging to the species under study (indicated on the right of the subpanel) with the sequences of the type strains of the three closest species (indicated close to the box). For instance, the topmost subpanel of (a) reports the intra- and interspecific distances of S. bayanus from the sequences of the S. bayanus, S. pastorianus and S. uvarum type strains. The width of each box represents the variability of the distances of the strains of each species from the type strains of the three closest species. The internal variability of each species is indicated by the topmost box of each subpanel. The distances among the means of the species are displayed as the distances between the vertical l, thick segments within the boxes.
The analysis in groups of three species also responded to the problem of considering the ability of each marker to separate from the closest, with the farthest not representing a taxonomic problem. The accepted thresholds [8,16] of 1.4% for ITS and 1% for LSU were adopted and reported as a horizontal red line. Therefore, there is poor separation for the species falling in the area below the red line. A preliminary analysis showed that most cases with a poor separation were circumscribed to groups of three species. Using ITS as a marker, both the standard and genomic sequences of S. bayanus were not separated from S. pastorianus and S. uvarum type strains. Although the variability within these three species was not particularly high, the mean distances among them were little, and no separation could be obtained (Figure 1a,b). S. cerevisiae and S. paradoxus showed a relatively low internal variability, but the intraspecific distance was lower than the adopted threshold, and they were, therefore, poorly separated. S. paradoxus sequences showed a worse situation compared to S. cerevisiae; in fact, the interspecific variability with S. cerevisiae and S. paradoxus type strains was higher than that of S. cerevisiae with both genomic and amplicon-based sequences, although the latter had a slightly better performance (Figure 1a,b). The sequences of S. uvarum showed low internal variability with both genomic and standard markers, whereas the internal variability was large in S. pastorianus, which showed no separation with the two closest species.
With the LSU marker (Figure 1c,d), most of the results were like those obtained with ITS, with some remarkable differences. Firstly, the genomic LSU marker failed to separate the species over the 1% threshold; in fact, the largest distances recorded using those markers were around 0.9%. In general, the internal genomic distances were larger than those obtained with amplicon-based sequencing. Then, the internal variability of the sequences retrieved from S. pastorianus genomes was extremely large when the comparison was carried out with the S. pastorianus, S. bayanus and S. uvarum type strain sequences. On the contrary, when using the sequences obtained from S. bayanus and S. uvarum genomes, the internal variability was comparable with the variability of the LSU standard sequences.
3.3. Distance Analysis among the Pathogenic Candida Species
The same analyses described above were carried out with the pathogenic species of the genus Candida—among which, three species (C. parapsilosis, C. metapsilosis and C. orthopsilosis) were derived from the splitting of the former C. parapsilosis species [32]. Furthermore, C. glabrata is phylogenetically different from the others, stemming from whole-genome duplication [33]. The internal distances of all Candida species (as resulting from the datasets employed) were much smaller than the distances among the various species. In fact, interspecific distances were up to 25% and 40% for the standard and genomic ITS and up to 15% for both types of LSU sequences. C. metapsilosis could not be separated from C. orthopsilosis with any of the two markers, irrespective of the sequencing method used (Figure 2). In general, the internal variability of the genomic sequences was higher than that of the corresponding amplicon-based.
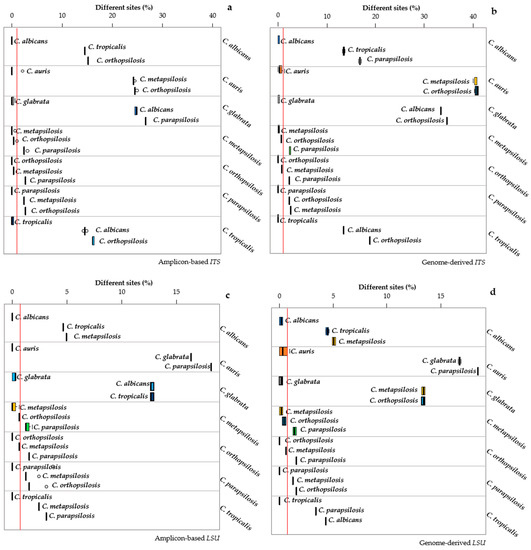
Figure 2.
Distances among and within Candida species. The distances obtained with standard and genomic ITS are displayed in panels (a,b), respectively. The standard and genomic distances from the LSU markers are reported in panels (c,d). Each subpanel reports the distances of the strains belonging to the species under study (indicated on the right of the subpanel) with the sequences of the type strains of the three closest species (indicated close to the box). For instance, the topmost subpanel of (a), reports the intra and interspecific distances of C. albicans from the sequences of the C. albicans, C. tropicalis and C. orthopsilosis type strains. The width of each box represents the variability of the distances of the strains of each species from the type strains of the three closest species. The internal variability of each species is indicated by the topmost box of each subpanel. The distances among the means of the species are displayed as the distances between the vertical thick segments within the boxes.
3.4. Proposal of Mean Taxonomic Resolution (MeTRe) as a Novel Metric to Determine Marker Efficiency
The distance analysis presented in the above paragraphs takes into consideration inter- and intraspecific distances qualitatively, making their comparison rather complex. In order to overcome this problem, the Mean Taxonomic Resolution (MeTRe) metrics were calculated as the ratio between the mean distance among a pair of species and the sum of internal variability of the two species. It is therefore “1” when a species is compared with itself, less than 1 when the two species are not well-separated and higher than 1 when the two species are well-discriminated by the marker in use. In other words, MeTRe defines the distance between two species using their internal variability as the unit. MeTRe can be considered a tool to define the real separation between species or as a metric to compare the efficacy or markers in separating species. The present paper uses the latter approach to define and compare quantitatively the effectiveness of amplicon-based and genome-derived markers. Since ITS and LSU are well-known markers, the internal mean variability of the species was set at 0.7% and 0.5%, respectively, i.e., at half the level of the threshold suggested for these markers [8,16].
The MeTRe analysis for the ITS and LSU markers derived the standard or genomic sequences, following the same experimental scheme presented in the previous paragraphs, but it allowed to accommodate in the same graph the resolution of each species in comparison with all other species considered. A comparison of the corresponding panels in Figure 1 and Figure 2 vs. Figure 3 showed that all cases without a separation according to the distance analysis were confirmed by low MeTRe values, indicating that the metric gives a faithful representation of the overall taxonomic relationships.

Figure 3.
Mean Taxonomic Resolution (MeTRe) among and within the Saccharomyces and Candida species. Resolution calculated for Saccharomyces standard and genomic ITS and LSU are displayed in panels (a,b), respectively. Amplicon-based and genomic resolution of the Candida ITS and LSU markers are reported in panels (c,d). Each column shows the resolution of the species positioned in a red line (reported above each column) from the other species under analysis. The species placed below the red line were not resolved by the marker from the species reported above each column. Values of MeTRe in log scale are reported on the y-axis, while numbers on the x-axis correspond to the species involved in the study (and are depicted at the beginning of each subpanel).
More importantly, MeTRe allows to define the overall and specific delimitation efficiency of the markers, thus allowing a direct comparison. For instance, in Saccharomyces, ITS showed an average MeTRe of 1.24 and 1.17 for the amplicon-based and the genomic sequences, respectively, whereas, for LSU, these values were 1.14 and 0.63. These figures indicate that the ITS performed slightly better when considering the amplicon-based sequences rather than the genome-derived markers. On the contrary, genome-derived LSU had a much worse performance than the corresponding amplicon-based. An average MeTRe of around 1 for the ITS is, in any case, an indication of a rather poor performance of the marker for the species under analysis. In fact, the distance among species is only slightly more than the distance within the species, indicating cases in which there is little, if any, resolution. When the same analysis was carried out among the Candida species considered, ITS had 12.4 and 16.2 average MeTRe and LSU 8.6 and 9.2 for the standard and genome sequences, respectively. These data allowed to define quantitatively that the performance of ITS is better than that of LSU in both taxonomic models. On the other hand, MeTRe allowed to rapidly define that, in the Candida model adopted for this study, the separation among species was roughly ten times their internal variability. These figures indicated that high MeTRe may not mean much if the species considered are very distant—in which case, there is not a real taxonomic problem. Conversely, MeTRe was interesting when comparing two close known species, i.e., where species delimitation becomes a real taxonomic problem.
MeTRe can be calculated using the standard internal variability values, as described above, or the actual variability displayed by the strains of each species. The latter system offers a more realistic evaluation of the actual resolution of the markers among the species and produces better results when large numbers of sequences are used. When using the latter approach with the same sequences, the mean MeTRe of the Saccharomyces species were 5.04, 9.33, 14.97 and 7.85, respectively, for the standard and genomic ITS and standard and genomic LSU. Similarly, for Candida, the four mean MeTRe were 39.34, 52.70, 33.17 and 17.49, again larger than those produced with fixed thresholds. These figures are much larger than those found using a fixed internal variability, as above, because the actual variability of the strains within each species was lower than the 0.7% and 0.5% chosen as half of the ITS and LSU threshold. When the internal variability of a species was relatively high, as for S. pastorianus genomic LSU, the MeTRe values decreased, and the average MeTRe of this species was 0.88, whereas those of the other species ranged from 6.6 and 12.3.
Both systems can be used to evaluate the marker efficacy if the consensus threshold values are known, whereas the usage of the actual internal variability is the only approach when new markers are studied, as in the cases presented in the subsequent part of this paper.
3.5. Single-Copy Markers from Genomes
Single-copy protein-encoding genes are known to be superior to rRNA genes in phylogeny and species delimitations but are also afflicted by problems in amplification and by the consequent lack of wide libraries [31]. Nevertheless, some studies were carried out using these genes with many fungal species and genera [9,28]. The possibility to retrieve these sequences from genomes is an appealing perspective to accomplish a multigene phylogenetic analysis and accurate delimitation of the fungal species. Furthermore, the increasing rapidity and decreasing costs of the genome sequencing procedure might lead to using these markers for identification as well. In order to understand their efficacy, we conducted the same analyses described above with a series of single-copy protein encoding genes obtained from the same genomes.
S. pastorianus genomes harbor two types of the single-copy genes: one similar to S. bayanus and one to S. cerevisiae; the former was marked with a B and the latter with a C.
ACT1 sequences showed a large internal variability in S. bayanus, S. paradoxus and S. kudriavzevii (Figure 4a).
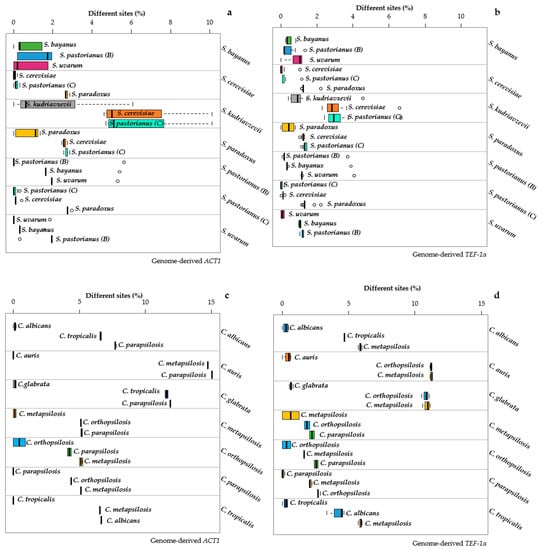
Figure 4.
Distance among and within the Candida and Saccharomyces species. Distance calculated for the genomic Actin (ACT1) and genomic Translational Elongation Factor 1-alpha (TEF1-α) of Saccharomyces are displayed in panels (a,b), respectively. Distance calculated for the genomic ACT1 and genomic TEF1-α of Candida are reported in panels (c,d). Each subpanel reports the distances of the strains belonging to the species under study (indicated on the right of the subpanel) with the sequences of the type strain of the three closest species (indicated close to the box). The width of each box represents the variability of the distances of the strains of each species from the type strains of the three closest species. The internal variability of each species is indicated by the topmost box of each subpanel. The distances among the means of the species are displayed as the distances between the vertical thick segments within the boxes.
S. kudriavzevii showed a relatively low average (0.25%) but a large range (>3%) of the distances between its strains and the type, confirmed by a large variability when these strains are compared with the types of S. pastorianus and S. cerevisiae. This could be due either to the presence of incorrectly identified strains or to the poor quality of the genomes. A similar case was present with the ACT1 of C. orthopsilosis (Figure 4c), where the strains showed variability only against their own type strain, whereas they showed larger distances with the types of C. parapsilosis and C. metapsilosis. These two cases showed that, when the distances between species are large, even a high internal variability does not limit the species separation.
In general, the variability shown by this marker is much lower than the interspecific distances, and a good separation of the species can be obtained, except for S. bayanus, S. pastorianus (B) and S. uvarum and for S. cerevisiae and S. pastorianus (C) (Figure 4a). There was registered a strong separation between the copy “B” and “C” retrieved from the genome of S. pastorianus, with the former belonging to the group of S. bayanus and S. uvarum and the latter more similar to the group of S. cerevisiae and S. paradoxus (Figure 4a).
All species of Candida were well-separated, thanks to larger distances among the species up to 15% vs. the 10% in Saccharomyces.
TEF1a showed similar patterns to ACT1, with all Candida species well-separated and with relatively low internal variability (Figure 4d) and the lack of separation in Saccharomyces reported above for ACT1.
The MeTRe analysis displayed these situations in a straightforward way. The only species grouped below the level of MeTRe = 1 were the groups B and C with both ACT1 and TEF1a (Figure 5). Furthermore, MeTRe could show that, within B group, the S. bayanus strains were not separated from S. pastorianus (B) and S. uvarum, whereas the S. uvarum strains were separated from the S. pastorianus (B) sequence and not from S. bayanus (Figure 5a).

Figure 5.
MeTRe among and within the Saccharomyces and Candida species for ACT1 and TEF1-α. Resolutions calculated for the genomic ACT1 and genomic TEF1-α of Saccharomyces are displayed in panels (a,b), respectively. Genomic ACT1 and genomic TEF1-α of Candida are reported in panels (c,d). Each column shows the resolution of the species positioned in a red line (reported above each column) from the other species under analysis. The species placed below the red line have no resolution with the species reported above each column. The values of MeTRe in log scale are reported on the y-axis, while the numbers on the x-axis correspond to the species involved in the study (and depicted at the beginning of each subpanel).
Similarly, the sequences of S. pastorianus were separated from those of S. uvarum but not from S. bayanus. These cases showed that MeTRe can dissect situations difficult to disentangle even with an accurate distance analysis. Moreover, the possibility of using MeTRe = 1 as a discriminant allowed to define the cases of species separation without the use of an arbitrary distance threshold, because it indicates the cases in which strains at the borders of the two species would be equally distant from the two type strains. MeTRe values obtained from the distances calculated with RPB1 and RPB2 (Figure S1) showed a lack of separation in S. bayanus vs. S. pastorianus (B) and in S. cerevisiae vs. S. pastorianus (C), with more resolution in the latter group when using RPB2 than RPB1 (Figure 6b vs. Figure 6a).
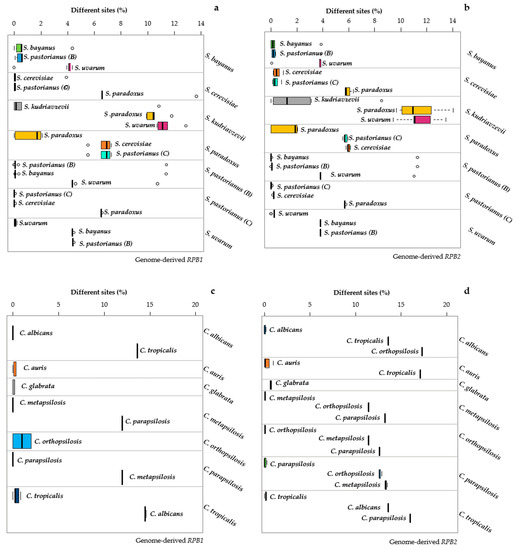
Figure 6.
Distance among and within the Candida and Saccharomyces species. Resolutions calculated for genomic RPB1 and genomic RPB2 of Saccharomyces are displayed in panels (a,b), respectively. Genomic RPB1 and genomic RPB2 of Candida are reported in panels (c,d). Each subpanel reports the distances of the strains belonging to the species under study (indicated on the right of the subpanel) with the sequences of the type strain of the three closest species (indicated close to the box). The width of each box represents the variability of the distances of the strains of each species from the type strains of the three closest species. The internal variability of each species is indicated by the topmost box of each subpanel. The distances among the means of the species are displayed as the distances between the vertical thick segments within the boxes.
The Candida species were totally resolved with both markers (Figure 6c,d). A global comparison of MeTRe values showed that, in the Saccharomyces model, the four markers showed maximum values around 14 (ACT1), 80 (TEF1a), 88 (RPB1) and 78 (RPB2). These four values were, respectively, 270, 100, 300 and 330 in the Candida model. These data show the potential of MeTRe in evaluating the species separation (larger in Candida than in Saccharomyces) and in measuring the efficacy of the markers. RPB1 and RPB2 were very efficient in both taxonomic models, whereas ACT1 had poor discrimination in Saccharomyces compared to the one in Candida. Moreover, all the four single-copy genes obtained from the genomes behaved much better than ITS and LSU, regardless of the source of these last sequences (compare Figure 2 and Figure 3 with Figure 5 and Figure 6). The method proposed for sequence retrieval returns the number of sequences homologous to the query. Whereas ITS and LSU are multicopy and could represent a family of paralogs, from the pipeline results, the single-copy genes appeared to have only one output. A possible exception could be TEF2, but with our settings, it was not returned, using TEF1-α as a probe. The absence of paralogs is a further advantage of these protein-encoding genes as markers that is expected to prevent the typical problems of paralogous genes taking different evolutionary trajectories, therefore producing contrasting results.
4. Discussion
The taxonomic analysis of a species based on marker sequences relies primarily on the distances among strains as the first step for tree reconstruction and for the application of thresholds, normally accepted as species delimitations. In seminal works introducing the marker sequence as a taxonomic tool, thresholds were generally described as the distance below which the strains are supposedly part of the same species [6,8,11]. In terms of species description, this definition should be considered as the maximum allowable distance between the two furthest strains of the same species, without considering any reference or type strains that should be well inside the species distribution. As a matter of fact, this application of the threshold is rather difficult to apply in the identification routine when an unknown strain must be associated to a known species. In fact, the addition of the strain to identify could change the species dimensions, and the researcher should therefore evaluate if the species with this new strain complies with the specifications that the maximum distance among all strains of the species has within the threshold. This procedure is obviously cumbersome and would require the availability of dedicated databases able to rapidly calculate the maximum distance within the species upon each strain addition. A much simpler approach, and closer to the spirit of the use of the type specimen concept, is to compare the distance of the unknown strain with the type strain of the species. This method only requires the sequences of type strains. The problem is that it is not reliable if the type strain is not central within the species distribution. This should not happen if the rules described above are strictly followed and if all sequence markers equally or linearly reflect the evolution of the genome. We know that this is not the case and that the centrality of the type strains is often not respected, nor, and even less, is the centrality of some of the markers. The centrality of a strain can be defined as the distance from the center of the species distribution, as suggested elsewhere [34]. The distance is calculated with the best available descriptors, as markers, but in the future, it could be the whole genome. Using this approach, it has been shown that most type strains of known yeast species are “central” [16]. The question on whether it is due to an effective “centrality” of the type or to other factors is a matter of discussion, considering that the type is not designed in the nomenclature code to be a reference, as stated by the Melbourne Nomenclature Code, “A nomenclatural type (typus) is that element to which the name of a taxon is permanently attached, … The nomenclatural type is not necessarily the most typical or representative element of a taxon”, https://www.iapt-taxon.org/historic/2012.htm. In any case, in the current taxonomic practice, the type is an anchor and, as such, prevents the species from moving away in the taxonomic space.
The use of fixed thresholds throughout the whole nomenclature relays the hypothesis that all species are of the same size, which is all but evident. A nominalist approach to species delimitation would impose that species are all similar or identical in size, and a fixed threshold could be used. Although this is not the place for a specific discussion on this topic, the acceptance of nominalism would seemingly leave no space for any claim on the correspondence between nomenclature and natural order [35]. Taxonomy should try to make both fit as close as possible, whereas the nomenclature may impair this goal by forcing the anchoring to the type and for stability reasons. The problems in species delimitation and strain identification [15] suggest either to collapse the species in a sort of continuum [36,37] or to find new metrics able to avoid the specific problems posed by distances and able to take into account the actual species internal variability.
On the other hand, the extensive use of NGS for both genomics and metagenomics [2,3,38,39] calls for the quantitative analysis of genes that could be retrieved from the genomes for strain identification and species delimitation or from metagenomic data for diversity estimation.
In both respects, MeTRe seems to match both requirements, because it can be used reversibly to compare the level of species separation and to evaluate the marker efficacy. The fact that MeTRe is nondimensional and that it considers the internal variability of the species (or of the strain set used) are factors allowing to use it in a generalized way. MeTRe allows an immediate definition of the separation between species simply by considering if their MeTRe are below (no separation) or over (separation) 1. Conversely, when different markers should be analyzed and compared, MeTRe gives the information on the minimum and maximum levels of separation and displays which species are or are not poorly separated. MeTRe was proposed in this paper with the specific intention of comparing the efficacy of single-copy markers from genomes with traditional rRNA markers sequences obtained with both the amplicon-based approach and those retrieved from genomes. The single-copy protein genes outperformed the rRNA markers to a large extent, suggesting that their usage in genomics and metagenomics is promising. The present analysis was limited by the number of strains’ genomes that contained all the analyzed genes. rRNA markers are not always present or well-assembled [38,40,41]; however, a more extensive analyses of these markers will be necessary to confirm the preliminary findings of the current study.
5. Conclusions
In conclusion, this paper showed the importance of considering not only the distances between the species but, also, within them, although a relatively small number of sequences could be considered for this proof of concept. Large scale analyses are currently carried out in our laboratories to apply this approach to the current yeast taxonomy with MeTRe and other indexes. At the same time, it was demonstrated that the single-copy protein-encoding genes from genomes ensure a good level of resolution, equal if not better than that achieved with standard rRNA markers. This paves the way not only to a more extended use of these markers in shotgun metagenomics but, also, to NGS-based approaches using an extended multi-marker barcode.
Supplementary Materials
The following are available online at https://www.mdpi.com/2076-2607/9/2/299/s1. Figure S1: MeTRe among and within the Saccharomyces and Candida species. Legend: Resolution calculated for the genomic RPB1 and genomic RPB2 of Saccharomyces are displayed in panels (a,b), respectively. Genomic RPB1 and genomic RPB2 of Candida are reported in panels (c,d). Each column shows the resolution of the species positioned in a red line (reported above each column) from the other species under analysis. The species placed below the red line have no resolution with the species reported above each column. Table S1: GenBank Accession numbers for the ITS and LSU sequences of the Saccharomyces sensu stricto complex and Candida genus, used for comparison with the respective sequences retrieved from the genomes.
Author Contributions
Conceptualization, G.C. and V.R.; methodology, G.C. and A.C.; software, G.C. and A.C.; validation, D.C.P. and L.C.; investigation, A.C.; resources, G.C.; data curation, A.C. and L.C.; writing—original draft preparation, G.C.; writing—review and editing, L.C.; visualization, A.C. and D.C.P.; supervision, G.C. and funding acquisition, G.C. All authors have read and agreed to the published version of the manuscript.
Funding
A.C. and D.C.P. were partly supported by the PhD program in Biotechnology at the University of Perugia.
Data Availability Statement
No new data were created or analyzed in this study.
Acknowledgments
GC is indebted to Staniszlo Szöke for the many challenging and interesting discussions on the mathematics of multidimensional analyses.
Conflicts of Interest
The authors declare no conflict of interest.
References
- Dujon, B.; Sherman, D.; Fischer, G.; Durrens, P.; Casaregola, S.; Lafontaine, I.; de Montigny, J.; Marck, C.; Neuveglise, C.; Talla, E.; et al. Genome Evolution in Yeasts. Nature 2004, 430, 35–44. Available online: http://www.nature.com/nature/journal/v430/n6995/suppinfo/nature02579_S1.html (accessed on 1 October 2020). [CrossRef]
- Cardinali, G.; Corte, L.; Robert, V. Next Generation Sequencing: Problems and opportunities for next generation studies of microbial communities in food and food industry. Curr. Opin. Food Sci. 2017, 17, 62–67. [Google Scholar] [CrossRef]
- Borneman, A.R.; Pretorius, I.S. Genomic insights into the Saccharomyces sensu stricto complex. Genetics 2015, 199, 281–291. [Google Scholar] [CrossRef] [PubMed]
- Leducq, J.-B.; Nielly-Thibault, L.; Charron, G.; Eberlein, C.; Verta, J.-P.; Samani, P.; Sylvester, K.; Hittinger, C.T.; Bell, G.; Landry, C.R. Speciation driven by hybridization and chromosomal plasticity in a wild yeast. Nat. Microbiol. 2016, 1, 1–10. [Google Scholar] [CrossRef]
- Louis, E.J. Population genomics and speciation in yeasts. Fungal Biol. Rev. 2011, 25, 136–142. [Google Scholar]
- Bruns, T.D.; White, T.J.; Taylor, J.W. Fungal molecular systematics. Annu. Rev. Ecol. Syst. 1991, 22, 525–564. [Google Scholar] [CrossRef]
- Hugenholtz, P.; Skarshewski, A.; Parks, D.H. Genome-based microbial taxonomy coming of age. Cold Spring Harb. Perspect. Biol. 2016, 8, a018085. [Google Scholar] [CrossRef]
- Kurtzman, C.P.; Robnett, C.J. Identification and phylogeny of ascomycetous yeasts from analysis of nuclear large subunit (26S) ribosomal DNA partial sequences. Antonie Van Leeuwenhoek 1998, 73, 331–371. [Google Scholar] [CrossRef]
- Kurtzman, C.P.; Robnett, C.J. Relationships among genera of the Saccharomycotina (Ascomycota) from multigene phylogenetic analysis of type species. FEMS Yeast Res. 2013, 13, 23–33. [Google Scholar] [CrossRef]
- Meier-Kolthoff, J.P.; Göker, M. TYGS is an automated high-throughput platform for state-of-the-art genome-based taxonomy. Nat. Commun. 2019, 10, 1–10. [Google Scholar] [CrossRef]
- Stackebrandt, E.; Goebel, B.M. Taxonomic note: A place for DNA-DNA reassociation and 16S rRNA sequence analysis in the present species definition in bacteriology. Int. J. Syst. Evol. Microbiol. 1994, 44, 846–849. [Google Scholar] [CrossRef]
- Yurkov, A.; Guerreiro, M.A.; Sharma, L.; Carvalho, C.; Fonseca, Á. Multigene assessment of the species boundaries and sexual status of the basidiomycetous yeasts Cryptococcus flavescens and C. terrestris (Tremellales). PLoS ONE 2015, 10, e0120400. [Google Scholar] [CrossRef] [PubMed]
- Steenkamp, E.T.; Wingfield, M.J.; McTaggart, A.R.; Wingfield, B.D. Fungal species and their boundaries matter—Definitions, mechanisms and practical implications. Fungal Biol. Rev. 2018, 32, 104–116. [Google Scholar] [CrossRef]
- Pigliucci, M. Species as family resemblance concepts: The (dis-) solution of the species problem? BioEssays 2003, 25, 596–602. [Google Scholar] [CrossRef]
- Lucking, R.; Aime, M.C.; Robbertse, B.; Miller, A.N.; Ariyawansa, H.A.; Aoki, T.; Cardinali, G.; Crous, P.W.; Druzhinina, I.S.; Geiser, D.M.; et al. Unambiguous identification of fungi: Where do we stand and how accurate and precise is fungal DNA barcoding? IMA Fungus 2020, 11, 14. [Google Scholar] [CrossRef] [PubMed]
- Vu, D.; Groenewald, M.; Szöke, S.; Cardinali, G.; Eberhardt, U.; Stielow, B.; de Vries, M.; Verkley, G.J.M.; Crous, P.W.; Boekhout, T.; et al. DNA barcoding analysis of more than 9000 yeast isolates contributes to quantitative thresholds for yeast species and genera delimitation. Stud. Mycol. 2016, 85, 91–105. [Google Scholar] [CrossRef] [PubMed]
- Cardinali, G. Measure of species variability for a microbial taxonomy based on the relative resemblance. Riv. Biol. 2003, 96, 271–291. [Google Scholar]
- Irinyi, L.; Serena, C.; Garcia-Hermoso, D.; Arabatzis, M.; Desnos-Ollivier, M.; Vu, D.; Cardinali, G.; Arthur, I.; Normand, A.-C.; Giraldo, A. International Society of Human and Animal Mycology (ISHAM)-ITS reference DNA barcoding database—The quality controlled standard tool for routine identification of human and animal pathogenic fungi. Med. Mycol. 2015, 53, myv008. [Google Scholar] [CrossRef]
- Schoch, C.L.; Robbertse, B.; Robert, V.; Vu, D.; Cardinali, G.; Irinyi, L.; Meyer, W.; Nilsson, R.H.; Hughes, K.; Miller, A.N.; et al. Finding needles in haystacks: Linking scientific names, reference specimens and molecular data for Fungi. Database J. Biol. Datrabase Curation 2014, 2014, bau061. [Google Scholar] [CrossRef]
- Gong, J.; Dong, J.; Liu, X.; Massana, R. Extremely high copy numbers and polymorphisms of the rDNA operon estimated from single cell analysis of oligotrich and peritrich ciliates. Protist 2013, 164, 369–379. [Google Scholar] [CrossRef]
- Li, W.; Sun, H.; Deng, Y.; Zhang, A.; Chen, H. The heterogeneity of the rDNA-ITS sequence and its phylogeny in Rhizoctonia cerealis, the cause of sharp eyespot in wheat. Curr. Genet. 2014, 60, 1–9. [Google Scholar] [CrossRef] [PubMed]
- Weider, L.J.; Elser, J.J.; Crease, T.J.; Mateos, M.; Cotner, J.B.; Markow, T.A. The functional significance of ribosomal (r) DNA variation: Impacts on the evolutionary ecology of organisms. Annu. Rev. Ecol. Evol. Syst. 2005, 36, 219–242. [Google Scholar] [CrossRef]
- West, C.; James, S.A.; Davey, R.P.; Dicks, J.; Roberts, I.N. Ribosomal DNA sequence heterogeneity reflects intraspecies phylogenies and predicts genome structure in two contrasting yeast species. Syst. Biol. 2014, 63, 543–554. [Google Scholar] [CrossRef] [PubMed]
- Naidoo, K.; Steenkamp, E.T.; Coetzee, M.P.; Wingfield, M.J.; Wingfield, B.D. Concerted evolution in the ribosomal RNA cistron. PLoS ONE 2013, 8, e59355. [Google Scholar] [CrossRef] [PubMed]
- Nei, M.; Rooney, A.P. Concerted and birth-and-death evolution of multigene families. Annu. Rev. Genet. 2005, 39, 121. [Google Scholar] [CrossRef]
- Colabella, C.; Corte, L.; Roscini, L.; Bassetti, M.; Tascini, C.; Mellor, J.C.; Meyer, W.; Robert, V.; Vu, D.; Cardinali, G. NGS barcode sequencing in taxonomy and diagnostics, an application in “Candida” pathogenic yeasts with a metagenomic perspectiv. IMA Fungus 2018, 9, 91–105. [Google Scholar] [CrossRef]
- Roscini, L.; Tristezza, M.; Corte, L.; Colabella, C.; Perrotta, C.; Rampino, P.; Robert, V.; Vu, D.; Cardinali, G.; Grieco, F. Early Ongoing Speciation of Ogataea uvarum Sp. Nov. Within the Grape Ecosystem Revealed by the Internal Variability Among the rDNA Operon Repeats. Front. Microbiol. 2018, 9. [Google Scholar] [CrossRef]
- Stielow, J.; Lévesque, C.; Seifert, K.; Meyer, W.; Irinyi, L.; Smits, D.; Renfurm, R.; Verkley, G.; Groenewald, M.; Chaduli, D. One fungus, which genes? Development and assessment of universal primers for potential secondary fungal DNA barcodes. Pers. Mol. Phylogeny Evol. Fungi 2015, 35, 242–263. [Google Scholar] [CrossRef]
- Kumar, S.; Stecher, G.; Tamura, K. MEGA7: Molecular evolutionary genetics analysis version 7.0 for bigger datasets. Mol. Biol. Evol. 2016, 33, 1870–1874. [Google Scholar] [CrossRef]
- The R Development Core Team. R: A Language and Environment for Statistical Computing; The R Development Core Team: Vienna, Austria, 2013. [Google Scholar]
- Schoch, C.L. Nuclear ribosomal internal transcribed spacer (ITS) region as a universal DNA barcode marker for Fungi. Proc. Natl. Acad. Sci. USA 2012, 109, 6241–6246. [Google Scholar] [CrossRef]
- Tavanti, A.; Davidson, A.D.; Gow, N.A.; Maiden, M.C.; Odds, F.C. Candida orthopsilosis and Candida metapsilosis spp. nov. to replace Candida parapsilosis groups II and III. J. Clin. Microbiol. 2005, 43, 284–292. [Google Scholar] [CrossRef] [PubMed]
- Papon, N.; Courdavault, V.; Clastre, M.; Bennett, R.J. Emerging and emerged pathogenic Candida species: Beyond the Candida albicans paradigm. PLoS Pathog. 2013, 9, e1003550. [Google Scholar] [CrossRef] [PubMed]
- Antonielli, L.; Robert, V.; Corte, L.; Roscini, L.; Ceppitelli, R.; Cardinali, G. Centrality of Objects in a Multidimensional Space and its Effects on Distance-Based Biological Classifications. Open Appl. Inform. J. 2011, 5, 11–19. [Google Scholar]
- Hennig, W. Phylogenetic systematics. Annu. Rev. Entomol. 1965, 10, 97–116. [Google Scholar] [CrossRef]
- Galtier, N. Delineating species in the speciation continuum: A proposal. Evol. Appl. 2019, 12, 657–663. [Google Scholar] [CrossRef]
- Gonzalez, J.M.; Puerta-Fernandez, E.; Santana, M.M.; Rekadwad, B. On a Non-Discrete Concept of Prokaryotic Species. Microorganisms 2020, 8, 1723. [Google Scholar] [CrossRef]
- Tørresen, O.K.; Star, B.; Mier, P.; Andrade-Navarro, M.A.; Bateman, A.; Jarnot, P.; Gruca, A.; Grynberg, M.; Kajava, A.V.; Promponas, V.J. Tandem repeats lead to sequence assembly errors and impose multi-level challenges for genome and protein databases. Nucleic Acids Res. 2019, 47, 10994–11006. [Google Scholar] [CrossRef]
- Utturkar, S.M.; Klingeman, D.M.; Hurt Jr, R.A.; Brown, S.D. A case study into microbial genome assembly gap sequences and finishing strategies. Front. Microbiol. 2017, 8, 1272. [Google Scholar] [CrossRef]
- Libkind, D.; Cadez, N.; Opulente, D.A.; Langdon, Q.K.; Rosa, C.A.; Sampaio, J.P.; Goncalves, P.; Hittinger, C.T.; Lachance, M.A. Towards yeast taxogenomics: Lessons from novel species descriptions based on complete genome sequences. FEMS Yeast Res. 2020, 20. [Google Scholar] [CrossRef]
- Matute, D.R.; Sepulveda, V.E. Fungal species boundaries in the genomics era. Fungal Genet. Biol. 2019, 131, 103249. [Google Scholar] [CrossRef]
Publisher’s Note: MDPI stays neutral with regard to jurisdictional claims in published maps and institutional affiliations. |
© 2021 by the authors. Licensee MDPI, Basel, Switzerland. This article is an open access article distributed under the terms and conditions of the Creative Commons Attribution (CC BY) license (http://creativecommons.org/licenses/by/4.0/).