Article

Proteomics and Lipidomics Investigations to Decipher the Behavior of Willaertia magna C2c Maky According to Different Culture Modes

1
Aix-Marseille Université UM63, Faculté des Sciences Médicales et Paramédicales secteur Timone, Institut de Recherche Pour le Développement IRD 198, Assistance Publique—Hôpitaux de Marseille (AP-HM), 13385 Marseille, France
2
R&D Department, Amoéba, 69680 Chassieu, France
3
Institut Hospitalo-Universitaire (IHU), Microbes, Evolution, Phylogeny and Infection (MEΦI)—Méditerranée Infection, 13005 Marseille, France
*
Author to whom correspondence should be addressed.
Microorganisms 2020, 8(11), 1791; https://doi.org/10.3390/microorganisms8111791
Submission received: 10 September 2020 / Revised: 12 November 2020 / Accepted: 14 November 2020 / Published: 16 November 2020
(This article belongs to the Section Microbial Biotechnology)

Abstract

:
Willaertia magna C2c Maky is a free-living amoeba that has demonstrated its ability to inhibit the intracellular multiplication of some Legionella pneumophila strains, which are pathogenic bacteria inhabiting the aquatic environment. The Amoeba, an industry involved in the treatment of microbiological risk in the water and plant protection sectors, has developed a natural biocide based on the property of W. magna to manage the proliferation of the pathogen in cooling towers. In axenic liquid medium, amoebas are usually cultivated in adhesion on culture flask. However, we implemented a liquid culture in suspension using bioreactors in order to produce large quantities of W. magna. In order to investigate the culture condition effects on W. magna, we conducted a study based on microscopic, proteomics and lipidomics analyzes. According to the culture condition, amoeba exhibited two different phenotypes. The differential proteomics study showed that amoebas seemed to promote the lipid metabolism pathway in suspension culture, whereas we observed an upregulation of the carbohydrate pathway in adherent culture. Furthermore, we observed an over-regulation of proteins related to the cytoskeleton for W. magna cells grown in adhesion. Regarding the lipid analysis, suspension and adhesion cell growth showed comparable lipid class compositions. However, the differential lipid analysis revealed differences that confirmed cell phenotype differences observed by microscopy and predicted by proteomics. Overall, this study provides us with a better insight into the biology and molecular processes of W. magna in different culture lifestyles.

1. Introduction

Willaertia magna is a free-living amoeba (FLA) belonging to the class Heterolobosea and family Vahlkampfiidae [1,2]. This FLA is found in natural and artificial environments, such as humid soil, bovine feces, composts, thermal waters, and fresh water sediments [3,4,5]. W. magna life cycle is composed of three stages switching between trophozoite form, flagellate form and cyst form [1]. The trophozoites stage is characterized by a large form containing one or several nuclei, food and contractile vacuoles, and mitochondria. The phagotrophic trophozoites feed on bacteria and can grow within a range of 22 °C to 44 °C [4]. The amoeboid form can temporary transform into ameboflagellate under certain conditions [6]. To resist unfavorable conditions, the trophozoite has the capacity to transform into large cysts containing pores in the cell wall [4]. Although W. magna is phylogenetically close to Naegleria fowleri, a virulent amoeba causing primary amoebic meningoencephalitis (PAM) in humans, in vivo and in silico experiments have demonstrated the non-pathogenicity of W. magna [4,7,8]. The analysis of the W. magna draft genome revealed a DNA length of 36.5 megabases and less than 19,000 genes [8].
Legionella pneumophila is a Gram-negative bacterium causing legionellosis, a severe and potentially fatal pneumonia in humans [9]. Although L. pneumophila is ubiquitous in natural water environment [10], the numerous cases of legionellosis are mainly due to the inhalation or respiration of pathogenic bacteria present in engineering water systems, such as cooling towers where legionella finds suitable growing condition [11,12,13]. Furthermore, the co-existence of FLAs and L. pneumophila complicates the monitoring of the latter in cooling tower waters [14,15]. L. pneumophila strains have the capacity to infect and invade a wide range of amoebas, including Vermamoeba, Acanthamoeba, and Naegleria species [12,16,17,18]. Furthermore, amoeba cysts provide to L. pneumophila a protection against harsh conditions and chemical treatments [15]. Regarding W. magna strain C2c Maky, it has been shown to be capable of phagocyting and inhibiting the intracellular growth of certain human pathogenic strains of L. pneumophila [19,20].
This finding led the Amoeba company, an industry involved in the sanitation of water in cooling towers and in the treatment of plant protection, to develop a natural biocide to monitor and prevent L. pneumophila proliferation water in cooling towers as an alternative to chemical biocides that are not completely efficient [21]. However, the treatment of water in cooling towers by this mean requires large quantities of W. magna. The traditional culture of amoebas is performed on agar plate or liquid support in xenic or axenic medium. Nevertheless, these culture methods do not allow to obtain large amounts of amoebas in a short time [22]. Axenic mass culture of Acanthamoeba castellanii in bioreactors has already been shown to improve the production of this amoeba [23]. In a previous study, Weekers et al. have carried out the axenic culture of A. castellanii in a fermenter and analyzed the behavior of this amoeba by investigating different parameters of the growth process, such as glucose consumption, amoeba concentration or respiration [24]. In another study, the behavior of Dictyostelium discoideum during a culture in suspension was investigated [22].
According to the culture conditions, the organisms need to regulate their metabolism and to mediate molecular responses in order to adapt to various environments [25]. Indeed, variations in gene expression and protein synthesis lead to different phenotypes and allow adaptation to distinct environments. Furthermore, it is known that the culture condition has an effect on the morphology, proteome and lipid composition of cellular organisms [25,26,27]. So far, the behavior of amoebas grown under different growing conditions remains unclear, especially for suspension and adhesion cell growth [28,29]. Over the past few decades, multi-omics approaches, including genomics, transcriptomics, proteomics, or lipidomics analyses have become essential tools for exploring the biology, behavior, molecular mechanisms, or metabolism of organisms [30,31,32]. However, these methods have not yet been widely applied to study FLAs. Indeed, only a few studies based on genomics, transcriptomics and proteomics are described in the literature [8,33,34,35,36,37,38,39,40,41,42].
In a previous study, we explored the behavior of W. magna C2c Maky in suspension culture by transcriptomics and proteomics analyzes [33]. To decipher the effect of culture conditions on W. magna C2c Maky, we explored the morphologic differences of W. magna growing in two culture modes by microscopic analysis. Then, we investigated the differential regulation of proteins for W. magna cultivated according to two different culture methods. Finally, an analysis of lipid classes was performed to further decipher the W. magna phenotype associated with the culture methods.

2. Materials and Methods

2.1. Culture of Willaertia magna C2c Maky in Adhesion

Culture of Willaertia magna C2c Maky (ATCC PTA-7824) was performed at 30 °C (Thermo Fisher Scientific, Illkirch, France) using 175 cm² culture flasks in SCGYEM medium [43]. When the trophozoite formed a monolayer, the amoebas were detached by tapping the culture flasks and harvested by centrifugation at 2000× g during 10 min, followed by three steps of washing using page’s amoeba saline (PAS) medium (2 mM NaCl, 16 μM MgSO4, 27.2 μM CaCl2, 1 mM Na2HPO4, 1 mM KH2PO4). Amoeba quantification was performed using a KOVA® slide cell counting chamber.

2.2. Culture of Willaertia magna C2c Maky in Suspension

W. magna C2c Maky was cultivated in a 10-L bioreactor (GPC, La Rochelle, France; [44]) in modified SCGYEM medium without fetal calf serum (pH = 7), as previously described [37]. To perform morphologic, proteomics, and lipidomics analyses, the amoeba cells were harvested from bioreactor in a volume of 50 mL, and centrifugated at 2000× g for 10 min and washed in three steps using PAS medium. Amoeba quantification was performed using a KOVA® slide cell counting chamber.

2.3. Protein Extraction

Amoebas were harvested from three different bioreactors or three different flasks in order to perform a proteomics study on three biological replicates. For each condition, we put 40 mL of amoebas at 106 amoebas/mL in 50 mL falcon tubes (Dutscher SAS, Brumath, France) in medium culture. The amoebas were rinsed with PAS and centrifugated at 2000× g for 10 min. Four sets of samples from each W. magna of different condition culture were prepared for label-free Nano-LC-MS/MS analysis. Each sample was solubilized as previously described [45]. Briefly, samples were suspended in 200 μL of lysis buffer (100 mM Tris-HCl, pH 8.0, supplemented with 2% (wt/vol) sodium dodecyl sulfate and 100 mM dithiothreitol) followed by 5 min of heating at 95 °C. After a 3-min sonication at 20 W, the insoluble fraction was removed by centrifugation (12,000× g, 20 min) and soluble proteins were precipitated using a PlusOne 2-D cleanup kit (GE Healthcare) to remove SDS. The final pellet was resuspended in 200 µL of solubilization buffer (Urea 8M, Thiourea 2M, 100 mM NaCl, 25 mM Tris, pH 8.2) and dialyzed twice against 1 L of 50 mM ammonium bicarbonate pH 7.4, Urea 1M (4 h and overnight) using Slide-ALyzer Dialysis Cassettes 2K MWCO (Pierce Biotechnology, 122 Rockford, IL, USA). Dialyzed fractions were collected, and proteins were quantified by Bradford assay using Coomassie (Biorad). The dialyzed fraction was used as template for global proteomic analysis. Briefly, 50 µg of total soluble proteins were reduced with 10 mM dithiothreitol (Euromedex, Souffelweyersheim, France) for one hour at 30 °C, and then alkylated with 20 mM iodoacetamide (Sigma, Saint-Quentin Fallavier, France) for one hour in the dark. Protein digestion was performed by adding 2 µg of sequencing-grade trypsin solution (Promega, Charbonnières, France) to alkylated proteins and incubated overnight at 37 °C. The digested sample was then desalted using Pierce Detergent Removal Spin Columns (Thermo Fisher Scientific, Illkirch, France) and analyzed by mass spectrometry, as described below. For the three biological replicates of amoebas cultivated in adhesion, we obtained protein concentrations of 1.9, 2.5, and 1.1 (µg/µL) respectively. For amoebas cultivated in suspension, we obtained protein concentrations of 4.4, 4.7, and 4.7 (µg/µL). Table S1 presents the complete results obtained from protein extraction.

2.4. Label-Free Quantitative Nano-LC-MS/MS Proteomic Analysis

Protein digests were first separated by Ultra Performance Liquid Chromatography (UPLC) using the NanoAcquity UPLC System (Waters, Milford, CT, USA) connected to a Synapt G2Si Q-TOF ion mobility hybrid mass spectrometer (Waters). The chromatographic system was used in 1D configuration with an analytical column (ACQUITY UPLC M-Class peptide CSH C18 Column, 130Å 1.7 µm, 75 µm × 100 mm, Waters) after a trapping column (ACQUITY UPLC M-Class Symmetry C18 Trap Column, 100Å 5 µm 2G V/M, 180 µm × 20 mm, Waters). Eluted peptides were then separated using a 100 min gradient (300 nL·min−1; 0.5 to 40% acetonitrile–0.1% formic acid). Data-independent MS/MS analysis was performed with the ion mobility feature (HDMSe method). The parameters of ion source were as follows: Capillary voltage at 3 kV, sampling cone voltage at 40 V, ion source temperature at 90 °C, cone gas flow at 50 L·h−1. Transfer collision low energy was set to 5 V and trap collision low energy was set to 4 V. The high energy ramp was applied from 4 V to 5 V for the trap collision and from 19 V to 45 V for the transfer collision enabling fragmentation of the ions after the ion mobility cell and before the time-of-flight (TOF) MS. Each sample was injected in triplicate.
The acquired files were imported into Progenesis QI software Version 2.0 (Nonlinear Dynamics, Newcastle, UK) for label-free quantification analysis. The data were automatically aligned against W. magna proteins (https://www.mediterranee-infection.com/acces-ressources/donnees-pour-articles/willaertia-magna-c2c-maky/) and normalized. Processing parameters were 150 counts for the low energy threshold and 30 counts for the elevated energy threshold. The database used was the same as the one described above. Search tolerance parameters were peptide and fragment tolerance, 15 ppm, FDR < 1%; Minimum Ion matching requirements were three fragments per peptide, seven fragments per protein and two peptides per protein. The enzyme specificity was trypsin allowing 1 missed cleavage. The accepted modifications were carbamidomethyl of cysteine (fixed), oxidation of methionine (variable), carbamylation of lysine and N-terminal (variable), and deamidation (variable) of asparagine and glutamine. Protein normalization was performed according to the relative quantitation using non-conflicting peptides. To determine the significance of changes between samples, a significant ANOVA (p-value < 0.001) and a fold change greater than 2 were used as thresholds to define differently regulated proteins (DRPs). The results obtained from proteomics analysis are detailed in Table S2.

2.5. Analysis on Biological Function of Differentially Regulated Proteins

To assign the biological functions of DRPs, we proceeded to homology searches for the proteins in public protein databases. First, the protein sequences were searched by BLASTp against the NCBI non redundant protein sequence database with an E-value cut-off of 1 × 10⁴ [46]. We mapped the protein sequences against the Cluster of Orthologous Group of proteins (COG) and Gene Ontology (GO) databases using EggNOG [47,48] with diamond as mapping mode. The visualization of GO annotation was performed using WEGO online software [49]. In a second time, we compared the protein sequences against the Kyoto Encyclopedia of Genes and Genomes Pathway (KEGG; http://www.genome.jp/kegg) using BLASTKoala online [50]. Conserved domain database (CDD) and InterPro were used for the identification of conserved domains in the sequence of DRPs [51,52,53].

2.6. Quantitative Real-Time Reverse-Transcription-Polymerase Chain Reaction (qRT-PCR)

In order to validate the DRP results, 10 genes encoding DRPs were selected to quantify their expression by real-time quantitative reverse transcription PCR (qRT-PCR) using SYBR Green (Roche, Meylan, France) and 1 gene encoding a histone protein was used as internal control. To choose the internal control, we identified the set of proteins whose regulation was not affected by culture conditions. Among these proteins, we selected a panel of candidate genes. We quantified expression level of these candidate genes under two different culture conditions (suspension and adhesion). We selected the most stable gene among the set of reference candidate genes tested. RNAs from W. magna in each culture condition were extracted using the RNeasy Mini Kit (Qiagen Corp., Hilden, Germany) following the manufacturer’s protocol. Total RNA was eluted in a 50 μL volume of RNase-free water. RNaseOUT (Thermo Fisher Scientific, Illkirch, France) was added to the eluate to prevent RNA degradation. DNA digestion was performed using Turbo DNase (Life Technologies, Carlsbad, USA) at 37 °C for 4 h. The design of primer for each gene was performed using the Primer3 website (http://frodo.wi.mit.edu/primer3/). Primers are listed in Table S3. Extracted RNAs were reverse transcribed into cDNA using random primers with the SuperScript VILO Synthesis Kit (Invitrogen, Cergy-Pontoise, France). The synthesized cDNAs were purified with the Agencourt AMPure XP system (Beckman Coulter Inc., Brea, CA, USA). Quantitative PCR was carried out in a CFX96 real time system (Biorad) using the following cycling conditions: 95 °C for 5 min, followed by 45 cycles of 95 °C for 10 s, annealing at 60 °C for 30 s and elongation at 72 °C for 30 s. As in Li et al.’s study, the relative expression (fold change) of each gene was calculated with the 2−ΔΔCt method and statistics were generated using Student’s t-test [54,55]. All experiments were performed with three biological replicates.

2.7. Analysis of Lipid Classes by Hydrophilic Interaction Liquid Chromatography-Mass Spectrometry (HILIC-MS)

For each condition, triplicate amoeba cultures were centrifuged at 6000× g during 10 min in order to collect humid cell pellets. Total lipids were extracted according to the Bligh and Dyer protocol [56]. Chloroform extracts were then dried under a stream of nitrogen and reconstituted in chloroform/methanol 50% (v:v) at a final concentration of 6 mg of lipid content per 100 µL. Lipid samples were diluted 100 times into methanol before injection (5 µL) onto a HILIC column (BEH HILIC, 2.1 × 100 mm, 1.7 µm, Waters, Guyancourt, France). Lipids were eluted from the column using a composition gradient of the following solvents: A = 5% water/95% acetonitrile, B = 50% water/50% acetonitrile, both at 10 mM ammonium acetate pH8 as previously described [57]. Lipids were ionized in the positive and negative ionization modes using a Z-spray source (2.8 kV, 35V for ESI+ and 1.9 kV 40 V for ESI-). Ions were then monitored using an HD-MS method including ion mobility and single stage MS scans (ranged from 50 to 2000 m/z, 0.1 s per scan, lockmass calibration using Leucine Enkephaline). Multivariate statistics were performed for each ionization mode on all detected ion components using the UNIFI and EZ info software (with normalization of data) [58]. A PLS-DA model was calculated from the principal component analysis (PCA) in order to select form S-Plot (>97%) and VIP (>1) plots, the most discriminating markers for both culture conditions. Lipid classes were attributed according to the retention times of an injected standard (Splash Lipidomix, Avanti Polar Lipids, Alabaster, AL, USA). Markers masses were then searched with the COMP DB LipidMAPS database with a delta window of 0.005 m/z and all enabled chains. The database lipid charge was checked versus the ion component extracted from the MS raw data.

2.8. Fatty Acid Methyl Ester (FAME) Analysis by Gas Chromatography/Mass Spectrometry

Cellular fatty acid methyl ester (FAME) analysis was performed by GC/MS, as previously described [59,60]. Fatty acid methyl esters were prepared as described by M. Sasser [61]. Briefly, fatty acid methyl esters were analyzed by gas chromatography/mass spectrometry (GC/MS). Compounds were separated using an Elite 5-MS column and monitored by mass spectrometry (Clarus 500—SQ 8 S, Perkin Elmer, Courtaboeuf, France). Spectral database search was performed using MS Search 2.0 operated with the Standard Reference Database 1A (NIST, Gaithersburg, MD, USA) and the FAMEs mass spectral database (Wiley, Chichester, UK).

2.9. Electron Microscopy

For scanning electronic microscopy, a suspension of W. magna in trophozoite forms (for the amoebas cultivated in suspension and in adhesion) form was immersed into a 2.5% glutaraldehyde fixative solution. A drop of the suspension was deposited on a slide, then gently washed with water, air-dried and examined under the Emission Scanning Electron Microscope SU5000 (approximately 33 cm wide by 60 cm tall, Hitachi, Japan).

3. Results

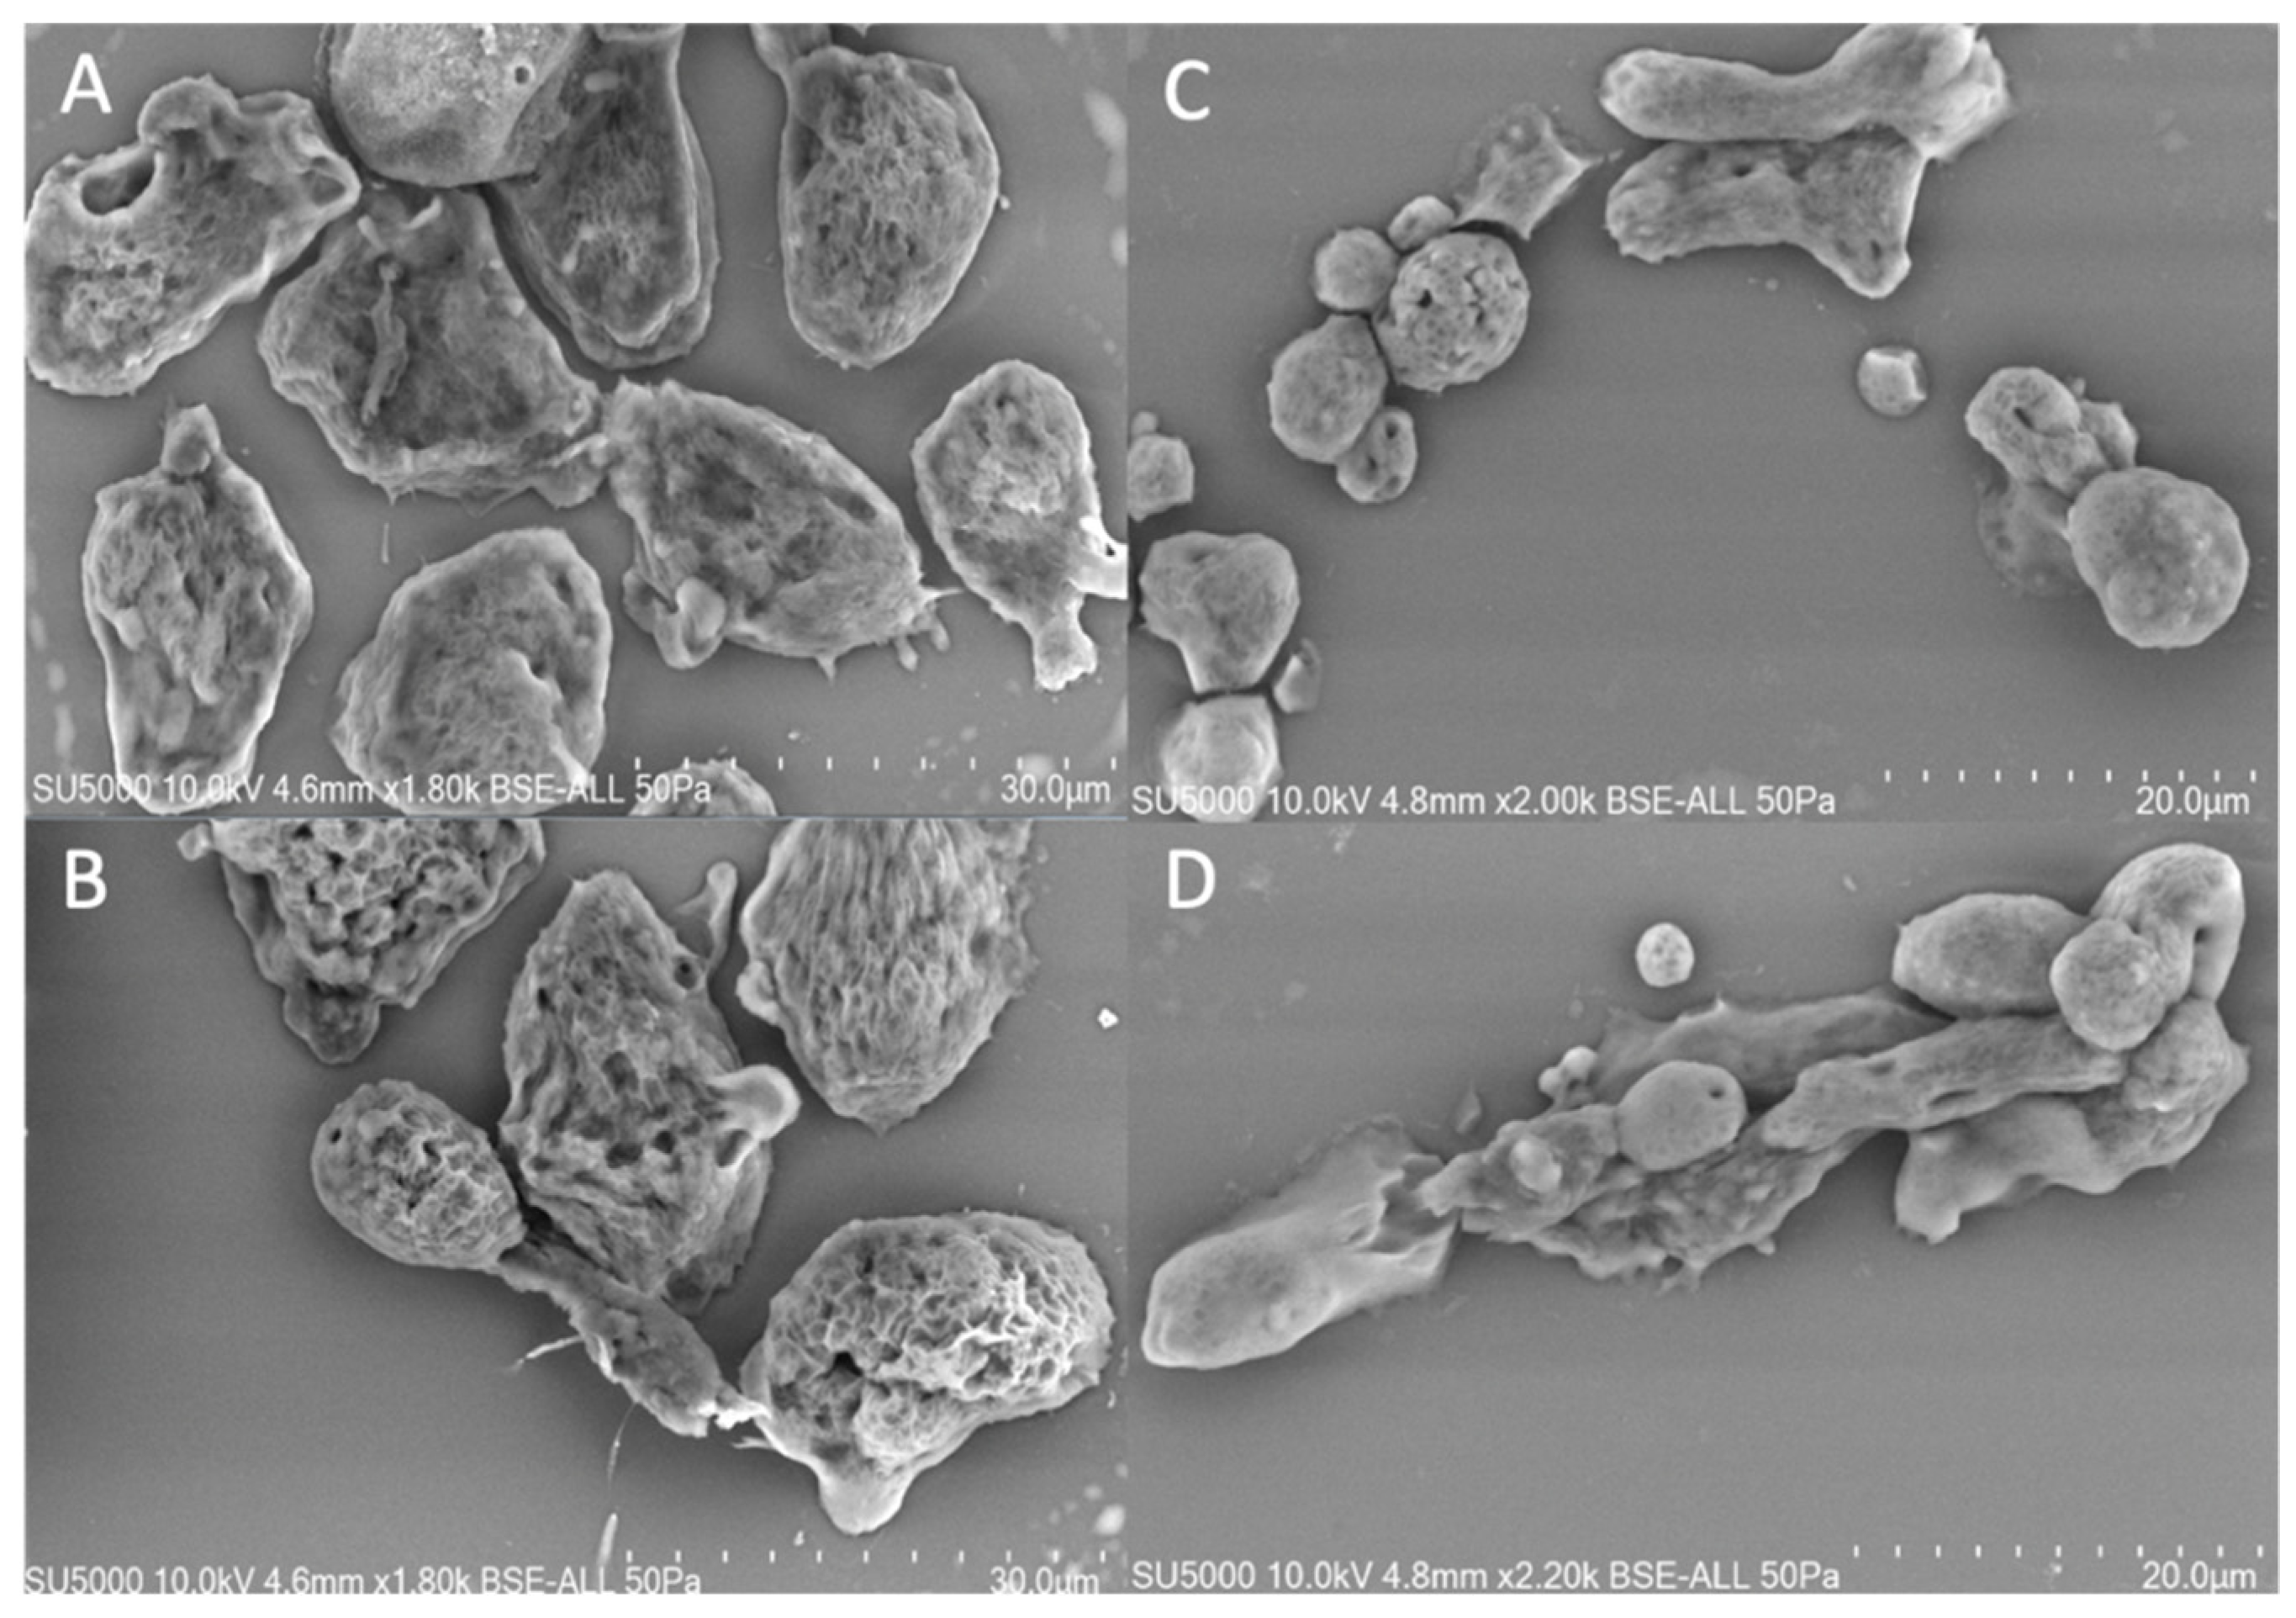
3.1. Phenotype of Willaertia magna Cultivated under Two Different Conditions

The adherent amoebas exhibited an irregular shape that constantly changed giving rise to the presence of several pseudopods (Figure 1A,B). The suspended amoebas exhibited a more regular shape with a more rounded morphology and exhibited much fewer pseudopods (Figure 1C,D). The length of the amoebas cultivated under two different conditions exhibited approximately similar size, with length of 21 µm (+/−3.34) and 19.5 µm (+/−4.50) for the amoeba grown in adhesion and suspension, respectively (Table S4).
However, the amoeba in adhesion (14.2 µm) is approximately 3 times width than the cultivated amoebas in bioreactor (5.2 µm). We observed the presence of pseudopodia for amoebas in adhesion, which is characteristic of the active movement of the amoebas.

3.2. Identification of Differentially Regulated Proteins

A total of 804 non-redundant proteins were identified using UPLC. The significance of differences in protein abundance was established using p ≤ 0.001 and |FC| ≥ 2 as thresholds (Table S5). Based on these criteria, 61 differentially regulated proteins (DRPs) were detected between W. magna cultivated in suspension and adhesion, of which 21 (34.4%) were down-regulated and 40 (65.6%) were up-regulated in adhesion compared with suspension cell growth (Table S5).
Among the 61 DRPs, 32 had a function assigned in the NCBI nr database, whilst 28 proteins had an uncharacterized function, including 5 hypothetical proteins, 21 predicted proteins and 2 ORFans. Most of the proteins (n = 52) had best hits with Naegleria gruberi, a free-living amoeba phylogenetically close to W. magna (Table S5). The proteins exhibiting the greatest differential abundance between the two conditions were proteins with unknown functions for amoebas in both suspension and adhesion culture (Table S5).
A total of 48 DRPs (78.7%) identified by proteomics analysis, were classified into 14 COG categories, among which “post-translational modification, protein turnover, chaperones” represented the largest group (group O, 12 DRPs), followed by “energy production and conversion” (group C, 8 DRPs) and “translation, ribosomal structure and biogenesis” (group J, 5 DRPs) (Figure 2, Table S5).
GO analysis was carried out to obtain fundamental function of genes and information on molecular functions, cellular components and biological processes. After mapping the DRPs against the GO database, we observed that 28 genes (45%) were assigned to GO terms. A same gene could be involved in different GO terms. Genes among the following classes: biological process (27), cellular process (26), metabolic process (21) and response to stimulus (17) were the most abundant. For molecular function (26), the dominant group was binding (18) followed by catalytic activity (17) and structure molecular activity (4). For the cellular components (28), the three most prevalent groups were cell (28), cell part (28) and organelle (21) (Figure 3).
To investigate the biological functions and metabolic pathways of protein sequences, we performed an enrichment analysis with the KEGG pathway database. Among the 61 DRPs, 45 (72.6%) DRPs were mapped to 22 pathways in the KEGG database. The proteins involved in metabolic pathways were the most represented (n = 12; 27%), followed by those involved in cellular processes (13%) and genetic information processing (13%). KEGG enrichment indicated that most of these DRPs were involved in carbohydrate metabolism, such as citrate cycle and glycolysis/gluconeogenesis. We also identified some DRPs involved in “nucleotide metabolism” (n = 1; 2%) and “lipid metabolism” (n = 1; 2%) (Figure 4).

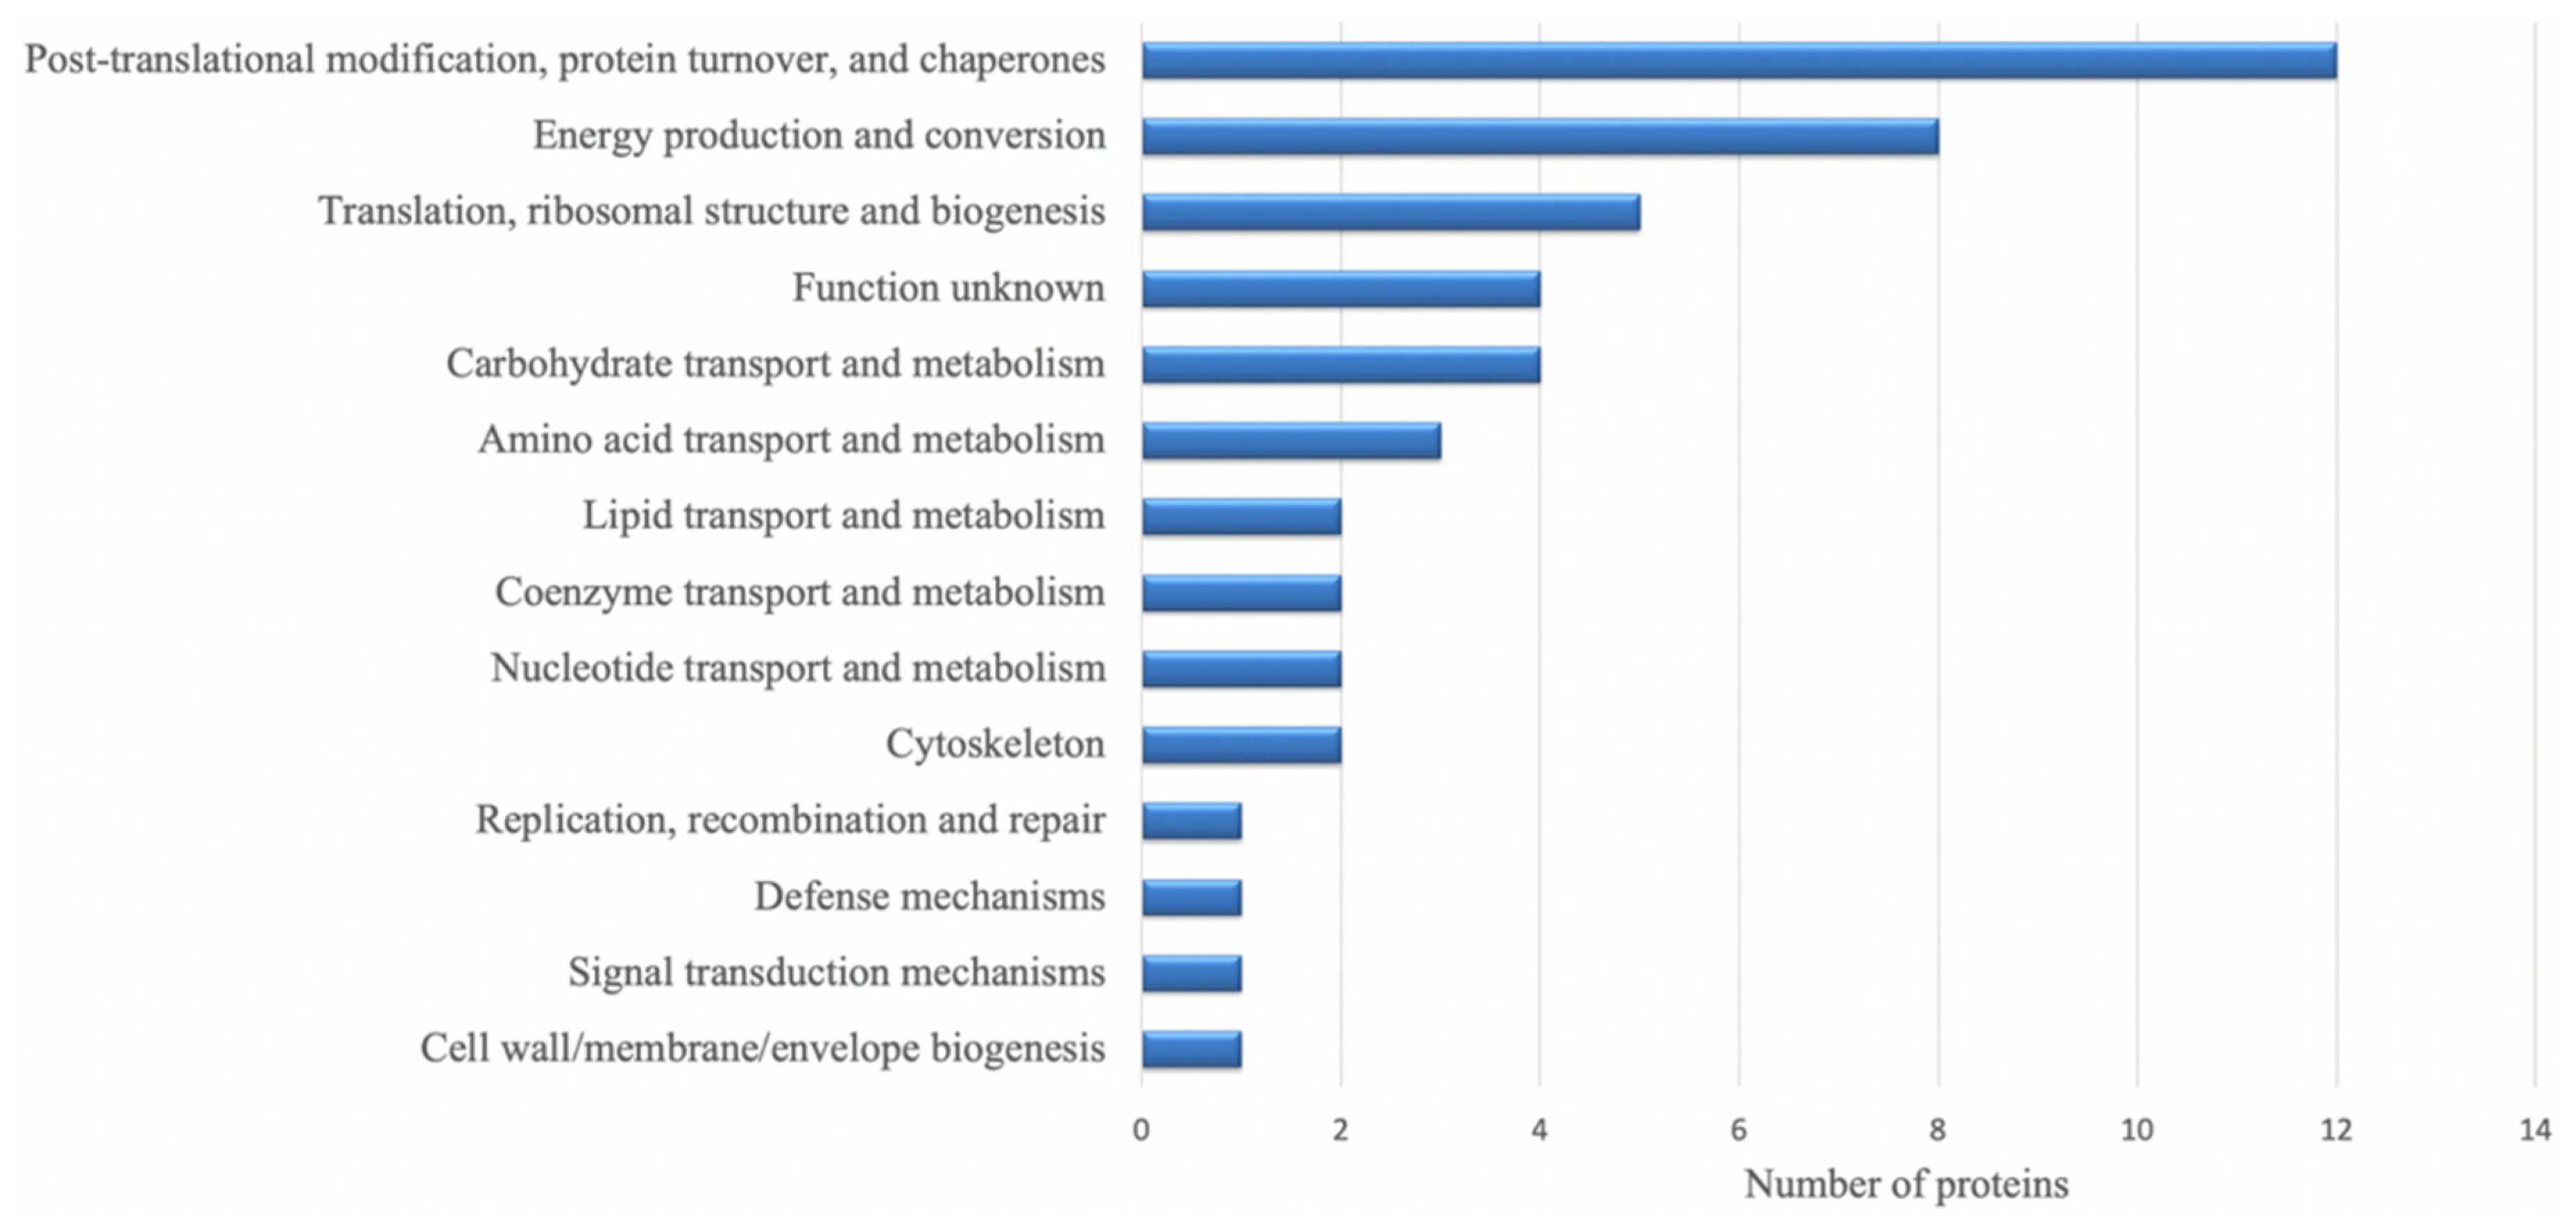
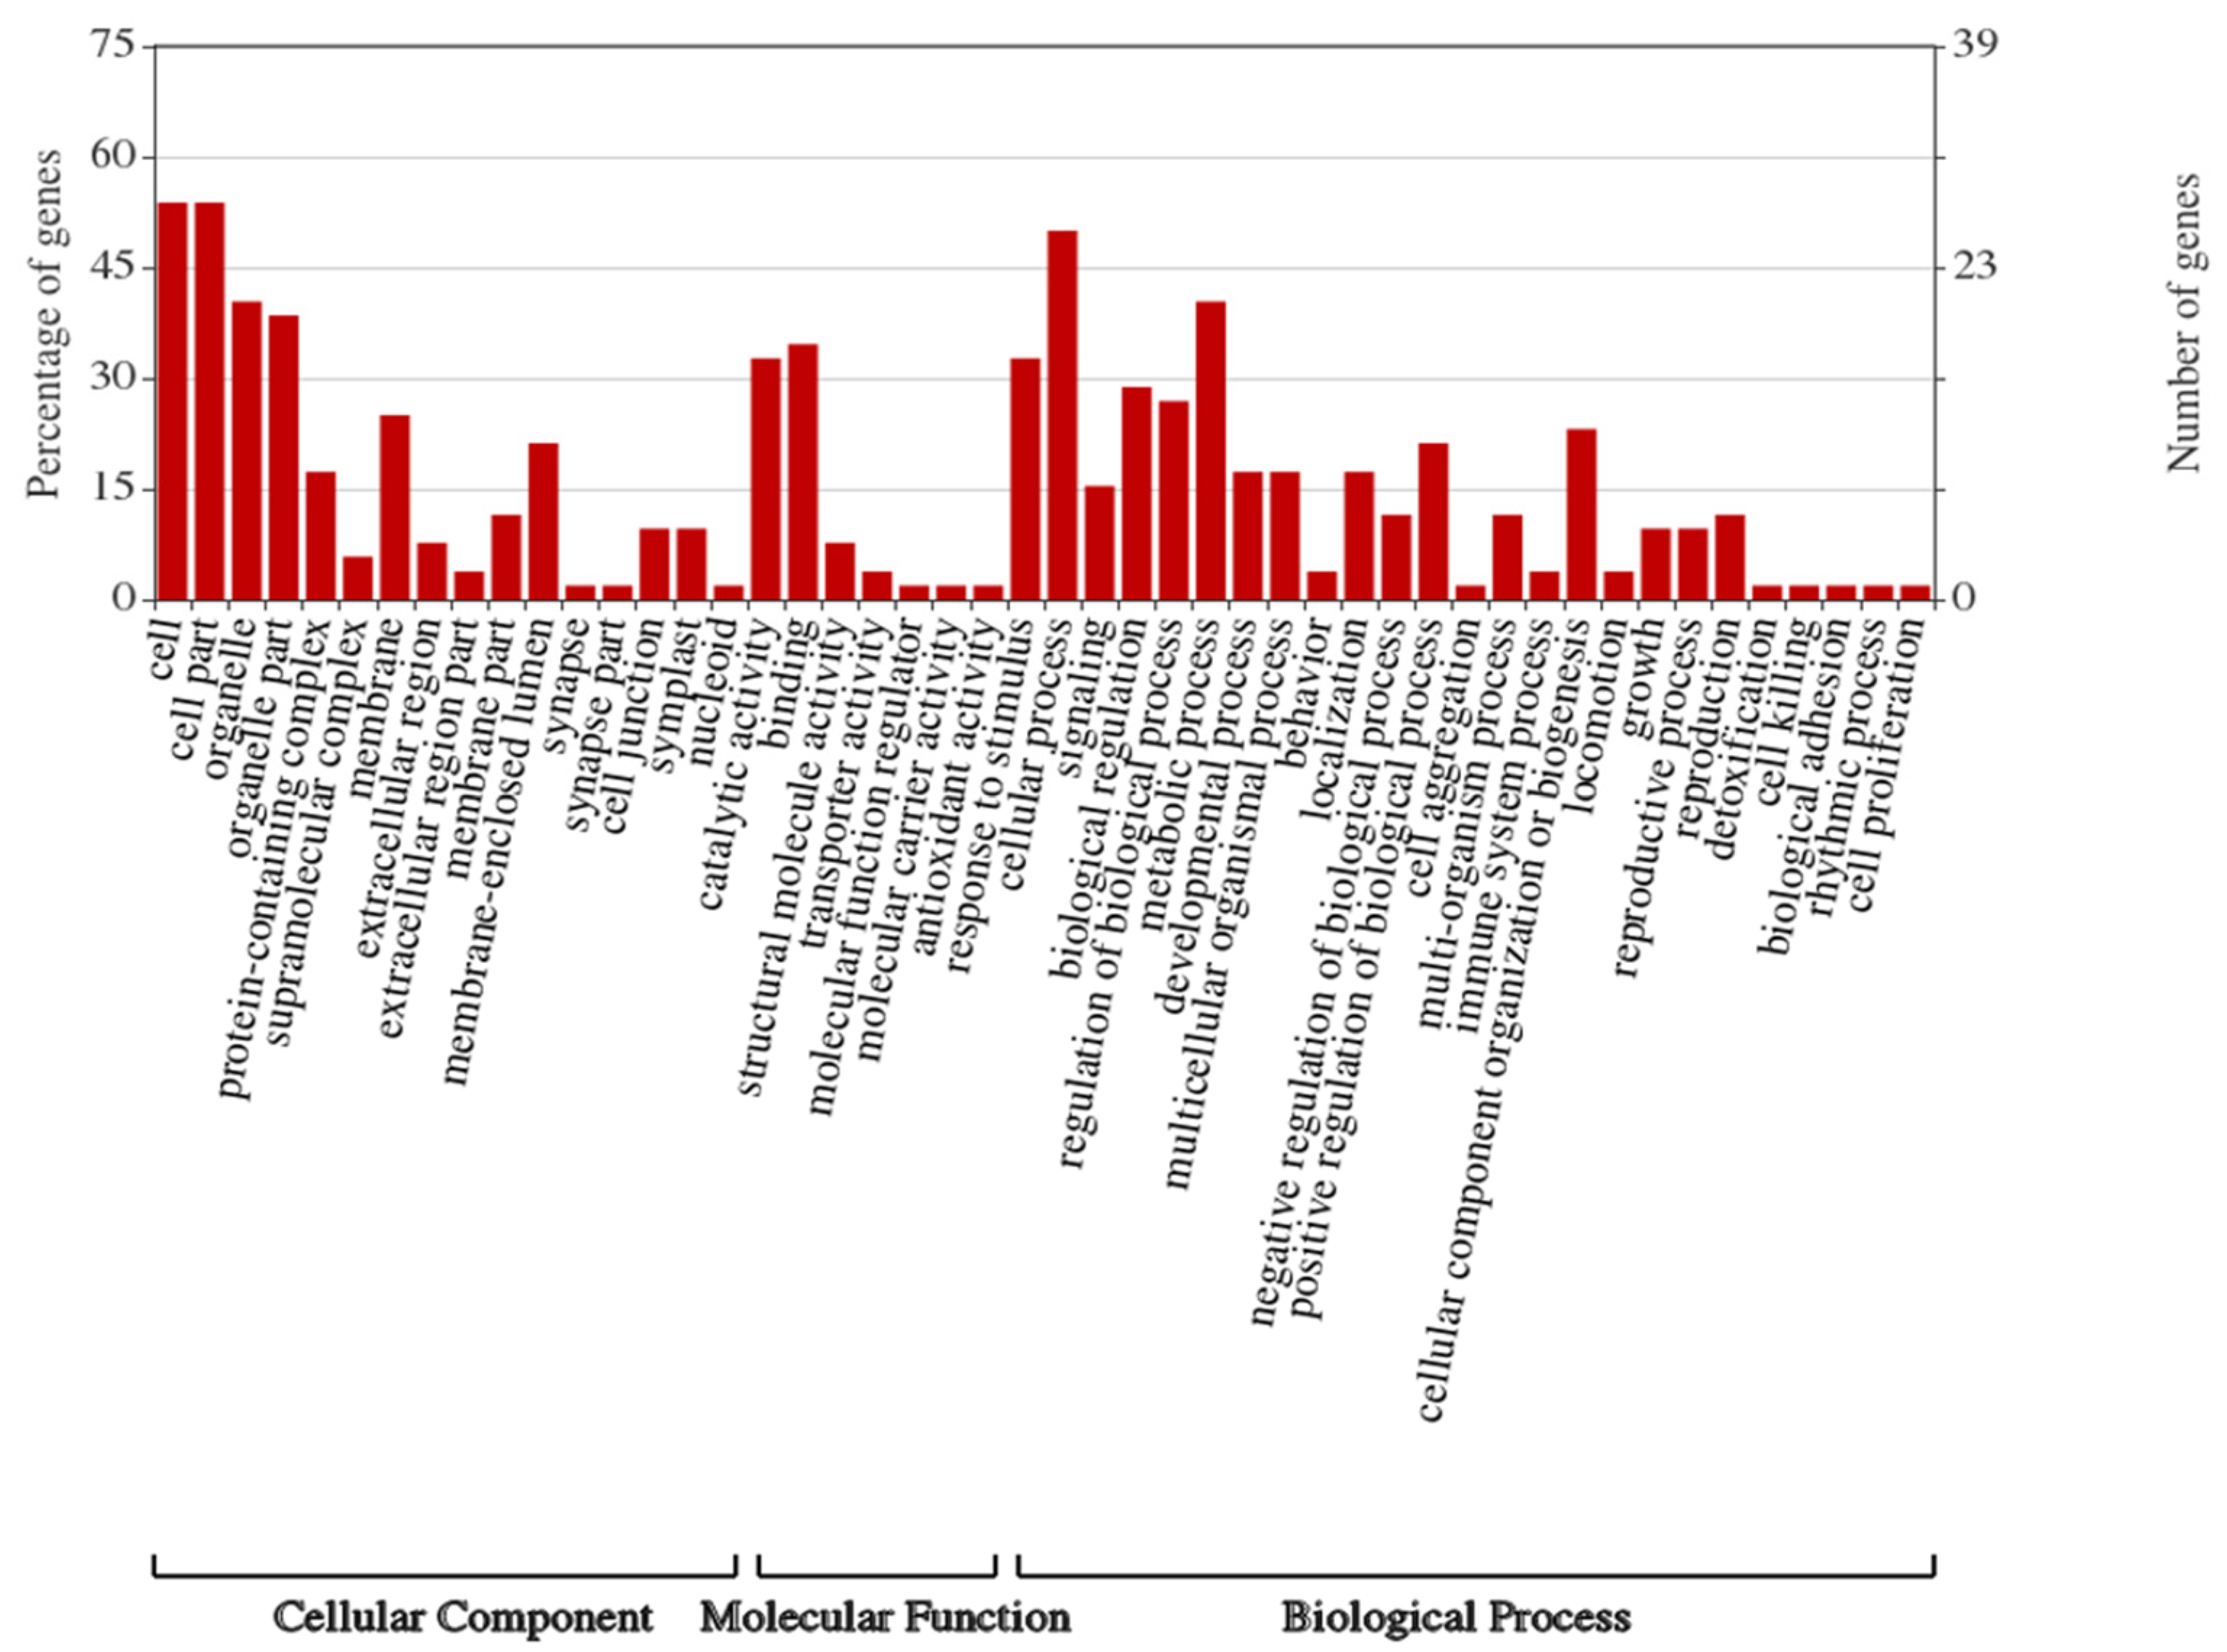
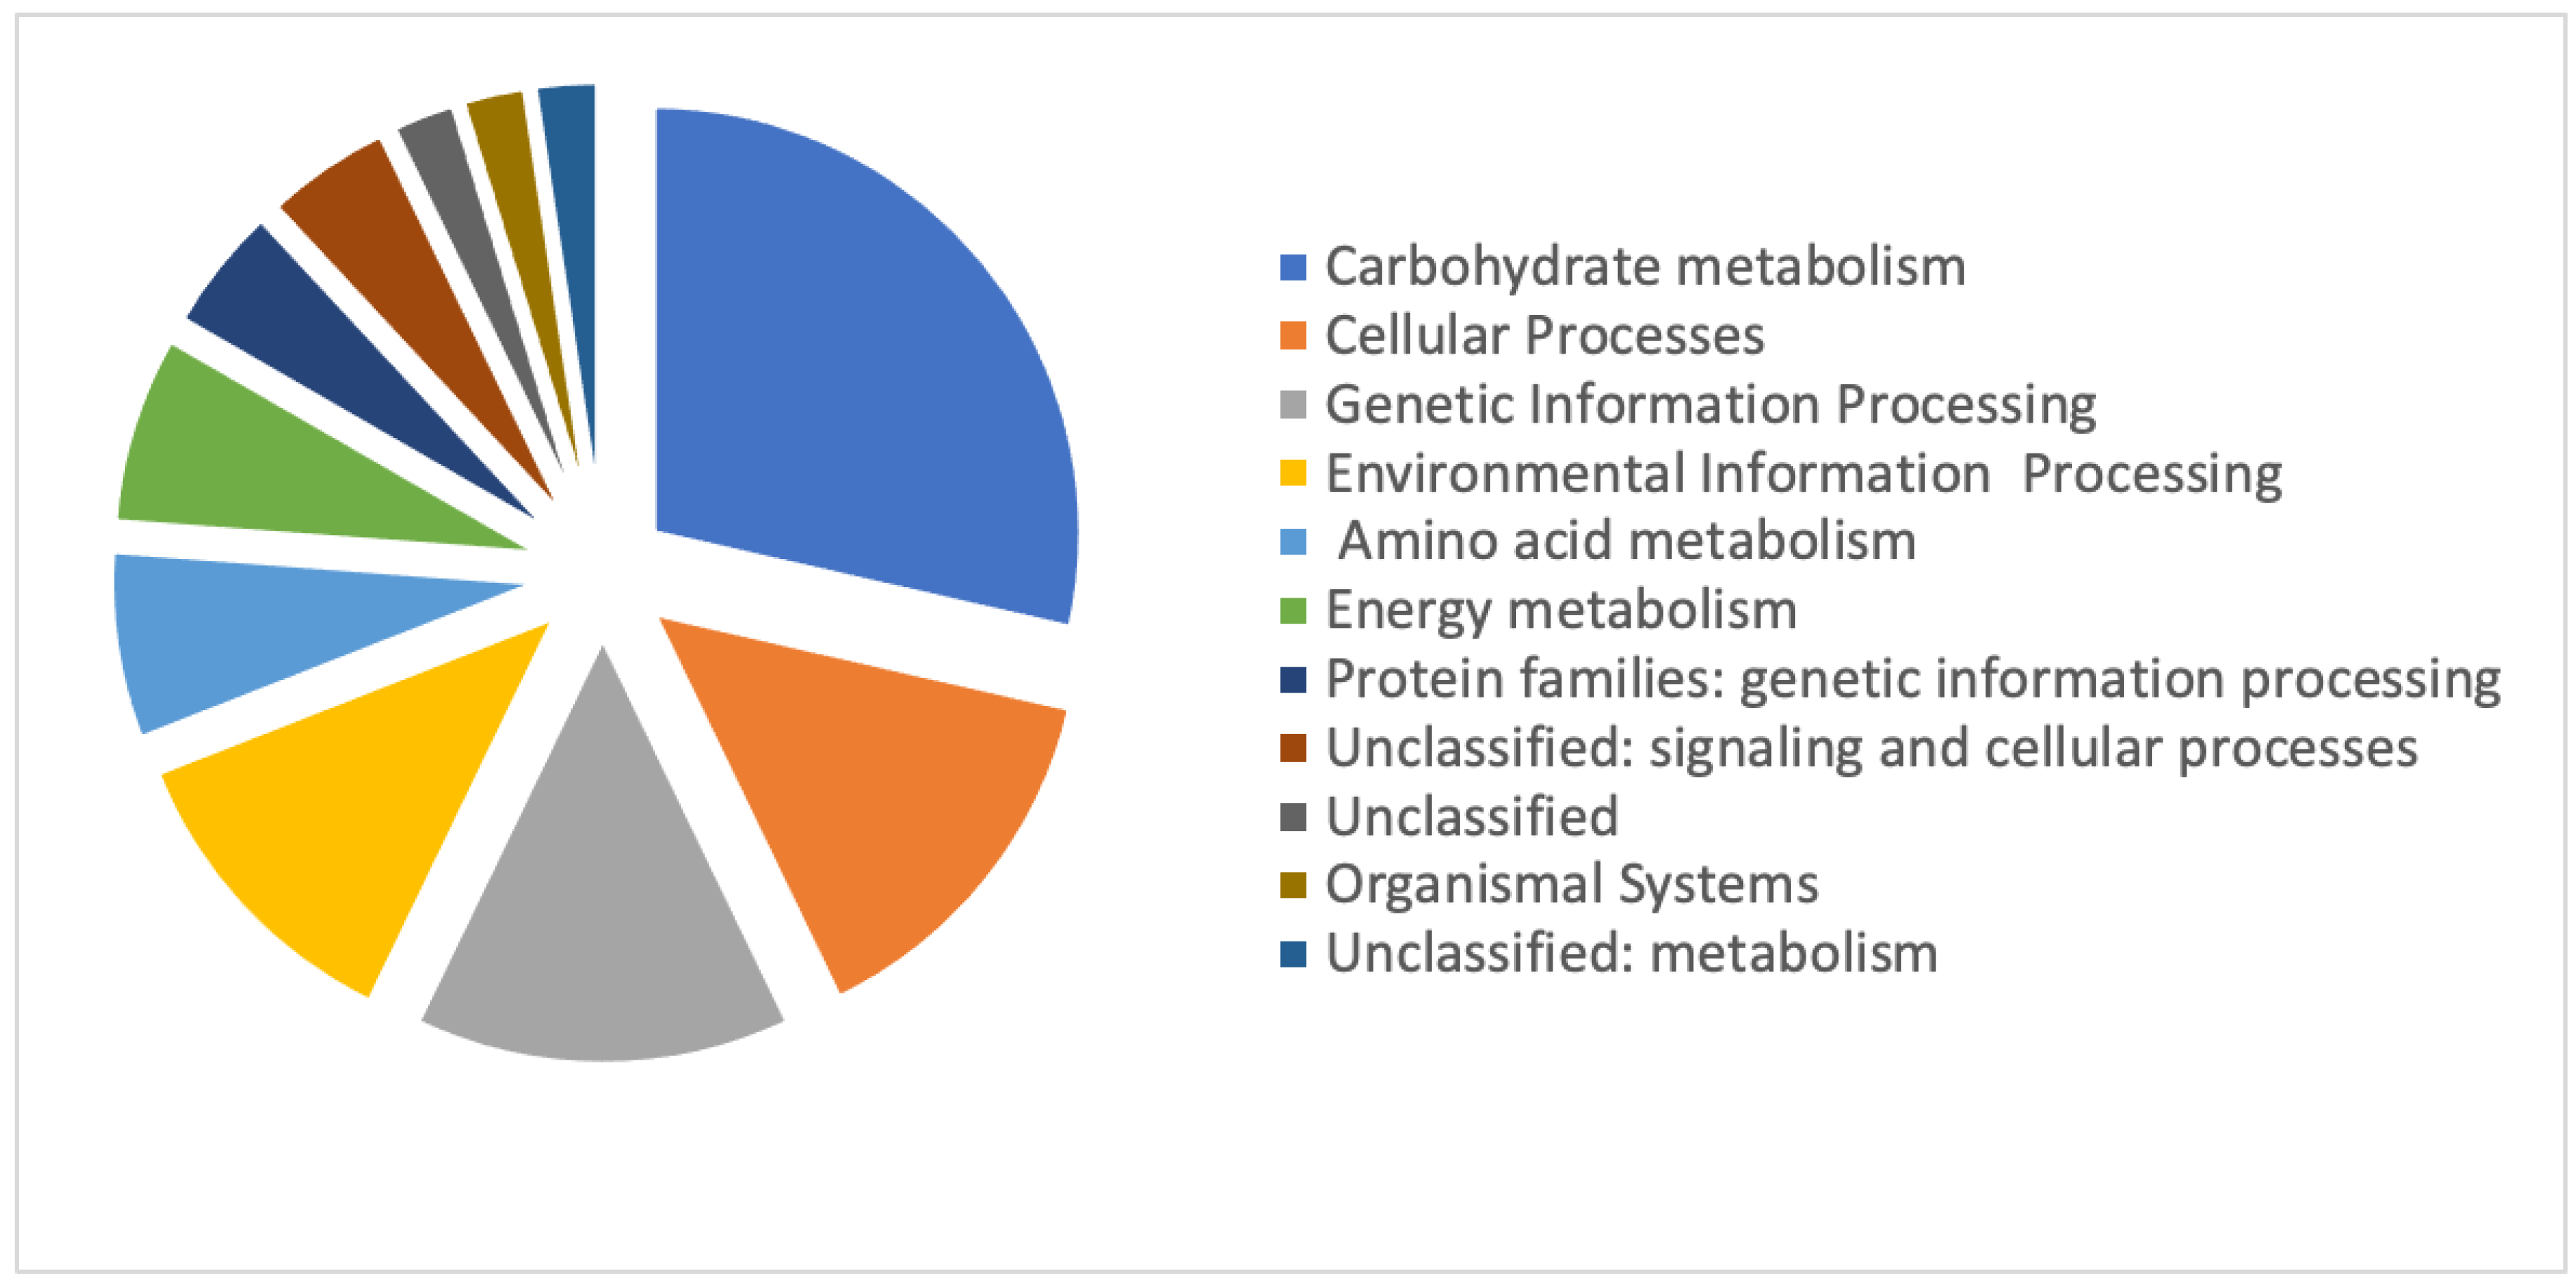
3.3. Identities of Differentially Regulated Proteins

Among the DRPs identified for the amoebas cultivated in adhesion, we found actin alpha, actin beta, tubulin, and profilin proteins (Table 1). These four proteins are related to the cytoskeleton organization. Of the 40 DRPs in adhesion cell growth, a high number (n = 13; 31%) were found related to metabolisms. Most of these proteins are involved in carbohydrate metabolism, including malate dehydrogenase, pyruvate dehydrogenase, glyceraldehyde 3-phosphate dehydrogenase, triose phosphate isomerase, or citrate synthase (Table 1). Furthermore, we observed an upregulation of 4 proteins involved in the nucleotide and amino acid pathway, such as glutamate dehydrogenase or cystathionine gamma-synthase (Table 1). In addition to the proteins related to metabolisms, the analysis revealed in adhesion cell growth a high abundance of proteins related to energy, signaling and redox regulation (thioredoxin) (Table 1). In a previous study, we reported the presence of proteins specifically related to defense mechanism in the proteome of W. magna cultivated in suspension [33]. In our differential proteomic analysis, we recovered some of these proteins related to the mechanism, including four cathepsin proteins involved in catabolism and lysosomal protease. These cathepsins were the only proteins related to the defense mechanisms that were differentially regulated according to the culture method (Table 1). For the cells cultivated in suspension, we reported an upregulation in suspension cell growth of proteins related to stressful conditions such as the heat shock condition (n = 4, heat shock proteins) (Table 2). In addition, we observed the over-regulation of two proteins playing a role in the membrane structure and four proteins involved in metabolism pathways, including lipid (5 long-chain acyl-CoA synthetase and alcohol dehydrogenase) and amino acid metabolisms (maleylacetoacetate isomerase and 5-methyltetrahydropteroyltriglutamate--homocysteine methyltransferase) (Table 2). Finally, two proteins (large subunit ribosomal protein L7/L12 and Ran GTPase binding) related to genetic information were found to be over-regulated and three were down-regulated in suspension cell growth (large subunit ribosomal protein L24e, large subunit ribosomal protein L23e and RRM domain-containing protein) (Table 1 and Table 2). To complete the differential proteomic analysis, we also investigated the expression levels by qRT-PCR of 10 selected genes encoding DRPs. The transcription levels of these 10 mRNAs were correlated with the results of differential proteomics analysis (Figure S1 and Table S3).

3.4. Analysis of Lipid Classes

First, we described the lipid classes of the amoeba cultivated according to two different conditions. The LC/MS analysis reported overall similar lipid classes profiles, including apolar lipids, free fatty acids, phospholipids, sphingosines and lysophospholipids (Table S6). The peak areas for each lipid class were comparable between the culture conditions and these results were confirmed for both positive and negative electrospray ionization modes used in the study (Table S6). According to the LC/MS results, the lipid classes that exhibited the greatest signal were phospholipids, precisely phosphatidylcholines (PCs) and phosphatidylethanolamines (PEs) (Table S6). Nevertheless, the LC/MS analysis of lipid classes displayed different chromatogram peak profiles for cells cultivated under two different conditions (suspension and adhesion). Chromatogram profiles were comparable between samples and injection replicates. This fact suggests the presence of different chemical structures between the two conditions within the same lipid classes. The multivariate analysis of the raw data confirmed the structure differences by PCA for the positive and negative ionization modes independently (Table S7). We then attempted to identify the discriminating markers and their belonging class. The extracted ion chromatograms were compared to known standards and the exact masses computed with the LipidMAPS database (Table S7). The results are summarized in Table 3. These results showed fewer markers in the case of cells grown in suspension. The adhesion culture indicated several lysophospholipid markers and a greater diversity of glycolipid or phospholipid markers. In a second time, we investigated the composition of total fatty acids (free and included in complex lipids, such as phospholipids or acylglycerols). Comparative analysis of total fatty acids profiles revealed similar classes of structure, namely saturated, unsaturated and branched carbon chains (Table S8). Yet, we found a higher abundance of longer carbon backbones for the amoebas cultivated in the adhesion mode (Table S8).

4. Discussion

For the first time, the behavior of a FLA is compared according to two culture modes using multi-omics approaches.
A previous transcriptomics and proteomics study showed that W. magna C2c Maky cultivated in a bioreactor had the weapons to deal with bacterial attacks in the environment [33]. Indeed, we detected production of several proteins involved in the mechanism defenses of eukaryotic organisms against foreign microbes. Among the proteins detected in the DRP study, we observed that the essential proteins associated with the defense mechanisms were not differentially regulated and were therefore probably not impacted by the culture method.
However, we reported some differences between the two culture modes for the cell growth. Indeed, the protist seems to promote the metabolism of carbohydrate when cultivated in adhesion. This finding was correlated with an over-regulation of proteins related to energy. Culture media were similar for each cell growth, but fetal bovine serum (FBS) was removed from the amoebal culture in suspension to reduce the cost of large-scale cultivation. We can suggest that the proteins and growth factors contained in the FBS could improve the assimilation of glucose by W. magna in adhesion culture. Therefore, a source of carbohydrate (other than glucose) could be added to the media to provide more energy at the cells cultivated in suspension. Glucose oxidation is an important energy source for cells; however, this process generates the formation of reactive oxygen species (ROS) extremely harmful to the cells. To mediate the oxidative stress, thioredoxin proteins were over-regulated for W. magna cultivated in adhesion [62,63]. The energy provided by carbohydrate metabolism is notably essential to ensure amoeboid mobility and maintaining the cytoskeleton. Among the DRPs, we observed the over-regulation of proteins related to the cytoskeleton structure. Amoebas migration is initiated by the polymerization of actin that allows the formation of the organelle indispensable for amoeboid movement [64]. The over-regulation of these proteins revealed a dynamic activity of W. magna cultured in adhesion. In addition, these results were correlated with the large size and quantity of amoeba pseudopods in adhesion culture.
When W. magna was cultured in bioreactor, we observed over-regulation of long-chain acyl- coenzyme A (CoA) synthetase and alcohol dehydrogenase which are proteins involved in the lipid metabolism pathway. Alcohol dehydrogenase is an enzyme regulating the biosynthetic pathway of glycerol [65]. This carbon source is converted into intermediate metabolites used for the lipid biosynthesis, including the formation of fatty acids activated through acyl-CoA [66,67]. In addition, we found an over-regulation of homocysteine methyltransferase protein, which is an enzyme implicated in methionine formation [68]. This enzyme is also known to be involved in the metabolism of PCs, a class of over-represented lipids for the amoebas cultivated in bioreactor (in suspension). The use of choline or homocysteine, which are precursors of methionine, could be beneficial to improve the culture of amoebas in bioreactors. Otherwise, the stress of cells cultivated in suspension was revealed by the over-regulation of heat-shock proteins. A drop-in culture temperature could thus allow the production of less stressed cells.
An investigation on total lipid classes was achieved to complement the proteomics analysis. Our survey has shown that amoebas are composed of a similar set of lipid classes regardless of the culture mode. Interestingly, we found that phospholipids were the most represented lipids for W. magna cultivated in the two culture modes. However, we pointed out specific lipid markers according to the culture condition used. Thus, growth cell in adhesion showed the presence of specific glycolipid markers that could be related to the physical state of the amoebas and that could be involved in cell-to-cell interactions [69,70]. Noteworthy, glycosphingolipids are known to be involved in the cell-to-cell communication [71,72]. In adhesion, W. magna consumed a large amount of carbohydrates, which could be correlated with a high proportion of glycosylated lipids. Lysophospholipids have been reported to be involved in the membrane shaping process and bending, but also as mediators in signaling cascades for migration or cell-to-cell attachment [73,74]. Their increase during adhesion cell growth compared to suspension could therefore be linked to these processes. W. magna cells in adhesion compared to the suspension condition exhibited the formation of phosphatidic acid structures, which are usual minor components of the cell membrane. Speranza et al. reported the interaction of PAs with actin-related proteins in order to promote actin polymerization [75]. The higher contents of phosphatidylcholine lipid markers that we observed in suspension culture condition could be related to these proteomics results.

5. Conclusions

In conclusion, the study allowed to improve knowledge on the understudied amoebic field. This survey provides new insights into the mechanisms used by W. magna to adapt to different culture conditions. Indeed, W. magna regulated its protein and lipid metabolism to grow in different culture conditions. Therefore, multi-omics approaches are essential tools to study the molecular responses and biology of FLAs.

Supplementary Materials

The following are available online at https://www.mdpi.com/2076-2607/8/11/1791/s1. Supplementary data (word file) contain Figure S1 and Table S3, Figure S1: comparison between qRT-PCR and proteomic results of abundance proteins, Table S1: data obtained from protein extractions of W. magna cultivated in different culture conditions, Table S2: The results obtained from proteomics analysis, Table S3: primers used for the quantification of mRNAs expression level by qRT-PCR, Table S4: measuring the length and width of the amoebas cultivated under two different conditions, Table S5: identification and annotation of the DRPs, Table S6: data of lipid classes profiles performed by LC/MS analysis, Table S7: identification of lipid markers related to different culture modes, Table S8: analysis of total fatty acids profiles.

Author Contributions

I.H. performed microscopic, proteomic and lipidomic analyzes and wrote the manuscript, N.A. performed lipidomic analyze and wrote the manuscript, P.D. performed proteomic experiment, S.A. performed protein extraction, A.F. performed microscopic pictures, O.A. performed and supervised the culture of the amoebas in bioreactor, A.C.L. analyzed the results, S.D. supervised the study and reviewed the manuscript, E.C. supervised the study, P.C. supervised the study and reviewed the manuscript, B.L.S. conceived and supervised the study and wrote the manuscript. All authors have read and agreed to the published version of the manuscript.

Funding

This work was supported by a grant from the French State managed by the National Research Agency under the “Investissements d’avenir (Investments for the Future)” program under the reference ANR-10-IAHU-03 (Méditerranée Infection) and by the Région Provence-Alpes-Côte-d’Azur and the European funding FEDER PRIMMI.

Conflicts of Interest

I. Hasni had a CIFRE grant supported by Amoeba society, O. Abbe and S. Demanèche are employed by Amoeba company.

References

  1. Pánek, T.; Čepička, I. Diversity of Heterolobosea. In Generic Diversity in Microorgisms; Caliskan, M., Ed.; IntechOpen: London, UK, 2012; ISBN 978-953-51-0064-5. [Google Scholar] [CrossRef] [Green Version]
  2. Adl, S.M.; Bass, D.; Lane, C.E.; Lukeš, J.; Schoch, C.L.; Smirnov, A.; Agatha, S.; Berney, C.; Brown, M.W.; Burki, F.; et al. Revisions to the Classification, Nomenclature, and Diversity of Eukaryotes. J. Eukaryot. Microbiol. 2019, 66, 4–119. [Google Scholar] [CrossRef] [PubMed] [Green Version]
  3. Conza, L.; Pagani, S.C.; Gaia, V. Presence of Legionella and Free-Living Amoebae in Composts and Bioaerosols from Composting Facilities. PLoS ONE 2013, 8, e68244. [Google Scholar] [CrossRef] [PubMed] [Green Version]
  4. De Jonckheere, J.F.; Dive, D.G.; Pussard, M.; Vickerman, K. Willaertia magna gen. nov., sp. nov. (Vahlkampfiidae), a thermophilic amoeba found in different habitats. Protistologica 1984, 201, 5–13. [Google Scholar]
  5. Dobson, P.J.; Robinson, B.S.; Christy, P.; Hayes, S.J. Low Genetic Diversity in Willaertia Magna From Wide Geographical Sources, and Characterisation of Willaertia Minor N. Sp. (Heterolobosea, Vahlkampfidae). J. Eukaryot. Microbiol. 1993, 40, 298–304. [Google Scholar] [CrossRef]
  6. Robinson, B.; Christy, P.; De Jonckheere, J. A temporary flagellate (mastigote) stage in the vahlkampfiid amoeba Willaertia magna and its possible evolutionary significance. Biosystems 1989, 23, 75–86. [Google Scholar] [CrossRef]
  7. Rivera, F.; Lares, F.; Gallegos, E.; Ramírez, E.; Bonilla, P.; Calderon, A.; Martinez, J.J.; Rodríguez, S.; Alcocer, J. Pathogenic amoebae in natural thermal waters of three resorts of Hidalgo, Mexico. Environ. Res. 1989, 50, 289–295. [Google Scholar] [CrossRef]
  8. Hasni, I.; Chelkha, N.; Baptiste, E.; Mameri, M.R.; Lachuer, J.; Plasson, F.; Colson, P.; La Scola, B. Investigation of potential pathogenicity of Willaertia magna by investigating the transfer of bacteria pathogenicity genes into its genome. Sci. Rep. 2019, 9, 18318. [Google Scholar] [CrossRef]
  9. Stout, J.E.; Yu, V.L. Legionellosis. N. Engl. J. Med. 1997, 337, 682–687. [Google Scholar] [CrossRef]
  10. Borella, P.; Guerrieri, E.; Marchesi, I.; Bondi, M.; Messi, P. Water ecology of Legionella and protozoan: Environmental and public health perspectives. Biotechnol. Annu. Rev. 2005, 11, 355–380. [Google Scholar] [CrossRef]
  11. Hamilton, K.A.; Prussin, A.J.; Ahmed, W.; Haas, C.N. Outbreaks of Legionnaires’ Disease and Pontiac Fever 2006–2017. Curr. Environ. Heal. Rep. 2018, 5, 263–271. [Google Scholar] [CrossRef]
  12. Yamamoto, H.; Sugiura, M.; Kusunoki, S.; Ezaki, T.; Ikedo, M.; Yabuuchi, E. Factors stimulating propagation of legionellae in cooling tower water. Appl. Environ. Microbiol. 1992, 58, 1394–1397. [Google Scholar] [CrossRef] [PubMed] [Green Version]
  13. Rowbotham, T.J. Preliminary report on the pathogenicity of Legionella pneumophila for freshwater and soil amoebae. J. Clin. Pathol. 1980, 33, 1179–1183. [Google Scholar] [CrossRef] [PubMed] [Green Version]
  14. Kilvington, S.; Price, J. Survival of Legionella pneumophila within cysts of Acanthamoeba polyphagafollowing chlorine exposure. J. Appl. Bacteriol. 1990, 68, 519–525. [Google Scholar] [CrossRef] [PubMed]
  15. Winiecka-Krusnell, E.L.J. Free-living Amoebae Protecting Legionella in Water: The Tip of an Iceberg? Scand. J. Infect. Dis. 1999, 31, 383–385. [Google Scholar] [CrossRef] [PubMed]
  16. Cirillo, J.D.; Falkow, S.; Tompkins, L.S. Growth of Legionella pneumophila in Acanthamoeba castellanii enhances invasion. Infect. Immun. 1994, 62, 3254–3261. [Google Scholar] [CrossRef] [PubMed] [Green Version]
  17. Greub, G.; Raoult, D. Microorganisms Resistant to Free-Living Amoebae. Clin. Microbiol. Rev. 2004, 17, 413–433. [Google Scholar] [CrossRef] [PubMed] [Green Version]
  18. Rowbotham, T.J. Isolation of Legionella pneumophila from clinical specimens via amoebae, and the interaction of those and other isolates with amoebae. J. Clin. Pathol. 1983, 36, 978–986. [Google Scholar] [CrossRef] [Green Version]
  19. Dey, R.; Bodennec, J.; Mameri, M.O.; Pernin, P. Free-living freshwater amoebae differ in their susceptibility to the pathogenic bacterium Legionella pneumophila. FEMS Microbiol. Lett. 2009, 290, 10–17. [Google Scholar] [CrossRef] [Green Version]
  20. Hasni, I.; Jarry, A.; Quelard, B.; Carlino, A.; Eberst, J.-B.; Abbe, O.; Demanèche, S. Intracellular Behaviour of Three Legionella pneumophila Strains within Three Amoeba Strains, Including Willaertia magna C2c Maky. Pathogens 2020, 9, 105. [Google Scholar] [CrossRef] [Green Version]
  21. Abu Khweek, A.; Amer, A.O. Factors Mediating Environmental Biofilm Formation by Legionella pneumophila. Front. Cell. Infect. Microbiol. 2018, 8, 38. [Google Scholar] [CrossRef]
  22. Beshay, U.; Friehs, K.; Azzam, A.-E.-M.; Flaschel, E. Analysis of the behaviour of Dictyostelium discoideum in immobilised state by means of continuous cultivation. Bioprocess Biosyst. Eng. 2003, 26, 117–122. [Google Scholar] [CrossRef] [PubMed]
  23. Weekers, P.H.H.; Wijen, J.P.H.; Lomans, B.P.; Vogels, G.D. Axenic mass cultivation of the free-living soil amoeba, Acanthamoeba castellanii in a laboratory fermentor. Antonie Leeuwenhoek 1996, 69, 317–322. [Google Scholar] [CrossRef] [PubMed]
  24. Weekers, P.H.; Vogels, G.D. Axenic cultivation of the free-living amoebae, Acanthamoeba castellanii and Hartmannella vermiformis in a chemostat. J. Microbiol. Methods 1994, 19, 13–18. [Google Scholar] [CrossRef]
  25. Tian, J.; Ishibashi, K.; Honda, S.; Boylan, S.A.; Hjelmeland, L.M.; Handa, J.T. The expression of native and cultured human retinal pigment epithelial cells grown in different culture conditions. Br. J. Ophthalmol. 2005, 89, 1510–1517. [Google Scholar] [CrossRef] [PubMed] [Green Version]
  26. Plain, N.; Largeau, C.; Derenne, S.; Couté, A. Variabilité morphologique de Botryococcus braunii (Chlorococcales, Chlorophyta): Corrélations avec les conditions de croissance et la teneur en lipides. Phycologia 1993, 32, 259–265. [Google Scholar] [CrossRef]
  27. Ponec, M.; Weerheim, A.; Kempenaar, J.; Elias, P.M.; Williams, M.L. Differentiation of cultured human keratinocytes: Effect of culture conditions on lipid composition of normal vs. malignant cells. Vitr. Cell. Dev. Biol. Anim. 1989, 25, 689–696. [Google Scholar] [CrossRef]
  28. Gallagher, J.E.; Zheng, W.; Rong, X.; Miranda, N.; Lin, Z.; Dunn, B.; Zhao, H.; Snyder, M.P. Divergence in a master variator generates distinct phenotypes and transcriptional responses. Genes Dev. 2014, 28, 409–421. [Google Scholar] [CrossRef] [Green Version]
  29. Britto, J.A.; Evans, R.D.; Hayward, R.D.; Jones, B.M. From Genotype to Phenotype: The Differential Expression of FGF, FGFR, and TGFβ Genes Characterizes Human Cranioskeletal Development and Reflects Clinical Presentation in FGFR Syndromes. Plast. Reconstr. Surg. 2001, 108, 2026–2039. [Google Scholar] [CrossRef]
  30. Yang, K.; Han, X. Lipidomics: Techniques, Applications, and Outcomes Related to Biomedical Sciences. Trends Biochem. Sci. 2016, 41, 954–969. [Google Scholar] [CrossRef] [Green Version]
  31. O’Donnell, S.T.; Ross, R.P.; Stanton, C. The Progress of Multi-Omics Technologies: Determining Function in Lactic Acid Bacteria Using a Systems Level Approach. Front. Microbiol. 2020, 10, 3084. [Google Scholar] [CrossRef]
  32. Subramanian, I.; Verma, S.; Kumar, S.; Jere, A.; Anamika, K. Multi-omics Data Integration, Interpretation, and Its Application. Bioinform. Biol. Insights 2020, 14, 14. [Google Scholar] [CrossRef] [PubMed] [Green Version]
  33. Hasni, I.; Decloquement, P.; Demanèche, S.; Mameri, R.M.; Abbe, O.; Colson, P.; La Scola, B. Insight into the Lifestyle of Amoeba Willaertia magna during Bioreactor Growth Using Transcriptomics and Proteomics. Microorganisms 2020, 8, 771. [Google Scholar] [CrossRef] [PubMed]
  34. Clarke, M.; Lohan, A.J.; Liu, B.; Lagkouvardos, I.; Roy, S.; Zafar, N.; Bertelli, C.; Schilde, C.; Kianianmomeni, A.; Buerglin, T.R.; et al. Genome of Acanthamoeba castellanii highlights extensive lateral gene transfer and early evolution of tyrosine kinase signaling. Genome Biol. 2013, 14, R11. [Google Scholar] [CrossRef] [PubMed] [Green Version]
  35. Fritz-Laylin, L.K.; Prochnik, S.E.; Ginger, M.L.; Dacks, J.B.; Carpenter, M.L.; Field, M.C.; Kuo, A.; Paredez, A.; Chapman, J.; Pham, J.; et al. The Genome of Naegleria gruberi Illuminates Early Eukaryotic Versatility. Cell 2010, 140, 631–642. [Google Scholar] [CrossRef] [PubMed] [Green Version]
  36. Liechti, N.; Schürch, N.; Bruggmann, R.; Wittwer, M. The genome of Naegleria lovaniensis, the basis for a comparative approach to unravel pathogenicity factors of the human pathogenic amoeba N. fowleri. BMC Genom. 2018, 19, 1–11. [Google Scholar] [CrossRef] [Green Version]
  37. Zysset-Burri, D.C.; Müller, N.; Beuret, C.M.; Heller, M.; Schürch, N.; Gottstein, B.; Wittwer, M. Genome-wide identification of pathogenicity factors of the free-living amoeba Naegleria fowleri. BMC Genom. 2014, 15, 496. [Google Scholar] [CrossRef] [Green Version]
  38. Liechti, N.; Schürch, N.; Bruggmann, R.; Wittwer, M. Nanopore sequencing improves the draft genome of the human pathogenic amoeba Naegleria fowleri. Sci. Rep. 2019, 9, 16040. [Google Scholar] [CrossRef] [Green Version]
  39. Chelkha, N.; Hasni, I.; Louazani, A.C.; Levasseur, A.; La Scola, B.; Colson, P. Vermamoeba vermiformis CDC-19 draft genome sequence reveals considerable gene trafficking including with candidate phyla radiation and giant viruses. Sci. Rep. 2020, 10, 5928. [Google Scholar] [CrossRef] [Green Version]
  40. Hasni, I.; Andreani, J.; Colson, P.; La Scola, B. Description of Virulent Factors and Horizontal Gene Transfers of Keratitis-Associated Amoeba Acanthamoeba Triangularis by Genome Analysis. Pathogens 2020, 9, 217. [Google Scholar] [CrossRef] [Green Version]
  41. Detering, H.; Aebischer, T.; Dabrowski, P.W.; Radonic, A.; Nitsche, A.; Renard, B.Y.; Kiderlen, A.F. First Draft Genome Sequence ofBalamuthia mandrillaris, the Causative Agent of Amoebic Encephalitis. Genome Announc. 2015, 3, e01013-15. [Google Scholar] [CrossRef] [Green Version]
  42. Greninger, A.L.; Messacar, K.; Dunnebacke, T.; Naccache, S.N.; Federman, S.; Bouquet, J.; Mirsky, D.M.; Nomura, Y.; Yagi, S.; Glaser, C.A.; et al. Clinical metagenomic identification of Balamuthia mandrillaris encephalitis and assembly of the draft genome: The continuing case for reference genome sequencing. Genome Med. 2015, 7, 1–14. [Google Scholar] [CrossRef] [PubMed] [Green Version]
  43. De Jonckheere, J. Use of an axenic medium for differentiation between pathogenic and nonpathogenic Naegleria fowleri isolates. Appl. Environ. Microbiol. 1977, 33, 751–757. [Google Scholar] [CrossRef] [PubMed] [Green Version]
  44. Bioréacteur Pilote GPC. Available online: http://www.gpcbio.com/bioracteurpilote.html (accessed on 21 March 2020).
  45. Renesto, P.; Abergel, C.; Decloquement, P.; Moinier, D.; Azza, S.; Ogata, H.; Fourquet, P.; Gorvel, J.-P.; Claverie, J.-M. Mimivirus Giant Particles Incorporate a Large Fraction of Anonymous and Unique Gene Products. J. Virol. 2006, 80, 11678–11685. [Google Scholar] [CrossRef] [PubMed] [Green Version]
  46. Altschul, S.F.; Gish, W.; Miller, W.; Myers, E.W.; Lipman, D.J. Basic local alignment search tool. J. Mol. Biol. 1990, 215, 403–410. [Google Scholar] [CrossRef]
  47. Tatusov, R.L.; Galperin, M.Y.; Natale, D.A.; Koonin, E.V. The COG database: A tool for genome-scale analysis of protein functions and evolution. Nucleic Acids Res. 2000, 28, 33–36. [Google Scholar] [CrossRef] [PubMed] [Green Version]
  48. Huerta-Cepas, J.; Forslund, K.; Coelho, L.P.; Szklarczyk, D.; Jensen, L.J.; Von Mering, C.; Bork, P. Fast Genome-Wide Functional Annotation through Orthology Assignment by eggNOG-Mapper. Mol. Biol. Evol. 2017, 34, 2115–2122. [Google Scholar] [CrossRef] [Green Version]
  49. Ye, J.; Zhang, Y.; Cui, H.; Liu, J.; Wu, Y.; Cheng, Y.; Xu, H.; Huang, X.; Li, S.; Zhou, A.; et al. WEGO 2.0: A web tool for analyzing and plotting GO annotations, 2018 update. Nucleic Acids Res. 2018, 46, W71–W75. [Google Scholar] [CrossRef]
  50. Kanehisa, M.; Sato, Y.; Morishima, K. BlastKOALA and GhostKOALA: KEGG Tools for Functional Characterization of Genome and Metagenome Sequences. J. Mol. Biol. 2016, 428, 726–731. [Google Scholar] [CrossRef] [Green Version]
  51. Hunter, S.; Apweiler, R.; Attwood, T.K.; Bairoch, A.; Bateman, A.; Binns, D.; Bork, P.; Das, U.; Daugherty, L.; Duquenne, L.; et al. InterPro: The integrative protein signature database. Nucleic Acids Res. 2009, 37, D211–D215. [Google Scholar] [CrossRef] [Green Version]
  52. Quevillon, E.; Silventoinen, V.; Pillai, S.; Harte, N.; Mulder, N.J.; Apweiler, R.; Lopez, R. InterProScan: Protein domains identifier. Nucleic Acids Res. 2005, 33, W116–W120. [Google Scholar] [CrossRef] [Green Version]
  53. Marchler-Bauer, A.; Derbyshire, M.K.; Gonzales, N.R.; Lu, S.; Chitsaz, F.; Geer, L.Y.; Geer, R.C.; He, J.; Gwadz, M.; Hurwitz, D.I.; et al. CDD: NCBI’s conserved domain database. Nucleic Acids Res. 2015, 43, D222–D226. [Google Scholar] [CrossRef] [PubMed] [Green Version]
  54. Livak, K.J.; Schmittgen, T.D. Analysis of relative gene expression data using real-time quantitative PCR and the 2−ΔΔCT Method. Methods 2001, 25, 402–408. [Google Scholar] [CrossRef] [PubMed]
  55. Li, J.; Ding, X.; Han, S.; He, T.; Zhang, H.; Yang, L.; Yang, S.; Gai, J. Differential proteomics analysis to identify proteins and pathways associated with male sterility of soybean using iTRAQ-based strategy. J. Proteom. 2016, 138, 72–82. [Google Scholar] [CrossRef] [PubMed]
  56. Bligh, E.G.; Dyer, W.J. A Rapid Method of Total Lipid Extraction and Purification. Can. J. Biochem. Physiol. 1959, 37, 911–917. [Google Scholar] [CrossRef] [Green Version]
  57. Isaac, G.; McDonald, S.; Astarita, G. Lipid Separation Using UPLC with Charged Surface Hybrid Technology, Milfort: Waters Application Note. 2011. Available online: https://www.waters.com/webassets/cms/library/docs/720004107en.pdf (accessed on 9 September 2020).
  58. Čabovska, B. Application of Multivariate Analysis and LC-MS for the Detection of Counterfeit Cosmetics. Waters Application Note. 2015. Available online: https://www.waters.com/webassets/cms/library/docs/720005402en.pdf (accessed on 9 September 2020).
  59. Dione, N.; Sankar, S.; Lagier, J.-C.; Khelaifia, S.; Michele, C.; Armstrong, N.; Richez, M.; Abrahão, J.; Raoult, D.; Fournier, P.-E. Genome sequence and description of Anaerosalibacter massiliensis sp. nov. New Microbes New Infect. 2016, 10, 66–76. [Google Scholar] [CrossRef] [PubMed] [Green Version]
  60. Ngom, I.; Hasni, I.; Lo, C.; Traore, S.; Fontanini, A.; Raoult, D.; Fenollar, F. Taxono-genomics and description of Gordonibacter massiliensis sp. nov., a new bacterium isolated from stool of healthy patient. New Microbes New Infect. 2020, 33, 100624. [Google Scholar] [CrossRef]
  61. Sasser, M. Bacterial Identification by Gas Chromatographic Analysis of Fatty Acid Methyl Esters (GC-FAME); Technical Note 101; MIDI Inc.: Newark, DE, USA, 2006; Available online: http://midi-inc.com/pdf/MIS_Technote_101.pdf (accessed on 9 September 2020).
  62. Ahsan, K.; Lekli, I.; Ray, D.; Yodoi, J.; Das, D.K. Redox Regulation of Cell Survival by the Thioredoxin Superfamily: An Implication of Redox Gene Therapy in the Heart. Antioxid. Redox Signal. 2009, 11, 2741–2758. [Google Scholar] [CrossRef] [Green Version]
  63. Netto, L.E.S.; Antunes, A.F. The Roles of Peroxiredoxin and Thioredoxin in Hydrogen Peroxide Sensing and in Signal Transduction. Mol. Cells 2016, 39, 65–71. [Google Scholar] [CrossRef] [Green Version]
  64. Zigmond, S.H. How Wasp Regulates Actin Polymerization. J. Cell Biol. 2000, 150, F117–F120. [Google Scholar] [CrossRef] [Green Version]
  65. Hagopian, K.; Ramsey, J.J.; Weindruch, R. Enzymes of glycerol and glyceraldehyde metabolism in mouse liver: Effects of caloric restriction and age on activities. Biosci. Rep. 2008, 28, 107–115. [Google Scholar] [CrossRef] [Green Version]
  66. Wendel, A.A.; Lewin, T.M.; Coleman, R.A. Glycerol-3-phosphate acyltransferases: Rate limiting enzymes of triacylglycerol biosynthesis. Biochim. et Biophys. Acta (BBA) Mol. Cell Biol. Lipids 2009, 1791, 501–506. [Google Scholar] [CrossRef] [PubMed] [Green Version]
  67. Xue, L.-L.; Chen, H.-H.; Jiang, J.-G. Implications of glycerol metabolism for lipid production. Prog. Lipid Res. 2017, 68, 12–25. [Google Scholar] [CrossRef] [PubMed]
  68. Zeisel, S.H. Choline, Other Methyl-Donors and Epigenetics. Nutrients 2017, 9, 445. [Google Scholar] [CrossRef] [PubMed]
  69. Ohtsubo, K.; Marth, J.D. Glycosylation in Cellular Mechanisms of Health and Disease. Cell 2006, 126, 855–867. [Google Scholar] [CrossRef] [PubMed] [Green Version]
  70. Kopitz, J. Lipid glycosylation: A primer for histochemists and cell biologists. Histochem. Cell Biol. 2016, 147, 175–198. [Google Scholar] [CrossRef]
  71. Van Meer, G.; Wolthoorn, J.; DeGroote, S. The fate and function of glycosphingolipid glucosylceramide. Philos. Trans. R. Soc. B Biol. Sci. 2003, 358, 869–873. [Google Scholar] [CrossRef] [Green Version]
  72. DeGroote, S.; Wolthoorn, J.; Van Meer, G. The cell biology of glycosphingolipids. Semin. Cell Dev. Biol. 2004, 15, 375–387. [Google Scholar] [CrossRef]
  73. Rivera, R.; Chun, J. Biological effects of lysophospholipids. Rev. Physiol. Biochem. Pharmacol. Biochem. Pharmacol. 2006, 160, 25–46. [Google Scholar]
  74. Ailte, I.; Lingelem, A.B.D.; Kavaliauskiene, S.; Bergan, J.; Kvalvaag, A.S.; Myrann, A.-G.; Skotland, T.; Sandvig, K. Addition of lysophospholipids with large head groups to cells inhibits Shiga toxin binding. Sci. Rep. 2016, 6, 30336. [Google Scholar] [CrossRef] [Green Version]
  75. Speranza, F.; Mahankali, M.; Henkels, K.M.; Gómez-Cambronero, J. The Molecular Basis of Leukocyte Adhesion Involving Phosphatidic Acid and Phospholipase D. J. Biol. Chem. 2014, 289, 28885–28897. [Google Scholar] [CrossRef] [Green Version]
Figure 1. Morphology of Willaertia magna cultivated under two different culture conditions. In (A,B): W. magna is cultivated in adhesion on cell culture flask. In (C,D): W. magna is cultivated in suspension in bioreactor. Pictures were obtained with emission Scanning Electron Microscope SU5000 (Hitachi, Japan). Bar scales are represented on picture.
Microorganisms 08 01791 g001
Figure 2. Representation of differently regulated proteins (DRPs) matching with a function in the Cluster of Orthologous Group of proteins (COG) database.
Microorganisms 08 01791 g002
Figure 3. Gene Ontology (GO) distribution plotted by WEGO. The proteins were assigned to three main categories: biological process, molecular function and cellular component. The right-hand y-axis indicates the number of annotated proteins. The left-hand y-axis indicates the percentage of annotated proteins.
Microorganisms 08 01791 g003
Figure 4. Representation of DRPs matching with a function in the Kyoto Encyclopedia of Genes and Genomes Pathway (KEGG) database. Each protein was classified in a KEGG category.
Microorganisms 08 01791 g004
Table 1. Willaertia magna proteins up-regulated in adhesion and down-regulated in suspension culture.
Protein Sequence Accession of W. magnaAnova (p)Fold ChangeProtein Function
protein 174631.45 × 10−14410.39predicted protein
protein 89194.00 × 10−854.12uncharacterized protein
protein 22875.55 × 10−1644.36cathepsin B-like protein
protein 80845.68 × 10−147.2malate dehydrogenase
protein 159394.35 × 10−136.48Ras GTP-binding protein RhoL
protein 47541.81 × 10−95.96Hemerythrin-like protein
protein 150391.81 × 10−95.96Hemerythrin-like protein
protein 170742.62 × 10−64.88Unknown function (ORFan)
protein 153651.43 × 10−124.8predicted protein
protein 137433.72 × 10−64.7ubiquinone biosynthesis protein
protein 80313.75 × 10−84.11cathepsin B-like protein
protein 40721.84 × 10−84.02glyceraldehyde-3-phosphate dehydrogenase
protein 176156.17 × 10−63.95V-type H+-transporting ATPase subunit F
protein 28991.20 × 10−93.24beta-tubulin
protein 32747.59 × 10−123.16adenylate kinase
protein 74394.31 × 10−82.99triosephosphate isomerase
protein 79232.67 × 10−42.82protein domain specific binding
protein 128671.20 × 10−52.78arsonoacetate metabolic process
protein 29471.27 × 10−112.653-oxoacid CoA-transferase activity
protein 81141.69 × 10−32.47cathepsin B-like protein
protein 77804.69 × 10−42.41pyruvate dehydrogenase
protein 59852.67 × 10−62.4alpha-actinin
protein 36141.27 × 10−102.39malate dehydrogenase
protein 8852.48 × 10−72.39RRM domain-containing protein
protein 135542.66 × 10−102.39glutamate dehydrogenase
protein 35715.22 × 10−52.38Profilin
protein 80145.79 × 10−82.25phosphoenolpyruvate carboxykinase
protein 63333.93 × 10−32.21predicted protein
protein 36281.13 × 10−52.2cathepsin D
protein 161241.07 × 10−92.19ADP/ATP translocase 1 domain protein
protein 84893.94 × 10−62.19actin beta/gamma 1
protein 112801.15 × 10−32.1460S ribosomal protein L23
protein 44866. × 10−112.13cystathionine gamma-lyase
protein 27385.05 × 10−52.12cathepsin B
protein 85033.55 × 10−102.11ATP synthase F1 subunit alpha
protein 79553.57 × 10−62.1large subunit ribosomal protein L24e
protein 40737.58 × 10−92.05fructose-bisphosphate aldolase
protein 154523.15 × 10−42.02malate metabolic process
protein 23846.51 × 10−92.02mitochondrial citrate synthetase
protein 181912.88 × 10−92.01thioredoxin
Table 2. Willaertia magna proteins up-regulated in suspension and down-regulated in adhesion culture.
Protein Sequence Accession of W. magnaAnova (p)Fold ChangeProtein Function
protein 55571.63 × 10−10InfinityUnknown protein (ORFan)
protein 39844.59 × 10−1215.52large subunit ribosomal protein L7/L12
protein 22943.31 × 10−1311.34metE; 5-methyltetrahydropteroyltriglutamate–homocysteine methyltransferase
protein 161368.95 × 10−145.98membrane protein
protein 21575.28 × 10−44.12ribosomal protein L7/L12, putative
protein 101424.22 × 10−143.43HSP-20 domain-containing protein
protein 184018.68 × 10−73.41nuclear transport factor 2
protein 182005.01 × 10−62.84maleylacetoacetate isomerase
protein 28318.88 × 10−162.68HSP20 family protein
protein 114902.19 × 10−42.59predicted protein
protein 28493.97 × 10−82.49predicted protein
protein 80803.66 × 10−62.46long-chain acyl-CoA synthetase
protein 118797.72 × 10−52.3hypothetical protein
protein 150022.04 × 10−102.21membrane protein
protein 162716.39 × 10−122.18heat shock 70kDa protein 5
protein 31736.20 × 10−62.18mitochondrial chaperonin hsp10
protein 149235.72 × 10−72.15predicted protein
protein 132315.57 × 10−72.15sugar phosphate isomerase/epimerase
protein 132283.71 × 10−32.12predicted protein
protein 68695.31 × 10−72.07alcohol dehydrogenase
protein 20467.87 × 10−52.02catalase
Table 3. Identification of lipid markers related to different culture modes.
Culture ConditionSuspensionAdhesion
Positive ionization4 apolar lipids (1 Ceramide, 3 Acylglycerols)
4 Glyco lipids (Glycosyldiacylglycerols)
11 phospholipids (6 PCs, 5 unknown)
2 apolar lipids (Acylglycerols)
5 Glyco lipids (3 Hex Sphingosine, 2 Glycosyldiacylglycerols)
7 Phospholipids (3 PCs, 1 phosphatidyl serine, 3 unknown)
7 Lysophospholipids
Negative ionization2 apolar lipids (Ceramides)
8 Free Fatty Acids (7 identified)
6 phospholipids (1 PE, 5 PC)
1 lysophospholipid
5 apolar lipid (1 Ceramide, 1 Wax Ester, 1 Coenzyme A, 2 unknown)
2 Glyco lipids (1 Ceramide, 1 Glycosyldiacylglycerol)
13 Free Fatty Acids (6 identified)
6 Phospholipids (1 phosphatidylinositol, 1 phosphatidic acid, 4 PEs)
14 Lysophospholipids
Publisher’s Note: MDPI stays neutral with regard to jurisdictional claims in published maps and institutional affiliations.

