Optimization of In Vitro Mycobacterium avium and Mycobacterium intracellulare Growth Assays for Therapeutic Development

 ,
,
Abstract
:1. Introduction
2. Materials and Methods
2.1. Preparation of 7H9 Broth with ADC Enrichment
2.2. Initial Bacterial Preparation and Preservation
2.3. Optical Density
2.4. Colony Forming Units
2.5. Resazurin Assay
2.6. Gentamicin Studies
2.7. Statistics
3. Results
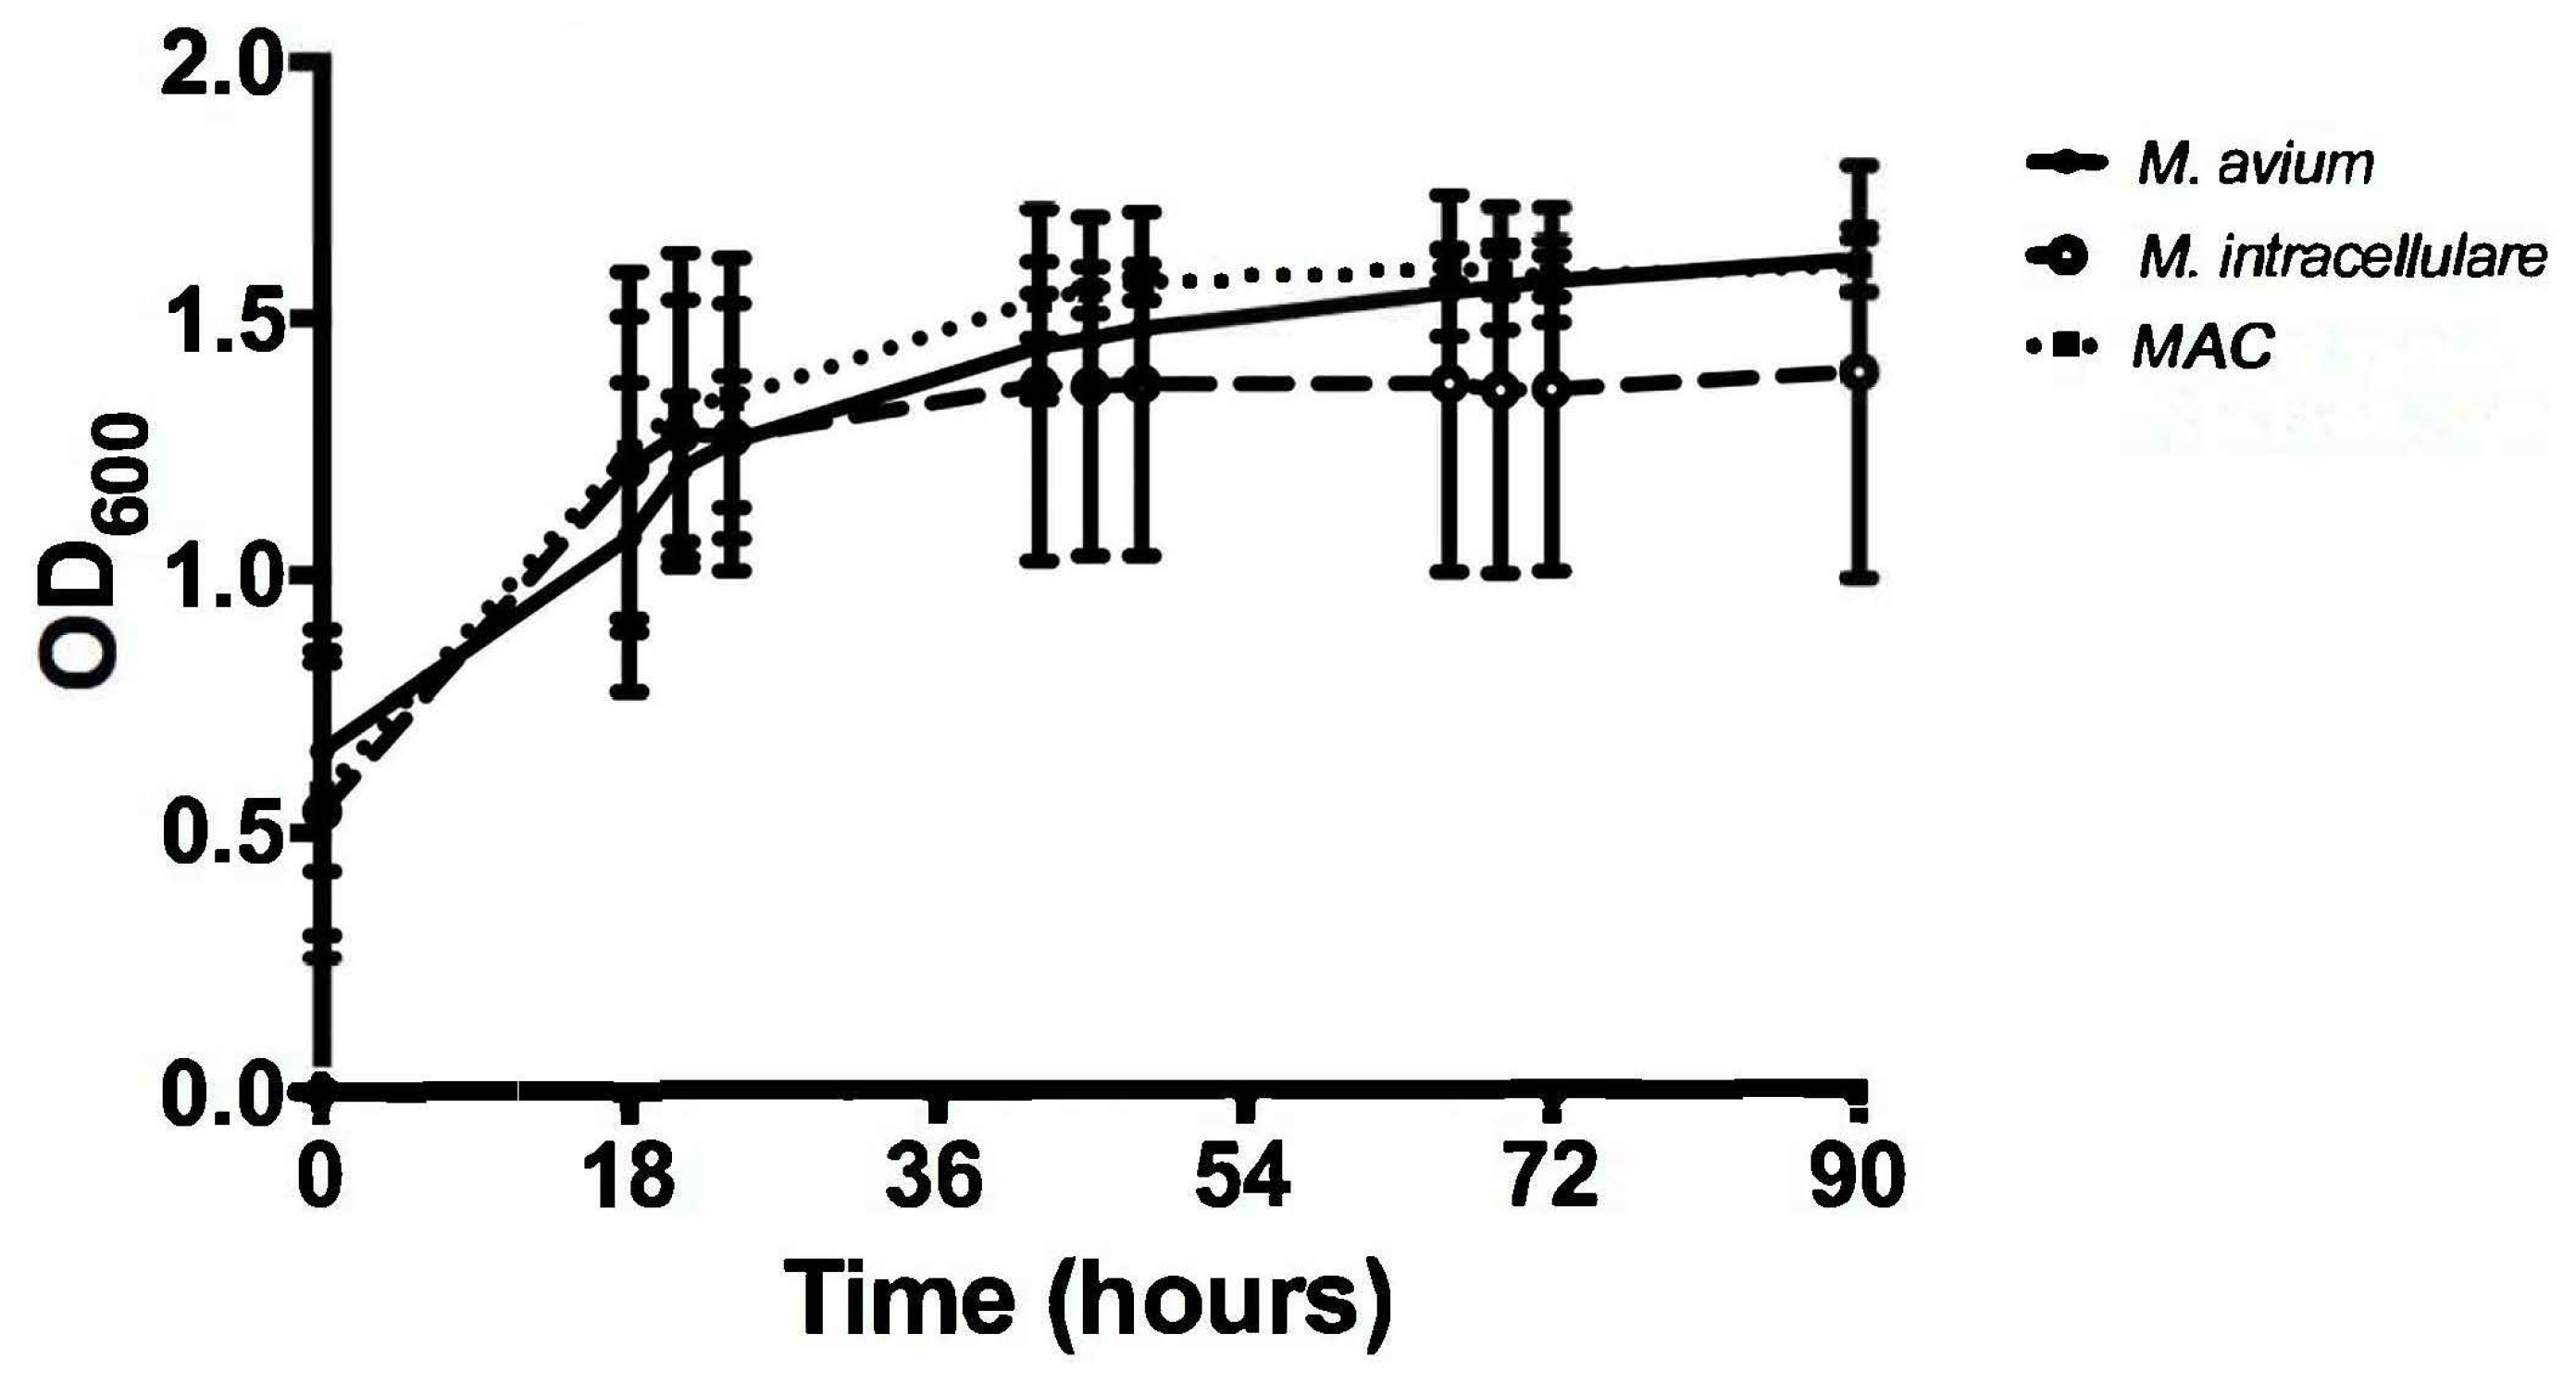
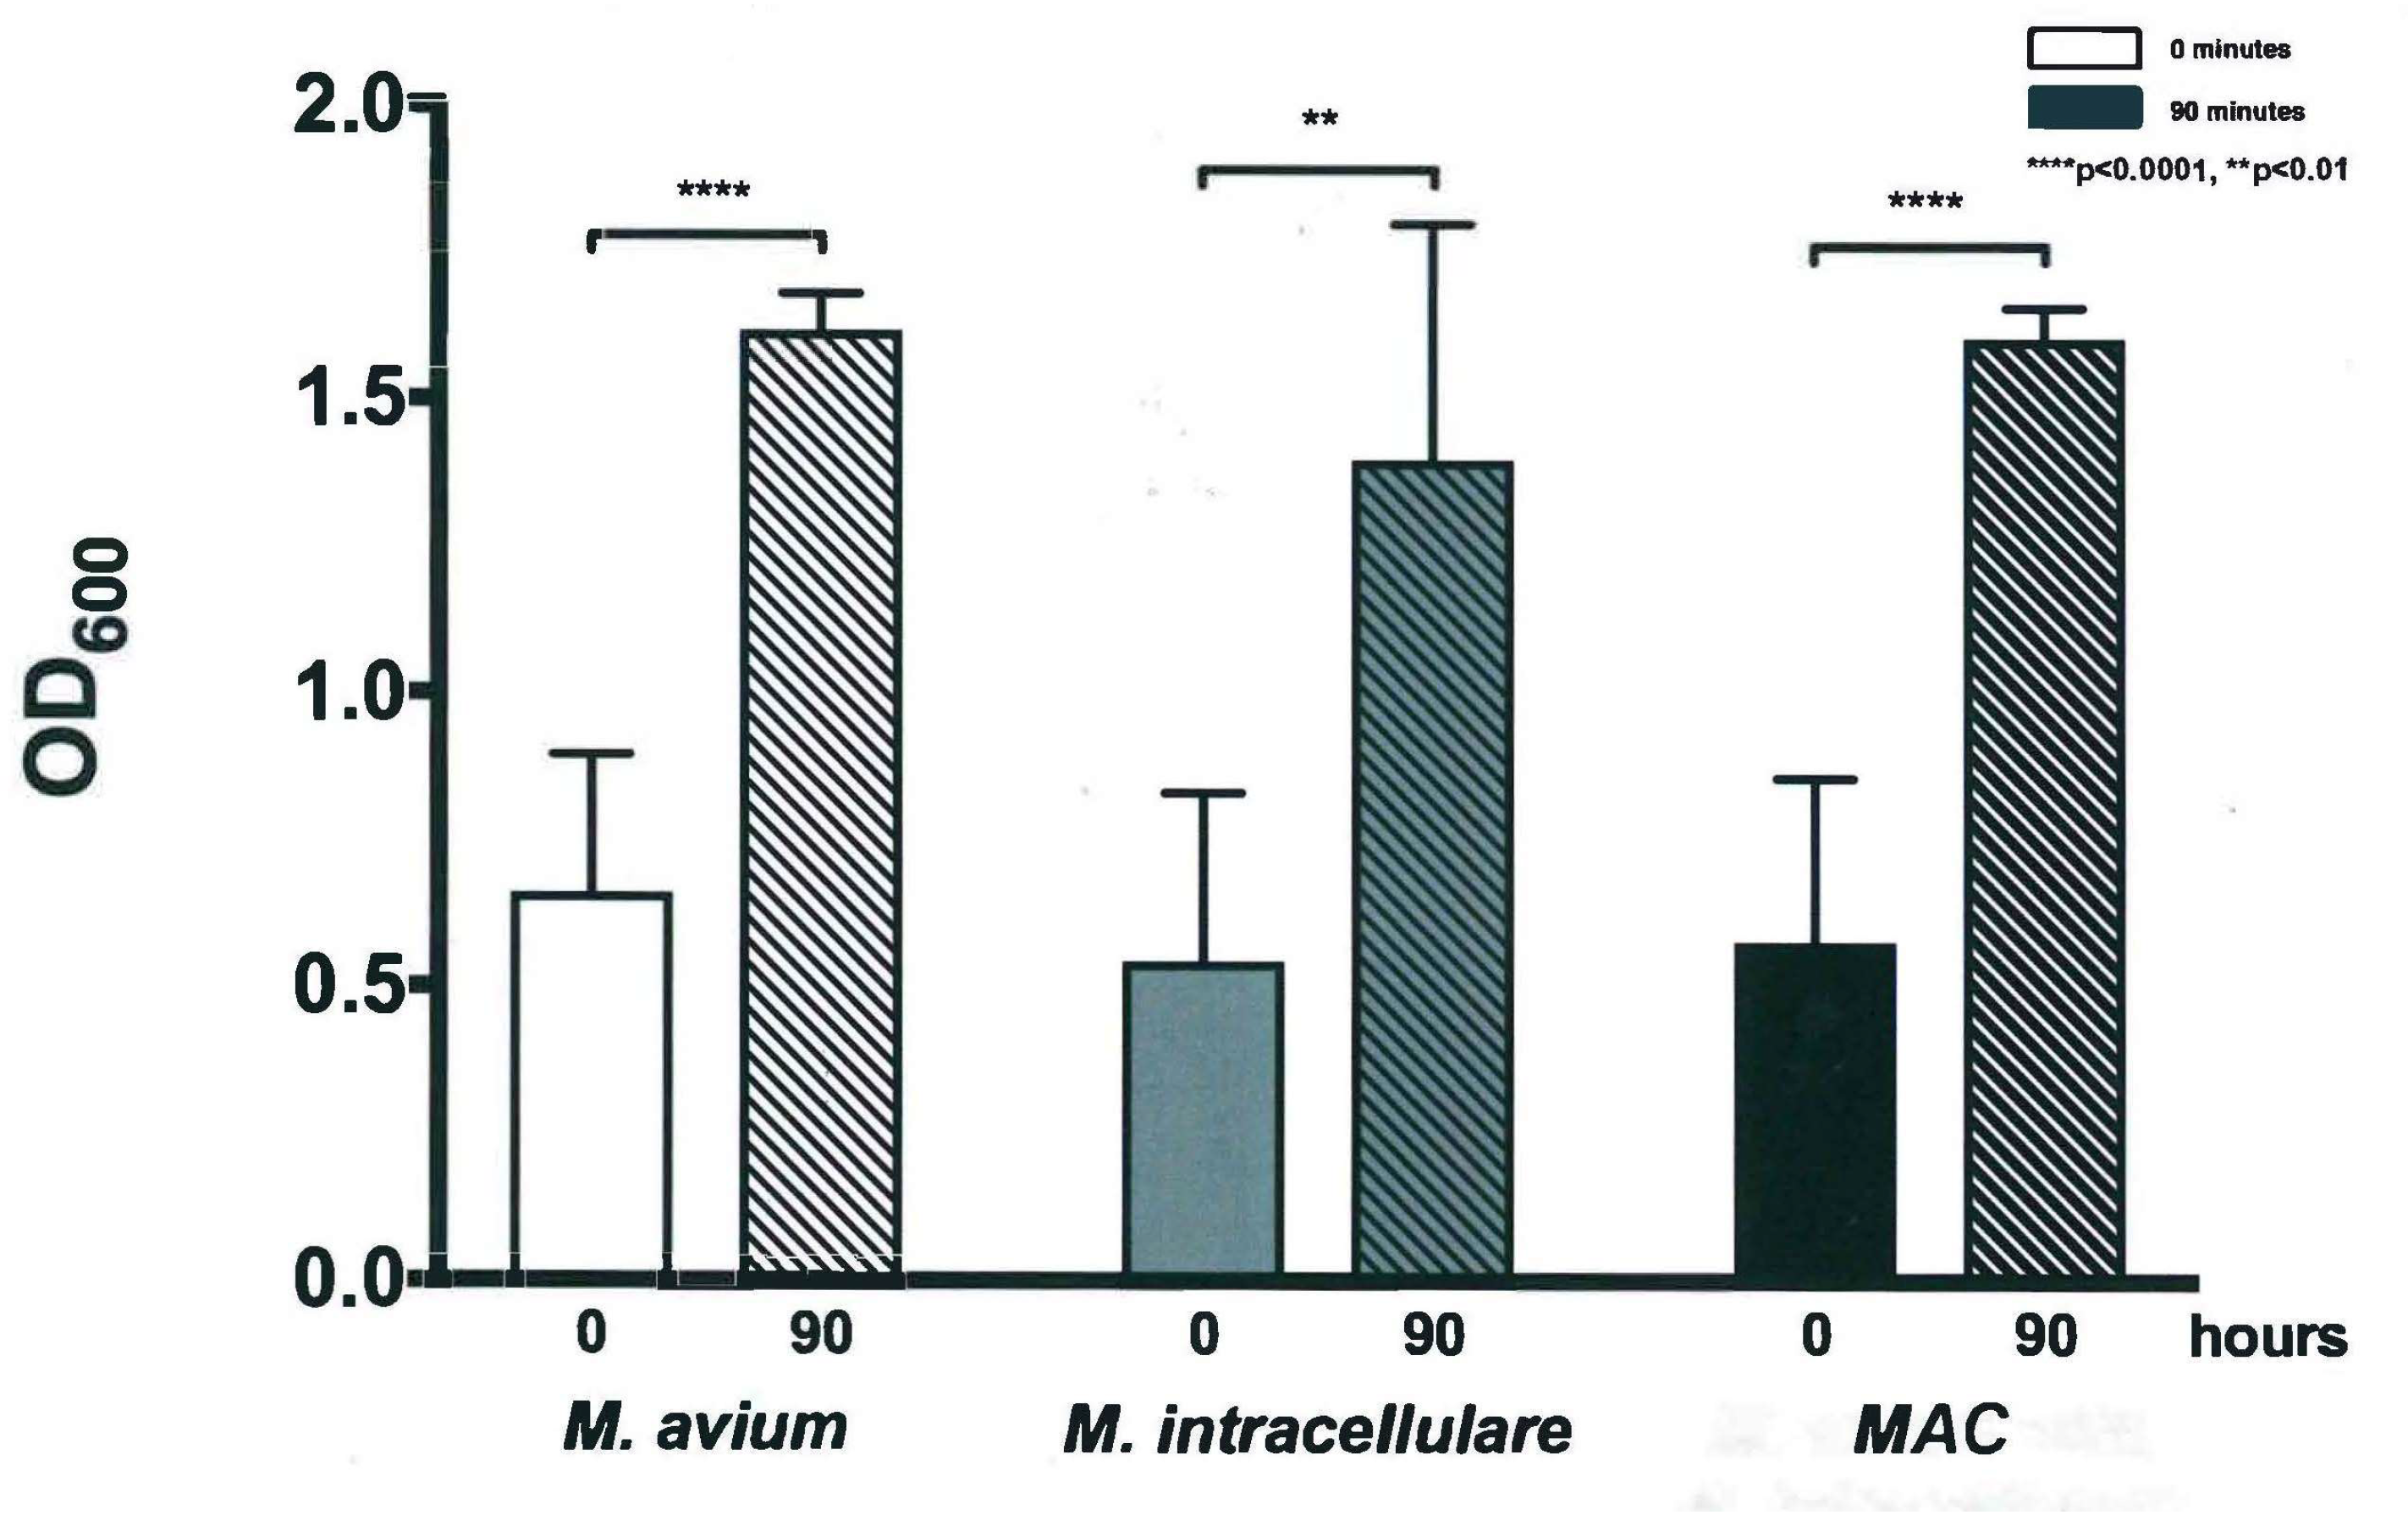
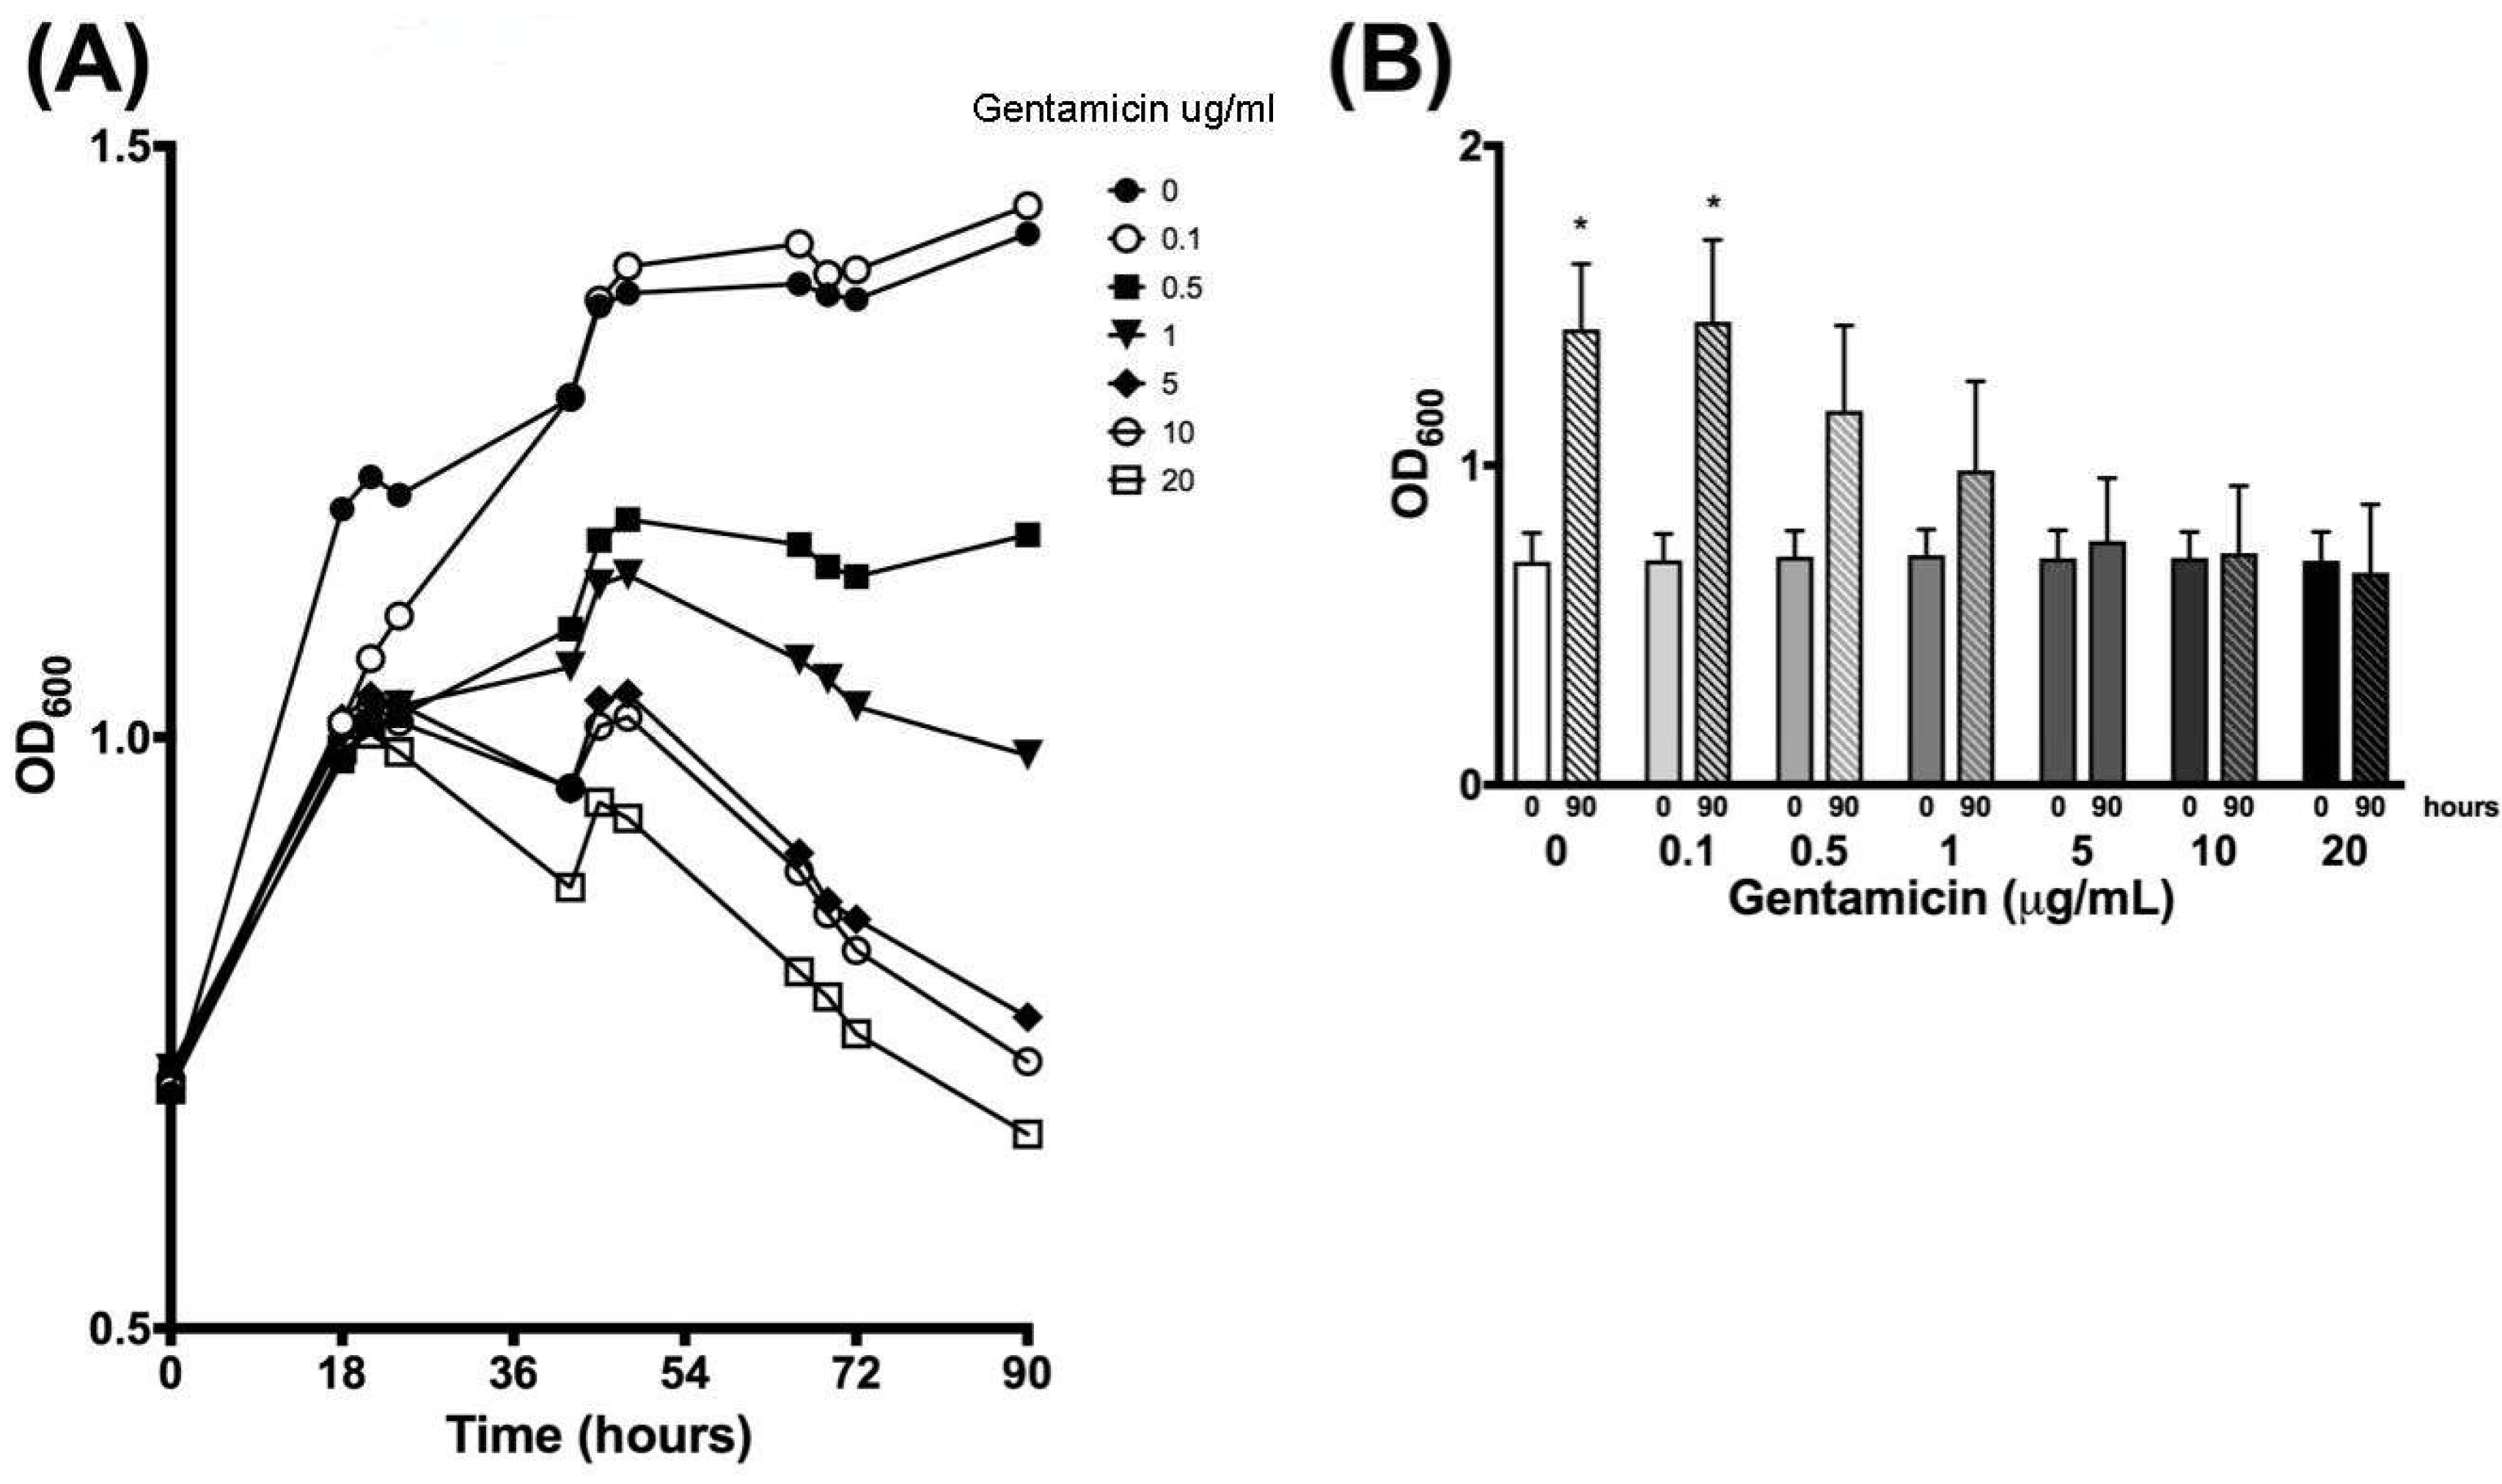
3.1. Optical Density Indicates Increased Bacterial Concentration over 90 h
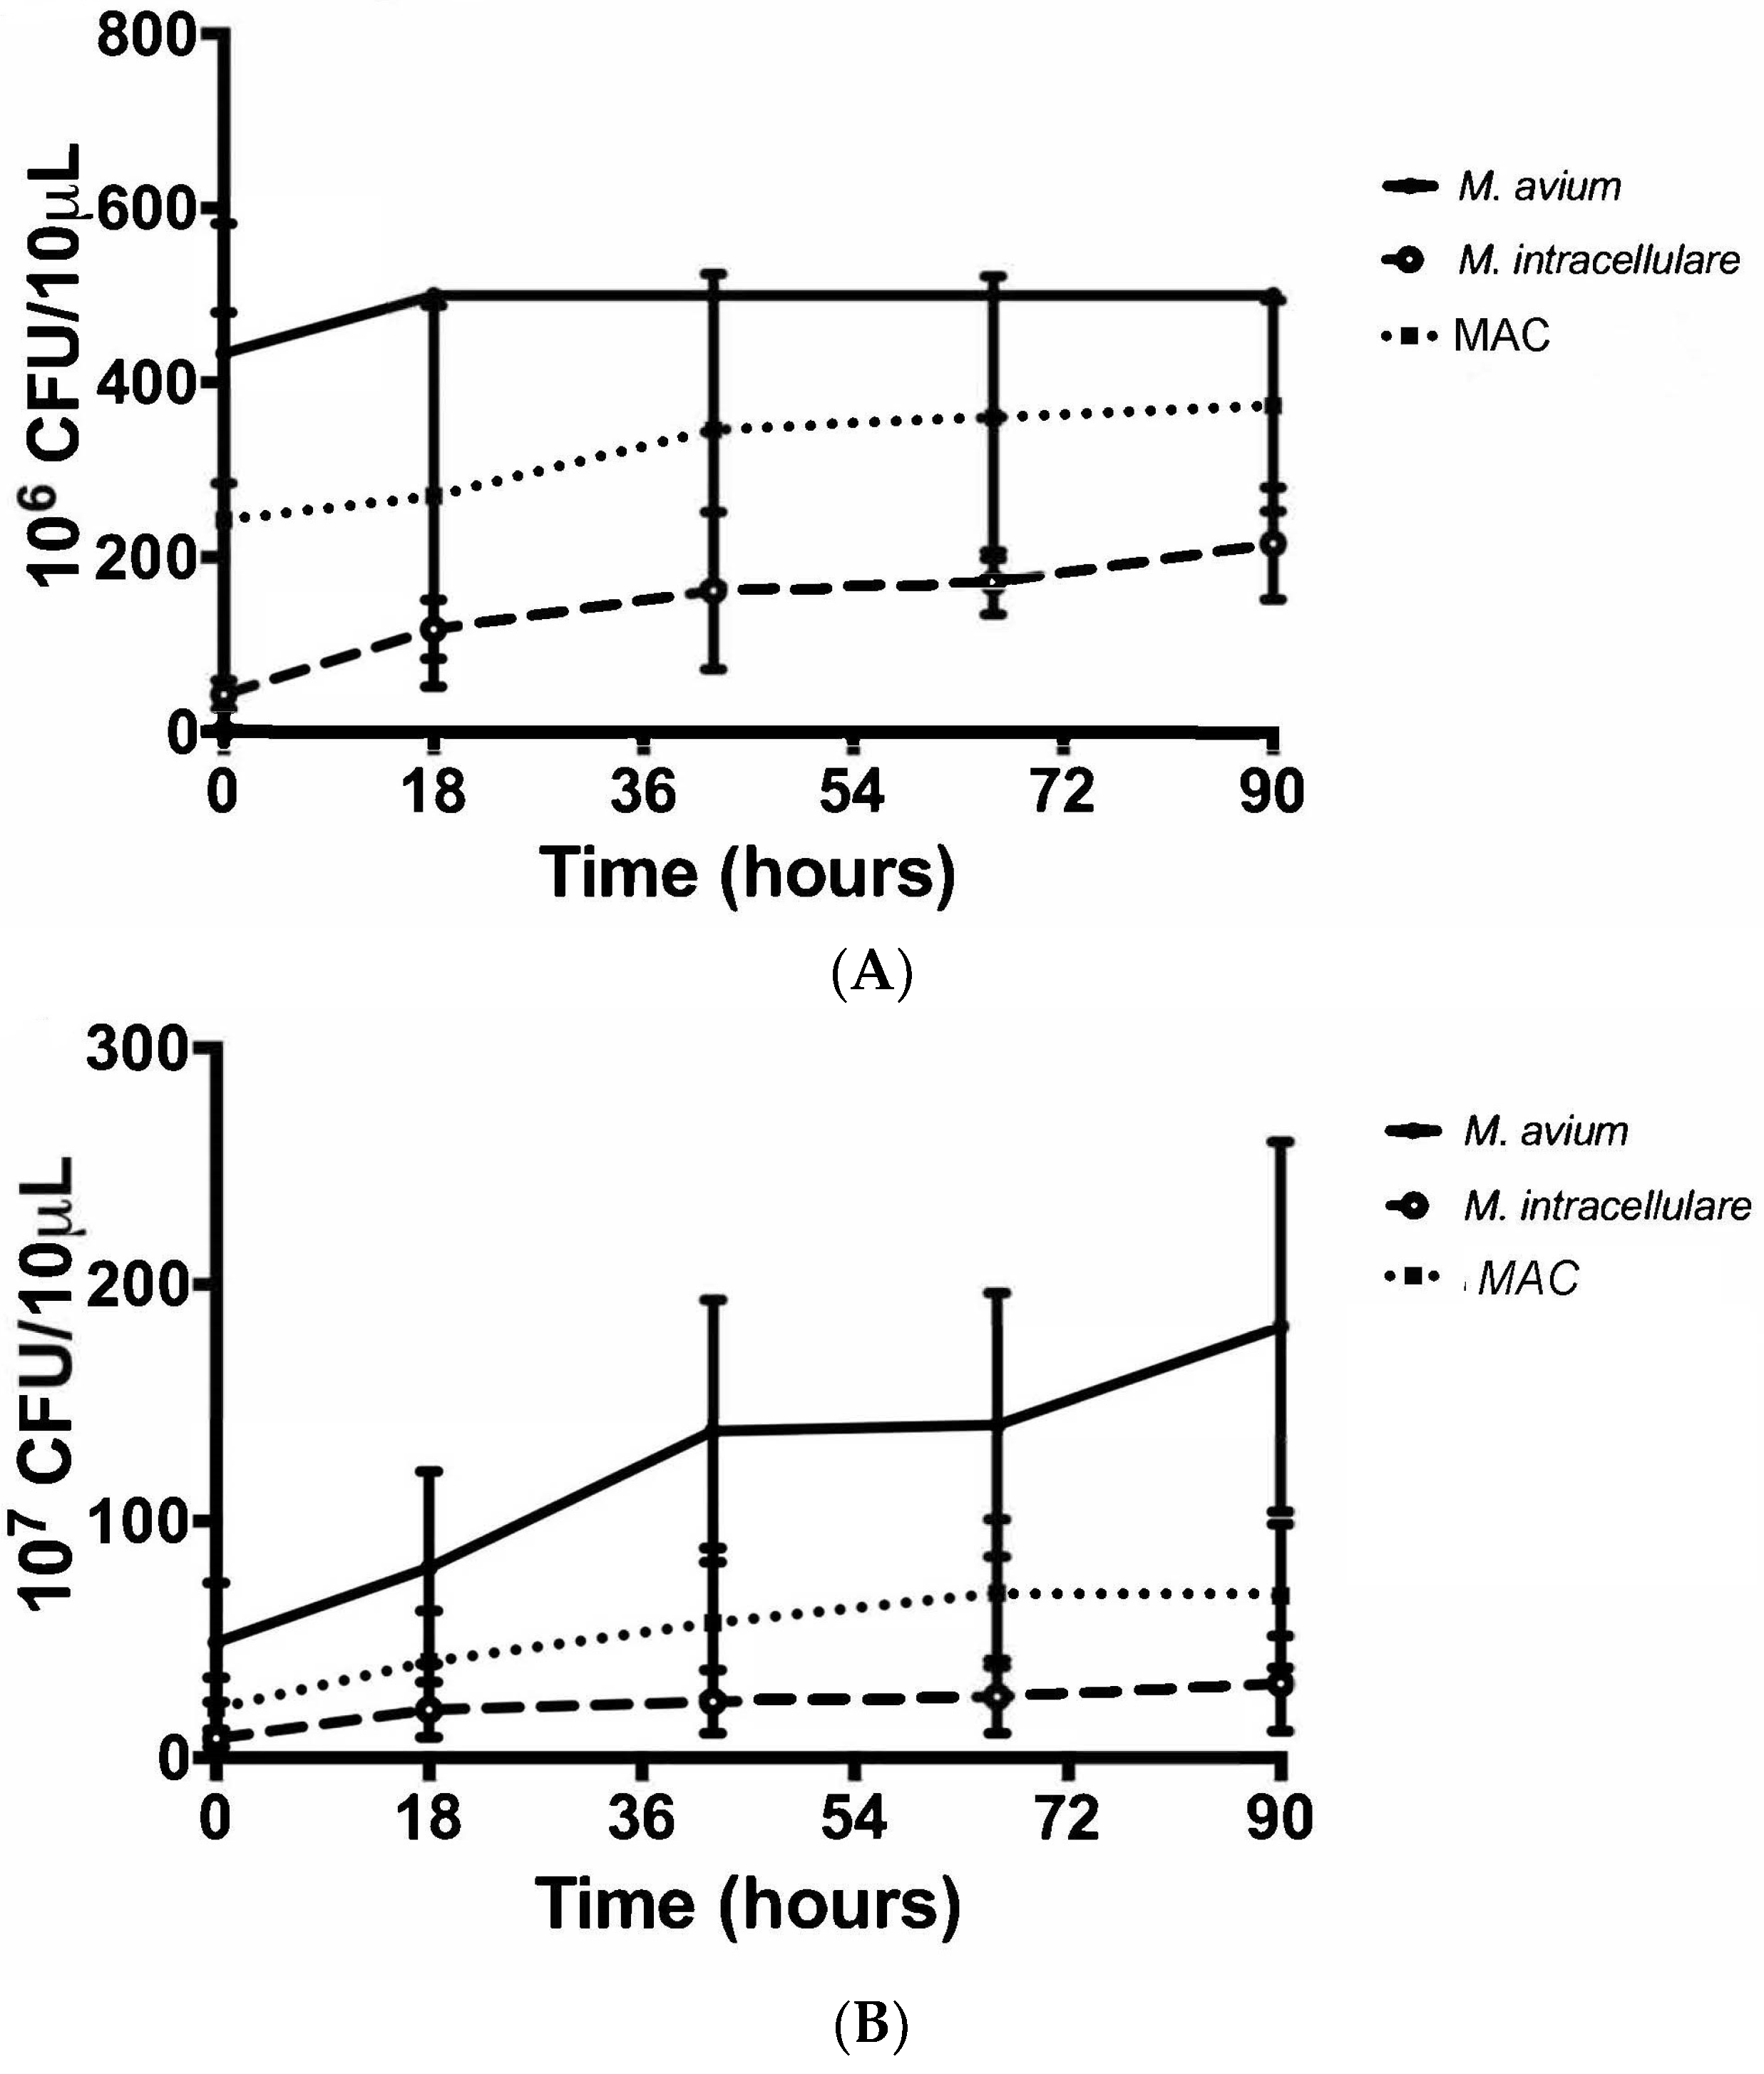
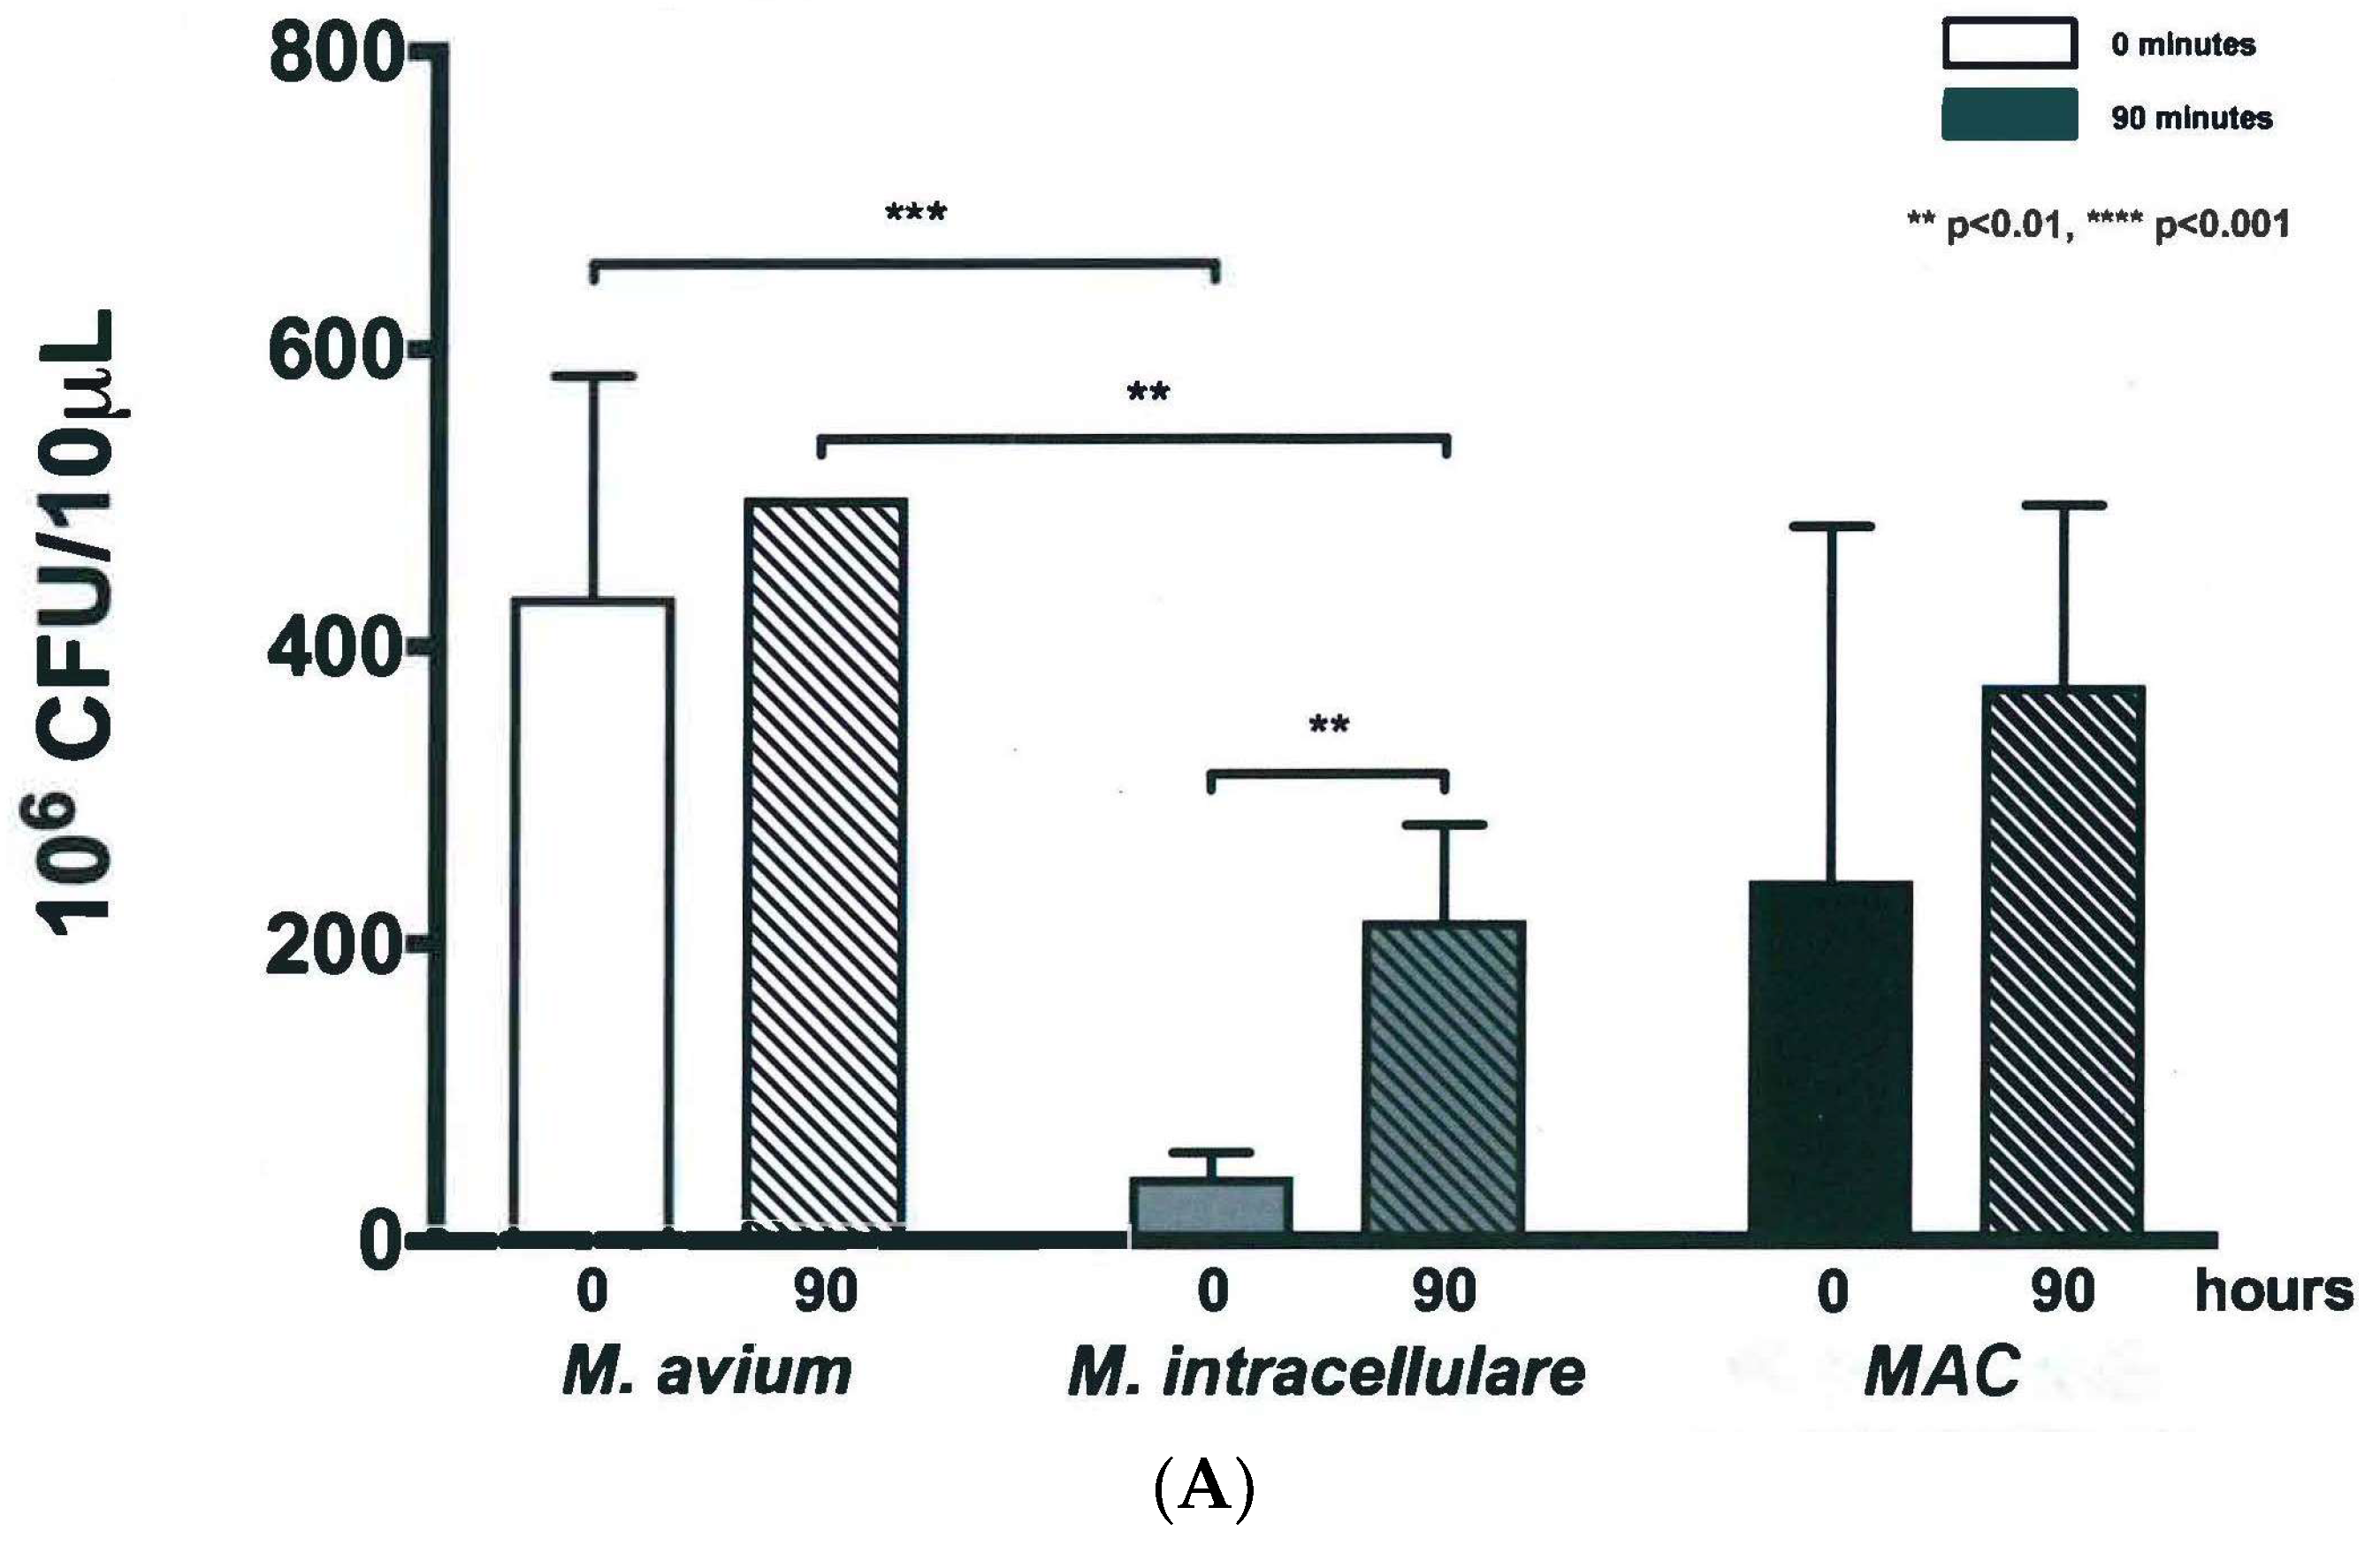
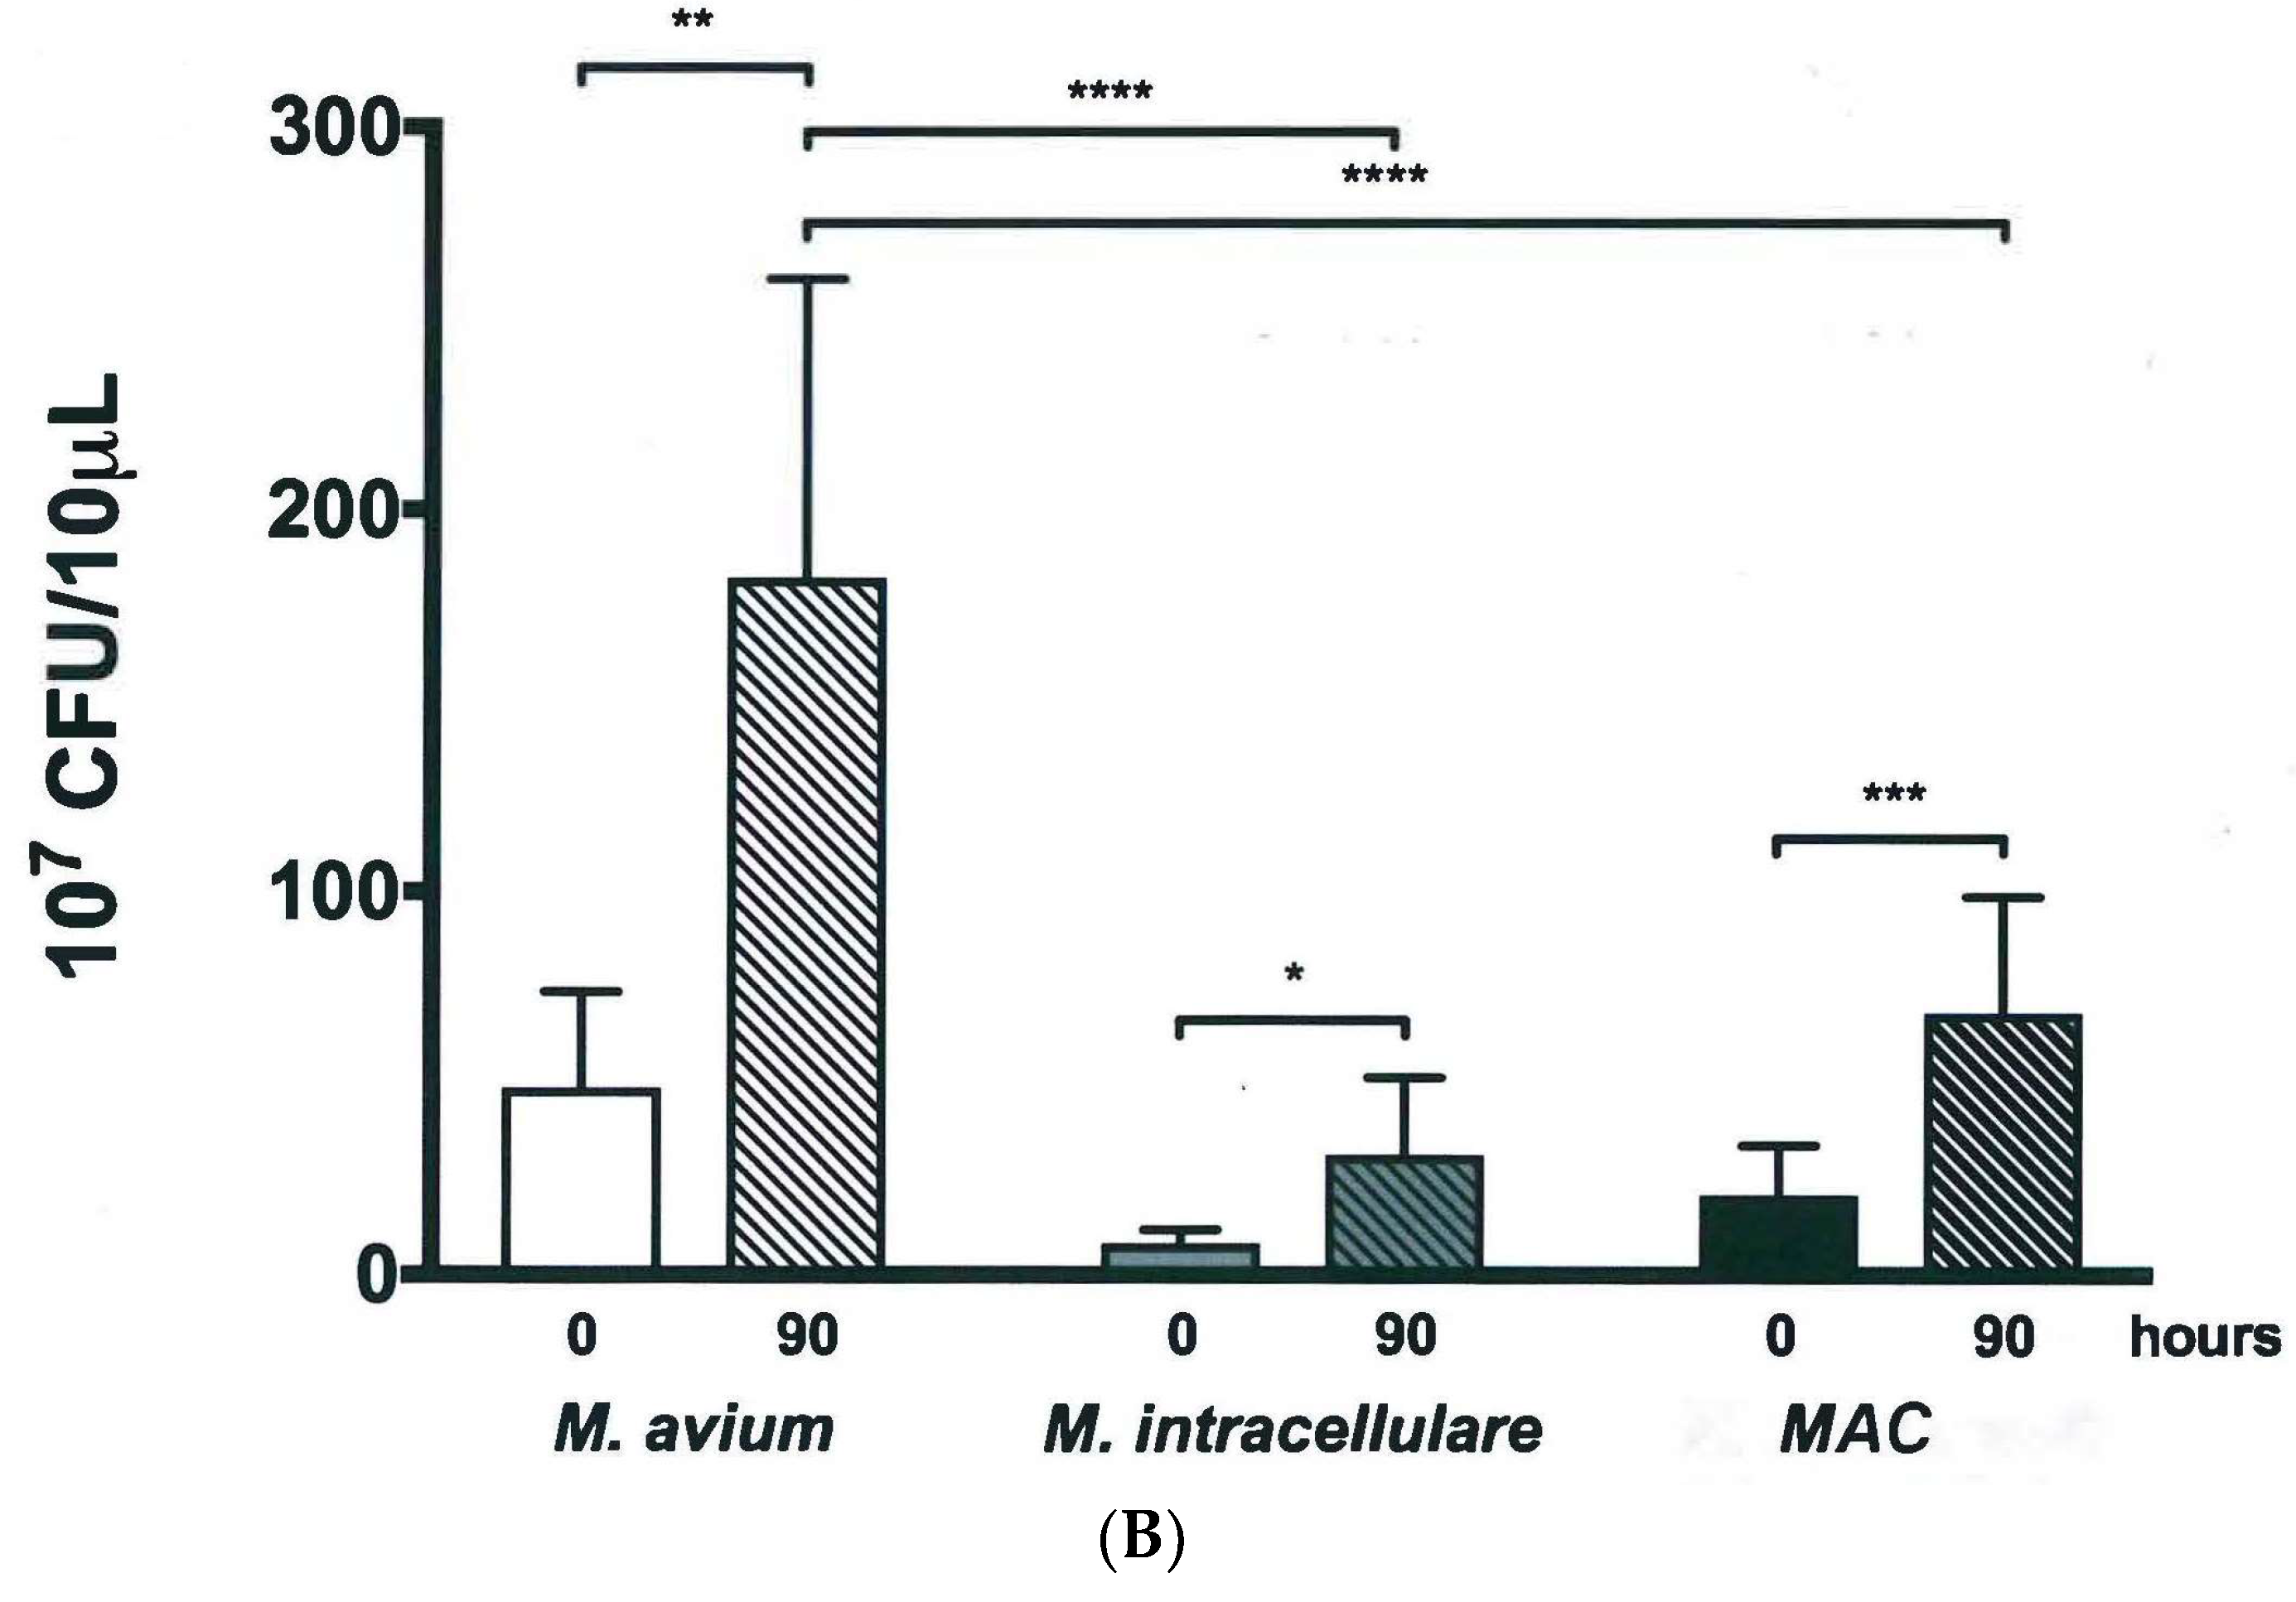
3.2. Colony Forming Units Confirms Bacterial Growth over 90 h
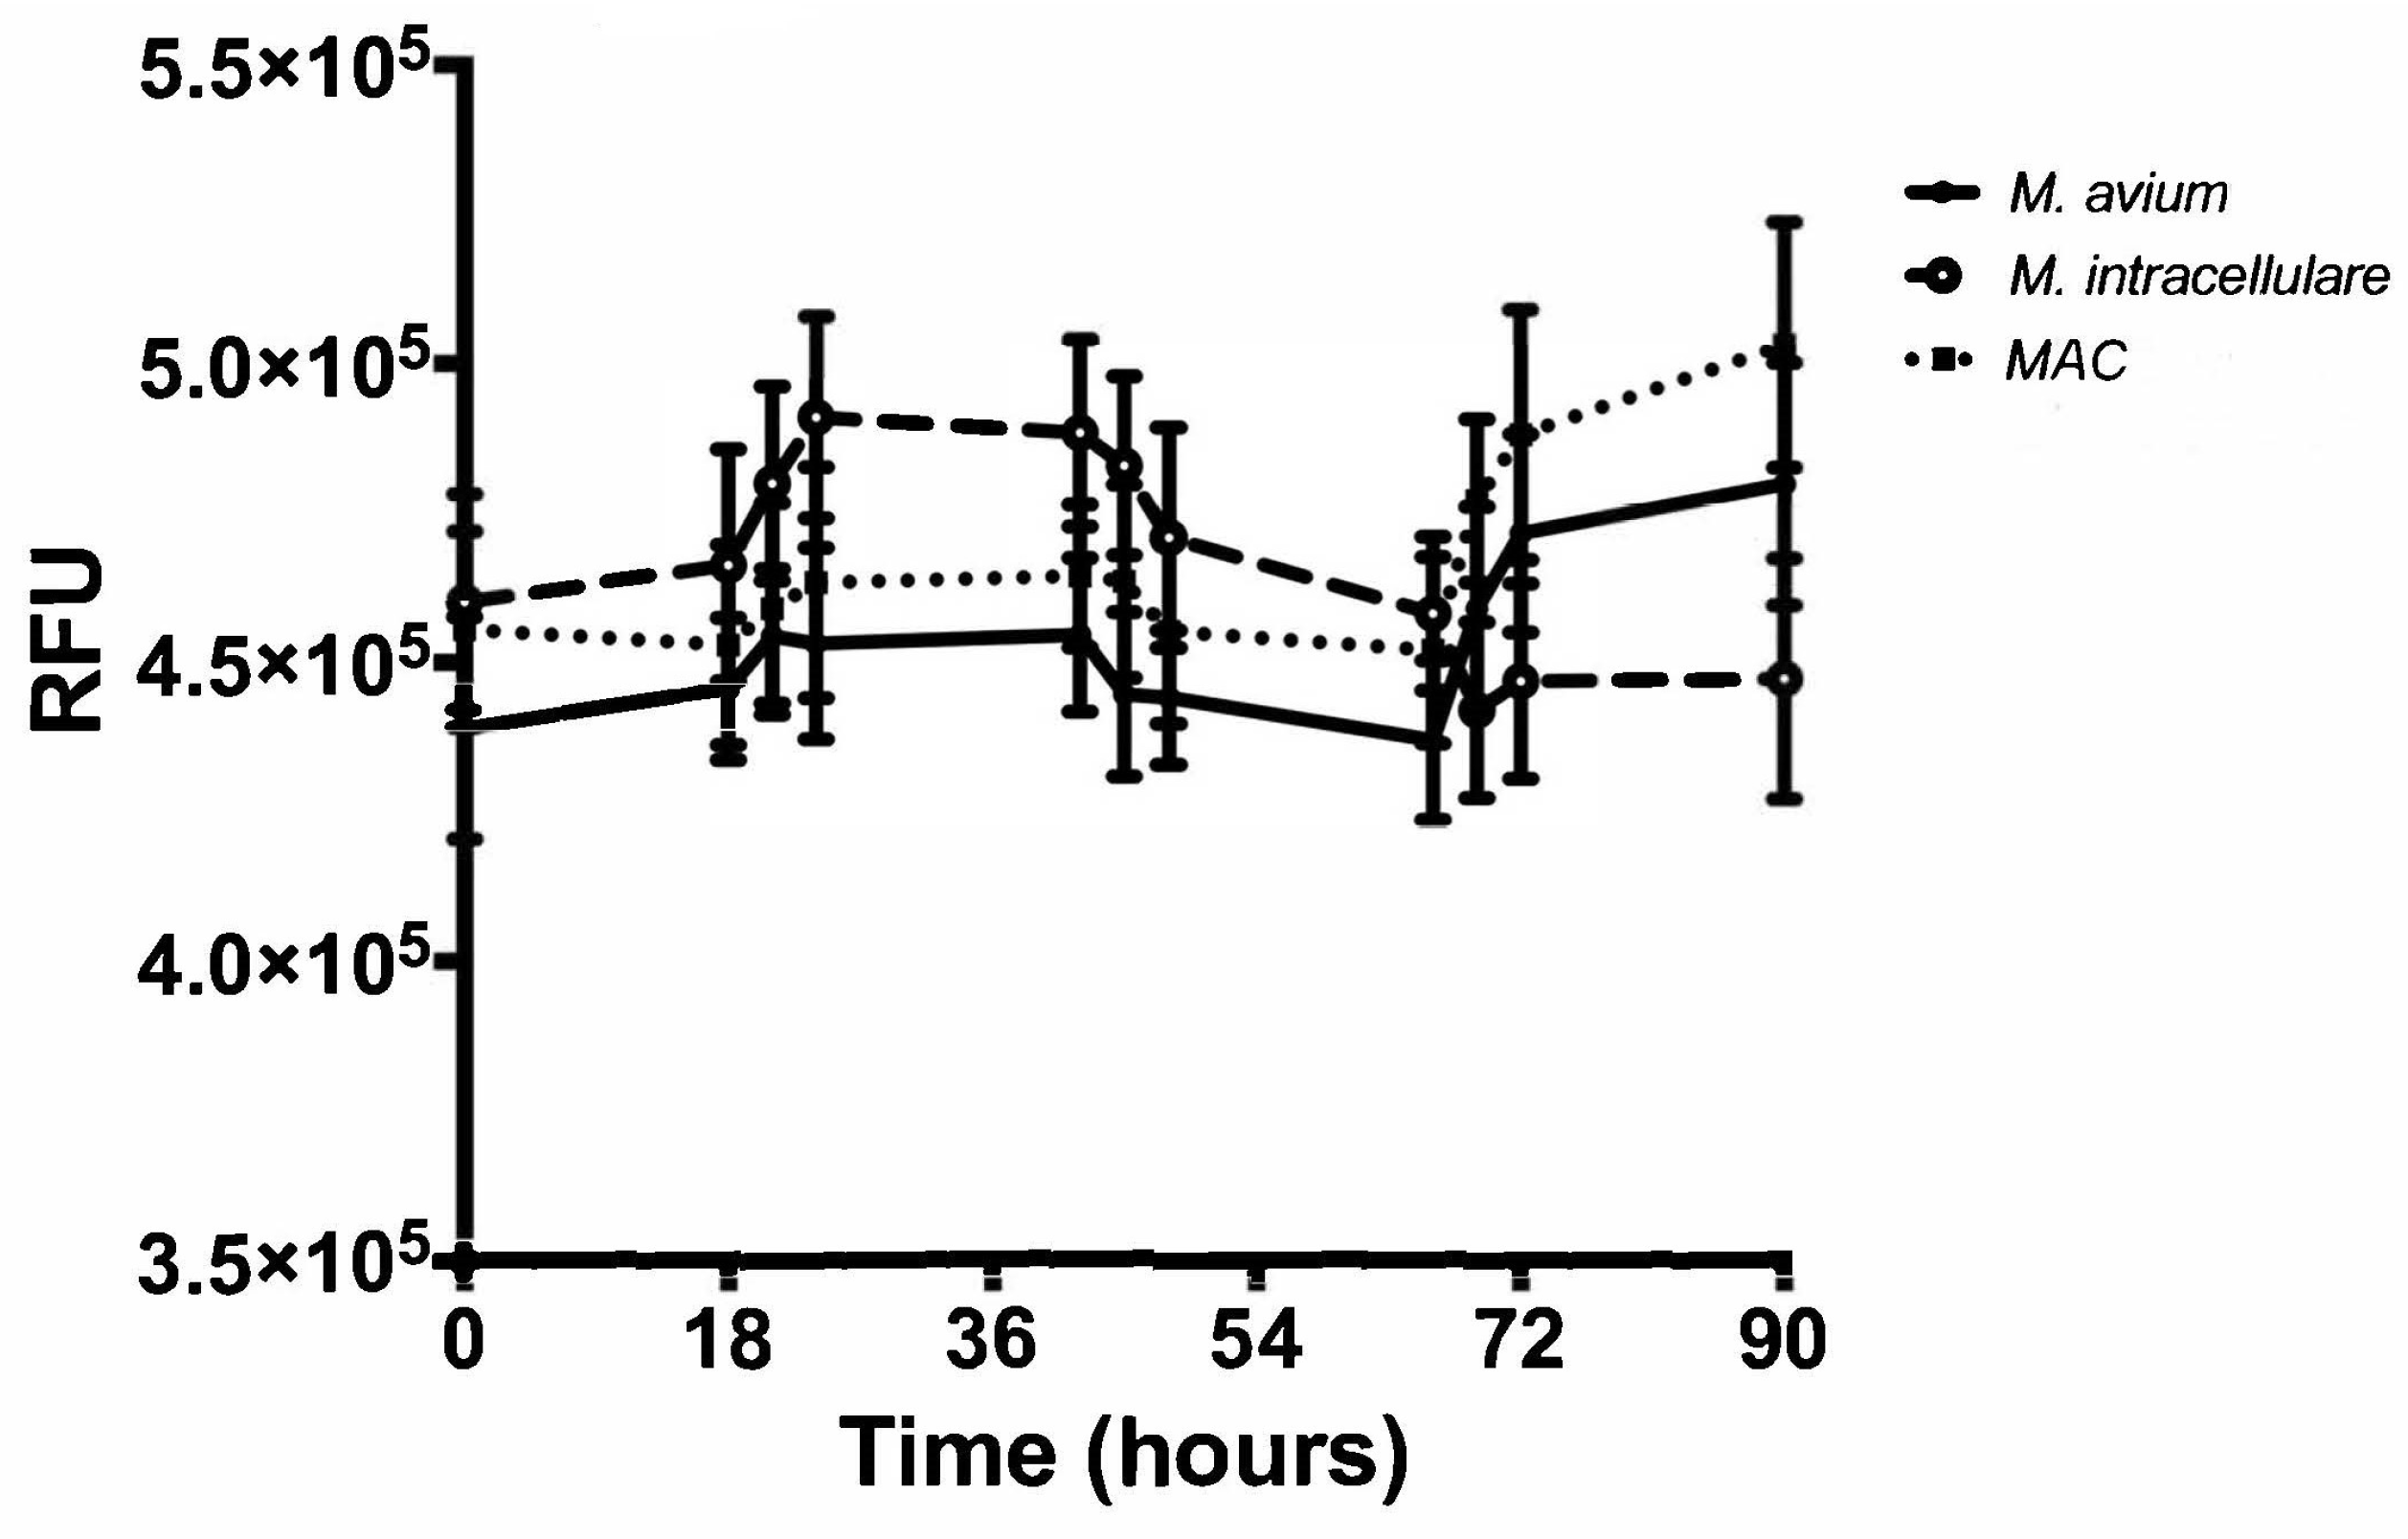
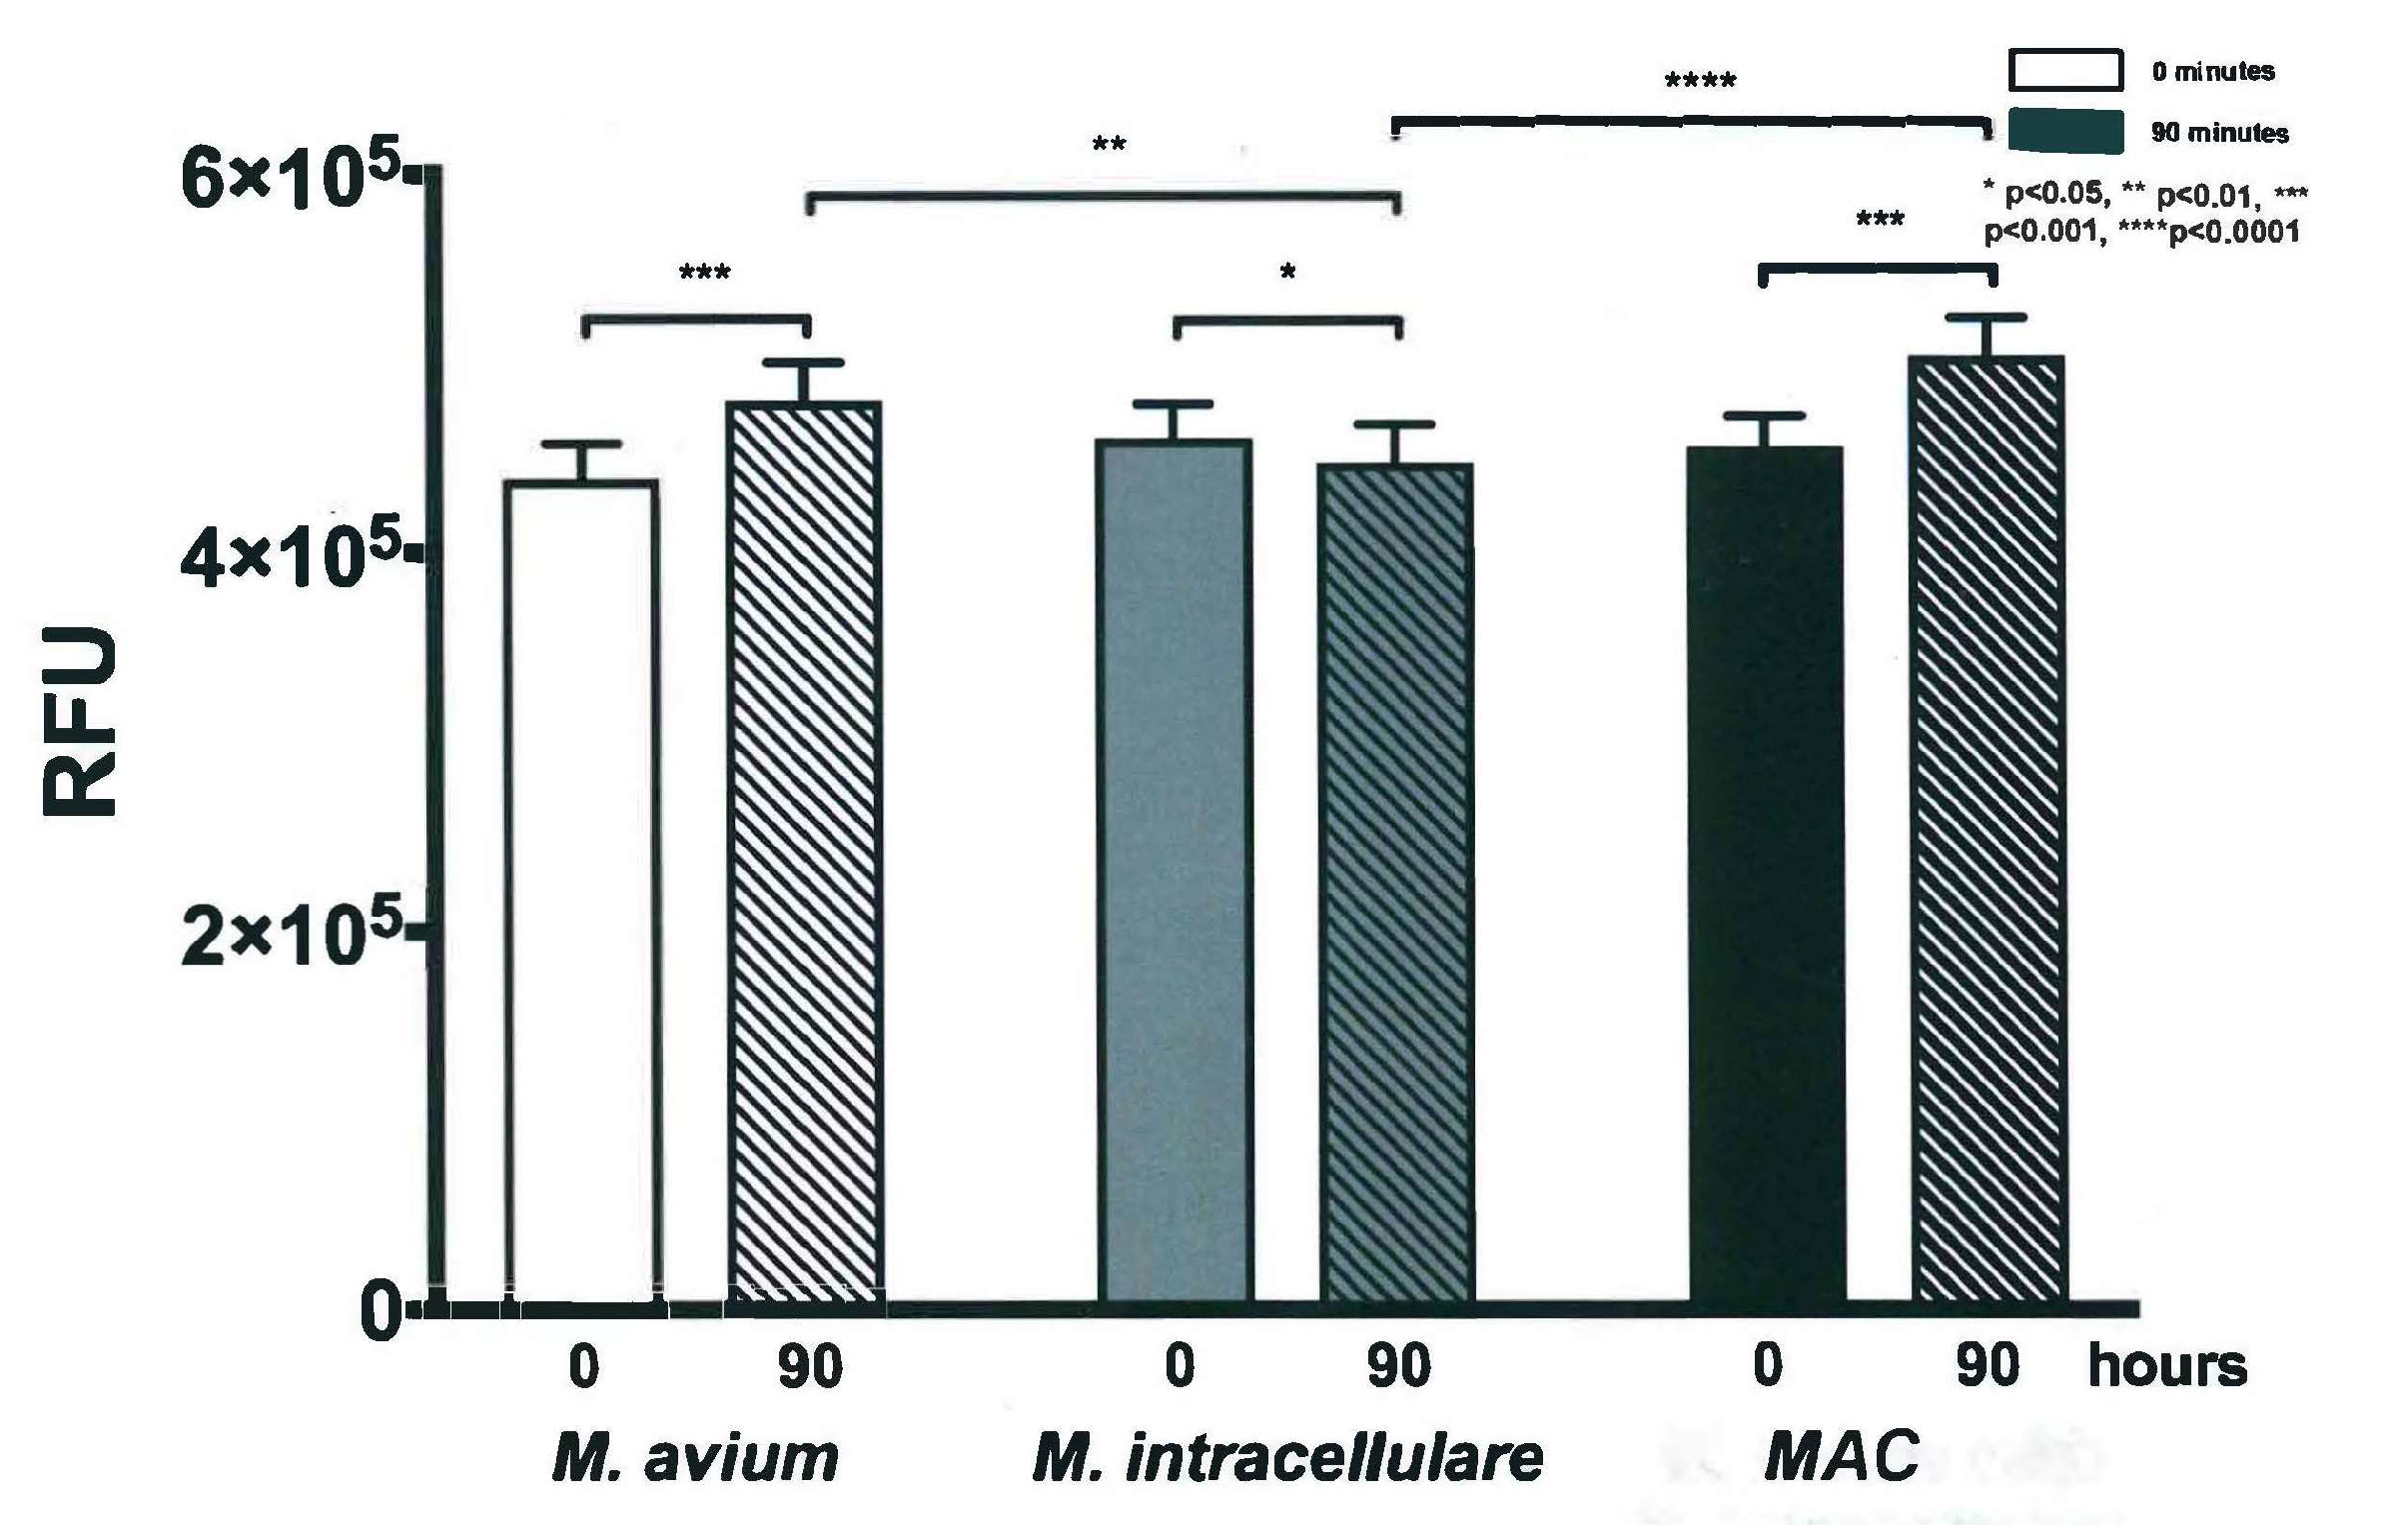
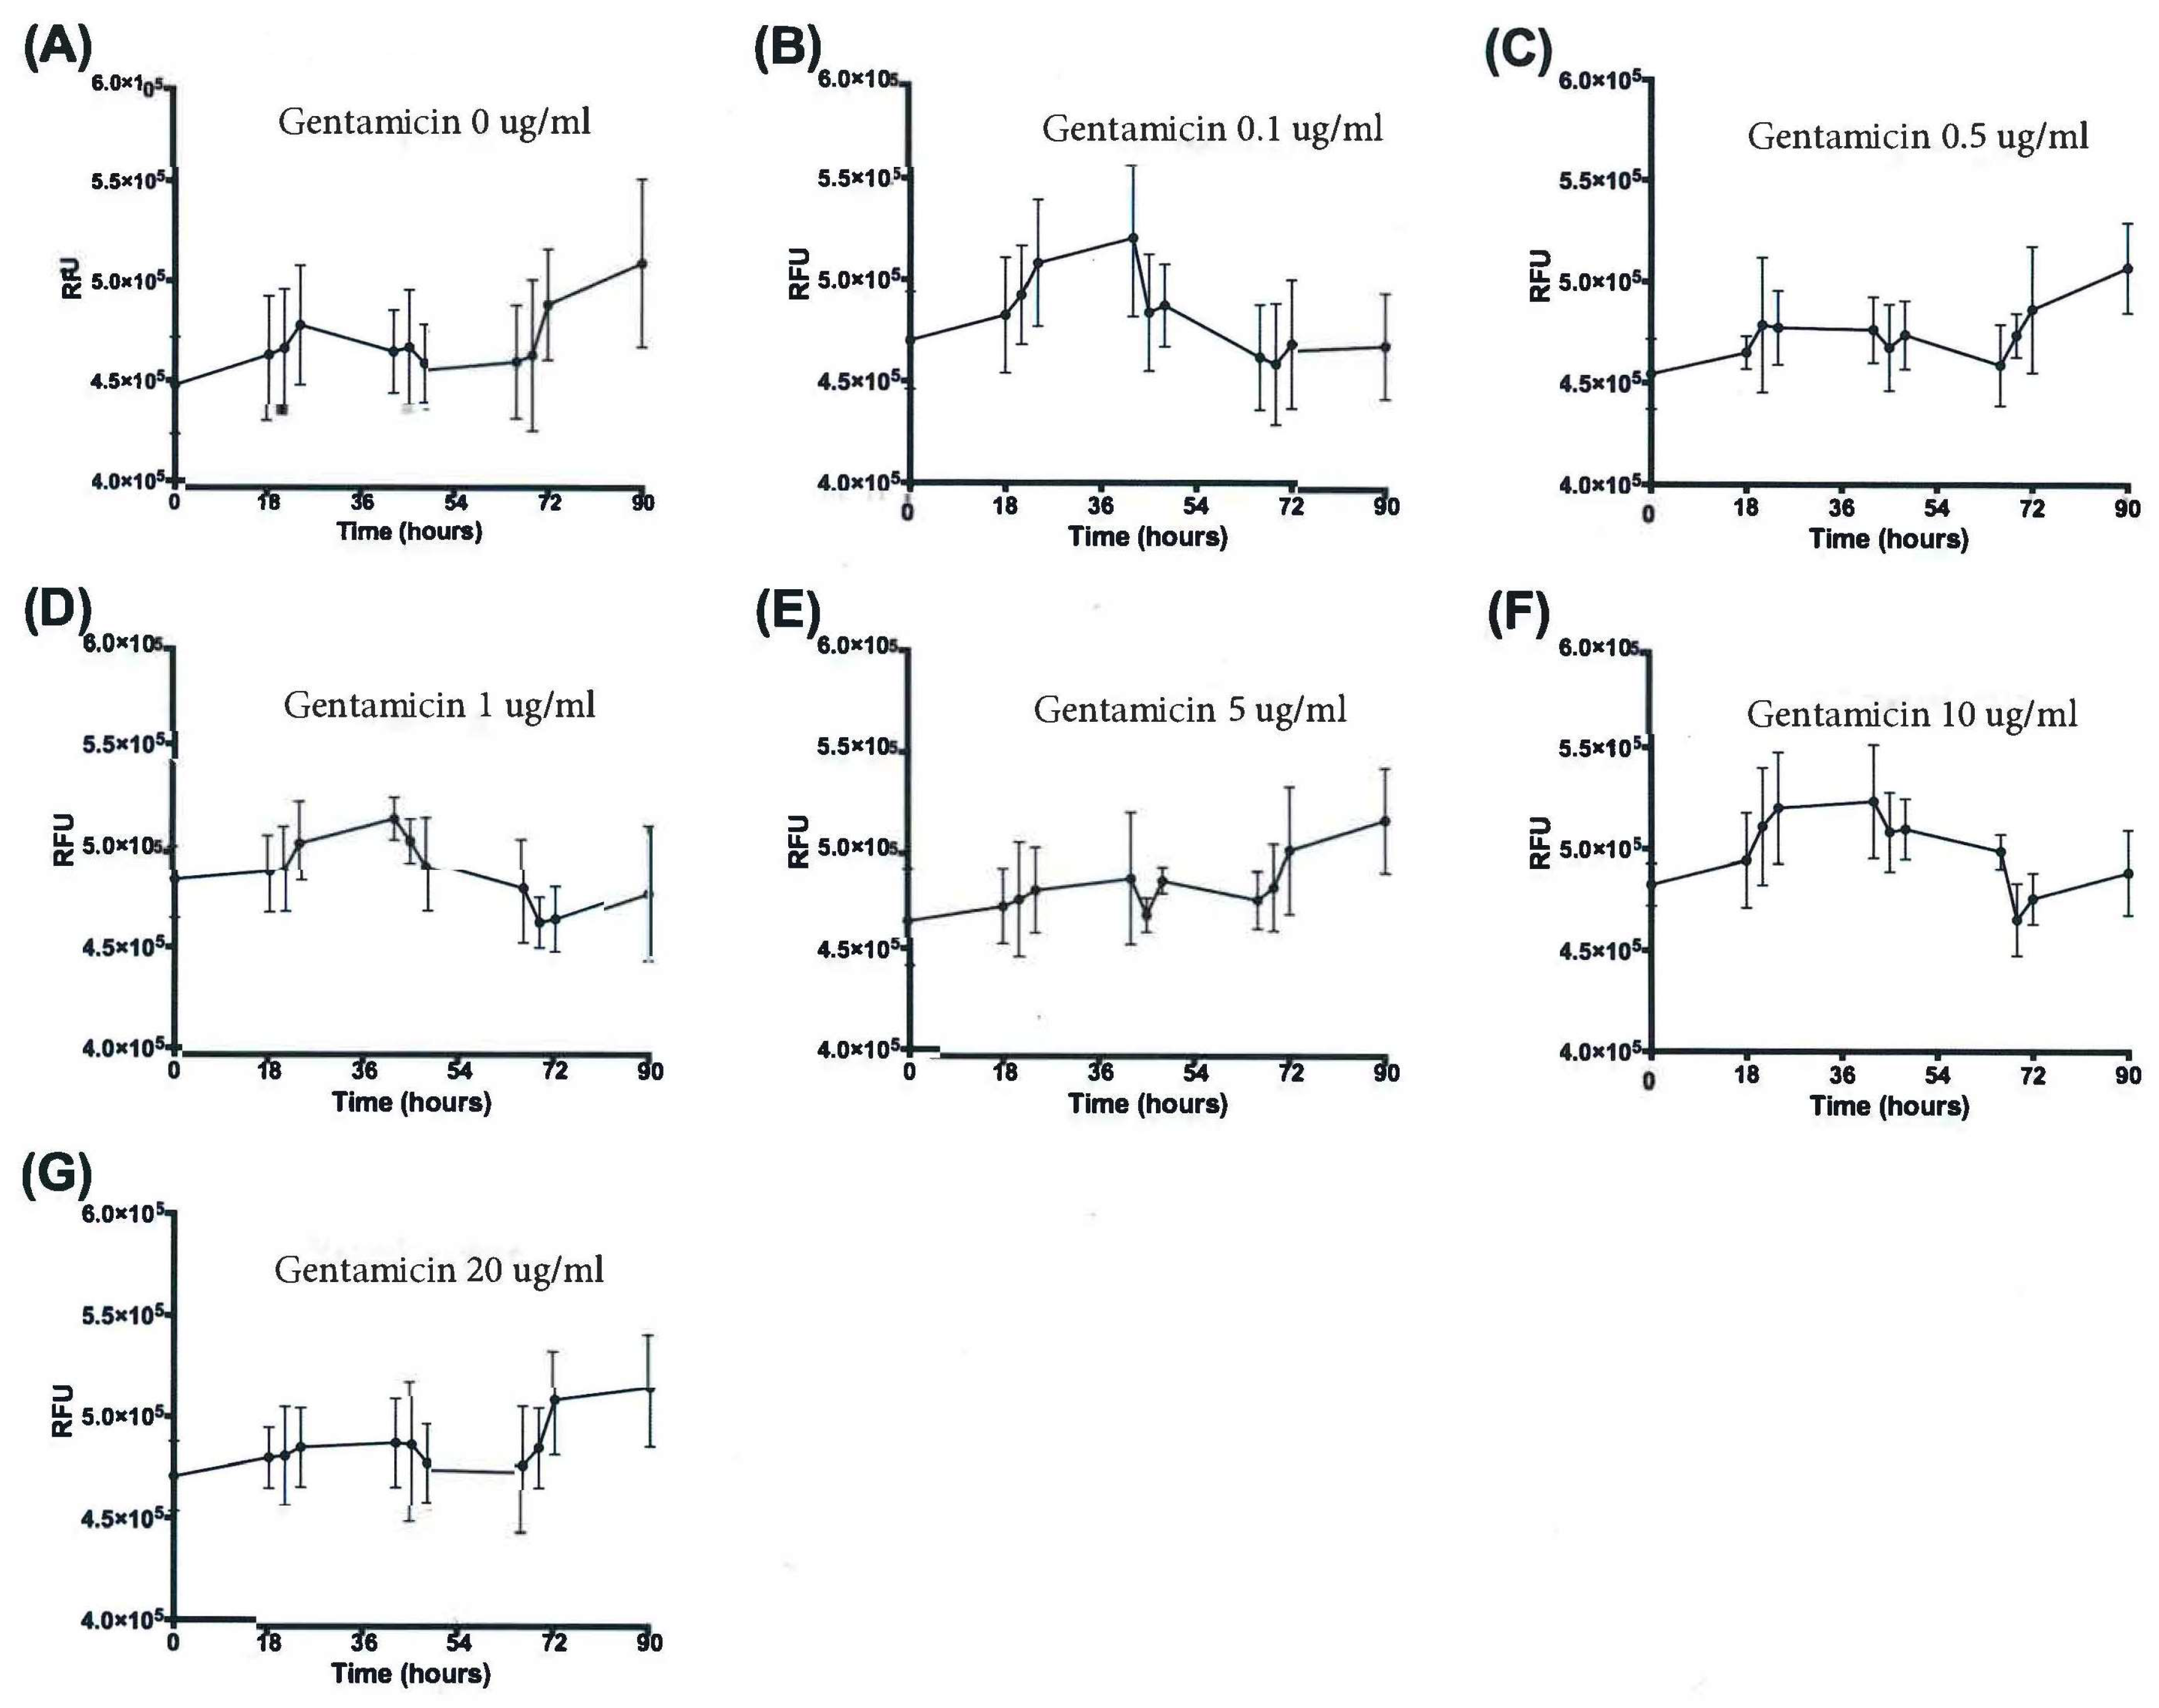
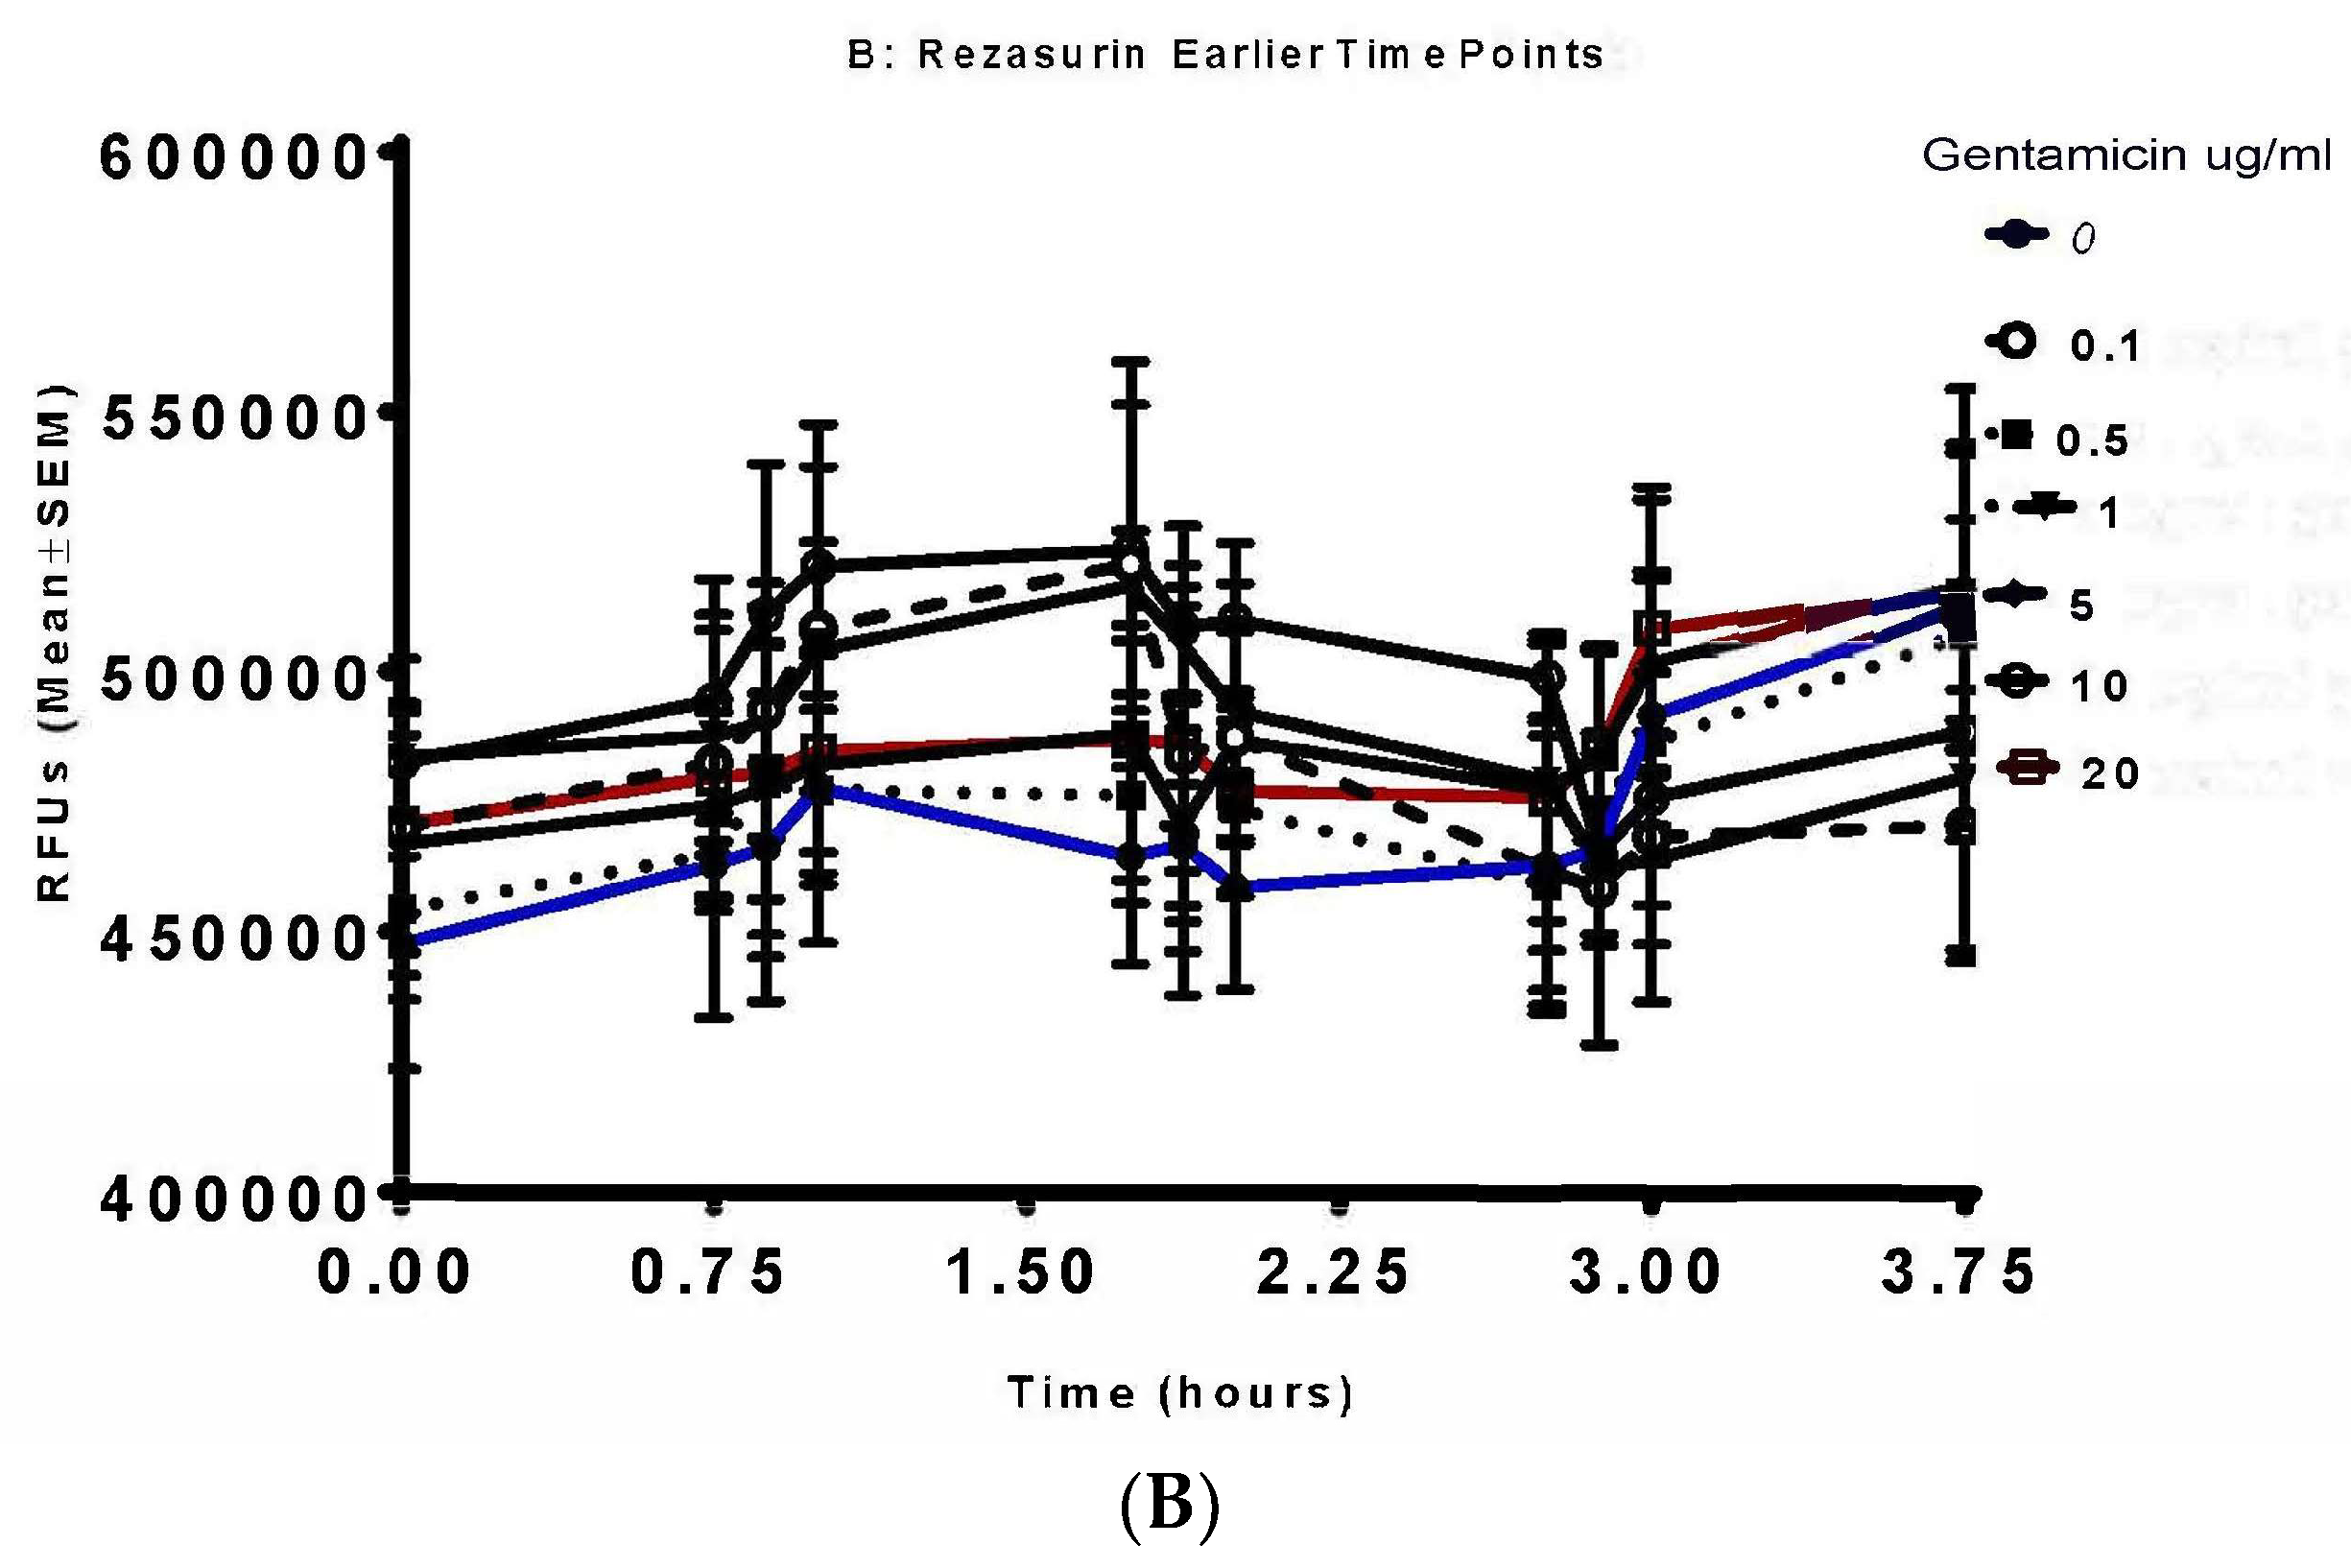
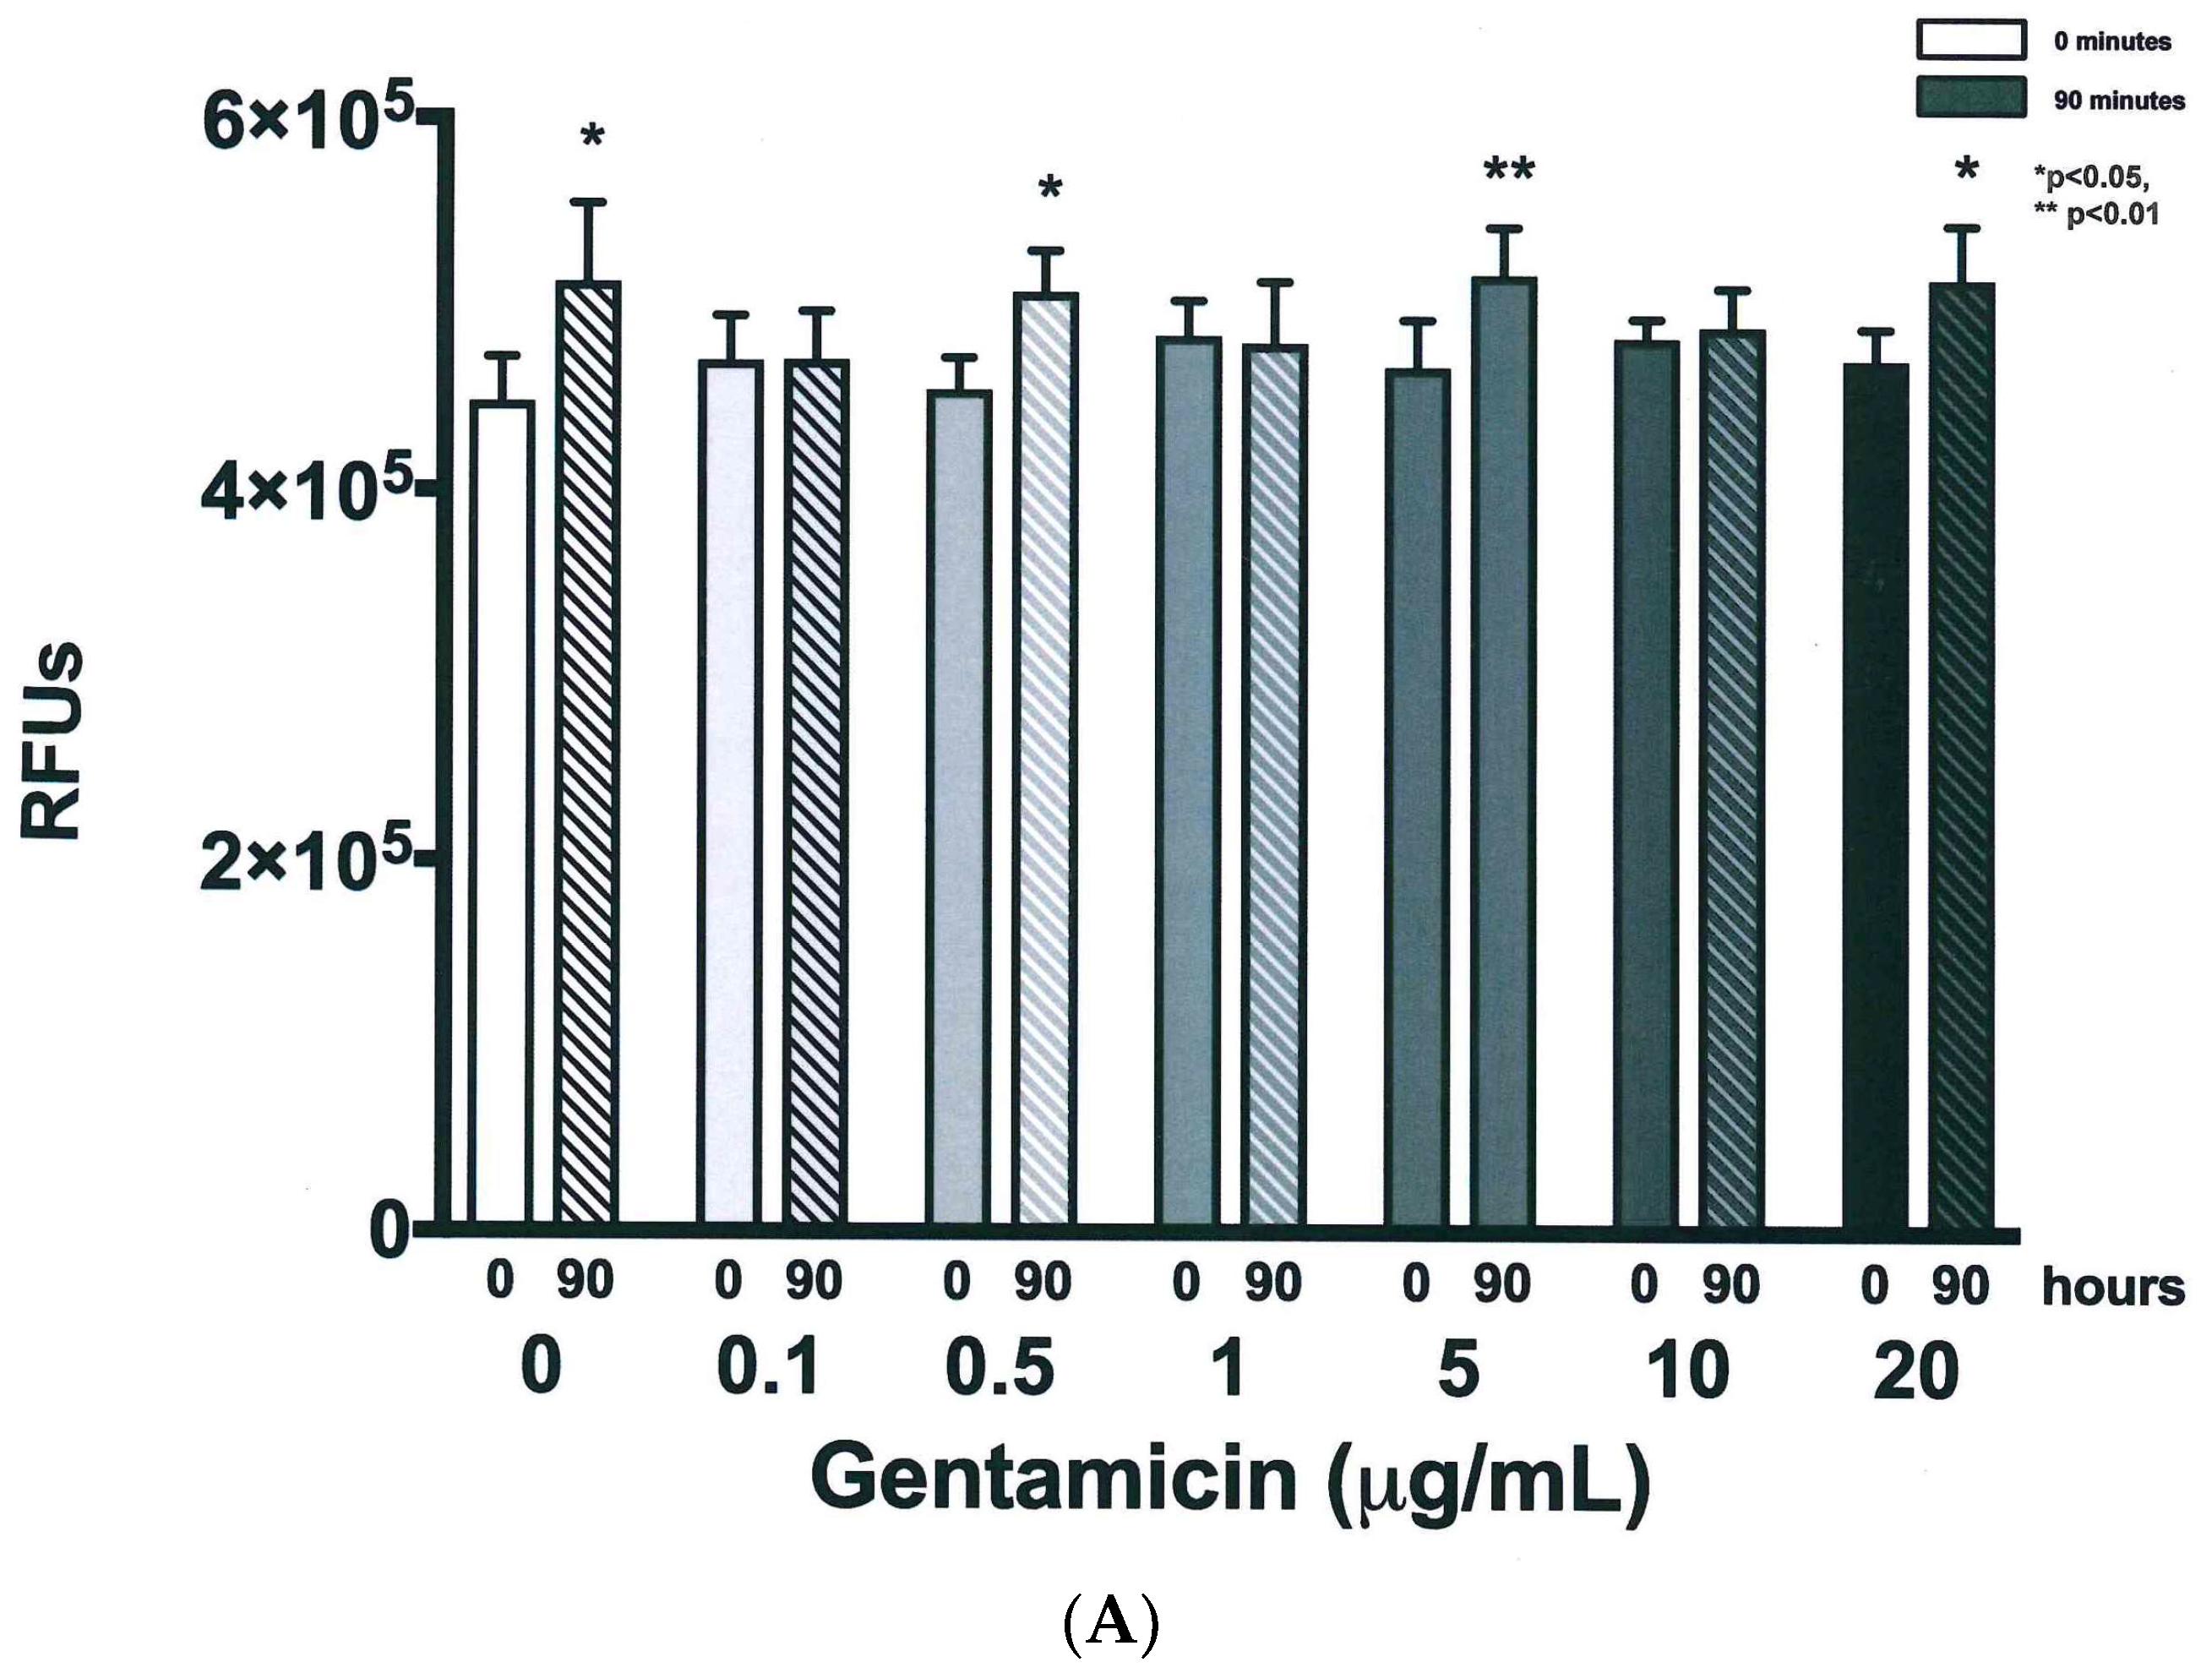
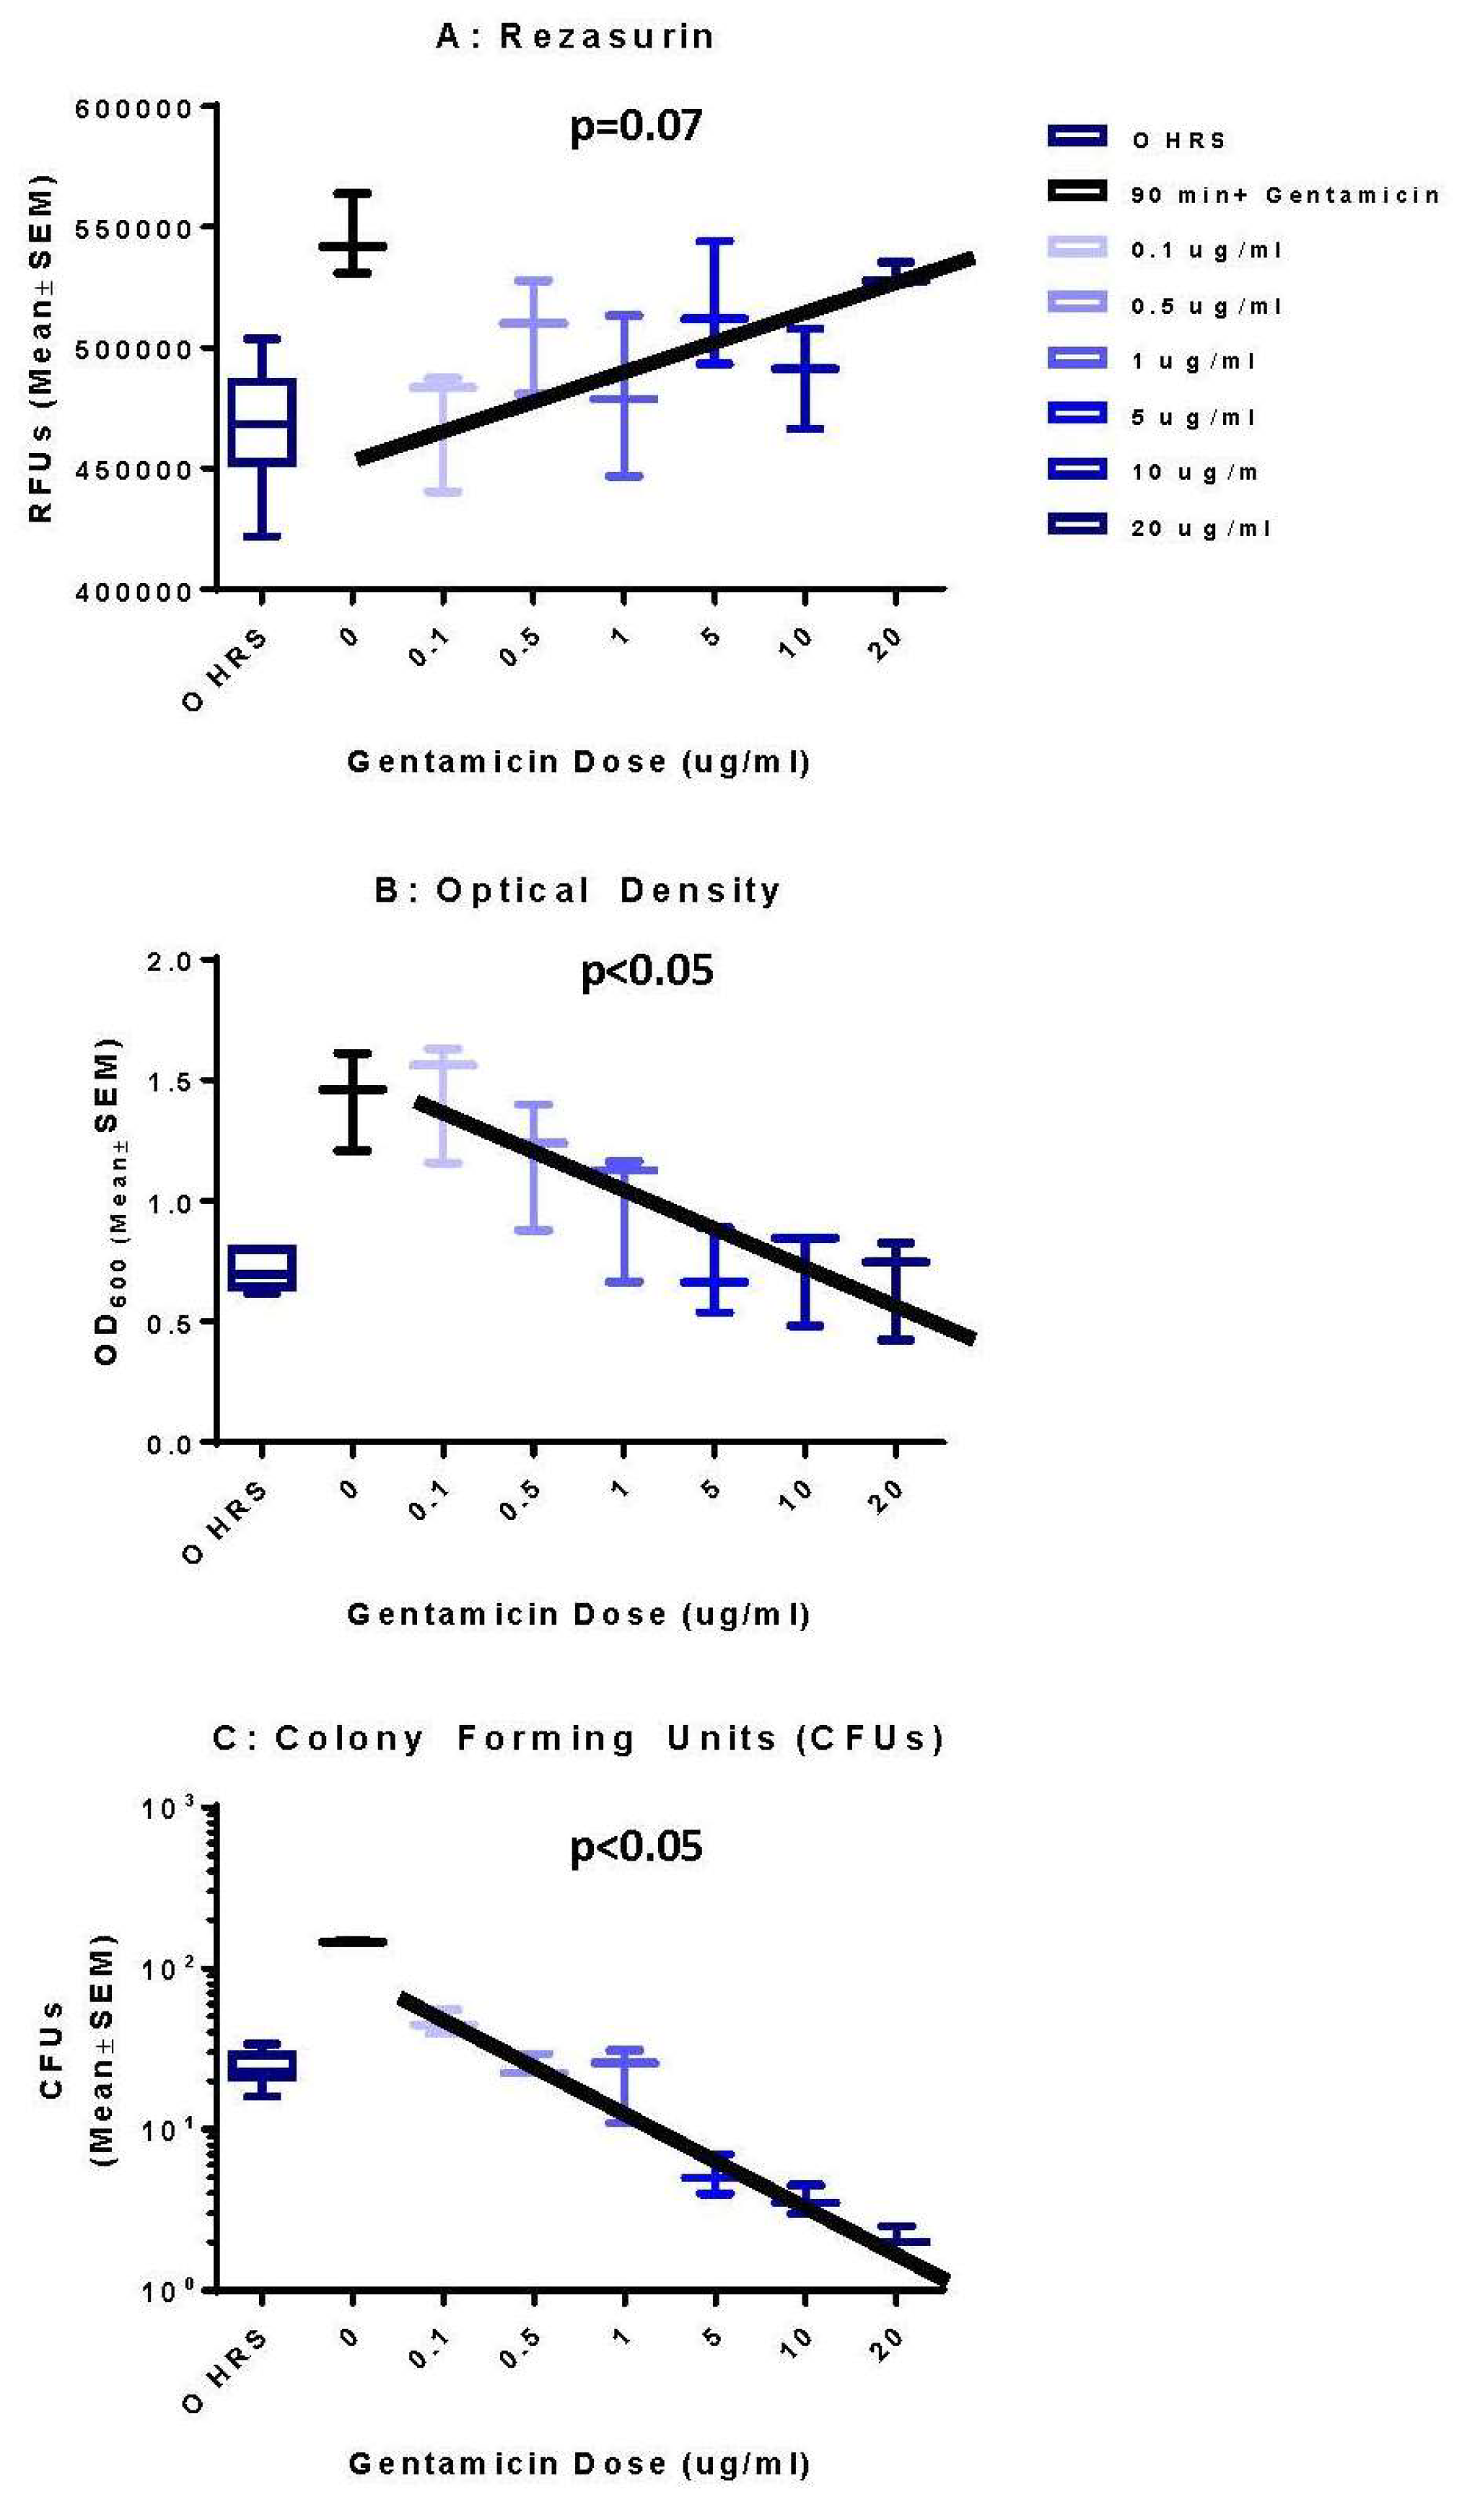
3.3. Resazurin Assay Detects Metabolic Activity of the NTM
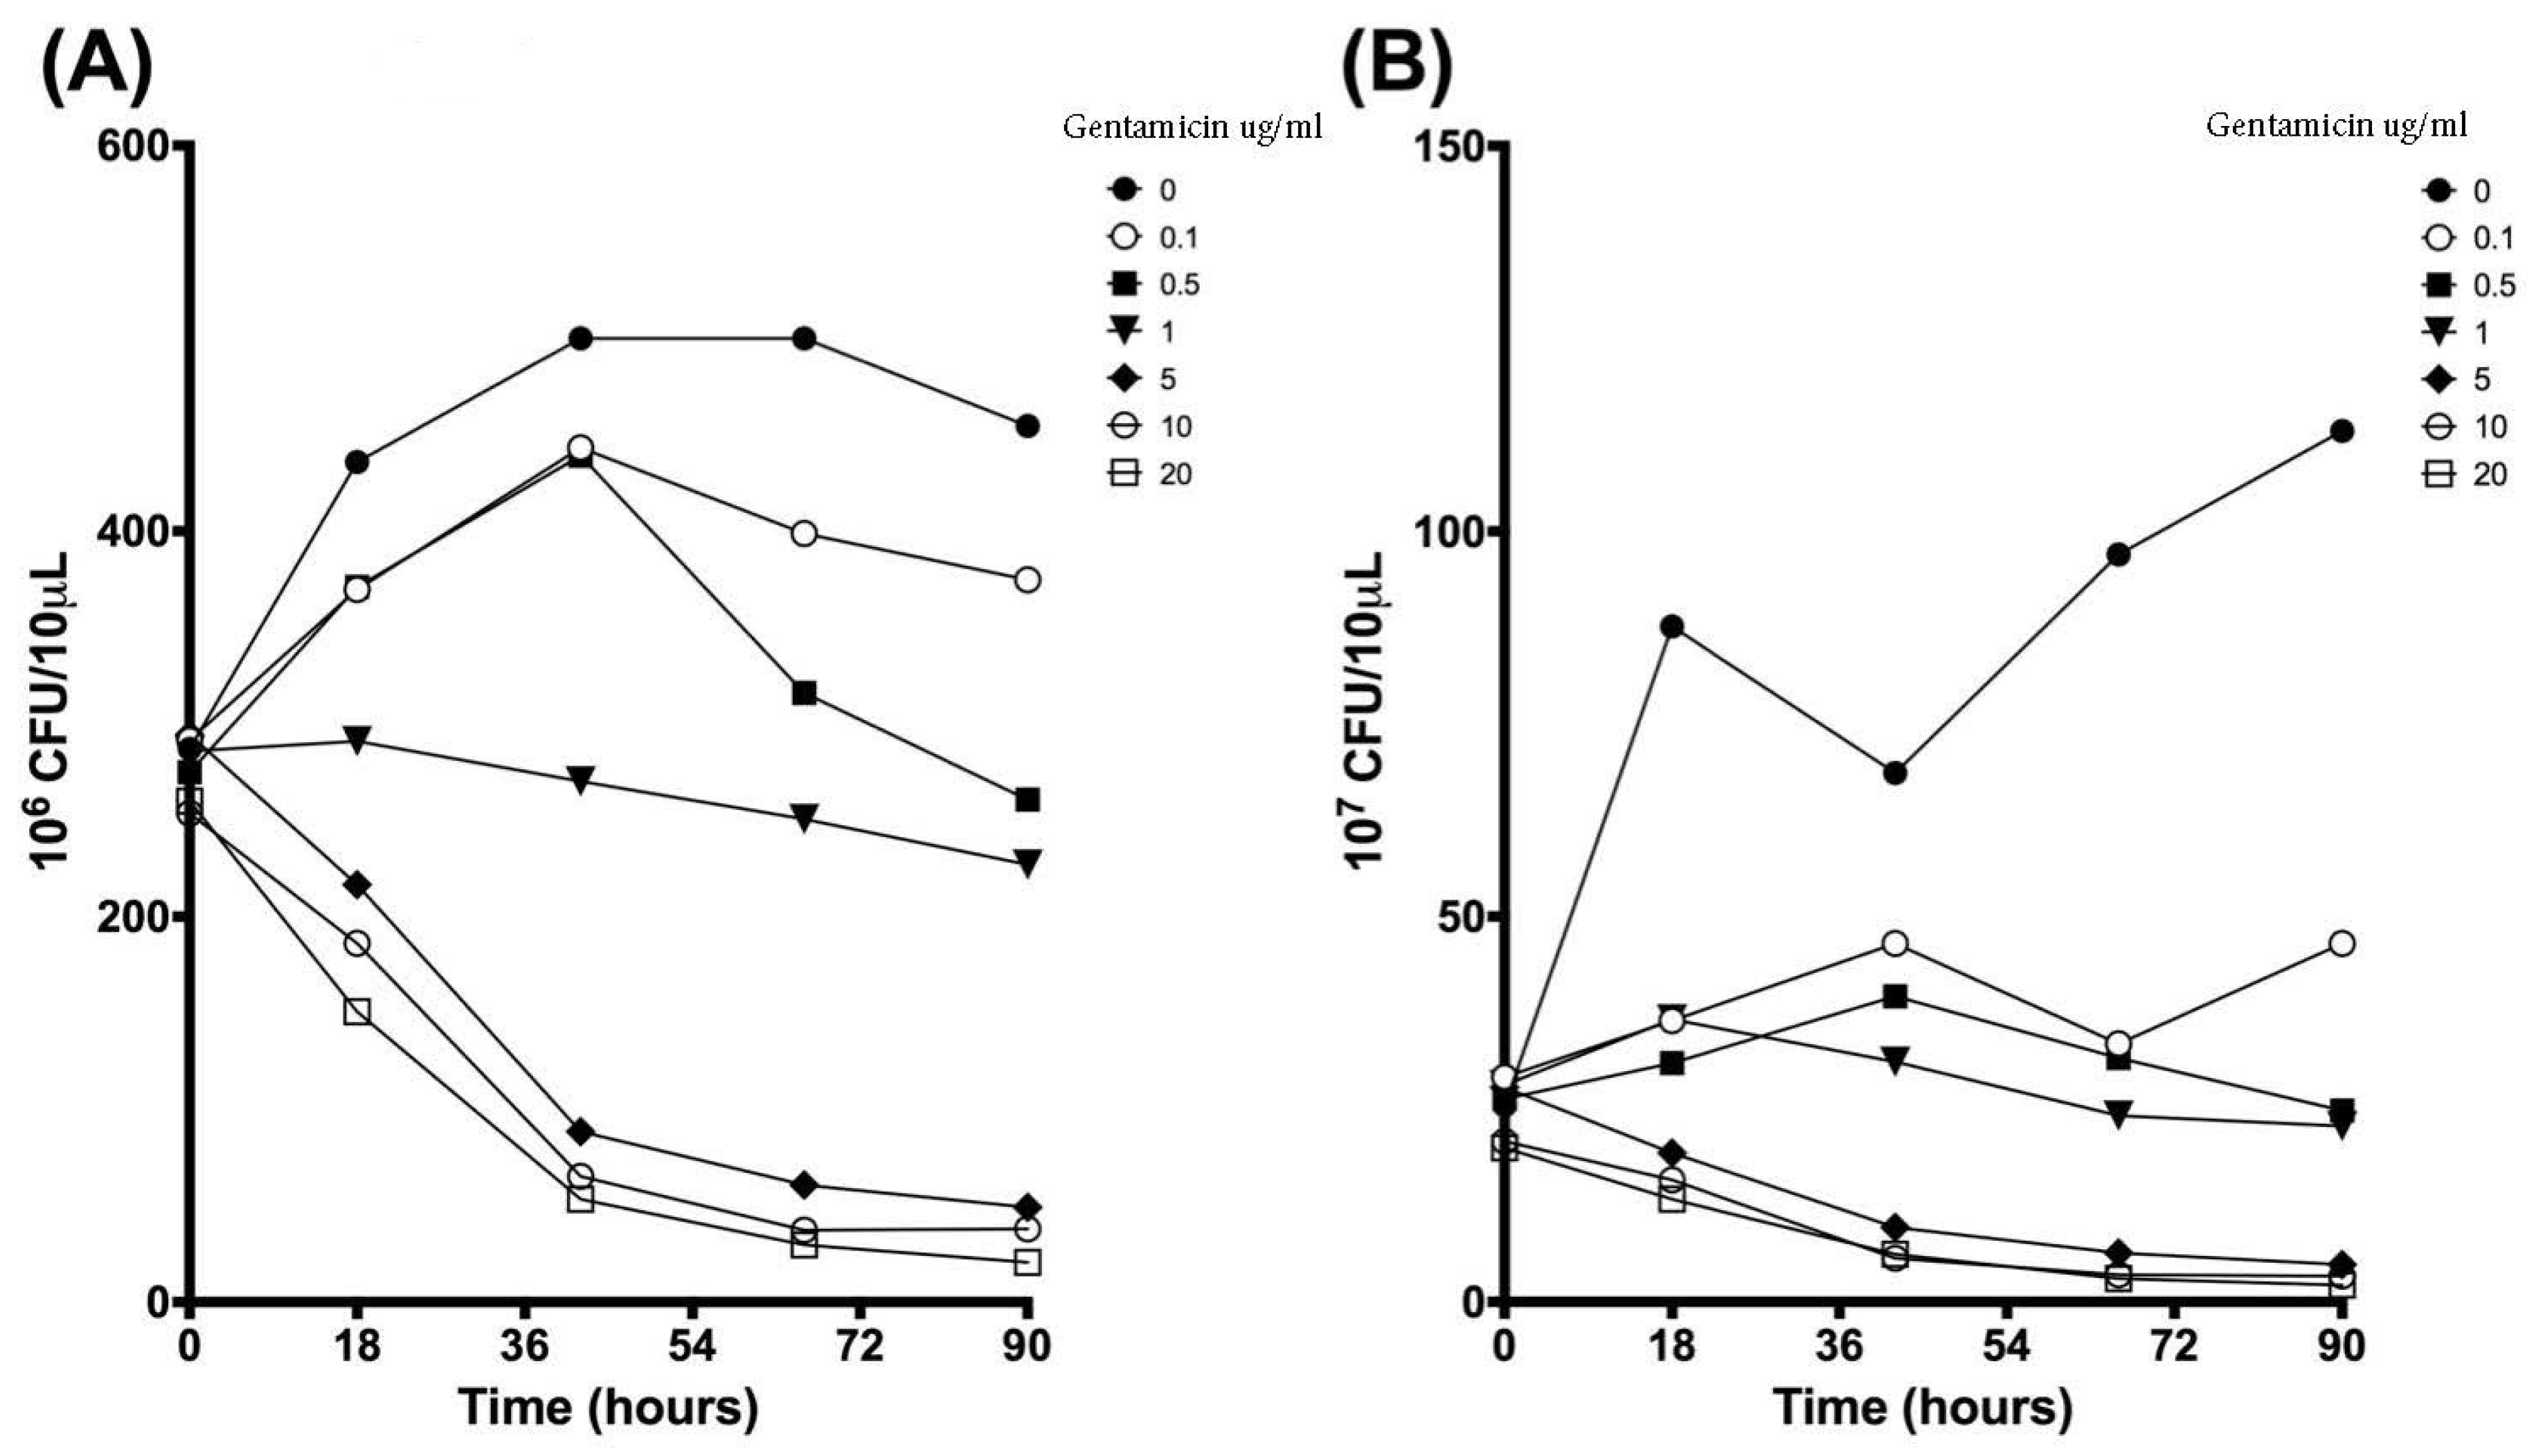
3.4. Validation of New Assays to Monitor Therapeutics
4. Discussion
Author Contributions
Funding
Acknowledgments
Conflicts of Interest
References
- Griffith, D.E.; Aksamit, T.; Brown-Elliott, B.A.; Catanzaro, A. An official ATS/IDSA statement: Diagnosis, treatment, and prevention of nontuberculous mycobacterial diseases. Am. J. Respir. Crit. Care Med. 2007, 175, 367–416. [Google Scholar] [CrossRef] [PubMed]
- Tortoli, E. Microbiological features and clinical relevance of new species of the genus Mycobacterium. Clin. Microbiol. Rev. 2014, 27, 727–752. [Google Scholar] [CrossRef] [PubMed]
- Inderlied, C.B.; Kemper, C.A.; Bermudez, L.E. The Mycobacterium avium complex. Clin. Microbiol. Rev. 1993, 6, 266–310. [Google Scholar] [CrossRef] [PubMed]
- Olivier, K.N.; Weber, D.J.; Wallace, R.J.; Faiz, A.R. Nontuberculous mycobacteria: I: Multicenter prevalence study in cystic fibrosis. Am. J. Respir. Crit. Care Med. 2003, 167, 828–834. [Google Scholar] [CrossRef] [PubMed]
- Lam, P.K.; Griffith, D.E.; Aksamit, T.R.; Ruoss, S.J. Factors related to response to intermittent treatment of Mycobacterium avium complex lung disease. Am. J. Respir. Crit. Care Med. 2006, 173, 283–1289. [Google Scholar] [CrossRef] [PubMed]
- Ruoss, S.J. Pulmonary Infection in HIV-Negative Patients without Preexisting Lung Disease. Diagnostic and Management Limitations. Chest 1999, 115, 1033–1040. [Google Scholar]
- Park, S.W.; Song, J.W.; Shim, T.S.; Park, M.S. Mycobacterial pulmonary infections in patients with idiopathic pulmonary fibrosis. J. Korean Med. Sci. 2012, 27, 896–900. [Google Scholar] [CrossRef] [PubMed]
- Brown, B.A.; Wallace, R.J.; Onyi, G.O. Activities of clarithromycin against eight slowly growing species of nontuberculous mycobacteria, determined by using a broth microdilution MIC system. Antimicrob. Agents Chemother. 1992, 36, 1987–1990. [Google Scholar] [CrossRef]
- Siddiqi, S.H.; Heifets, L.B.; Cynamon, M.H.; Hooper, N.M. Rapid broth macrodilution method for determination of MICs for Mycobacterium avium isolates. J. Clin. Microbiol. 1993, 31, 2332–2338. [Google Scholar]
- American Thoracic Society. Diagnosis and Treatment of Disease Caused by Nontuberculous Mycobacteria. Am. J. Respir. Crit. Care Med. 1997, 156, S1–S25. [Google Scholar]
- Menzies, D.; Nahid, P. Update in tuberculosis and nontuberculous mycobacterial disease 2012. Am. J. Respir. Crit. Care Med. 2013, 188, 923–927. [Google Scholar] [CrossRef]
- Koh, W.J.; Jeong, B.H.; Jeon, K.; Lee, N.Y. Clinical significance of the differentiation between Mycobacterium avium and Mycobacterium intracellulare in M avium complex lung disease. Chest 2012, 142, 1482–1488. [Google Scholar] [CrossRef]
- Griffith, D.E.; Brown-Elliot, B.A.; Wallace, R.J. Hit the Road, MAC, and Don’t You Come Back No More. Am. J. Respir. Crit. Care Med. 2015, 19, 1222–1224. [Google Scholar] [CrossRef] [PubMed]
- Gomes, M.S.; Dom, G.; Pedrosa, J.; Boelaert, J.R. Effects of iron deprivation on Mycobacterium avium growth. Tuber Lung Dis. 1999, 79, 321–328. [Google Scholar] [CrossRef]
- American Type Culture Collection ATCC Medium: 1395 Middlebrook 7H9 Broth w/ADC Enrichment. Available online: www.atcc.org/~/media/014FA24571954E679A363A23BE388F00.ashx (accessed on 6 January 2017).
- American Type Culture Collection. Reviving Freeze-Dried Microorganisms Instructional Guide Reviving Freeze-. Available online: www.atcc.org/~/media/rfdc.ashx (accessed on 6 January 2017).
- CellTiter-Blue ® Cell Viability Assay. Promega. Available online: www.promega.com/-/media/files/resources/protocols/technical-bulletins/101/celltiter-blue-cell-viability-assay-protocol.pdf (accessed on 6 January 2017).
- Peeters, E.; Nelis, H.J.; Coenye, T. Comparison of multiple methods for quantification of microbial biofilms grown in microtiter plates. J. Microbiol. Methods 2008, 72, 157–165. [Google Scholar] [CrossRef] [PubMed]
- Federle, M.J.; Bassler, B.L. Interspecies communication in bacteria. J. Clin. Investig. 2003, 112, 1291–1299. [Google Scholar] [CrossRef] [PubMed]
- Begot, C.; Desnier, I.; Daudin, J.D.; Labadie, J.C. Recommendations for calculating growth parameters by optical density measurements. J. Microbiol. Methods 1996, 25, 225–232. [Google Scholar] [CrossRef]
- Biesta-Peters, E.G.; Reij, M.W.; Joosten, H.; Gorris, L.G.M. Comparison of two optical-density-based methods and a plate count method for estimation of growth parameters of bacillus cereus. Appl. Environ. Microbiol. 2010, 76, 1399–1405. [Google Scholar] [CrossRef]
- Ben-David, A.; Davidson, C.E. Estimation method for serial dilution experiments. J. Microbiol. Methods 2014, 107, 214–221. [Google Scholar] [CrossRef]
- Sarker, S.D.; Nahar, L.; Kumarasamy, Y. Microtitre plate-based antibacterial assay incorporating resazurin as an indicator of cell growth, and its application in the in vitro antibacterial screening of phytochemicals. Methods 2007, 42, 321–324. [Google Scholar] [CrossRef]
- Anoopkumar-Dukie, S.; Carey, J.B.; Conere, T.; O’Sullivan, E. Resazurin assay of radiation response in cultured cells. Br. J. Radiol. 2005, 78, 945–947. [Google Scholar] [CrossRef]
- Yoshizawa, S.; Fourmy, D.; Puglisi, J.D. Structural origins of gentamicin antibiotic action. EMBO J. 1998, 17, 6437–6448. [Google Scholar] [CrossRef] [PubMed]
- Huang, C.-C.; Wu, M.-F.; Chen, H.-C.; Huang, W.-C. In vitro activity of aminoglycosides, clofazimine, d-cycloserine and dapsone against 83 Mycobacterium avium complex clinical isolates. J. Microbiol. Immunol. Infect. 2018, 51, 636–643. [Google Scholar] [CrossRef] [PubMed]
- Huh, H.J.; Kim, S.-Y.; Jhun, B.W.; Shin, S.J.; Koh, W.-J. Recent advances in molecular diagnostics and understanding mechanisms of drug resistance in nontuberculous mycobacterial diseases. Infect. Genet. Evol. 2018. [Google Scholar] [CrossRef] [PubMed]
- Aguilar-Ayala, D.A.; Cnockaert, M.; André, E. In vitro activity of bedaquiline against rapidly growing nontuberculous mycobacteria. J. Med. Microbiol. 2017, 66, 1140–1143. [Google Scholar] [CrossRef] [PubMed]
- Zemanick, E.T.; Sagel, S.D.; Harris, J.K. The airway microbiome in cystic fibrosis and implications for treatment. Curr. Opin. Paediatr. 2011, 23, 319–324. [Google Scholar] [CrossRef] [PubMed]
- Kim, S.-Y.; Shin, S.H.; Moon, S.M.; Yang, B.; Kim, H.; Kwon, O.J.; Huh, H.J.; Ki, C.-S.; Lee, N.Y.; Shin, S.J.; et al. Distribution and clinical significance of Mycobacterium avium complex species isolated from respiratory specimens. Diagn. Microbiol. Infect. Dis. 2017, 88, 125–137. [Google Scholar] [CrossRef] [PubMed]
- Portell-Buj, E.; Vergara, A.; Alejo, I.; López-Gavín, A.; Monté, M.; San Nicolás, L.; González-Martín, J.; Tudó, G. In vitro activity of 12 antimicrobial peptides against Mycobacterium tuberculosis and Mycobacterium avium clinical isolates. J. Med. Microbiol. 2018. [Google Scholar] [CrossRef] [PubMed]
- Heifets, L.B.; Lindholm-Levy, P.J.; Comstock, R.D. Bacteriostatic and bactericidal activities of gentamicin alone and in combination with clarithromycin against Mycobacterium avium. Antimicrob. Agents Chemother. 1992, 36, 1695–1698. [Google Scholar] [CrossRef]
- Van Ingen, J.; Turenne, C.Y.; Tortoli, E.; Wallace, R.J., Jr.; Brown-Elliott, B.A. A definition of the Mycobacterium avium complex for taxonomical and clinical purposes, a review. Int. J. Syst. Evol. Microbiol. 2018, 68, 3666–3677. [Google Scholar] [CrossRef]


| Time (h) | 0 µg/mL | 0.1 µg/mL | 0.5 µg/mL | 1 µg/mL | 5 µg/mL | 10 µg/mL | 20 µg/mL | |||||||
|---|---|---|---|---|---|---|---|---|---|---|---|---|---|---|
| Mean | SD | Mean | SD | Mean | SD | Mean | SD | Mean | SD | Mean | SD | Mean | SD | |
| 0 | 0.699 | 0.090 | 0.703 | 0.082 | 0.715 | 0.081 | 0.719 | 0.080 | 0.710 | 0.087 | 0.711 | 0.081 | 0.702 | 0.089 |
| 18 | 1.193 | 0.344 | 1.012 | 0.068 | 0.980 | 0.039 | 1.000 | 0.041 | 1.016 | 0.031 | 1.009 | 0.021 | 0.990 | 0.040 |
| 21 | 1.220 | 0.296 | 1.067 | 0.070 | 1.011 | 0.029 | 1.025 | 0.036 | 1.035 | 0.018 | 1.027 | 0.007 | 1.003 | 0.024 |
| 24 | 1.205 | 0.213 | 1.103 | 0.064 | 1.018 | 0.010 | 1.027 | 0.042 | 1.028 | 0.036 | 1.013 | 0.042 | 0.987 | 0.036 |
| 42 | 1.286 | 0.055 | 1.288 | 0.035 | 1.092 | 0.081 | 1.059 | 0.133 | 0.956 | 0.142 | 0.957 | 0.159 | 0.873 | 0.122 |
| 45 | 1.365 | 0.148 | 1.370 | 0.130 | 1.167 | 0.049 | 1.129 | 0.022 | 1.031 | 0.042 | 1.009 | 0.040 | 0.945 | 0.059 |
| 48 | 1.376 | 0.148 | 1.398 | 0.165 | 1.184 | 0.083 | 1.137 | 0.021 | 1.037 | 0.008 | 1.017 | 0.030 | 0.931 | 0.069 |
| 66 | 1.384 | 0.171 | 1.417 | 0.210 | 1.163 | 0.199 | 1.065 | 0.159 | 0.902 | 0.094 | 0.887 | 0.126 | 0.802 | 0.105 |
| 69 | 1.374 | 0.166 | 1.392 | 0.205 | 1.144 | 0.213 | 1.049 | 0.168 | 0.861 | 0.110 | 0.851 | 0.139 | 0.780 | 0.120 |
| 72 | 1.371 | 0.185 | 1.395 | 0.232 | 1.136 | 0.239 | 1.026 | 0.202 | 0.846 | 0.147 | 0.820 | 0.177 | 0.749 | 0.145 |
| 90 | 1.426 | 0.204 | 1.450 | 0.256 | 1.171 | 0.266 | 0.985 | 0.278 | 0.763 | 0.196 | 0.726 | 0.210 | 0.664 | 0.214 |
| Time (h) | 0 µg/mL | 0.1 µg/mL | 0.5 µg/mL | 1 µg/mL | 5 µg/mL | 10 µg/mL | 20 µg/mL | |||||||
|---|---|---|---|---|---|---|---|---|---|---|---|---|---|---|
| Mean | SD | Mean | SD | Mean | SD | Mean | SD | Mean | SD | Mean | SD | Mean | SD | |
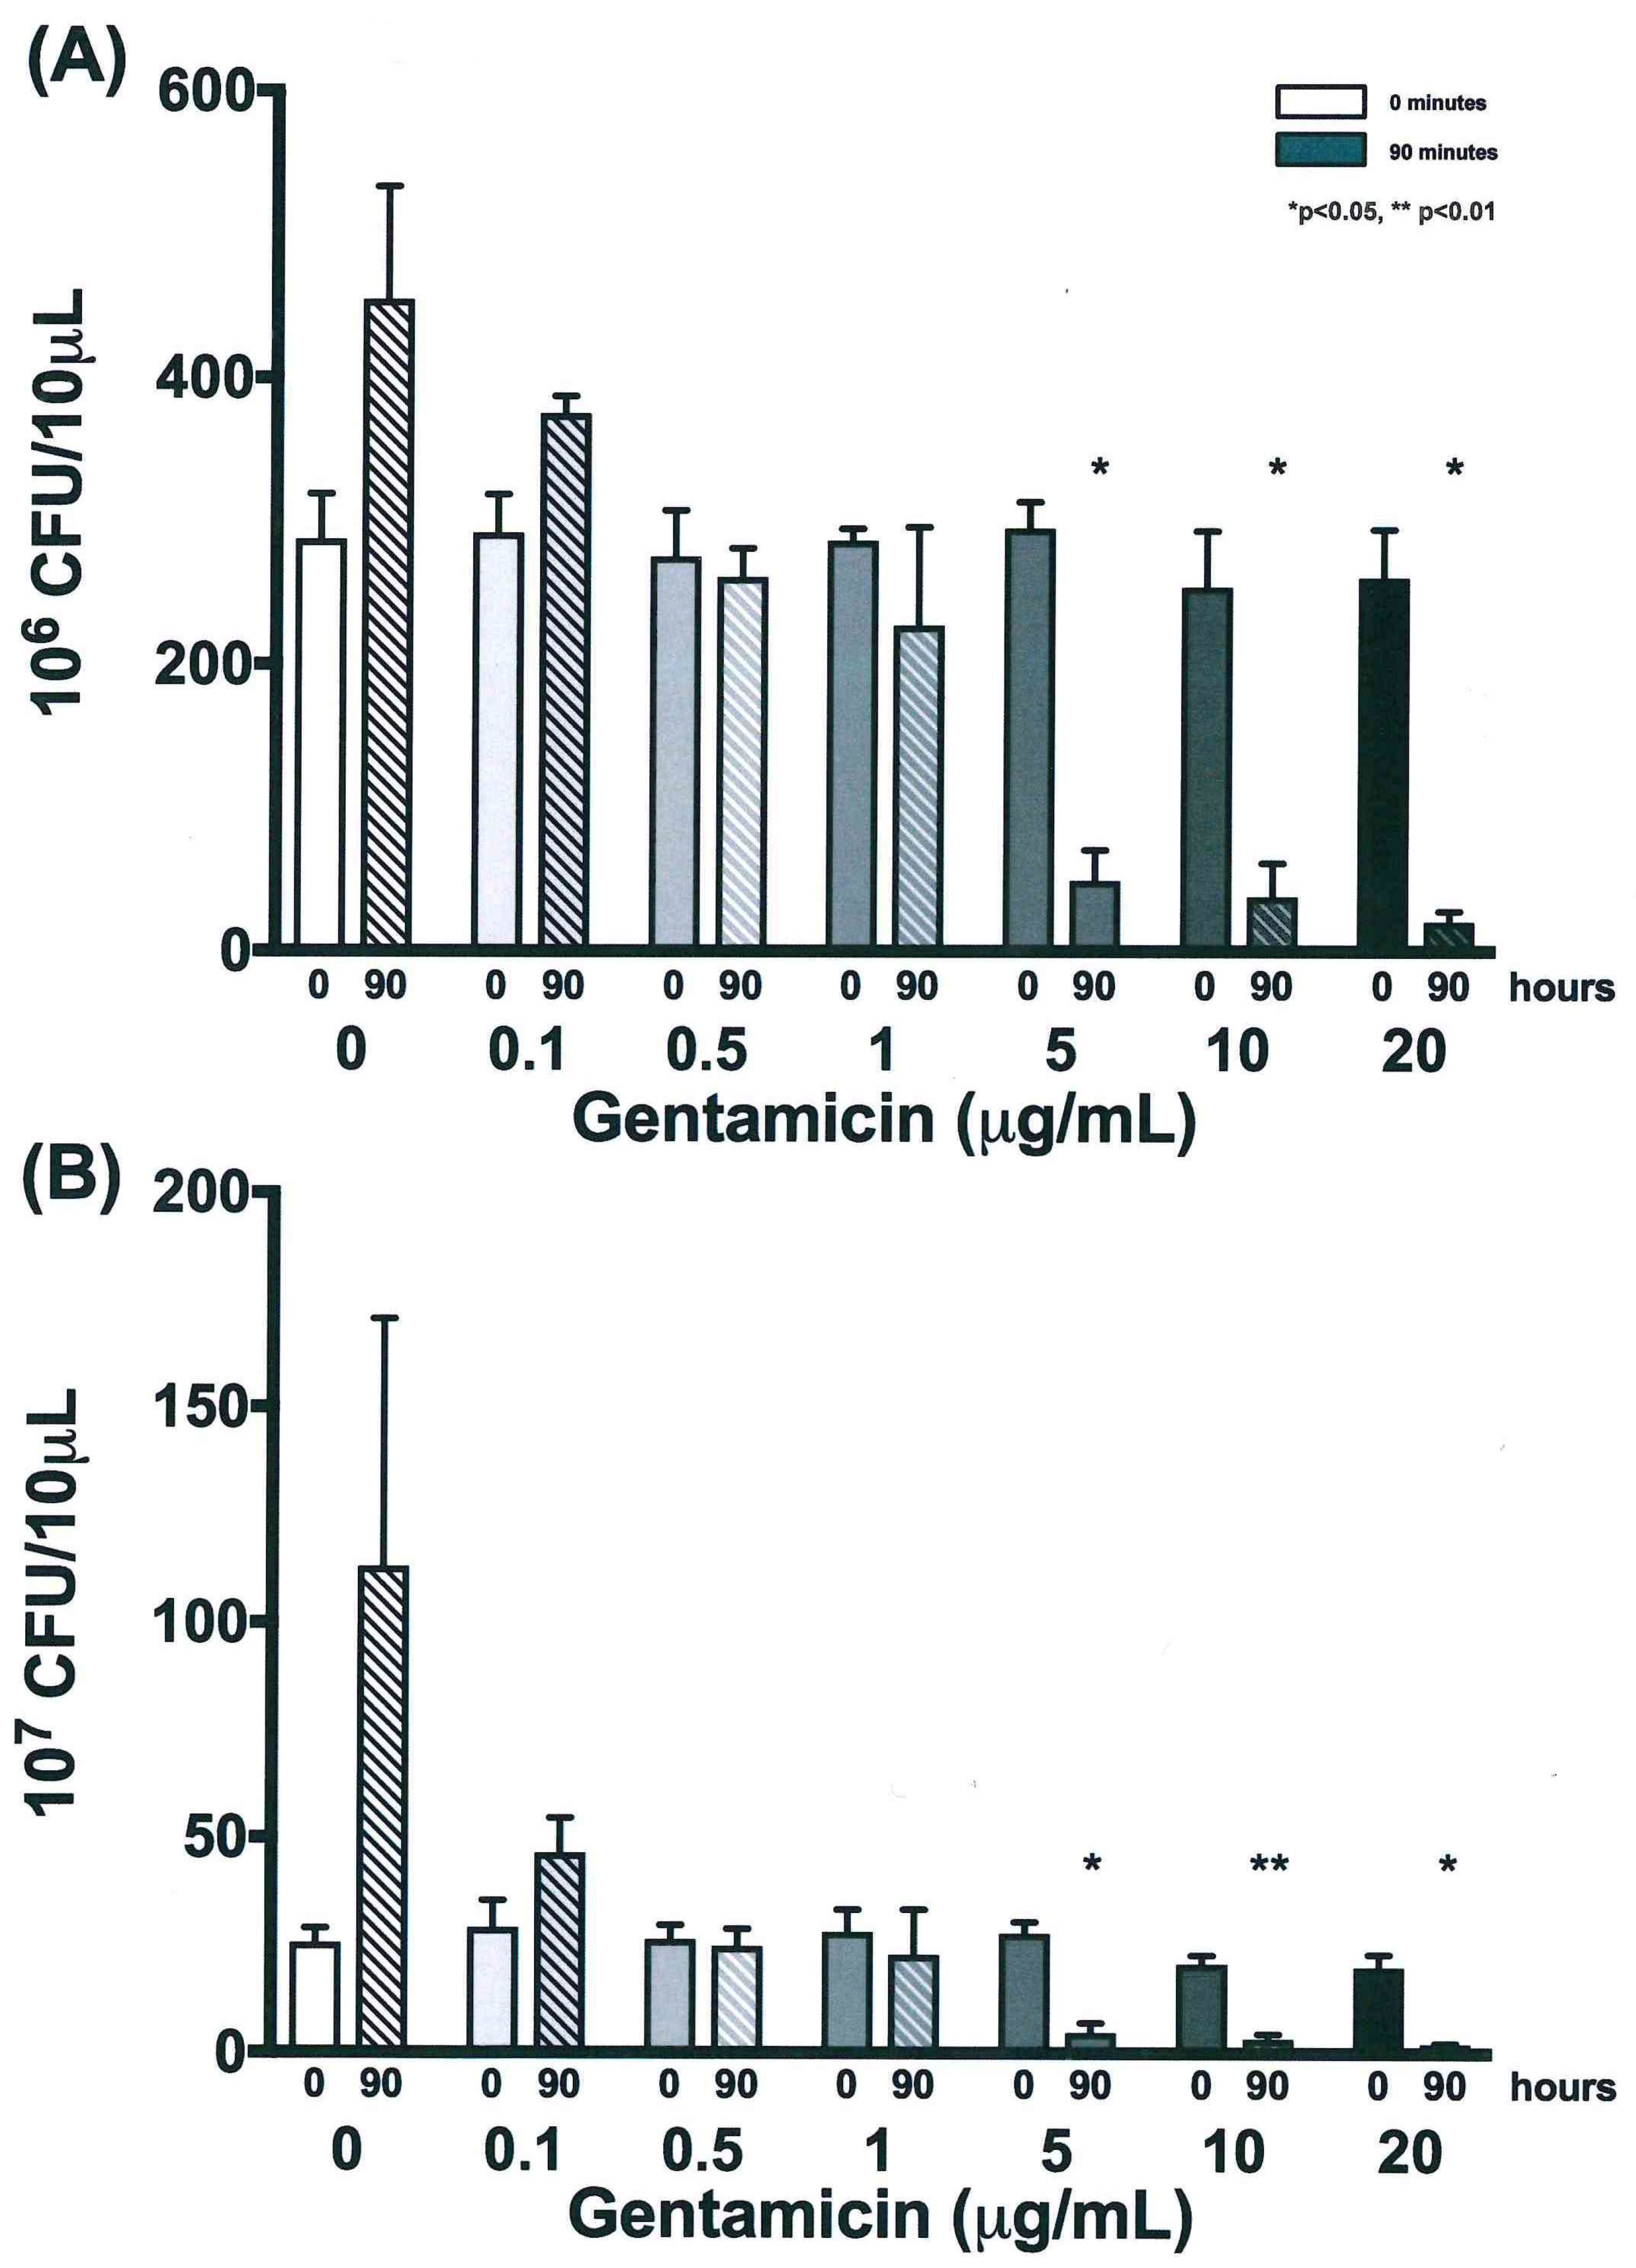
| 0 | 287.2 | 31.8 | 291.7 | 27.0 | 275.0 | 32.4 | 286.0 | 8.5 | 294.5 | 18.5 | 253.7 | 39.3 | 260.0 | 33.8 |
| 18 | 435.8 | 111.1 | 369.8 | 112.9 | 371.2 | 113.0 | 291.2 | 26.3 | 216.7 | 70.2 | 186.2 | 80.4 | 150.7 | 64.8 |
| 42 | 500.0 | 0.0 | 443.2 | 98.4 | 439.2 | 105.4 | 270.3 | 24.5 | 88.5 | 25.1 | 65.3 | 35.5 | 53.5 | 19.3 |
| 66 | 500.0 | 0.0 | 398.8 | 88.9 | 316.2 | 31.8 | 250.7 | 46.0 | 60.8 | 23.8 | 37.3 | 16.2 | 29.7 | 8.1 |
| 90 | 454.5 | 78.8 | 374.8 | 12.1 | 260.8 | 20.3 | 227.0 | 68.8 | 49.2 | 21.4 | 38.0 | 23.4 | 20.7 | 7.3 |
| Time (h) | 0 µg/mL | 0.1 µg/mL | 0.5 µg/mL | 1 µg/mL | 5 µg/mL | 10 µg/mL | 20 µg/mL | |||||||
|---|---|---|---|---|---|---|---|---|---|---|---|---|---|---|
| Mean | SD | Mean | SD | Mean | SD | Mean | SD | Mean | SD | Mean | SD | Mean | SD | |
| 0 | 25.5 | 3.5 | 29.2 | 6.3 | 26.3 | 3.4 | 28.2 | 5.3 | 27.8 | 2.8 | 20.8 | 2.0 | 20.0 | 3.0 |
| 18 | 87.7 | 78.8 | 36.5 | 7.9 | 31.0 | 3.0 | 36.7 | 9.8 | 19.3 | 6.9 | 15.8 | 10.6 | 13.3 | 5.0 |
| 42 | 68.7 | 8.7 | 46.5 | 20.0 | 39.7 | 7.3 | 31.2 | 10.7 | 9.7 | 3.3 | 5.7 | 1.6 | 6.2 | 2.8 |
| 66 | 97.0 | 28.8 | 33.5 | 5.2 | 31.7 | 6.3 | 24.2 | 4.5 | 6.3 | 1.4 | 3.5 | 1.3 | 3.0 | 1.0 |
| 90 | 113.0 | 57.7 | 46.5 | 8.2 | 24.8 | 4.0 | 22.8 | 10.6 | 4.8 | 2.3 | 3.3 | 1.3 | 2.2 | 0.3 |
© 2019 by the authors. Licensee MDPI, Basel, Switzerland. This article is an open access article distributed under the terms and conditions of the Creative Commons Attribution (CC BY) license (http://creativecommons.org/licenses/by/4.0/).
Share and Cite
Auster, L.; Sutton, M.; Gwin, M.C.; Nitkin, C.; Bonfield, T.L. Optimization of In Vitro Mycobacterium avium and Mycobacterium intracellulare Growth Assays for Therapeutic Development. Microorganisms 2019, 7, 42. https://doi.org/10.3390/microorganisms7020042
Auster L, Sutton M, Gwin MC, Nitkin C, Bonfield TL. Optimization of In Vitro Mycobacterium avium and Mycobacterium intracellulare Growth Assays for Therapeutic Development. Microorganisms. 2019; 7(2):42. https://doi.org/10.3390/microorganisms7020042
Chicago/Turabian StyleAuster, Lauren, Morgan Sutton, Mary Chandler Gwin, Christopher Nitkin, and Tracey L. Bonfield. 2019. "Optimization of In Vitro Mycobacterium avium and Mycobacterium intracellulare Growth Assays for Therapeutic Development" Microorganisms 7, no. 2: 42. https://doi.org/10.3390/microorganisms7020042
APA StyleAuster, L., Sutton, M., Gwin, M. C., Nitkin, C., & Bonfield, T. L. (2019). Optimization of In Vitro Mycobacterium avium and Mycobacterium intracellulare Growth Assays for Therapeutic Development. Microorganisms, 7(2), 42. https://doi.org/10.3390/microorganisms7020042