Abstract
Shiga toxin-producing Escherichia coli (STEC) are diverse bacteria, with seven serogroups (O26, O45, O103, O111, O121, O145, O157; “Top 7”) of interest due to their predominance in human disease. Confirmation of STEC relies on a combination of culturing, immunological and molecular assays, but no single gold standard for identification exists. In this study, we compared analysis of STEC between three independent laboratories (LAB) using different methodologies. In LAB A, colonies of Top 7 were picked after serogroup-specific immunomagnetic separation of feces from western-Canadian slaughter cattle. A fraction of each colony was tested by PCR (stx1, stx2, eae, O group), and Top 7 isolates were saved as glycerol stocks (n = 689). In LAB B, a subsample of isolates (n = 171) were evaluated for stx1 and stx2 using different primer sets. For this, approximately half of the PCR were performed using original DNA template provided by LAB A and half using DNA extracted from sub-cultured isolates. All Top 7 isolates were sub-cultured by LAB A and shipped to LAB C for traditional serotyping (TS) to determine O and H groups, with PCR-confirmation of virulence genes using a third set of primers. By TS, 76% of O groups (525/689) matched PCR-determined O groups. Lowest proportions (p < 0.05) of O group matches between PCR and TS (62.6% and 69.8%) occurred for O26 and O45 serogroups, respectively. PCR-detection of stx differed most between LAB A and LAB C. Excluding isolates where O groups by PCR and TS did not match, detection of stx1 was most consistent (p < 0.01) for O111 and O157:H7/NM. In contrast, for O45 and O103, stx1 was detected in >65% of isolates by LAB A and <5% by LAB C. Stx2 was only detected by LAB C in isolates of serogroups O121, O145, and O157:H7/NM. LAB B also detected stx2 in O26 and O157:H12/H29, while LAB A detected stx2 in all serogroups. Excluding O111 and O157:H7/NM, marked changes in stx detection were observed between initial isolation and sub-cultures of the same isolate. While multiple explanations exist for discordant O-typing between PCR and TS and for differences in stx detection across labs, these data suggest that assays for STEC classification may require re-evaluation and/or standardization.
1. Introduction
Among zoonotic pathogens, Shiga toxin-producing Escherichia coli (STEC) are a diverse group of bacteria, with seven serogroups (O26, O45, O103, O111, O121, O145, O157) of particular interest due to their predominance in human disease [1]. Of these “Top 7”, serotype O157:H7/NM is the most characterized and can be detected in concentrations as low as 25 CFU/g by direct plating on selective media after immunomagnetic separation (IMS) [2]. In contrast to O157, detection and enumeration of the other members of the Top 7 is less efficient, requiring molecular methods, as selective media for these other serogroups has yet to be developed [3,4]. Without the benefit of differential media, cross-reactivity in serogroup-specific IMS kits also increases the difficulty of isolating non-O157 STEC [5].
Numerous PCR-based assays have been used to confirm serogroup and virulence genes carried by STEC [6,7,8,9,10,11], although results can differ depending on assays used [12]. For decades, traditional serotyping (TS) based on O- and H-antigens and agglutination of antisera has been invaluable for distinguishing strains during outbreaks [13]. However, this process necessitates the generation of specific sera, is labor-intensive and is only performed by a few specialized laboratories. Even with the required resources, some strains of STEC are untypeable by this procedure [14]. Molecular serotyping of E. coli has shown promise [15], although isolates with up to 99.9% similarity of O antigen gene clusters may not type together by TS due to post-translational modification of proteins [16]. Diversity in wzx (O-antigen flippase) and wzy (O-antigen polymerase) gene clusters is the foundation for PCR-based identification of E. coli O-groups [9,10]. However, Shridhar et al. [17] demonstrated that a PCR assay targeting O104 wzx also detected serogroups O8 and O9, necessitating an additional assay to verify detection of O104. Classification of E. coli is continuously being refined, as illustrated by DeBroy et al. [16] advocating merging a number of E. coli O groups due to TS cross reactivity and homology between gene sequences, while others have proposed that there are likely undiscovered O groups [18].
Genetic plasticity of E. coli is another concern, influencing detection of STEC and complicating separation of STEC from non-pathogenic E. coli. Using PCR analyses, Joris et al. [19] reported a lack of detection of both stx1 and stx2 in STEC after sub-culturing, leading to possible underestimation of STEC-positive samples. Recently, Loftsdottir et al. [20] described a mobile insertion sequence element in stx2, which if present would interfere with PCR-based detection. In addition, the presence of stx-carrying bacteriophages that are not integrated into the bacterial genome may also interfere with PCR detection of Shiga toxins [21]. To determine the collective impact of factors that may influence characterization of STEC by O-group and stx gene detection, Top 7 isolates were sub-cultured and subjected to TS, pulsed-field gel electrophoresis and different methodologies of PCR in three laboratories.
2. Materials and Methods
2.1. PCR Confirmation of Serogroup and stx at Initial Isolation by Laboratory A (LAB A)
Isolates of Top 7 were collected from feces of western-Canadian cattle just prior to slaughter over a two-year period [22]. To collect these isolates, serogroup-specific IMS was performed using RapidChek Confirm STEC Kits (Romer Labs Technology Inc., Union, MO, USA) and incubating cultures on MacConkey agar at 37 °C for 18–24 h. Approximately half of a colony was then suspended in 40 µL 1 × TE buffer (10 mM Tris, 1 mM EDTA, pH 8.0). The suspension was heated to 95 °C for 5 min and used as DNA template for serogroup confirmation by PCR [10]. PCR conditions included 50 nM O121; 40 nM O103, O111, O145, and O157; 25 nM O26 and O45 primers; 1× QuantiFast Master Mix (Qiagen, Toronto, ON, Canada), 2 µL DNA template and nuclease-free water, all in a final volume of 25 µL. Thermocycling conditions included an activation step of 95 °C for 5 min followed by 45 cycles of 95 °C for 45 s and 66 °C for 60 s. The remainder of a colony confirmed positive by PCR was removed from the plate and sub-cultured at 37 °C overnight in tryptic soy broth (TSB) before storage in glycerol at −80 °C.
A loop of inoculum from glycerol stocks was grown overnight in 10 mL TSB at 37 °C before extraction of DNA using the NucleoSpin Tissue Kit (Machery-Nagel, Islington, ON, Canada). Shiga toxin (stx1, stx2) and intimin (eae) genes were detected using multiplex PCR, with the plasmid copy number regulating gene (repA) used as an internal control [10]. Reaction mixtures contained 20 nM of each primer, 1× QuantiFast Master Mix, nuclease-free water and 2 µL DNA template in a 25 µL total reaction volume that was subjected to the previously-described thermocycling conditions. The same methodology was also used to reconfirm Shiga toxin profiles for a subsample of isolates after two or more years of storage in glycerol stocks at −80 °C.
2.2. PCR Methodology Used for Detection of stx Genes by Laboratory B (LAB B)
Only isolates of O26, O103, O111, and O157 serogroups (n = 171) were evaluated by LAB B due to time and labor constraints. The original DNA template extracted using NucleoSpin Tissue kits by LAB A was used for approximately 50% of isolates from each serogroup, while for the remaining half, glycerol stocks were re-grown a second time and DNA was extracted using NucleoSpin kits. Both sources of DNA were used as insufficient original extracted DNA was available to complete all LAB B studies. Briefly, 1 µL of DNA template was added to 24 µL PCR mix containing 2× PyroMark Master Mix (Qiagen) and primers as described by Goji et al. [11]. PCR amplification was performed using a peqSTAR 96 Universal Gradient thermocycler (PeqLab, Erlangen, Germany), with the hotstart program starting at 95 °C for 15 min, 45 cycles at 94, 56 and 72 °C for 30 s each and final extension at 72 °C for 5 min.
2.3. Serotyping of Isolates and Detection of stx Genes by Laboratory C (LAB C)
Cells from glycerol stocks were grown a third time overnight in 10 mL TSB at 37 °C at LAB A before preparation of slants and shipment of isolates to LAB C, a national reference laboratory for STEC (Laboratory for Foodborne Zoonoses, Public Health Agency of Canada, Guelph, ON, Canada). Somatic (O) and flagellar (H) antigens were identified by accredited methods using reference antisera (SSI Diagnostica, Copenhagen, Denmark).
For detection of stx genes by PCR, bacteria were grown overnight at 37 °C in 1 mL Brain Heart Infusion Broth (BHI). A 6.25 µL sample of the overnight BHI culture was added to 50 μL of lysis buffer and incubated at 60 °C for one hour and then 97 °C for 15 min. From this DNA template, primer sets and conditions described by Lin et al. [7] were used to detect undifferentiated stx (stx1 and stx2) simultaneously in a singleplex PCR. Additionally, the DNA templates were used for the multiplex PCR assay of Paton and Paton [8] which also included an additional primer for detection of stx2f [12]. In all three laboratories, highly-experienced staff performed the PCR.
2.4. Pulsed-Field Gel Electrophoresis (PFGE)
A subsample (n = 200) of isolates subjected to TS and having a variety of Shiga toxin profiles were also sub-typed by PFGE using XbaI restriction according to the standard 1-d protocol [23]. Isolates were selected from serogroups O26 (n = 71), O103 (n = 62), O111 (n = 17) and O157 (n = 50) and were typed by PFGE using a CHEF DR II electrophoresis unit (Bio-Rad Laboratories, Mississauga, ON, Canada). Banding patterns were viewed with UV illumination and photographed using the Speedlight Platinum Gel Documentation System (Bio-Rad). Pulsed-field gel electrophoresis patterns were classified as unique or grouped in clusters with 90% or greater similarity as determined using Dice similarity coefficients, unweighted pair group methods arithmetic average algorithm, 1% position tolerance and 0.5% optimization (BioNumerics 7.6, Applied Maths NV, Sint-Martens-Latem, East Flanders, Belgium).
2.5. Comparing Consensus Sequences of PCR Primers and stx
Consensus between primers used (LAB A and LAB C) and stx2 were analyzed by comparing primer sequences to stx gene sequences deposited within the NCBI database. For this, PCR primers from LAB A [10] and one set of primers used by LAB C [7] were evaluated using R10 Geneious software (Biomatters Inc., Newark, NJ, USA). Genetic information for individual reference subtypes (stx2a-f) were selected based on data by Scheutz et al. [24]. Using the Basic Local Alignment Search Tool (BLASTn), reference strains were compared to the NCBI database. All sequences with a similarity of >98% and >1200 nucleotides in size including A and B toxin gene subunits were aligned to reference strains with the alignment tool within the Geneious program at cost matrix (65% similarity). From the NCBI nucleotide collection a total of 357, 30, 357, 356, 30, 15 and 14 data sets were selected for the 2a-2g subtypes, respectively. The stx2 primer sequences were tested and mapped versus aligned sequences.
2.6. Statistical Analyses
Correspondence between serogroup as determined by PCR and TS was compared using generalized linear mixed models (Proc Glimmix, SAS 9.3, SAS Institute Inc., Cary, NC, USA) with a binomial distribution and with O-group as a fixed effect. Model adjusted means (back-transformed to original scale) and 95% confidence intervals were reported, with p values < 0.05 deemed significant. To reduce discordance due to mixed cultures, frequency of agreement in stx1 and stx2 detection by serogroup was compared only for isolates where serogroup determined by PCR agreed with that determined by TS. In those analyses, O group and laboratory were fixed effects and a binomial distribution was used comparing Shiga toxin gene detection (always vs. intermittently detected). In instances where TS O-typing showed consistent (3 or more occasions) mismatching with PCR-based O-typing, the serogroup PCR primers were compared against TS-identified serogroup genes available in NCBI, using Geneious R10.
3. Results
3.1. O Group as Determined by PCR and TS
A total of 689 isolates were subjected to TS (Table 1). O group determined by PCR and TS showed less agreement (p < 0.05) for O26 and O45 as compared to other serogroups. Diversity within PCR-determined O26 and O45 was pronounced, with TS classifying each of these into more than 20 other O groups which were typed into more than 15 H groups. In contrast, 95% of O111 isolates were O111 by both PCR and TS, with the remainder not classifiable to an O group by TS (O?). Although the majority of O group mismatches between PCR and TS resulted in serotypes with only one or two isolates, 11.2% of PCR-determined O45 isolates were attributed to serotype O110:H31, while 2.8% of O157 isolates were attributed to O71:H32. However, analyses comparing sequences of wzx and wzy genes for O110 and O71 within the NCBI database to Conrad et al. [10]

Table 1.
Differences between PCR and traditional serotyping (TS) for O group determination among serogroups.
PCR primers used found < 50% sequence identity, although neither O110 nor O71 are well-characterized within this database and non-specific binding could have occurred outside of the wzx or wzy genes.
3.2. Serotypes of Isolates Where PCR O Group Agreed with TS
For isolates where O group determined by PCR and TS agreed (n = 525), numbers of serotypes varied widely by serogroup (Table 2). Only a few serotypes were identified for O111 (n = 2), O145 (n = 3) or O157 (n = 4). In contrast, numerous serotypes were present for serogroups O103 (n = 15) and O45 (n = 14), with O26 (n = 6) and O121 (n = 9) being intermediate in this regard. Most prevalent serotypes per serogroup were: O26: non-motile (NM); O45:H4; O103:H2, O103:H21, O103:NM; O111:H8, O111:NM; O121:H7, O121:H19, O121:H46; O145:NM and O157:H7. A total of 45 isolates could not be O-typed by TS, the majority of which (n = 40) had an unidentifiable O group (O?), with the remaining untypeable isolates (n = 5) classed as O rough (OR).
Table 2.
Numbers of Top 7 isolates of each serotype including only those where PCR and traditional serotyping determined the same O group (n = 525).
3.3. Comparison of PFGE and TS for O26, O103, O111 and O157
A subset of isolates (n = 200) were subjected to both PFGE and TS and included 37 isolates where O group as determined by PCR and TS did not match and 12 isolates that were not typeable by TS (Table 3). Clustering of isolates which exhibited a minimum of 90% similarity based on PFGE analyses varied by serogroup, ranging from 12 clusters for O26 and O103 to 4 for O111. For isolates where serogroups determined by PCR and TS were in agreement (n = 163), those of O26 did not exhibit a high degree of similarity using PFGE, as 40.4% were considered unique. Although 37.9% of O103 were also classified as unique isolates by PFGE, 4 of the O103 serotypes evaluated consisted of only single isolates while isolates of the more common serotypes O103:H8 and O103:H2 were generally part of serotype-specific clusters. The majority of O157:NM and O157:H7 isolates were also part of serotype-specific clusters. Isolates of O157:H12 and O157:H29 were classified by PFGE as unique, although only two isolates of each of these serotypes were evaluated. Clustering of O111 showed an almost perfect correspondence with serotype, including O111:NM where 5/6 were present in clusters exclusive to O111:NM. In contrast, <50% of NM isolates for O26 and O103 were present in serotype-specific clusters.
Table 3.
Correspondence between traditional serotyping (TS) and pulsed field gel electrophoresis of isolates of O26 (n = 71), O103 (n = 62), O111 (n = 17), and O157 (n = 50) initially serogrouped by PCR.
3.4. Inconsistent Detection of stx1 and stx2
Comparing only isolates where O group agreed by PCR and TS, differences were also noted in the consistency whereby stx1 and stx2 were detected by the three laboratories within specific serogoups (Table 4). Overall, detection of stx varied most between LAB A and LAB C, with results for LAB B intermediate between the two extremes. Across labs, stx1 was most consistently identified (p < 0.01) in O111 and O157:H7/NM isolates. In contrast, 80.6% of O45 isolates were positive for stx1 at initial isolation in LAB A, while no stx1 was detected in O45 by LAB C. Stx2 was detected at LAB C only in isolates of O145, O121 and O157:H7/NM, while at LAB B stx2 was also detected in isolates of O26 and O157:H12/H29. In contrast to other laboratories, stx2 was detected by LAB A in isolates from all serogroups. Comparing labs, classification of O103 isolates as STEC varied by more than 25 fold from LAB A (69.8%) to LAB C (2.8%), with LAB B being intermediate (41.2%). Serotype of O157 profoundly affected classification as STEC, with 93.2% of O157:H12/H29 STEC at initial isolation by LAB A compared to 0% at LAB C. In contrast, proportion of O157:H7/NM isolates which were STEC varied by <10% across laboratories, ranging from 98.8 (LAB B) to 91.4% (LAB C).
Table 4.
Detection of virulence genes at initial isolation (LAB A), LAB B and LAB C.
Only a few specific serotypes were classified as STEC by LAB A and LAB C (Table 4). In contrast to other serogroups with two or fewer STEC serotypes detected at these laboratories, O121 had four different serotypes that were consistently STEC, although two were uncommon and represented by only one or two isolates. Similarly, serotypes O103:H11 and O103:H25, while STEC at LAB A and LAB C were represented by three or less isolates. Serotypes with at least eight isolates which were STEC at LAB A and LAB C included O26:H11, O111:H8, O111:NM, O121:H7, O121:H19, O145:NM, O157:H7 and O157:NM. Additional serotypes were STEC at both LAB A and LAB B included O26:H9, O26:H18, O26:H32, O26:H46, O26:NM, O103:H2, O103:H8, O103:H19, O103:H21, O103:H38, O103:NM, O157:H12, and O157:H29, although some of these classifications were based on less than three isolates.
Comparison of Conrad et al. [10] (LAB A) and Lin et al. [7] (LAB C) primers versus the consensus sequences of multiple stx2 reference subtypes (Figure 1), revealed mismatches between primers and consensus sequences. Therefore, LAB A was unlikely to detect stx2b or stx2f, which was confirmed by Conrad et al. [10] primers failing to amplify PCR amplicons from DNA of reference strains for these stx2 subtypes. Even with one or two mismatches in forward and/or reverse primers, Conrad et al. [10] primers yielded positive amplification of stx2 subtypes 2a, 2c, 2d, 2e, and 2g. However, even if primers matched a number of subtype sequences, hyper-mutable regions with <30% sequence identity were located within targets for the majority of stx2 subtypes in both of the Lin et al. [7] and Conrad et al. [10] primers.
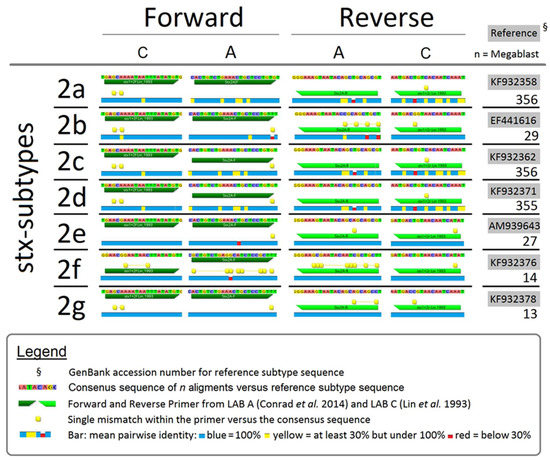
Figure 1.
Comparison of PCR primers used by LAB A, Conrad et al. [10] and LAB C, Lin et al. [7] for consensus with sequences of stx2 subtypes.
Impact of serotype on detection of stx was further assessed by repeating PCR analyses for 2 key STEC serotypes at LAB A using the same PCR methodology as in the initial isolation, but after an interval of up to four-year storage of isolates in glycerol at −80 °C. Isolates of O121:H19 (n = 12) remained stable for stx2 between the initial isolation, LAB C analyses and for the repeat PCR analysis by LAB A (Table 5). However, multiple permutations were noted for stx1 detection, including changes from positive to negative and vice versa even if only analyses by LAB A were considered. In contrast to O121:H19 that showed stability of stx2, isolates of O111:H8/NM (n = 6) showed stability of stx1 over time and among all three laboratories, while stx2, if present, was only detected in the initial isolation (Table 6).
Table 5.
Changes in carriage of stx1 and consistent detection of stx2 in twelve isolates of O121:H19 from PCR analysis by two labs.
Table 6.
Changes in carriage of stx2 and consistent detection of stx1 in six O111:H8/NM isolates from PCR analyses by three laboratories.
4. Discussion
4.1. Determination of O Group by PCR and TS
As isolates were picked directly from a plate after IMS without further purification, the presence of mixed cultures most likely contributed to different O-typing by PCR and TS. Cross-reactivity of serogroup-specific IMS kits for non-target serogroups has also been identified as a factor that can lead to variability in serogroup identification [4,5]. Another potential explanation would be cross-reactivity of PCR primers although the instances in the present study where the same mismatch occurred three or more times (O110:H31 for O45 and O71:H32 for O157) were not due to sequence identity between primers and wzx or wzy genes for these serogroups. Of 184 known E. coli O serogroups, Iguchi et al. [25] found that 145 had unique O-antigen gene clusters, 37 shared identical or very similar O antigen genes, while serogroups O14 and O57 did not contain O antigen genes at typical loci. More importantly, wzx and wzy genes for Top 7 are thought to have unique sequences [16,25], reducing the likelihood of cross-reactivity among PCR primers used in the present study.
Discrepancies between molecular methods and TS have been previously reported [26] as has cross-reactivity in antibodies used in TS [14,27,28]. However, heightened discrepancies between TS and PCR for O26 and O45 are puzzling when compared to other serogroups. A lack of selectivity by antibodies used in IMS is more prevalent for O111 compared to other Top 7 [5,9], but in the present study, O groups determined by PCR and TS were in agreement 95% of the time for O111. Strains of O26:H11 have been shown to undergo frequent rearrangements in their chromosome, virulence plasmids and pathogenicity islands [29]. Perhaps these traits are serogroup-wide and if so, could potentially have contributed to the inconsistencies in identification in the present study. Compared to O26, O45 has been linked to fewer cases of human disease [1,29], and the extent of plasticity of the O45 genome has been less studied.
4.2. Serotypes of Top 7 Isolated from Cattle Feces
Although the population of E. coli in the gastrointestinal tract of cattle is known to be diverse [22,30], relatively few STEC serotypes have been diagnosed as responsible for the majority of human disease, including O26:H11, O45:H2 O103:H2, O111:H8, O121:H19, O145:H26, O157:H7 and their non-motile forms [29]. Bosilevac and Koohmaraie [1] suggested that O103:H11, O103:H25 and O121:H7 should also be included in this list. Of this larger group, the only serotypes not detected in western Canadian cattle feces in the present study were O45:H2 and O145:H26, possibly due to geographical origin of isolates impacting local genetic variation [31]. O103 is among the most common serogroups isolated from cattle feces in North America [22,32] and along with O45 showed the highest diversity in serotypes. Diversity in O103 H antigens in isolates from livestock and human infections has also been documented [33,34].
Some studies of serotype diversity have not included O45 [35], likely due to an overall lower incidence of human disease associated with this serogroup compared to other members of the Top 7. Less study of O45 likely explains why one of the previously unreported E. coli serotypes identified in our study was from this serogroup (O45:H34). Other previously unreported serotypes included O103:H52 and O121:H32. Detection of O121:H32 would only be possible by TS due to the cross-reactivity in PCR analyses between O121 fliCH19 and E. coli fliCH32 isolates noted by Beutin et al. [36] which may lead to the misidentification of O121:H32 as O121:H19.
Only two serotypes of O111 were identified: O111:H8 and O111:NM. Molecular serotyping or whole genome sequencing would be necessary to determine if O111:NM strains were genetically O111:H8 that had one or more non-functional genes associated with motility, although other serotypes such as O111:H2 and O111:H10 have been associated with cattle and humans [35]. Compared to other serogroups, a lower number of O111 isolates were collected and the lack of diversity may be due to low numbers of isolates obtained. This may reflect difficulties in isolation of more diverse serotypes of O111, although challenges in isolation of Top 7 as yet have only been described based on serogroup [4,22]. Two serogroups showing little diversity in serotype (O145 and O157) are thought to have shared a common enteropathogenic E. coli ancestor before evolving further [37], although Eichhorn et al. [35] proposed that typing H antigens more accurately describes the phylogeny of STEC than does O group characterization. Accordingly, Iguchi et al. [25] suggested that STEC strains with the same H antigen such as O26:H11 and O111:H11 may be more closely related than strains with a common O-antigen. In the present study, the most prevalent H antigens found were H7 (O103, O121, O157); H8 (O45, O103, O111); H11 (O26, O45, O103); H14 (O45, O103, O121) and H19 (O45, O103 and O121).
4.3. Impacts of Serogroup and Serotype on PFGE Analyses
From PFGE analyses, serotypes associated with severe human disease [O103:H2, O111:NM, O111:H8, O157:NM and O157:H7,29] showed heightened genetic similarity and were more likely to be grouped within a serotype-specific cluster than were serotypes less-associated with human disease. The exception was O26:H11, which showed little genetic homogeneity, possibly due to the frequent genetic rearrangements that have been noted to occur in isolates of this serotype [38]. Increased genetic diversity among NM isolates would be expected as the majority of these strains are PCR-positive for flagellum genes but cannot be H-typed using motility test media [39]. Accordingly, most NM strains of O26 and O103 did not cluster with other NM isolates of their serogroup. In contrast to O26 and O103, NM strains of O111 and O157 were generally in serotype-specific clusters. Possibly, O157:NM or O111:NM strains could share a common mutation affecting flagellum assembly or motility, or carry a genetically-similar cryptic flagellum gene [40], which would result in O157:NM and O111:NM-specific clusters.
The most striking differences among serogroups revealed by PFGE analyses were the distinct characteristics of O26 as compared to O103, O111 and O157. In the latter three serogroups, numbers of clusters increased in proportion with the numbers of isolates evaluated and serotype-specific clusters were present. In contrast, serotypes of O26 isolates showed little relation to clusters and numbers of clusters and unique isolates were equal to that of O103, even though 40% fewer O26 isolates were included in these analyses. Accordingly, additional study is clearly warranted of genetic rearrangements of serotypes of O26 other than O26:H11.
4.4. Inconsistent Detection of stx1 and stx2
Although detection of Shiga toxins was evaluated only for isolates where O group by PCR matched that determined by TS, mixed cultures would have been responsible for some of the inconsistent detection of Shiga toxin genes by PCR noted in the present study. If cultures were mixed, proportions of different serogroups of E. coli have been shown to change markedly during incubation [41], possibly affecting Shiga toxin detection when a single colony is later picked for evaluation. However, factors in addition to mixed cultures would have likely contributed to inconsistent detection of stx in the present study.
A possible reason for differences in stx detection rates between laboratories would be the primers used for PCR analysis. Comparing primer targets used by LAB A and LAB C against stx2 subtype sequences within the NCBI database showed that mismatches existed for both primer sets. It was previously shown that the primers used by LAB A [10] were unable to detect stx2b or stx2f due to multiple mismatches between the primers and the stx2 consensus sequences (Figure 1). Primer sets used by LAB A and LAB C both showed strengths and weaknesses, with mismatches also varying according to hyper-mutable regions within stx2 subtypes. In contrast, a database analysis revealed that stx1 coding sequences are highly conserved and as a result, the different stx1 primer systems used by LAB A and LAB C consistently detected target genes.
Differences in detection of stx based on PCR primers were comprehensively evaluated by Ziebell et al. [12] who concluded that nucleotide sequence variations in primer binding sites were frequently responsible for failure to detect stx by the protocols evaluated. However, even if primer sequences perfectly match targets, PCR amplifications are influenced by varying efficiencies of the different stages (denaturing, annealing and elongation) of every cycle [42], which were not compared in the present study. Due to rapid evolution of STEC [43], additional studies are required to re-evaluate PCR primer binding sites to ensure continued effective surveillance of foodborne pathogens. Even when the same PCR primers and DNA template sources are employed, variation in stx1 and stx2 detection has occurred across laboratories with this variation attributed to differences in reagents and thermocyclers [24], highlighting the potential difficulty in comparing results for STEC detection across laboratories.
Even with the possibility of mixed cultures and effects of PCR methodology, other factors are necessary to possibly explain differences in identification of serogroup O45 isolates, where 80.6% of were identified as STEC upon initial isolation, whereas none were identified as STEC when serotyped. Shiga toxin genes are located in bacteriophages (phages) integrated into the host genome or present as free phages in the environment [44,45,46]. For initial detection of STEC by molecular methods, Quiros et al. [21] recommended a filtration step which eliminated more than 99% of free phage particles and increased the efficiency and reliability of PCR for STEC detection. As a filtration step was not performed in the present study, the presence of free stx phage [47] may have resulted in overestimation of STEC at the initial isolation. However, even when stx-phages are integrated into the bacterial genome, they are considered mobile genetic elements [44] and the possibility of treating an established STEC infection by inducing virulence gene deletion in the colonizing bacteria has been suggested [43].
A total of 7% of O45 isolates at LAB C were positive for eae and hylA and were considered atypical enteropathogenic E. coli. Enteropathogenic strains are also a public health concern [48] but would be overlooked by protocols which rely on detection of stx as the initial screening step. Due to potential for integration and loss of stx phages as well as genetic and phenotypic similarities among STEC O157:NM and Shiga-toxin negative enteropathogenic strains, Ferdous et al. [49] questioned the reliability of classifying E. coli based on detection of stx and eae. Genetic changes occur rapidly in E. coli after initial environmental isolation during multiple rounds of cultivation in nutrient-rich media, a process termed domestication [50]. Accordingly, Joris et al. [19] documented the loss of stx1 and stx2 as determined by PCR in isolates of O26, O103 and O157 after the first sub-culture and found that loss of these toxin genes was rare in O157 as compared to non-O157 strains. In the present study, we found minimal changes in detection of stx in isolates of O157:H7/NM. In contrast, 93.2% of O157:H12/H29 were STEC at initial isolation, 42.9% were STEC at LAB B and 0% STEC at LAB C, although it is important to note that Shiga toxins have not previously been reported in O157:H12 or O157:H29 [51,52]. As these latter two serotypes are less common than H7/NM, it is possible that the Joris et al. [19] study group of 20 isolates consisted of only H7/NM. A greater stability of stx2 in isolates of O157:H7 as compared to O157:NM has been previously documented [53], an outcome that might be due to differences in the integration sites for stx2 phages [45].
Negative changes in stx detection noted in the present study were considerably higher than the maximum 20% loss reported by Joris et al. [19] likely a reflection of differing PCR methodologies used by the three laboratories in the current study. Joris et al. [19] used the method of Possé et al. [54] for initial bacterial isolation which included novobiocin, vancomycin, rifampicin, bile salts and potassium tellurite in the media. Sub-therapeutic doses of a variety of antibiotics have been shown to induce a lytic cycle in Stx-phages [44,55] and care was taken by all laboratories in the present study to avoid use of antibiotics or substances like potassium tellurite in media, a practice that can bias isolation of non-O157 E. coli [56]. As antibiotic use in media did not influence stx detection by the three laboratories, the use of the same DNA template for approximately 50% of the isolates evaluated by LAB B likely increased the similarity of PCR results between LAB B and LAB A.
For isolates of O111, detection of stx1 was stable across laboratories and not influenced by time. The stx1 phage of O111 is thought to be cryptic due to a lack of integrase and exicisionase genes [57], although Asadulghani et al. [58] determined that prophages with multiple genetic defects could excise themselves, replicate and be released from strains of O157. The stability of stx1 in O111 isolates was in contrast to stx2 which was only detected at initial isolation and was not detected in repeat PCR analysis using sub-cultured isolates by LAB A. Deletion of stx2 phage from strains of O111:H8 has been observed in patients during an outbreak in Japan and during in vitro incubations of these isolates [59]. These authors speculated on a highly dynamic system that can result in both the acquisition and loss of stx2 phages. While results of the present study did not demonstrate acquisition of stx2 in O111, it did occur with stx1 in O121:H19 (Table 5).
The stability of stx2 in isolates of O121:H19 in the present study as compared to the loss or acquisition of stx1 on repeat PCR analyses is interesting. Changing stx1 detection may point to differences in insertion sites for the stx1 and stx2 phages of O121:H19 or may be related to an uncharacterized insertion sequence element in stx1 as previously documented [20] or proposed for stx2 [24]. In Canada, O121:H19 has been recently implicated in human disease outbreaks due to contaminated flour [60] and it is also likely not coincidental that serotypes of E. coli frequently implicated in human disease are those that show stability in stx1 and/or stx2 across laboratories and over time. O121 also showed the most diversity in STEC serotypes (n = 4) detected upon initial isolation at LAB A and at LAB C. To our knowledge, one of these serotypes (O121:H32), has not been previously reported, and may be an emerging pathogen as the majority of serotypes in the present study with stable stx have been linked to human disease.
5. Conclusions
The detection of STEC and pathogenic microorganisms in general represents an ongoing global challenge to ensure food safety along the farm-to-fork continuum as well as in human medicine. Pathogen surveillance is based on molecular and microbiological methodologies, but as STEC genomes continue to evolve, surveillance methods require adaptation and refinement. In addition, some microbial adaptations may coincide with weaknesses in existing diagnostic tools and prevent the identification of pathogens and/or virulence factors. Using detection of stx in cultures or isolates as the initial screening would ignore atypical enteropathogenic E. coli and also due to loss or gain of stx phages may underestimate risks to human health. In the absence of uniform assays, monitoring and characterizing STEC can vary substantially across laboratories as demonstrated in the present study. Combined, we showed that multiple factors relating to lab diagnostics and bacterial evolution could possibly affect characterization of STEC (Figure 2). New or improved methods that can be routinely and rapidly applied across multiple laboratories are required for conclusive and consistent identification of pathogenic E. coli. With continually reducing costs and increasing speed, next-generation sequencing may at some time in the future meet at least some of these needs.
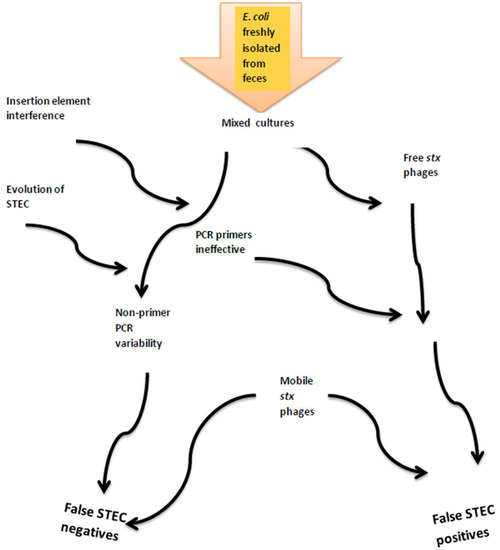
Figure 2.
Factors contributing to cumulative errors in detection of Shiga toxin genes and classification of isolates as STEC.
Author Contributions
Conceptualization, K.S. and T.R.; Methodology, T.R. and T.W.A.; Investigation, R.T. and J.H.; Resources, T.A.M. and K.S.; Writing-Original Draft Preparation, K.S.; Writing-Review & Editing, K.S., T.R., T.W.A. and T.A.M.; Project Administration, K.S.; Funding Acquisition, K.S. and T.R.
Funding
This research was funded by Alberta Innovates BioSolutions and Alberta Livestock and Meat Agency, Grant No. [FSC-12–005].
Acknowledgments
Many thanks to the technical team of Susanne Trapp, Yidong Graham, Homayoun Zahiroddini, Jenilee Peters and Noriko Goji. Thanks also to the many helpful truck drivers and staff at the two slaughter plants for collection of the original fecal samples. This study would have not been possible without your cooperation.
Conflicts of Interest
The authors declare no conflict of interest. The funders had no role in the design of the study; in the collection, analyses, or interpretation of data; in the writing of the manuscript, and in the decision to publish the results.
References
- Bosilevac, J.M.; Koohmaraie, M. Prevalence and characterization of non-O157 Shiga toxin-producing Escherichia coli isolates from commercial ground beef in the United States. Appl. Environ. Microbiol. 2011, 77, 2103–2112. [Google Scholar] [CrossRef] [PubMed]
- Sanderson, M.W.; Gay, J.M.; Hancock, D.D.; Gay, C.C.; Fox, L.K.; Besser, T.E. Sensitivity of bacteriologic culture for detection of Escherichia coli O157:H7 in bovine feces. J. Clin. Microbiol. 1995, 3, 2616–2619. [Google Scholar]
- Cooley, M.B.; Jay-Russell, M.; Atwill, E.R.; Carychao, D.; Nguyen, K.; Quinones, B.; Patel, R.; Walker, S.; Swimley, M.; Pierre-Jerome, E.; et al. Development of a robust method for isolation of Shiga toxin-positive Escherichia coli (STEC) from fecal, plant, soil and water samples from a leafy greens production region in California. PLoS ONE 2013, 8, e65716. [Google Scholar] [CrossRef] [PubMed]
- Noll, L.W.; Shridhar, P.B.; Dewsbury, D.M.; Shi, X.; Cernicchiaro, N.; Renter, D.G.; Nagaraja, T.G. A Comparison of Culture- and PCR-Based Methods to Detect Six Major Non-O157 Serogroups of Shiga Toxin-Producing Escherichia coli in Cattle Feces. PLoS ONE 2015, 10, e0135446. [Google Scholar] [CrossRef] [PubMed]
- Hallewell, J.; Alexander, T.; Reuter, T.; Stanford, K. Limitations of immunomagnetic separation for detection of the top seven serogroups of Shiga-toxin producing Escherichia coli. J. Food Prot. 2017, 80, 598–603. [Google Scholar] [CrossRef] [PubMed]
- Gannon, V.P.J.; King, R.K.; Kim, J.Y.; Golsteyn Thomas, E.J. Rapid and sensitive method for detection of Shiga-like toxin-producing Escherichia coli in ground beef using the polymerase chain reaction. Appl. Environ. Microbiol. 1992, 58, 3809–3815. [Google Scholar] [PubMed]
- Lin, Z.; Kurazono, H.; Yamasaki, S.; Takeda, Y. Detection of various variant verotoxin genes in Escherichia coli by polymerase chain reaction. Microbiol. Immunol. 1993, 37, 543–548. [Google Scholar] [CrossRef] [PubMed]
- Paton, A.W.; Paton, J.C. Detection and characterization of Shiga toxigenic Escherichia coli by using Multiplex PCR assays for stx1, stx2, eaeA, enterohemorrhagic E. coli hylA, rfbO111, and rfbO157. J. Clin. Microbiol. 1998, 36, 598–602. [Google Scholar]
- Bai, J.; Paddock, Z.D.; Shi, X.; Li, S.; An, B.; Nagaraja, T.G. Applicability of a multiplex PCR to detect the seven major Shiga toxin-producing Escherichia coli based on genes that code for serogroup-specific O-antigens and major virulence factors in cattle feces. Foodborne Pathog. Dis. 2012, 9, 541–548. [Google Scholar] [CrossRef] [PubMed]
- Conrad, C.C.; Stanford, K.; McAllister, T.A.; Thomas, J.; Reuter, T. Further development of sample preparation and detection methods for O157 and the top 6 non-O157 STEC serogroups in cattle feces. J. Microbiol. Methods 2014, 105, 22–30. [Google Scholar] [CrossRef] [PubMed]
- Goji, N.; Mathews, A.; Huszczynski, G.; Laing, C.R.; Gannon, V.P.J.; Graham, M.R.; Amoako, K.K. A new pyrosequencing assay for rapid detection and genotyping of Shiga toxin, intimin and O157-specific rfbE genes of Escherichia coli. J. Microbiol. Meth. 2015, 109, 167–179. [Google Scholar] [CrossRef] [PubMed]
- Ziebell, K.A.; Read, S.C.; Johnson, R.P.; Gyles, C.L. Evaluation of PCR and PCR-RFLP protocols for identifying Shiga toxins. Res. Microbiol. 2002, 153, 289–300. [Google Scholar] [CrossRef]
- Wells, J.G.; Davis, B.; Wachsmuth, K.; Riley, L.W.; Remis, R.; Sokolow, R.; Morris, G.K. Laboratory investigation of hemorrhagic colitis outbreaks associated with a rare Escherichia coli serotype. J. Clin. Microbiol. 1983, 18, 512–520. [Google Scholar] [PubMed]
- DeBroy, C.; Frantamico, P.M.; Roberts, E.; Davis, M.A.; Liu, Y. Development of PCR assays targeting genesin O-antigen gene clusters for detection and identification of Escherichia coli O45 and O55 serogroups. Appl. Environ. Microbiol. 2005, 71, 4919–4924. [Google Scholar] [CrossRef] [PubMed]
- Frantamico, P.M.; Debroy, C.; Liu, Y.; Needleman, D.S.; Barazoni, G.M.; Feng, P. Advances in molecular serotyping and subtyping Escherichia coli. Front. Microbiol. 2016, 7, 644. [Google Scholar] [CrossRef]
- DeBroy, C.; Fratamico, P.M.; Yan, X.; Baranzoni, G.M.; Liu, Y.; Needleman, D.S.; Tebbs, R.; O’Connell, C.D.; Allred, A.; Swimley, M.; et al. Comparison of O-antigen gene clusters of all O-serogroups of Escherichia coli and proposal for adopting a new nomenclature for O-typing. PLoS ONE 2016, 11, e0147434. [Google Scholar]
- Shridhar, P.B.; Noll, L.W.; Shi, X.; Cernicchiaro, N.; Renter, D.G.; Bai, J.; Nagaraja, T.G. Escherichia coli O104 in feedlot cattle feces: Prevalence, isolation and characterization. PLoS ONE 2016, 11, e0152101. [Google Scholar] [CrossRef] [PubMed]
- Duda, K.A.; Linder, B.; Brade, H.; Leimback, A.; Brzuskiewicz, E.; Dobindt, U.; Holst, O. The lipopolysaccharide of the mastitis isolate Escherichia coli strain 1303 comprises a novel O antigen and the rare K-12 core type. Microbiology 2011, 157, 1750–1760. [Google Scholar] [CrossRef] [PubMed]
- Joris, M.A.; Verstraete, K.; De Reu, K.; De Zutter, L. Loss of vtx genes after the first sub-cultivation step of verocytoxigenic Escherichia coli O157 and non-O157 during isolation from naturally contaminated fecal samples. Toxins 2011, 3, 672–677. [Google Scholar] [CrossRef] [PubMed]
- Loftsdottir, H.; Soderlund, R.; Jinnerot, T.; Eriksson, E.; Bongcam-Rudolff, E.; Aspan, A. Dynamics of insertion sequence element IS629 inactivation of verotoxin 2 genes in Escherichia coli O157:H7. FEMS Microbiol. Lett. 2017, 364. [Google Scholar] [CrossRef] [PubMed]
- Quiros, P.; Martinez-Castillo, A.; Muniesa, M. Improving detection of Shiga toxin-producing Escherichia coli by molecular methods by reducing the interferences of free Shiga toxin-encoding bacteriophages. Appl. Environ. Microbiol. 2015, 81, 415–421. [Google Scholar] [CrossRef] [PubMed]
- Stanford, K.; Johnson, R.P.; Alexander, T.; McAllister, T.; Reuter, T. Influence of season and feedlot location on prevalence and virulence of Escherichia coli from feces of western Canadian slaughter cattle. PLoS ONE 2016, 11. [Google Scholar] [CrossRef] [PubMed]
- Ribot, E.M.; Fair, M.A.; Gautom, R.; Cameron, D.N.; Hunter, S.B.; Swaminathan, B.; Barrett, T.J. Standardization of pulsed-field gel electrophoresis protocols for the subtyping of Escherichia coli O157:H7, Salmonella and Shigella for PulseNet. Foodborne Pathog. Dis. 2006, 3, 59–66. [Google Scholar] [CrossRef] [PubMed]
- Scheutz, F.; Beutin, L.; Pierard, D.; Buvens, G.; Karch, H.; Mellmann, A.; Caprioli, A.; Tozzoli, R.; Morabito, S.; Strockbine, N.A.; et al. Multicenter evaluation of a sequence-based protocol for subtyping Shiga toxins and standardizing Stx nomenclature. J. Clin. Microbiol. 2012, 50, 2951–2963. [Google Scholar] [CrossRef] [PubMed]
- Iguchi, A.; Iyoda, S.; Kikuchi, T.; Ogura, Y.; Katsura, K.; Ohnishi, M.; Hayashi, T.; Thomson, N.R. A complete view of the genetic diversity of the Escherichia coli O-antigen biosynthesis gene cluster. DNA Res. 2015, 22, 101–107. [Google Scholar] [CrossRef] [PubMed]
- Geue, L.; Scgares, S.; Mintel, B.; Conraths, F.J.; Muller, E.; Ehricht, R. Rapid microarray-based genotyping of Escherichia coli serotype O156:H25/H-/Hnt isolates from cattle and clonal relationship analysis. Appl. Environ. Microbiol. 2010, 76, 5510–5519. [Google Scholar] [CrossRef] [PubMed]
- Kerr, P.; Ball, H.; China, B.; Mainil, J.; Finlay, D.; Pollock, D.; Wilson, I.; Mackie, D. Use of a monoclonal antibody against an Escherichia coli O26 surface protein for detection of enteropathogenic and enterohemorrhagic strains. Clin. Diagn. Lab. Immunol. 1999, 6, 610–614. [Google Scholar] [PubMed]
- Yonekita, T.; Fukimura, T.; Morishita, N.; Matsumoto, T.; Morimatsu, F. Simple, rapid and reliable detection of Escherichia coli O26 using immunochromatography. J. Food Prot. 2013, 76, 748–754. [Google Scholar] [CrossRef] [PubMed]
- Delannoy, S.; Beutin, L.; Fach, P. Use of clustered regularly interspaced short palindromic repeat sequence polymorphisms for specific detection of enterohemorrhagic Escherichia coli strains of serotypes O26:H11, O45:H2, O103:H2, O111:H8, O121:H19, O145:H28 and O157:H7 by real-time PCR. J. Clin. Microbiol. 2012, 50, 4035–4040. [Google Scholar] [CrossRef] [PubMed]
- Jacob, M.E.; Almes, K.M.; Shi, X.; Sargeant, J.M.; Nagaraja, T.G. Escherichia coli O157:H7 genetic diversity in bovine fecal samples. J. Food Prot. 2011, 74, 1186–1188. [Google Scholar] [CrossRef] [PubMed]
- Strachan, N.J.C.; Rotariu, O.; Lopes, B.; MacRae, M.; Fairly, S.; Laing, C.; Gannon, V.; Allison, L.J.; Hanson, M.F.; Dallman, T.; et al. Whole genome sequencing demonstrates that geographic variation of Escherichia coli O157 genotypes dominates host association. Sci. Rep. 2015, 5, 14145. [Google Scholar] [CrossRef] [PubMed]
- Dewsbury, D.M.; Renter, D.G.; Shridhar, P.B.; Noll, L.W.; Shi, X.; Nagaraja, T.G. Summer and winter prevalence of Shiga toxin-producing Escherichia coli (STEC) O26, O45, O103, O111, O121, O145 and O157 in feces of feedlot cattle. Foodborne Pathog. Dis. 2015, 12, 726–732. [Google Scholar] [CrossRef] [PubMed]
- Beutin, L.; Kaulfuss, S.; Herold, S.; Oswald, E.; Schmidt, H. Generic analysis of enteropathogenic and enterohemorrhagic Escherichia coli serogroup O103 strains by molecular typing of virulence and housekeeping genes and pulsed-field gel electrophoresis. J. Clin. Microbiol. 2005, 43, 1552–1563. [Google Scholar] [CrossRef] [PubMed]
- Seske, C.; Sunde, M.; Hopp, P.; Brulheim, T.; Sewornu Cudjoe, K.; Kvitle, B.; Urdahl, A.M. Occurrence of potentially human-pathogenic Escherichia coli O103 in Norwegian sheep. Appl. Environ. Microbiol. 2013, 79, 7502–7509. [Google Scholar]
- Eichhorn, H.; Heidemanns, K.; Semmler, T.; Kinnemann, B.; Mellmann, A.; Harmsen, D.; Anjum, M.; Schmidt, H.; Fruth, A.; Valentin-Weigand, P.; et al. Highly virulent non-O157 enterohemorrhagic Escherichia coli (EHEC) serotypes reflect similar phylogenetic lineages, providing new insights into the evolution of EHEC. Appl. Environ. Microbiol. 2015, 81, 7041–7047. [Google Scholar] [CrossRef] [PubMed]
- Beutin, L.; Delannoy, S.; Fach, P. Genetic diversity of the fliC genes encoding the flagellar antigen H19 or Escherichia coli and applications to the specific identification of enterohemorrhagic E. coli O121:H19. Appl. Environ. Microbiol. 2015, 81, 4224–4230. [Google Scholar] [CrossRef] [PubMed]
- Cooper, K.K.; Mandrell, R.E.; Louie, J.W.; Korlach, J.; Clark, T.A.; Parker, C.T.; Huynh, S.; Chain, P.S.; Ahmen, S.; Carter, M.Q. Comparative genomics of enterohemorrhagic Escherichia coli O145:H28 demonstrates a common evolutionary lineage with Escherichia coli O157:H7. BMC Genom. 2014, 15, 17. [Google Scholar] [CrossRef] [PubMed]
- Delannoy, S.; Mariani-Kurkdjian, P.; Bonacorsi, S.; Liguori, S.; Fach, P. Characteristics of emerging human pathogenic Escherichia coli O26:H11 strains isolated in France between 2010 and 2013 and carrying the stx2d gene only. J. Clin. Microbiol. 2015, 53, 486–492. [Google Scholar] [CrossRef] [PubMed]
- Feng, P.; Fields, P.I.; Swaminathan, B.; Whittam, T.S. Characterization of non-motile variants of Escherichia coli O157 and other serotypes by using an antiflagellin monoclonal antibody. J. Clin. Microbiol. 1996, 34, 2856–2859. [Google Scholar] [PubMed]
- Tominaga, A.M.; Mahmoud, A.-H.; Mukaihara, T.; Enomoto, M. Molecular characterization of intact, but cryptic flagellin genes in the genus Shigella. Mol. Microbiol. 1994, 12, 277–285. [Google Scholar] [CrossRef] [PubMed]
- Conrad, C.C.; Stanford, K.; McAllister, T.A.; Thomas, J.; Reuter, T. Competition during enrichment of pathogenic Escherichia coli may result in culture bias. Facets 2016, 1, 114–126. [Google Scholar] [CrossRef]
- Booth, C.S.; Pienaar, E.; Termaat, J.R.; Whitney, S.E.; Louw, T.M.; Viljoen, H.J. Efficiency of the polymerase chain reaction. Chem. Eng. Sci. 2010, 65, 4996–5006. [Google Scholar] [CrossRef] [PubMed]
- Ahmed, N.; Dobrindt, U.; Hacker, J.; Hasnain, S.E. Genomic fluidity and pathogenic bacteria: applications in diagnostics, epidemiology and intervention. Nat. Rev. Microbiol. 2008, 6, 387–394. [Google Scholar] [CrossRef] [PubMed]
- Shaikh, N.; Tarr, P.I. Escherichia coli O157:H7 Shiga toxin-encoding bacteriophages: integrations, excisions, truncations and evolutionary implications. J. Bacteriol. 2003, 189, 6645–6654. [Google Scholar]
- Mellmann, A.; Lu, S.; Karch, H.; Xu, J.-G.; Harmsen, D.; Schmidt, M.A.; Bielaszewska, M. Recycling of Shiga toxin 2 genes in sorbitol-fermenting enterohemorrhagic Escherichia coli O157:NM. Appl. Environ. Microbiol. 2008, 74, 67–72. [Google Scholar] [CrossRef] [PubMed]
- Liao, Y.-T.; Qintela, I.A.; Nguyen, K.; Salvador, A.; Cooley, M.B.; Wu, V.C.H. Investigation of prevalence offree Shiga-toxin producing Escherichia coli (STEC)-specific bacteriophages and its correlation with STEC bacterial hosts in a produce-growing area in Salinas California. PLoS ONE 2018, 13, e0190534. [Google Scholar] [CrossRef] [PubMed]
- Rooks, D.J.; Yan, Y.; McDonald, J.E.; Woodward, M.J.; McCarthy, A.J.; Alison, H.E. Development and validation of a qPCR-based method for quantifying Shiga toxin-encoding and other lambdoid bacteriophages. Environ. Microbiol. 2010, 12, 1194–1204. [Google Scholar] [CrossRef] [PubMed]
- Hartland, E.L.; Leong, J.M. Enteropathogenic and enterohemorrhagic E. coli: Ecology, pathogenesis, and evolution. Front. Cell. Infect. Microbiol. 2013, 3, 15. [Google Scholar] [CrossRef] [PubMed]
- Ferdous, M.; Zhou, K.; Mellmann, A.; Morabito, S.; Croughs, P.D.; de Boer, R.F.; Koolstra-Smid, A.M.D.; Rossen, J.W.A.; Friedrich, A.W. Is Shiga toxin-negative Escherichia coli O157:H7 enteropathogenic or enterohemorrhagic Escherichia coli? Comprehensive molecular analysis using whole-genome sequencing. J. Clin. Microbiol. 2015, 53, 3530–3538. [Google Scholar] [CrossRef] [PubMed]
- Liu, B.; Eydallin, G.; Maharajan, R.P.; Feng, L.; Wang, L.; Ferenci, T. Natural Escherichia coli isolates rapidly acquire genetic changes upon laboratory domestication. Microbiology 2017, 163, 22–30. [Google Scholar] [CrossRef] [PubMed]
- Toth, I.; Schmidt, H.; Kardos, G.; Lancz, Z.; Creuzburg, K.; Damjanova, I.; Paszti, J.; Beutin, L.; Nagy, B. Virulence genes and molecular typing of different groups of Escherichia coli O157 strains in cattle. Appl. Environ. Microbiol. 2009, 75, 6282–6291. [Google Scholar] [CrossRef] [PubMed]
- Sanjar, F.; Rusconi, B.; Hazen, T.H.; Koenig, S.S.K.; Hammel, M.K.; Feng, P.C.H.; Rasko, D.A.; Eppinger, M. Characterization of the pathogenome and phylogenomic classification of enteropathogenic Escherichia coli of the O157: Non-H7 serotypes. FEMS Pathog. Dis. 2015, 73. [Google Scholar] [CrossRef] [PubMed]
- Friedrich, A.W.; Bielaszewska, M.; Zhang, W.; Pulz, M.; Kuczius, T.; Ammon, A.; Karch, H. Escherichia coli harboring Shiga toxin 2 gene variants: Frequency and association with clinical symptoms. J. Infect. Dis. 2002, 185, 74–84. [Google Scholar] [CrossRef] [PubMed]
- Possé, B.; de Zutter, L.; Heyndrickx, M.; Herman, L. Quantitative isolation efficiency of O26, O103, O111, O145 and O157 STEC serotypes from artificially-contaminated food and cattle faeces samples using a new isolation protocol. J. Appl. Microbiol. 2008, 105, 227–235. [Google Scholar] [CrossRef] [PubMed]
- Schmidt, H.; Bielaszewska, M.; Karch, H. Transduction of enteric Escherichia coli isolates with a derivative of Shiga toxin 2-encoding bacteriophage φ3538 isolated from Escherichia coli O157:H7. Appl. Environ. Microbiol. 1999, 65, 3855–3861. [Google Scholar] [PubMed]
- Stromberg, Z.R.; Lewis, G.L.; Moxley, R.A. Comparison of agar media for detection and quantification of Shiga toxin-producing Escherichia coli from cattle feces. J. Food Prot. 2016, 79, 939–949. [Google Scholar] [CrossRef] [PubMed]
- Creuzburg, K.; Kohler, B.; Hempel, H.; Schreier, P.; Jacobs, E.; Schmidt, H. Genetic structure and chromosomal integration site of the cryptic prophage CP-1639 encoding Shiga toxin 1. Microbiology 2005, 151, 941–950. [Google Scholar] [CrossRef] [PubMed]
- Asadulghani, M.; Ogura, Y.; Ooka, T.; Itoh, T.; Sawaguchi, A.; Iguchi, A.; Nakayama, K.; Hatashi, T. The defective prophage pool of Escherichia coli O157: Prophage-prophage interactions potentiate horizontal transfer of virulence determinants. PLoS Pathog. 2009, 5, e10000408. [Google Scholar] [CrossRef] [PubMed]
- Watahiki, M.; Isobe, J.; Limata, K.; Shima, T.; Kanatani, J.; Shimizzu, M.; Nagata, A.; Kawakami, K.; Yamada, M.; Izumiya, H.; et al. Characterization of enterohemorrhagic Escherichia coli O111 and O157 strains isolated from outbreak patients in Japan. J. Clin. Microbiol. 2014, 52, 2757–2763. [Google Scholar] [CrossRef] [PubMed]
- Morton, V.; Cheng, J.M.; Sharma, D.; Kearney, A. Notes from the field: an outbreak of Shiga-toxin producing Escherichia coli infections associated with flour, Canada 2016–2017. MMWR Morb. Mortal. Wkly. Rep. 2017, 66, 705–706. [Google Scholar] [CrossRef] [PubMed]


© 2018 by the authors. Licensee MDPI, Basel, Switzerland. This article is an open access article distributed under the terms and conditions of the Creative Commons Attribution (CC BY) license (http://creativecommons.org/licenses/by/4.0/).